Article

Red Grouper (Epinephelus morio) Shape Faunal Communities via Multiple Ecological Pathways

Florida Fish and Wildlife Conservation Commission, Fish and Wildlife Research Institute, St. Petersburg, FL 33705, USA
Diversity 2019, 11(6), 89; https://doi.org/10.3390/d11060089
Submission received: 4 April 2019 / Revised: 31 May 2019 / Accepted: 4 June 2019 / Published: 6 June 2019
(This article belongs to the Special Issue Diversity of Ecosystem Engineers in the World Coasts and Oceans)

Abstract

:
Organisms that modify the availability of abiotic resources for other species can alter the structure and function of ecological communities through multiple pathways. In Florida Bay, red grouper (Epinephelus morio) engineer habitats by excavating sediment and detritus from karst solution holes and are also predators that consume a variety of benthic crustaceans and fish, some of which colonize engineered habitats. The effect of red grouper on these communities is complex as colonizing species interact with red grouper in different ways, including both direct (e.g., predator–prey) and indirect interactions. Here, I present the results of an experiment designed to test the direct effects of red grouper on faunal communities associated with Florida Bay solution holes by excluding red grouper from solution holes for four weeks. Red grouper presence generally had positive effects on the abundance, richness, and diversity of faunal communities associated with engineered habitats. Few strong interactions were observed between red grouper and colonizing species, mainly juvenile coral reef fishes. These results suggest that by acting as both a predator and habitat engineer, red grouper shape unique communities, distinct from those of surrounding areas, and influence the composition of communities associated with manipulated habitats.

Graphical Abstract

1. Introduction

Habitat-modifying species generally have positive effects on the diversity of the biotic communities that are associated with those habitats [1,2]. This is true for those species that create habitat as a function of their presence (foundation species or autogenic ecosystem engineers), and for species that modify habitats mechanically (allogenic ecosystem engineers) [3,4]. Often, the net positive effect of habitat engineers on local species diversity accrues through changes in habitat availability, where engineers create or modify habitat, allowing more species to persist in a given area [1]. Because species diversity is strongly associated with community and ecosystem function, engineers that modify the availability of habitat for other species play critical roles in maintaining both the diversity and function of ecosystems [5,6,7]. The mechanisms by which habitat engineers affect local species diversity are mainly indirect: The engineer species modifies a habitat for its own purposes and in the process indirectly alters the availability and types of resources for other species. Many engineer species, both terrestrial and marine, are known to modify habitats by digging pits or burrows which are used by other species. On land, gopher tortoises (Gopherus polyphemus), native to xeric habitats in the southeastern US, dig burrows that function as shelter for at least 60 species of vertebrate and 300 species of invertebrate animals [8,9]. In the ocean, golden tilefish (Lopholatilus chamaeleonticeps) have been documented excavating burrows that are colonized by other fishes and crustaceans [10].
Conversely, predatory fish generally have negative effects on the local species diversity of biotic communities [11,12,13,14]. These effects can be particularly strong on young fishes that have recently settled to benthic habitats following their larval planktonic stage, usually referred to as recruits, and that are highly vulnerable to predation immediately following settlement [15,16]. Fish predators can also have negative effects on the abundance and diversity of benthic invertebrate prey [14,17]. The negative direct effects of marine fish predators on species diversity are in turn modified by those factors that alter the density of prey, such as habitat complexity [18,19], or that alter the density of predators, such as fishing [20,21]. In contrast, some marine predators can have positive indirect effects on the local species diversity of biotic communities. Classic examples include the ochre sea star (Pisaster ochraceus) and the sea otter (Enhydra lutris), both of which enhance species diversity through predation. In rocky intertidal systems, predation by P. ochraceus reduces the density of a competitively dominant mussel (Mytilus californianus), thereby reducing competition for space and allowing for a more species-rich assemblage of intertidal settlers [22,23]. In kelp forest communities in the northeastern Pacific, predation by sea otters on urchins (Strongylocentrotus polyacanthus and S. franciscanus) reduces herbivory on macroalgae that create important shelter, substrate, and food sources for the species-rich kelp forest community [24,25,26]. In both examples, the positive effects of the predator accrued via indirect species interactions between the predator and the biotic community. Removal of the predator resulted in altered biotic communities at a scale beyond what was predicted based solely on the abundance of the predator; when keystone predators recolonized the area, the ecosystem reverted to its initial state [27].
Species play multiple roles within ecosystems, and a species that both engineers habitat and also predates upon colonizers of those habitats would advance the understanding of how ecological engineers affect ecosystems. One such species, the red grouper (Epinephelus morio), is a large-bodied predatory fish that modifies habitat by excavating sediment and is also a predator that consumes some of the individuals that colonize modified habitats [28,29]. Because they act as both habitat engineers and predators, the cumulative effects of red grouper on the ecosystem diversity and function will be complex as they interact with species in different ways. In Florida Bay, the benthic habitat is comprised of mostly seagrasses with occasional patches of exposed karst limestone pockmarked with complex sub-benthic crevices known as solution holes. Red grouper excavate sediment and detritus from these solution holes, thereby increasing the amount of habitat available to itself and other organisms [28]. Florida Bay solution holes may be particularly important for some species like the Caribbean spiny lobster (Panulirus argus) that use crevice shelters as daytime refuge [30]. Diet studies of red grouper have consistently found that about 80% of stomach contents consisted of decapod crustaceans, with cephalopods, amphipods, stomatopods, and demersal fishes (e.g., toadfishes, gobies, blennies, and cardinalfishes) making up the remaining 20% [31,32,33,34,35,36]. Some species commonly found in Florida Bay solution holes are also preyed upon by red grouper, including Caribbean spiny lobsters, majid crabs (Mithrax spp.), and toadfish (Opsanus spp.) [29].
A previous study of Florida Bay solution holes found that the abundance of fishes was greater in solution holes occupied by red grouper, and these communities were more species rich compared to those found in surrounding habitats [28]. This pattern could result from facilitative species interactions, such as those mediated by changes in resources (e.g., habitat availability), or through behaviorally-mediated indirect interactions (BMIIs), each of which are known to enhance local species diversity [2,21,37,38]. Red grouper are generally solitary and often display aggressive territorial behaviors toward conspecifics and other large-bodied fishes near solution holes, which may potentially disrupt the predation ability of colonizing predators [39,40]. Thus, red grouper can affect individual species within solution-hole-associated communities via habitat manipulation, predation, or by altering the behaviors of predatory colonizers. The enhancing effect of red grouper on local species diversity found previously suggests that, at the community-level, facultative species interactions (including via habitat modification) between red grouper and solution-hole-associated communities may outweigh the direct effects of red grouper predation. The importance of each interaction type will vary by species, as those species affected by changes in habitat availability will likely differ from those affected by predation from red grouper.
The effort to disentangle the various pathways by which species colonizing solution holes interact with red grouper will require a combination of observational and manipulative experiments. The primary goal of this study was to investigate the direct effects of red grouper on the faunal communities associated with excavated solution holes in Florida Bay by measuring the effects of red grouper presence at the community, functional group, and individual species levels. By assuming that the effects of red grouper as habitat engineer versus predator on solution hole faunal communities will occur over different time scales, a short-term manipulative experiment allowed me to isolate the direct effects of red grouper predation and agonistic behaviors on communities from the indirect effects that occur via changes in habitat availability. Red grouper were experimentally excluded from some solution holes to estimate the direct effects of red grouper presence on biotic communities over a period of days to weeks. These results were then compared to those from a multi-year observational study of solution hole habitats that was conducted concurrently and that estimated the cumulative effects of red grouper habitat manipulation on solution-hole-associated communities [29]. By comparing the results of the short-term experiment with a longer-term observational study, my goal is to more fully describe the role of red grouper in shaping these communities and to measure the various interactions that occur between red grouper and species that colonize modified solution holes.

2. Materials and Methods

2.1. Experimental Design

During the summers of 2011 and 2012, the effect of red grouper presence was tested on faunal communities associated with solution holes located in southwestern Florida Bay (Figure 1). A total of 24 solution holes were used across the two years. All solution holes used in the study were in water less than 4 m in depth (range = 2.4 to 3.7 m depth). This part of Florida Bay is characterized by patches of seagrasses, mainly Thalassia testudinum and Syringodium filiforme, interspersed with areas of exposed limestone hardbottom that is colonized by sponges and corals and pockmarked by solution holes. The solution holes surveyed for this study varied in areal size from 1.69 to 6.99 m2 (mean solution hole area ± standard error (SE) = 4.44 ± 0.37). Most holes had multiple openings with one or few deeper parts that were excavated by the red grouper. The maximum excavated depth of the solution holes surveyed for this study ranged from 26 to 77 cm deep (mean excavated depth ± SE = 45.8 ± 2.70). Prior to the start of the experiment in each year, a total of 35 solution holes were surveyed to determine occupancy by red grouper: In 2011, 26 of the 35 holes were occupied by a red grouper; in 2012, red grouper occupied 24 of the 35 holes. I randomly selected 14 sites with red grouper in 2011 and 18 sites with red grouper in 2012 to be used as experimental treatment sites and assigned half of each to one of two groups: red grouper present (control treatment), and red grouper removed (exclusion treatment). Only 14 solution holes were used in 2011 due to concerns about the amount of time needed to survey all holes; additional holes were added in 2012 to maximize the experimental sample size given our surveying ability. The total sample size for each group (control and exclusion) summed across both years was 16. In 2011 the experiment was initiated during the last week of May; in 2012 the experiment was initiated during the second week in June. Red grouper that were occupying holes chosen for the exclusion treatment were captured using hook-and-line fishing gear or fish traps and were measured, tagged, and released in empty solution holes located more than 5 km from the experimental site. All solution holes were checked at least once per every 48 h to ensure that no other red groupers had moved into the hole; if a new red grouper was present, it was captured, measured, tagged, and transported to a new site as above.
Divers trained in fish and invertebrate identification surveyed the faunal communities associated with solution holes once per week for four weeks. At each solution hole, a team of two scuba divers conducted a census of all fishes and motile invertebrates found within, in the water-column immediately above, and in a 1 m band around each hole. Fishes were counted using the point-count method, where each diver remained stationary and counted all observable individuals (mean visual survey duration = 12 min; range = 5 to 18 min). Cryptic fish species and motile macroinvertebrates were counted by examining inside all areas of the solution hole after the point-count survey was completed. Both divers counted all species present and the abundance of each species was determined as the maximum number of individuals observed by a single diver. Total species richness was determined as the sum of all species observed by both divers. All organisms were identified to species with two exceptions: juvenile grunts (Haemulon spp.) estimated to be < 5 cm total length (TL) and peppermint shrimp (Lysmata spp.). For both grunts and peppermint shrimp, multiple closely-related species appear very similar so that positive identification at the species level was impossible during diver surveys. At least six species of larger juvenile and sub-adult grunts were observed during the study, all of which are virtually identical to each other until they grow larger than ~5 cm TL, after which they develop distinguishing coloration. The peppermint shrimp species complex is composed of at least five closely-related species that may co-occur in Florida Bay, all of which have color patterns that were indistinguishable while scuba diving [41]. A complete set of visual surveys at all control and treatment holes generally took two days, where half of the holes were visited on one day and the other half on the next day. Red grouper occupancy at a given solution hole was determined by the positive identification of an individual within a solution hole during a diver survey, and both divers took care to closely observe all parts of the solution hole to determine if a red grouper was present during the survey.

2.2. Statistical Analysis
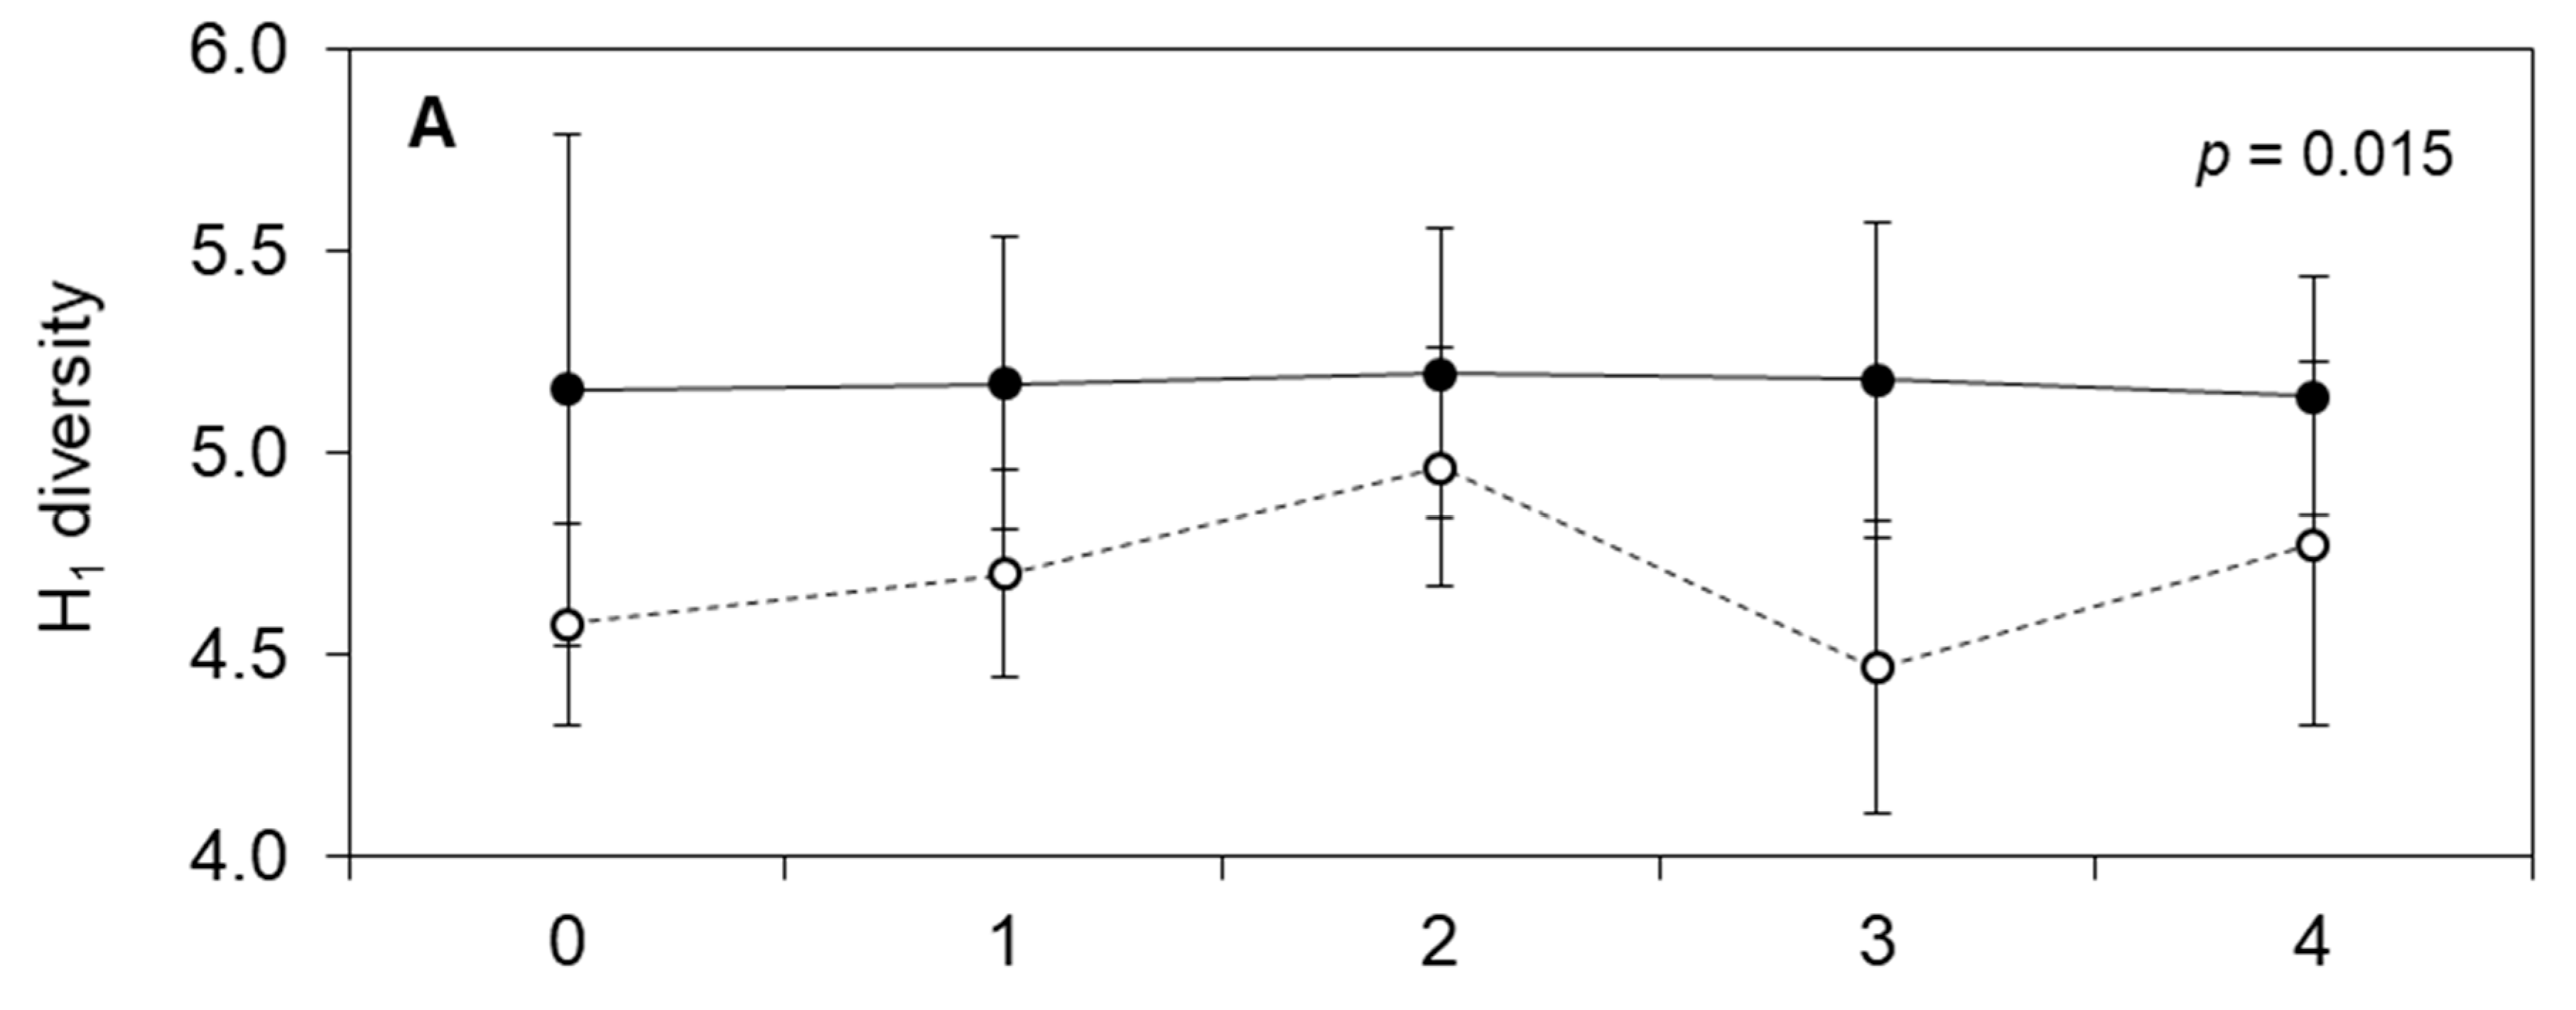
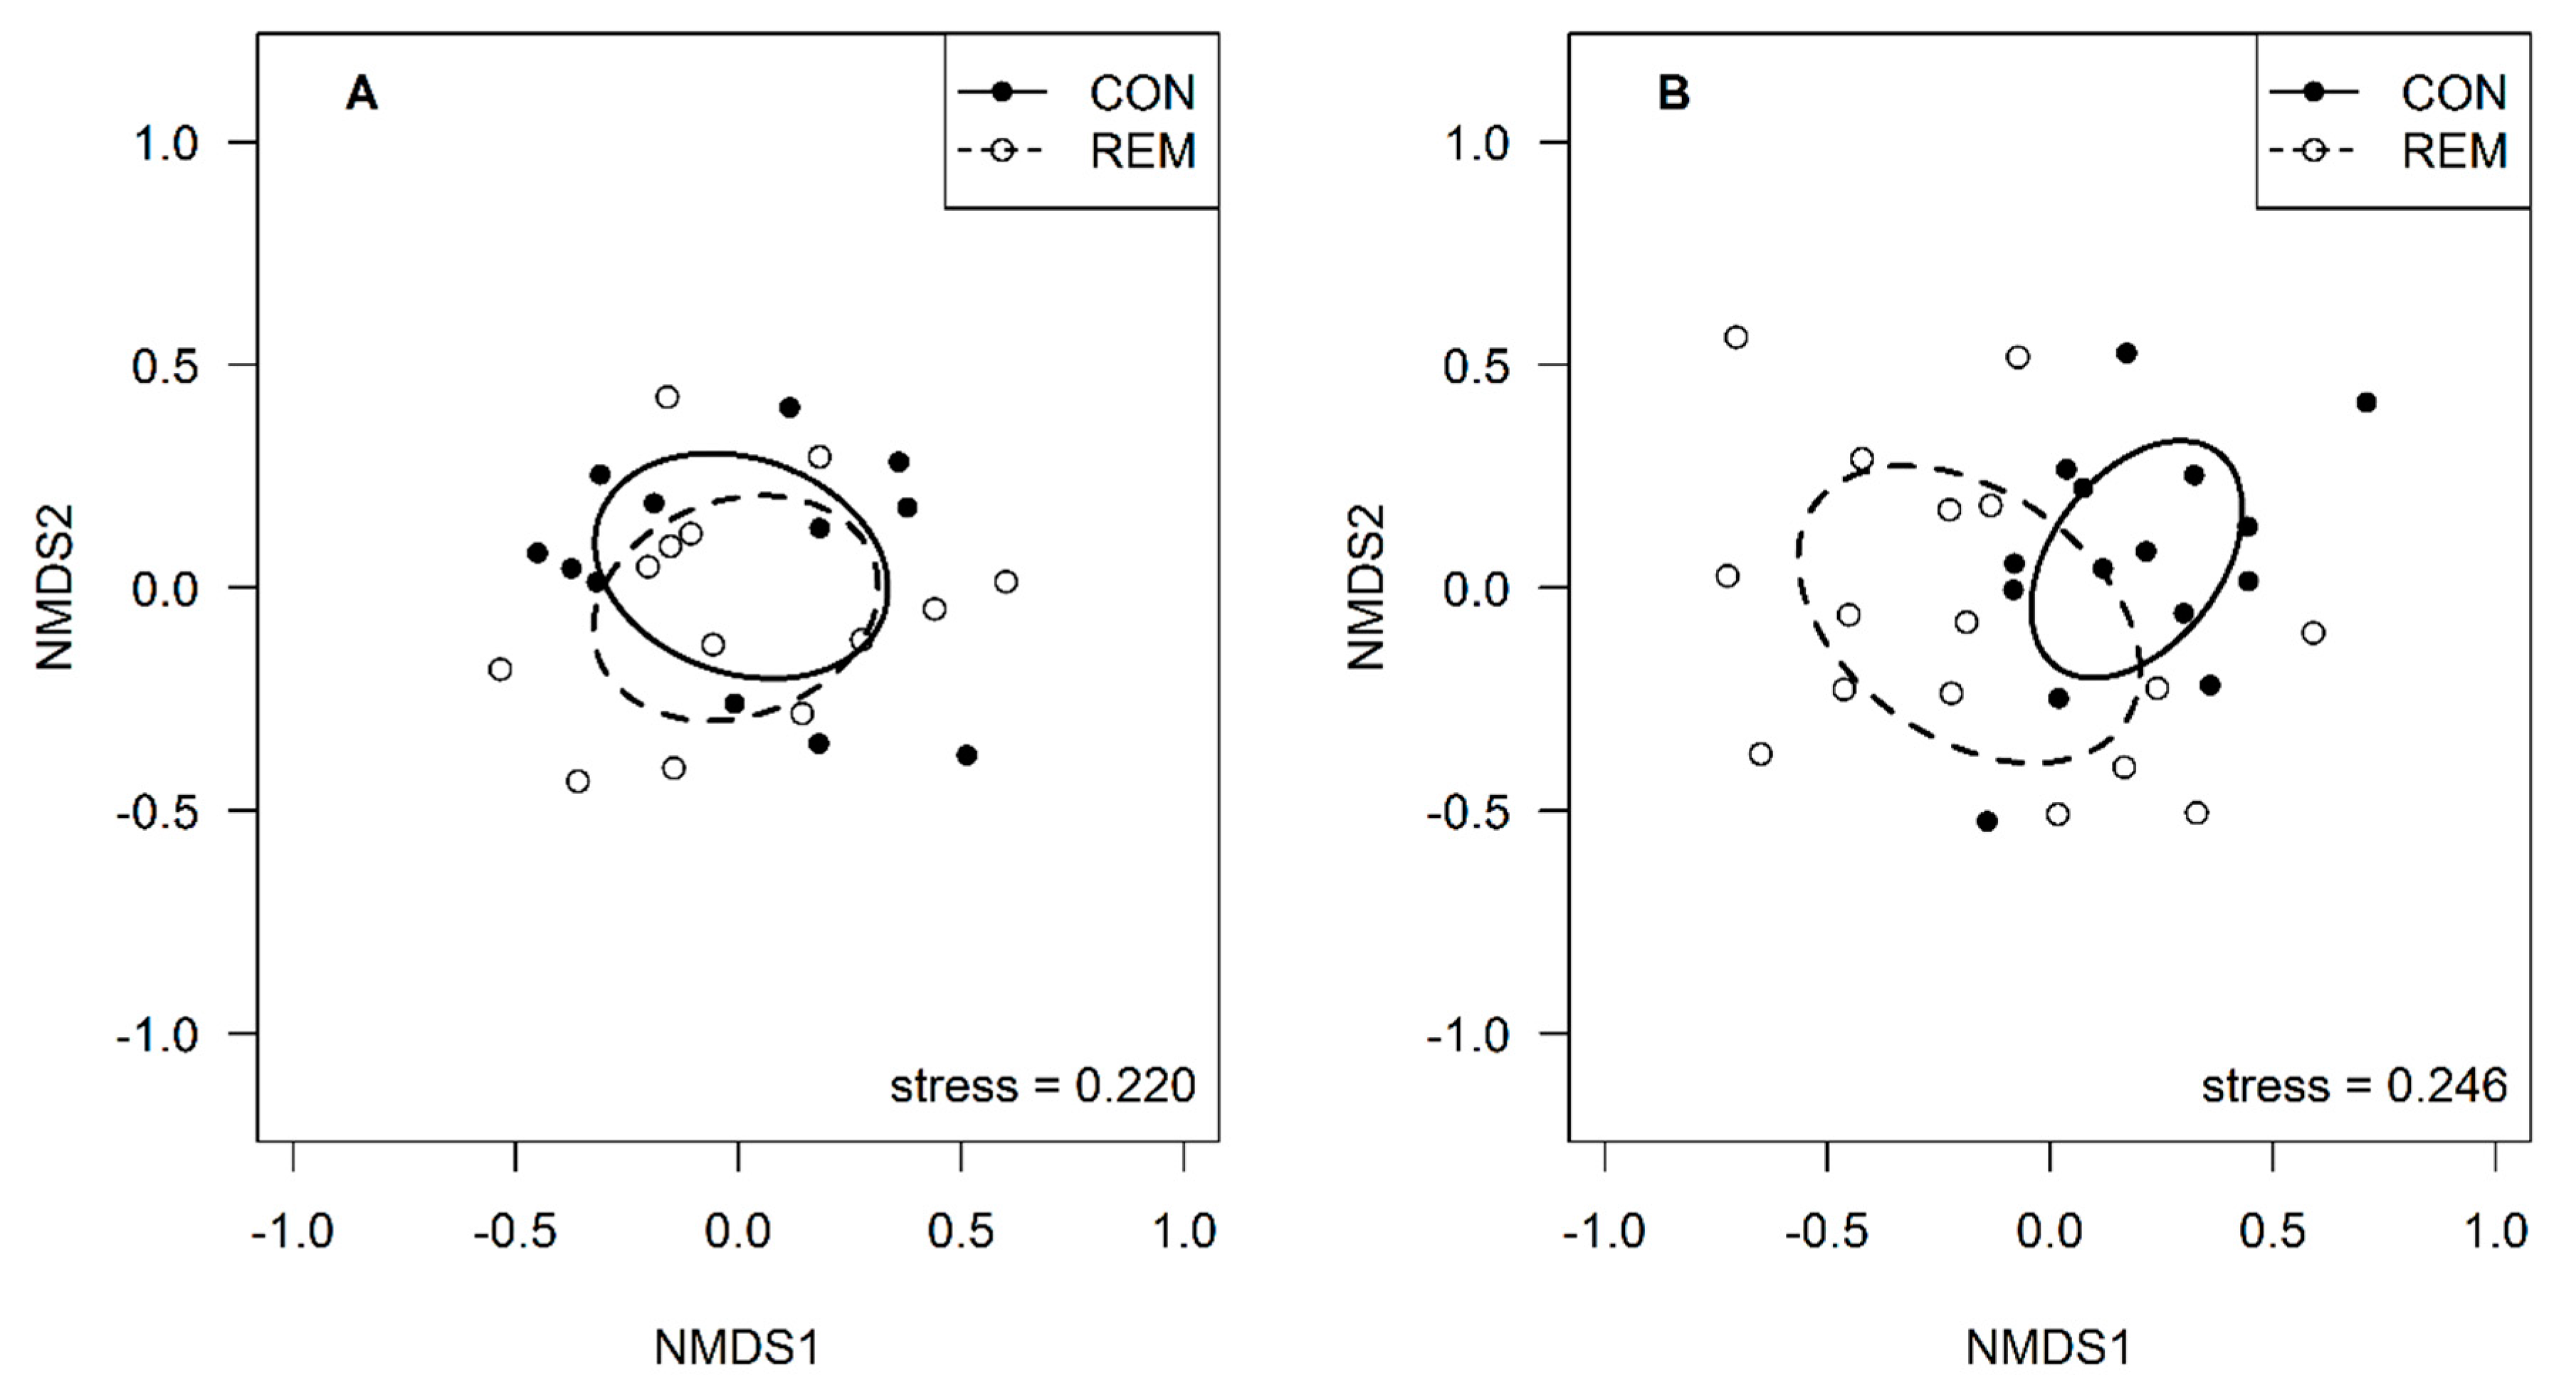
In addition to the total abundance of all fishes and motile invertebrates present at each solution hole, I calculated diversity metrics based on Hill’s numbers for each community observation using the equation:
H a = ( i = 1 s p i a ) 1 1 a
where pi is the relative proportion of the community made up by species i [42]. When evaluated for integer values for a of 0, 1, and 2, Ha reduces to species richness, the antilog of the Shannon–Weiner index, and the reciprocal of Simpson’s index, respectfully. Generally, as a increases from 0 to 2, the Hill’s index gives greater weight to more abundant species. I also calculated evenness using the equation:
E = H2/H1
which is the ratio of the Simpson’s reciprocal and the Shannon–Weiner antilog. Evenness represents a measure of the distribution of the abundances of each species in a community, and Hill initially proposed this version of evenness because it does not include species richness (H0), thus is relatively insensitive to sample size [43]. This version of evenness converges to 1 when all species are equally abundant, and smaller values indicate more uneven communities. I included Hill’s evenness here because the specific ways that red grouper may alter faunal communities are complex, so including multiple diversity indices should give enough variety of metrics to evaluate changes in faunal communities that could be attributed to red grouper. Because red grouper presence was the treatment variable, they were not included as a species when calculating community metrics.
I tested for differences in each of the five biotic community metrics—total faunal abundance, Hill’s numbers 0 to 2, and Hill’s evenness—based on red grouper presence and time from experiment start using two-way repeated measures analysis of variance (ANOVA). Species abundances were square-root transformed to conform to assumptions of normality for ANOVA tests. I tested for differences in community structure attributable to red grouper presence with permutational multivariate analysis of variance (PERMANOVA), which is similar to traditional multivariate analysis of variance but does not require that data conform to multivariate normal distributions [19]. To quantify the contribution of individual species in driving differences in the structure of communities with and without red grouper, a similarity percentage analysis (SIMPER) was performed using the abundance of each species present at the end of the experiment. To visualize patterns of community structure between solution hole communities at the start and end of the experiment, I used non-metric multi-dimensional scaling (NMDS; [44]) to ordinate the data. All NMDS ordinations were performed using raw abundance data and the default options set by the “metaMDS” function of the “vegan” R package [45].
The strength of species interactions between red grouper and solution-hole-associated fauna was measured with Paine’s index (PI; [46]). This interaction index calculates the per capita interaction strength for all species using the equation:
PIi = (NiDi)/(Di Y)
for each species i, where N is the mean prey abundance in the presence of a predator, D is prey abundance in the absence of a predator, and Y is a measure of predator abundance [47]. Since red grouper are generally solitary and were never observed together in holes during this experiment, Y = 1 for all replicates. Paine’s index was initially derived to quantify the effect of a consumer when the absence of said consumer resulted in a monoculture of the competitive dominant prey but has since been used to quantify the distribution of per capita effects among community members [47]. I used it here to determine the distribution of interaction strengths within the community and to identify which species have strong interactions with red grouper. I followed the methods described in Paine [46] where PI values for each species are estimated using experimental replicates for N and a mean value for D, then constructing bootstrapped confidence intervals, given that the relatively small sample size used here may underestimate the variability in D estimate. Bootstrapped 95% confidence intervals were calculated using the “resample” package in R [48].
Finally, to estimate the effect of red grouper presence on different functional groups of organisms, I calculated standardized effect sizes using Hedge’s g with the equation
g = (mwithmwithout)/spooled
where mwith is the mean group abundance with red grouper, mwithout is the mean group abundance without red grouper, and spooled is the pooled within-group variance [49,50]. The use of standardized effect scores has previously been used to compare across studies that use different methodologies or that study different organisms [50,51]. For this study, I wanted a way to compare the effect of red grouper on the various functional groups present in experimental communities, and to compare between these experimental results and those from a multi-year observational study that was conducted concurrently at alternate sites in Florida Bay (see [29]). Faunal abundance data were not normally distributed, so bootstrapping was used to nonparametrically estimate effect sizes and confidence intervals. Functional groups were constructed for diet and habitat preference. Diet groups were based on reported diets from Fishbase and included two groups of predators—piscivores and invertivores (fishes known to consume mostly motile invertebrates)—plus benthivores (fishes known to consume mostly benthic prey), planktivores, and herbivores ([52]; see Table A1). Habitat preferences were based upon where fish species were observed relative to solution holes: Species that were always found inside holes (“demersal”), species found milling about above or adjacent to holes (“water-column”), or species that only visited holes temporarily and were not observed milling about or are known to have a more pelagic life history (“transient”). Motile invertebrates were grouped based on whether they are known prey of red grouper or not (see Table A2). I also included a group of “cleaners”—organisms known to consume ectoparasites from other species—which included both fish and invertebrate species. Effect sizes and bootstrapped 95% confidence intervals were calculated using the “bootES” package in R [53].

3. Results

A total of 51 species were documented during the two years of red grouper exclusion experiments: 42 species of fish and nine species of motile macro-invertebrates (see Appendix A). Based on the repeated measures ANOVA analysis using both years (2011 and 2012) combined, red grouper presence had a significant positive effect on total abundance (F1,143 = 58.9; p = 0.003; Figure 2), species richness (H0: F1,143= 316.9, p < 0.001; Figure 2), and Shannon–Weiner diversity (H1: F1,143 = 9.47, p = 0.015; Figure 3), and a significant negative effect on Hill’s evenness (E: F1,143 = 0.0634, p < 0.001; Figure 3) after four weeks. Red grouper presence did not have a significant effect on Simpson’s diversity (H2: F1,143 = 0.903, p = 0.344; Figure 3). The interaction between red grouper presence and time was significant for species richness (F1,143 = 39.9, I = 0.0154), but not for total abundance (F1,143 = 22.78, p = 0.064). Time since the start of the experiment had a significant effect on total abundance (F1,143 = 34.3, p = 0.024) but not on Hill’s evenness (F1,143 = 0.015, p = 0.078).
Differences in community structure before and after the four-week exclusion experiments were visualized with NMDS plots, comparing communities found at control solution holes with red grouper to those found at exclusion holes without red grouper (Figure 4). The NMDS ordination of the faunal communities at the start of the experiment shows clear overlap between all solution holes prior to treatment assignments, which was confirmed by PERMANOVA analysis (Pseudo-F1,24 = 0.737, p = 0.599). Although the NMDS plot of faunal communities after four weeks appears to show separation between control and exclusion communities, PERMANOVA analysis results did not support a significant effect of red grouper presence on faunal community structure (Pseudo-F1,30 = 1.32, p = 0.233). However, year did have a significant effect on community structure (Pseudo-F1,30 = 8.39, p = 0.001), suggesting differences between communities between the two study years. SIMPER analysis results revealed the five most abundant species—small juvenile grunts, white grunts (Haemulon plumierii), Caribbean spiny lobster, French grunts (Haemulon flavolineatum), and Pederson’s cleaner shrimp (Ancylomenes pedersoni) accounted for 84.2% of the difference in community structure (Table 1). Of the top 20 species ranked by SIMPER contribution, only four species were less abundant in holes with red grouper compared to their abundance in the exclusion treatment holes—channel clinging crabs (Mithrax spinosissimus), gray angelfish (Pomacanthus arcuatus), spotted cleaner shrimp (Periclimenes yucatanicus), and sand perch (Diplectrum formosum)—the other 16 species were all more abundant in holes with red grouper.
The distribution of interaction strengths between red grouper and associated species varied based on the calculations of Paine’s index (PI) values for each species. Of the 51 species observed during the experiment, 28 species had non-zero PI values and 23 species had interaction strengths equal to zero, indicating that their abundance was not different between treatment groups (Figure 5). Bootstrapped means and their corresponding standard error values indicated that seven species or species complexes had PI values with 95% confidence intervals that did not include zero (Table 2): juvenile white grunts (PI ± SE: 4.97 ± 2.38), porkfish (Anisotremus virginicus; 0.36 ± 0.16), gray angelfish (−0.17 ± 0.063), hogfish (−0.033 ± 0.015), peppermint shrimp (−0.178 ± 0.069), sand perch (−0.211 ± 0.091), and spotted cleaner shrimp (−0.244 ± 0.079). Standardized effect size analysis of functional groups indicated significant positive effects of red grouper presence on the abundance of only the invertivore fish group (Table 3); the 95% confidence intervals of effect size on all other functional groups included zero, suggesting that red grouper did not have a significant effect on the abundance of these functional groups.
Across the two years of experiments, 21 red grouper colonized one of the exclusion holes following the removal of the initial individual (N2011 = 8; N2012 = 13). On average, empty holes were recolonized within a week (mean days to replacement ± SE = 6.62 ± 1.14). Red grouper that moved into empty solution holes were significantly smaller than the individual that was removed immediately prior, by approximately 4 cm (mean difference ± SE = −3.91 ± 1.39; T20 = −2.82, p = 0.011; Figure 6). Of the 21 total re-colonization events, nine were multiple re-colonization events where the removed red grouper was either the third or fourth individual to be removed from the hole during the experiment. Including the initial removals at the start of the experiments, the mean size of red grouper removed from solution holes was 45.4 cm TL (± SE = 1.25); the mean size of red grouper in control treatment holes was 48.3 cm TL (± SE = 1.75).

4. Discussion

Evaluating multiple community-level metrics indicated that red grouper presence resulted in higher abundance, species richness, and diversity of faunal communities associated with solution holes. These results generally match the predicted effects of a habitat engineer—communities with the engineer had more members and were more diverse compared to those where the engineer was excluded [1,2]. These results also confirm those of previous observational studies of Florida Bay solution holes that also found more abundant and species-rich communities in solution holes with red grouper [28,29]. While these patterns are consistent with the predicted effects of habitat engineers, they are contrary to the general effects expected of piscine predators that have been shown to reduce the species richness of prey communities through both selective and non-selective predation [12,15]. Instead, increased abundance and richness in the presence of a predator more closely resembles the effects of keystone predators that enhance diversity by limiting herbivory [22,25]. Red grouper have multiple roles in the ecosystem, acting as both habitat-engineer and predator in these communities and so they affect solution hole communities in multiple ways. By assuming that the indirect effects of red grouper on communities will manifest via changes in habitat availability (i.e., engineering effects) and thus over longer time scales (months to years), the results presented here from short-term (days to weeks) exclusion experiments isolate the direct effects of red grouper predation and agonistic behaviors on communities. Even at the short-time scale of these experiments, red grouper had positive effects on multiple community metrics, suggesting that their role as habitat engineer may be stronger than their effect as a predator.
At the community level, red grouper presence had a positive effect on abundance and richness but variable effects on diversity, as shown by the results of enhanced diversity on H1 (Shannon–Weiner) but no effect on H2 (Simpson’s) diversity, and depressed evenness (see Figure 3). Analyzing the same data with different Hill’s indices allows for the separation of the relative contributions of species within a single mathematical framework [54]. As the value of a increases (within Ha), more weight is given to abundant species, so here the effect of red grouper presence on faunal community diversity diminishes as abundant species are given more weight [42]. Similarly, Hill’s evenness (E) is the ratio of abundant species to common species and here was used as a metric to compare the structure of species assemblages across solution holes [55]. Higher species richness and lower evenness could both occur if both rare and common species increased relative to abundant ones in communities with red grouper. Again, this result runs counter to the predictions for piscine predators, which tend to reduce species richness while increasing the evenness of prey communities [12].
Somewhat surprisingly, red grouper did not show strong effects on the abundance of their prey, as measured at either the functional group and individual species levels. The prey group was dominated by Caribbean spiny lobsters, which were abundant in solution holes irrespective of the presence of red grouper. Red grouper are well-known predators of lobsters, and thus a strong, direct interaction with red grouper is not entirely unexpected [35,36]. However, the experimental evidence described here suggests this interaction is positive: spiny lobsters increased when in the presence of the red grouper, a result that is at odds with an assumed predator–prey dynamic. Spiny lobsters are primarily nocturnal and seek out crevice shelters during the day, and solution holes in Florida Bay are known to host lobsters in high abundance relative to surrounding habitats [34,56]. Through excavation, red grouper likely increase the availability of suitable habitat for spiny lobster, and the positive interaction measured here suggests that habitat availability may be more important than the increased risk of mortality that comes with cohabitating with a predator. Here, the results of this experiment included all spiny lobsters together, irrespective of their size, which could mask asymmetry in predation effects across lobster size. In 2013, I conducted additional experiments to test how the interaction between red grouper and Caribbean spiny lobsters changed across lobster ontogeny. These experiments revealed that predation by red grouper was strongest on small juvenile lobsters and decreased with increasing lobster size [57]. While the cumulative interaction between red grouper and all spiny lobsters was positive, this result was driven by the increased abundance of large juvenile and adult lobsters that overshadowed the decrease in small juveniles due to predation.
Effects of short-term red grouper exclusion at the functional group level were negligible. The only significant effect of red grouper on any functional group was on the invertebrate predators (see Table 3). However, the absolute number of invertivores encountered during the experiments totaled just three individuals across both years: one goliath grouper (Epinephelus itajara) and one green moray (Gymnothorax funebris) in 2011, and one green moray in 2012, all observed in control treatment holes with red grouper. No invertebrate predators were encountered in exclusion treatment holes in either year. Although goliath groupers and green morays could potentially have significant effects on the abundance of invertebrate prey in solution holes, given their rarity and the relatively small effect size of red grouper on all invertebrate predators measured during the observational study (see Table 3), it is unlikely that red grouper have ecologically significant effects on the abundance or presence of other invertebrate predators in this system. The fact that no other effects were detected among any of the other functional groups suggests that the exclusion experiment may have been too short to detect any significant direct effects of red grouper at the functional group level, and potentially for individual species as well.
Alternatively, the strong direct effects of red grouper could be limited to a narrow range of species, regardless of the duration of experiments. While red grouper presence generally enhanced the abundance, richness, and diversity of communities, the effects of red grouper presence on individual species were highly variable. Structural and abiotic changes that result from habitat engineering will have variable consequences for specific members of associated biotic communities, as the effects of engineer presence will depend on both species-specific responses to modified habitats and on species-specific interactions with the engineer [58]. The results of the exclusion experiment show that the presence or absence of red grouper had no effect on the abundance of most of the fish and invertebrate species present in these communities but had a strong effect on the abundance of just a few species. In fact, only two species had significant positive interactions with red grouper—white grunts and porkfish (see Table 2). Both white grunts and porkfish are reef-associated species and were mainly observed as juveniles in solution holes; most of the white grunts and porkfish counted here were all smaller than 15 cm TL. Time from the start of the exclusion experiment was a significant factor for explaining patterns of both abundance and evenness, likely driven by pulses of reef fish recruitment to solution holes. Fish recruitment in Florida Bay and the adjacent reef tract tends to increase between May and November, with peak recruitment occurring between June and August [59,60]. In both 2011 and 2012, the exclusion experiment was conducted during June and July, well within the prime settlement window for fish recruitment. The growth rate of juvenile grunts was estimated previously at 0.25 to 0.75 mm per day [59], thus a 1 cm long grunt recruit that settled to a solution hole at the start of the experiment would initially be counted as a juvenile grunt recruit (a combined group of all six grunt species due to the difficulty in visually determining the species of individuals < 5 cm TL) but later catalogued by species anywhere from six to 16 days after settlement. The growth of juvenile grunt recruits from the species complex into the individual species categories could explain the significance of time as a factor in describing patterns of species richness and evenness, as the grunt species complex differentiated from the complex into the individual species across the duration of the experiments.
The effect of red grouper on the abundance of juvenile reef fishes was particularly large according to multiple metrics analyzed here and in the observational study that was conducted concurrently at an alternate set of solution holes [29]. In addition to the significant positive interactions measured experimentally between red grouper and white grunts and porkfish, the two functional groups that included juvenile grunts—planktivores, water column fishes—both showed large effects due to red grouper presence in the observational study (see Table 3). The SIMPER analysis of abundance data found that the juvenile grunt species complex was the most influential group for influencing community structure, followed by white grunts, Caribbean spiny lobster, and French grunts (see Table 1). Together, juvenile grunts, white grunts, and French grunts accounted for 56.4% of the difference in communities with and without red grouper. Adult grunts were very rarely encountered during diver surveys; most grunts were small (< 15 cm TL) and were observed milling about above and around solution holes in mixed schools with the occasional juvenile parrotfish. Juvenile grunts have not been documented as part of red grouper diets, and red grouper had negligible effects on the abundance of piscivores in the community, based on the standardized effect size on piscivore group abundance. These results suggest that red grouper may enhance juvenile reef fish abundance via a behaviorally-mediated indirect interaction (BMII) mediated through changes in the behavior of resident and transient predators. In 2013, this hypothesis was tested by transplanting invasive lionfish (Pterois volitans and P. miles) into solution holes with and without red grouper [33]. After six weeks there were significantly more juvenile reef fish when red grouper and lionfish were both present compared to lionfish alone. In addition, analysis of lionfish stomach contents revealed that lionfish switched from a fish-dominated diet in the absence of red grouper to a crustacean-dominated diet in the presence of red grouper. These results suggest that territorial behaviors by red grouper toward other large-bodied fishes that live in or visit solution holes may disrupt the predatory ability of these piscivores and result in enhanced juvenile reef fish survival and abundance.
Five species had small but significantly negative interactions with red grouper: hogfish, sand perch, peppermint shrimp, spotted cleaner shrimp, and gray angelfish (Table 2). Both hogfish and sand perch are transient benthivores, which may avoid solution holes occupied by a red grouper or be deterred by agonistic territorial displays. Peppermint shrimp and spotted cleaner shrimp both belong to the “cleaners” functional group, which was numerically dominated by a third species—the Pederson’s cleaner shrimp. Negative responses by the rarer members of this group could be the result of competition for space among cleaners, as both Pederson’s and spotted cleaner shrimp are both strongly associated with anemones, a potentially limited resource around solution holes [61]. Angelfishes are primarily considered reef-associated species, though both juveniles and adults of all four species commonly found in south Florida were regularly encountered in Florida Bay solution holes [29]. Adult angelfishes primarily consume sponges, but juveniles also consume algae and cleaning behavior by juveniles of at least one species has been reported [52,62]. In terms of individual species interactions, three of the four species had negative interactions with red grouper, though only the interaction between gray angelfish and red grouper was significant. Adult angelfishes are relatively large bodied, and though they were most often observed milling about above and around solution holes, they would also commonly dart into holes as divers approached, thus the negative interactions observed between angelfishes and red grouper could result from competition for space within solution holes. However, although both juveniles (< 10 cm TL) and adults were observed in solution holes, they were counted together in a single category. Juvenile angelfish may benefit from red grouper presence through the same mechanisms as juvenile grunts, and further investigation into possible ontogenetic variations in this interaction would clarify the nature of this interaction.
While the community-level effects of red grouper on the abundance and diversity of solution hole communities are clear, their effects on the larger Florida Bay ecosystem remain untested. Solution holes make up a relatively small portion of the benthic habitats in Florida Bay (~3%) but are important diurnal refuges for lobsters and other invertebrates and may function similarly for juvenile reef fish before they move onto adjacent reef habitats as adults [34,56,63]. Comparing the cumulative (i.e., direct plus indirect) effects of red grouper described in Ellis et al. [29] with the direct effects of red grouper presence on solution hole faunal communities described here suggests that there are relatively few negative direct effects of red grouper presence. Instead, red grouper presence had consistently positive effects on the abundance and species diversity of faunal communities over short (days to weeks) and long (multi-year) time scales, likely attributable to increased habitat availability and BMIIs mediated by territorial behaviors. Estimating the effects of red grouper presence in a hierarchical framework (e.g., community, functional group, individual species) by using both observational and experimental methods allowed me to describe the cumulative effects of red grouper as both a habitat engineer and predator along with the direct effects that red grouper had on individual species. These results illustrate the complex effects of a predatory habitat engineer on faunal communities associated with engineered habitats.

Funding

This research was funded by grants to the author from the Florida State University’s Department of Biology, Florida Sea Grant and the Guy Harvey Ocean Foundation, PADI Foundation, Sigma Xi, and by donations from 37 donors through a crowd-funding initiative hosted by the now defunct SciFlies.org.

Acknowledgments

This project was made possible thanks to field assistance provided by A. Carreiro, C. Ellis, B. George, K. Kingon, A. Lentner, N. Levine, J. Lewis, and N. Norton. All research activities described here were conducted with permissions from the Florida Keys National Marine Sanctuary (permits #FKNMS-2010-058 and #FKNMS-2012-078). Logistical support was provided by the FSU Coastal and Marine Laboratory and the FSU Academic Diving Program. This manuscript and the project described herein was completed as part of the author’s doctoral dissertation and as such received valuable input from his committee, including F. Coleman, T. Miller, E. DuVal, B. Inouye, and M. Huettel. Special thanks to C. Koenig and M. Wilkerson. The manuscript was improved thanks to critical comments from A. Acosta, J. Herbig, J. Gutiérrez, and J. Keller, and to assistance with figures from M. Hunter and J. Ritch.

Conflicts of Interest

The author declares no conflicts of interest.

Appendix A

Table A1. Fish species observed at solution holes used for experiments conducted in Florida Bay in 2011 and 2012. Functional group classifications were based on reported diet information for the Feeding group, and the location of individuals in relation to solution holes as observed during diver surveys for the Habitat group. BA = herbivores (consume primarily benthic algae); CL = cleaners (consume ectoparasites); INV = invertivores; PL = planktivores; PV = piscivores; ZB = benthivores (consume primarily small benthic invertebrates); DEM = demersal fishes primarily observed inside solution holes; MILL = milling behavior, where the fish was found in the water-column above and around solution holes; TRANS = transient fishes observed visiting solution holes.
FamilySpeciesCommon NameFunctional Group
FeedingHabitat
AcanthuridaeAcanthurus chirurgusDoctorfishBAMILL
Acanthurus coeruleusBlue TangBAMILL
ApogonidaeApogon binotatusBarred CardinalfishPLDEM
Apogon maculatusFlamefishZBDEM
BalistidaeBalistes capriscusGray TriggerfishZBMILL
ChaetodontidaeChaetodon ocellatusSpotfin ButterflyfishZBMILL
Chaetodon sedentariusReef ButterflyfishZBMILL
GerreidaeEucinostomus melanopterusFlagfin MojarraZBTRANS
GinglymostomatidaeGinglymostoma cirratumNurse SharkINVDEM
GobiidaeCoryphopterus glaucofraenumBridled GobyBADEM
Elacatinus oceanopsNeon GobyCLDEM
HaemulidaeAnisotremus virginicusPorkfishCL/ZBMILL
Haemulon chrysargyreumSmallmouth GruntZBMILL
Haemulon flavolineatumFrench GruntZBMILL
Haemulon plumieriiWhite GruntZBMILL
Haemulon sciurusBluestriped GruntZBMILL
LabridaeLachnolaimus maximusHogfishZBTRANS
Thalassoma bifasciatumBluehead WrasseCL/PLTRANS
LutjanidaeLutjanus griseusGray SnapperZBTRANS
Lutjanus synagrisLane SnapperZBTRANS
Ocyurus chrysurusYellowtail SnapperPVTRANS
MullidaePseudupeneus maculatusSpotted GoatfishZBTRANS
MuraenidaeGymnothorax funebrisGreen MorayINV/PVDEM
Gymnothorax vicinusPurplemouth MorayINV/PVDEM
PomacanthidaeHolacanthus bermudensisBlue AngelfishZBMILL
Holacanthus ciliarisQueen AngelfishZBMILL
Pomacanthus arcuatusGray AngelfishZBMILL
Pomacanthus paruFrench AngelfishCL/ZBMILL
PomacentridaeAbudefdef saxatilisSergeant MajorZBMILL
ScaridaeScarus coeruleusBlue ParrotfishBATRANS
Scarus iseriStriped ParrotfishBATRANS
Sparisoma aurofrenatumRedband ParrotfishBATRANS
SciaenidaeEquetus lanceolatusJacknife FishZBDEM
Pareques acuminatusHigh-HatZBDEM
ScorpaenidaePterois miles/volitansLionfishPVDEM
Scorpaena plumieriSpotted ScorpionfishPVDEM
SerranidaeDiplectrum formosumSand PerchZBTRANS
Epinephelus itajaraGoliath GrouperINVDEM
Epinephelus morioRed GrouperINVDEM
Hypoplectrus puellaBarred HamletZBMILL
Mycteroperca bonaciBlack GrouperPVMILL
SparidaeCalamus calamusSaucereye PorgyZBTRANS
Table A2. Motile macroinvertebrate species observed at solution holes used for experiments conducted in Florida Bay in 2011 and 2012. Functional group classifications were based on reports of species consumed by red grouper (RG Diet) or as consuming ectoparasites (CL).
PhylumFamilySpeciesCommon NameFunctional Group
RG DietCL
ArthropodaHippolytidaeLysmata spp.Peppermint shrimpNY
MajidaeMithrax spinosissimusChannel clinging crabYN
PalaemonidaeAncylomenes pedersoniPederson’s cleaner shrimpNY
Periclimines yucatanicusSpotted cleaner shrimpNY
PalinuridaePanulirus argusCaribbean spiny lobsterYN
ScyllaridaeScyllarides aequinoctialisSpanish lobsterYN
StenopodidaeStenorhynchus seticornisYellowline arrow crabNN
XanthidaeMenippe mercenariaFlorida stone crabNN
EchinodermataClypeasteridaeClypeaster rosaceusInflated sea biscuitNN

References

  1. Jones, C.G.; Lawton, J.H.; Shachak, M. Positive and negative effects of organisms as physical ecosystem engineers. Ecology 1997, 78, 1946–1957. [Google Scholar] [CrossRef]
  2. Bruno, J.F.; Bertness, M.D. Habitat modification and facilitation in benthic marine communities. In Marine Community Ecology; Bertness, M.D., Gaines, S.D., Hay, M.E., Eds.; Sinauer Associates: Sunderland, MA, USA, 2001; pp. 201–218. [Google Scholar]
  3. Dayton, P.K. Toward an understanding of community resilience and the potential effects of enrichments to the benthos at McMurdo Sound Antarctica. In Proceedings of the Colloquium on Conservation Problems in Antarctica; Parker, B.C., Ed.; Allen Press: Lawrence, KA, USA, 1972; pp. 81–96. [Google Scholar]
  4. Jones, C.G.; Lawton, J.H.; Shachak, M. Organisms as ecosystem engineers. Oikos 1994, 69, 373–386. [Google Scholar] [CrossRef]
  5. Naeem, S.; Thompson, L.J.; Lawler, S.P.; Lawton, J.H.; Woodfin, R.M. Declining biodiversity can alter the performance of ecosystems. Nature 1994, 368, 734–737. [Google Scholar] [CrossRef]
  6. Coleman, F.C.; Williams, S.L. Overexploiting marine ecosystem engineers: Potential consequences for biodiversity. Trends Ecol. Evol. 2002, 17, 40–44. [Google Scholar] [CrossRef]
  7. Stachowicz, J.J.; Bruno, J.F.; Duffy, J.E. Understanding the effects of marine biodiversity on communities and ecosystems. Ann. Rev. 2007, 38, 739–766. [Google Scholar] [CrossRef]
  8. Jackson, D.R.; Milstrey, E.G. The Fauna of Gopher Tortoise Burrows; Florida Game and Fresh Water Fish Commission Nongame Wildlife Program Technical Report No. 5; Florida Game and Fresh Water Fish Commission: Tallahassee, FL, USA, 1989. [Google Scholar]
  9. Kinlaw, A.; Grasmueck, M. Evidence for and geomorphologic consequences of a reptilian ecosystem engineer: The burrowing cascade initiated by the Gopher Tortoise. Geomorphology 2011, 157–158, 108–121. [Google Scholar] [CrossRef]
  10. Able, K.W.; Grimes, C.B.; Jones, R.S.; Twichell, D.C. Temporal and spatial variation in habitat characteristics of tilefish (Lopholatilus chamaeloeonticefs) off the east coast of Florida. Bull. Mar. Sci. 1993, 53, 1013–1026. [Google Scholar]
  11. Hixon, M.A. Predation as a process structuring coral-reef fish communities. In The Ecology of Fishes on Coral Reefs; Sale, P.F., Ed.; Academic Press: San Diego, CA, USA, 1991; pp. 475–508. [Google Scholar]
  12. Almany, G.R.; Webster, M.S. The predation gauntlet: Early post-settlement mortality in reef fishes. Coral Reefs 2006, 25, 19–22. [Google Scholar] [CrossRef]
  13. Stallings, C.D. Predator identity and recruitment of coral-reef fishes: Indirect effects of fishing. Mar. Ecol. Prog. Ser. 2009, 383, 251–259. [Google Scholar] [CrossRef]
  14. Stier, A.C.; Geange, S.W.; Hanson, K.M.; Bolker, B.M. Predator density and timing of arrival affect reef fish community assembly. Ecology 2013, 94, 1057–1068. [Google Scholar] [CrossRef]
  15. Heinlein, J.M.; Stier, A.C.; Steele, M.A. Predators reduce abundance and species richness of coral reef fish recruits via non-selective predation. Coral Reefs 2010, 29, 527–532. [Google Scholar] [CrossRef]
  16. Albins, M.A. Effects of invasive Pacific red lionfish Pterois volitans versus a native predator on Bahamian coral-reef fish communities. Biol. Invasions 2013, 15, 29–43. [Google Scholar] [CrossRef]
  17. Keough, M.J.; Downes, B.J. Recruitment of marine invertebrates: The role of active larval choice and early mortality. Oecologia 1982, 54, 348–352. [Google Scholar] [CrossRef] [PubMed]
  18. Beukers, J.S.; Jones, G.P. Habitat complexity modifies the impact of piscivores on a coral reef fish population. Oceologia 1997, 114, 50–59. [Google Scholar] [CrossRef] [PubMed]
  19. Anderson, M.J. A new method for non-parametric multivariate analysis of variance. Aust. Ecol. 2001, 26, 32–46. [Google Scholar]
  20. Hixon, M.A.; Carr, M.H. Synergistic predation, density dependence, and population regulation in marine fish. Science 1997, 277, 946–949. [Google Scholar] [CrossRef]
  21. Stallings, C.D. Indirect effects of an exploited predator on recruitment of coral-reef fishes. Ecology 2008, 89, 2090–2095. [Google Scholar] [CrossRef]
  22. Paine, R.T. Food web complexity and species diversity. Am. Nat. 1966, 100, 65–75. [Google Scholar] [CrossRef]
  23. Paine, R.T. A note on trophic complexity and community stability. Am. Nat. 1969, 103, 91–93. [Google Scholar] [CrossRef]
  24. McLean, J.H. Sublittoral ecology of kelp beds of the open coast near Carmel, California. Biol. Bull. 1962, 122, 95–114. [Google Scholar] [CrossRef]
  25. Estes, J.A.; Palmisano, J.F. Sea otters: Their role in structuring nearshore communities. Science 1974, 185, 1058–1060. [Google Scholar] [CrossRef] [PubMed]
  26. Estes, J.A.; Smith, N.S.; Palmisano, J.F. Sea otter predation and community organization in the Western Aleutian Islands, Alaska. Ecology 1978, 59, 822–833. [Google Scholar] [CrossRef]
  27. Estes, J.A.; Duggins, D.O. Sea otters and kelp forests in Alaska: Generality and variation in a community ecological paradigm. Ecol. Monogr. 1995, 65, 75–100. [Google Scholar] [CrossRef]
  28. Coleman, F.C.; Koenig, C.C.; Scanlon, K.M.; Heppell, S.; Heppell, S.; Miller, M.W. Benthic habitat modification through excavation by red grouper, Epinephelus morio, in the northeastern Gulf of Mexico. Open Fish Sci. J. 2010, 3, 1–15. [Google Scholar] [CrossRef]
  29. Ellis, R.D.; Coleman, F.C.; Koenig, C.C. Effects of habitat manipulation by red grouper, Epinephelus morio, on faunal communities associated with excavations in Florida Bay. Bull. Mar. Sci. 2017, 93, 961–983. [Google Scholar] [CrossRef]
  30. Herrnkind, W.F.; Butler IV, M.J.; Hunt, J.H.; Childress, M. Role of physical refugia: Implications from a mass sponge die-off in a lobster nursery in Florida. Mar. Fresh. Res. 1997, 48, 759–769. [Google Scholar] [CrossRef]
  31. Randall, J.E. Food habits of reef fishes of the West Indies. Stud. Trop. Ocean. 1967, 5, 665–847. [Google Scholar]
  32. Moe, M.A. Biology of the Red Grouper (Epinephelus morio Valenciennes) from the Eastern Gulf of Mexico; Professional Papers Series; Florida Department of Natural Resources, Marine Science Laboratory: St. Petersburg, FL, USA, 1967. [Google Scholar]
  33. Bullock, L.H.; Smith, G.B. Seabasses (Pisces: Serranidae). Memoirs of the Hourglass Cruises,X; Florida Marine Research Institute, Department of Natural Resources: St. Petersburg, FL, USA, 1991; Volume VIII, Part II. [Google Scholar]
  34. Brulé, T.; Rodriguez Canche, L.G. Food habits of juvenile red groupers, Epinephelus morio (Valenciennes, 1828), from Campeche Bank, Yucatan, Mexico. Bull. Mar. Sci. 1993, 52, 772–779. [Google Scholar]
  35. Weaver, D.C. Feeding Ecology and Ecomorphology of Three Sea Basses (Pisces: Serranidae) in the Gulf of Mexico. Master’s thesis, University of Florida, Gainesville, FL, USA, 1996. [Google Scholar]
  36. Brulé, T.; Avila, D.O.; Crespo, M.S.; Deniel, C. Seasonal and diel changes in diet composition of juvenile red grouper (Epinephelus morio) from Campeche Bank. Bull. Mar. Sci. 1994, 55, 255–262. [Google Scholar]
  37. Hacker, S.; Gaines, S.D. Some implications of direct positive interactions for community species diversity. Ecology 1997, 78, 1990–2003. [Google Scholar] [CrossRef]
  38. Dill, L.M.; Heithaus, M.R.; Walters, C.J. Behaviorally mediated indirect interactions in marine communities and their conservation implications. Ecology 2003, 84, 1151–1157. [Google Scholar] [CrossRef]
  39. Ellis, R.D. Ecological effects of Red Grouper (Epinephelus morio) in Florida Bay. Ph.D. Thesis, Florida State University, Tallahassee, FL, USA, 2015. [Google Scholar]
  40. Ellis, R.D.; Faletti, M.E. Native grouper indirectly ameliorates the negative effects of invasive lionfish. Mar. Ecol. Prog. Ser. 2016, 558, 267–279. [Google Scholar] [CrossRef] [Green Version]
  41. Rhyne, A.L.; Lin, J. A western Atlantic peppermint shrimp complex: Redescription of Lysmata wurdemanni, description of four new species, and remarks on Lysmata rathbunae (Crustacea: Decapoda: Hipploytidae). Bull. Mar. Sci. 2006, 79, 165–204. [Google Scholar]
  42. Hill, M.O. Diversity and evenness: A unifying notation and its consequences. Ecology 1973, 54, 427–432. [Google Scholar] [CrossRef]
  43. Hill, M.O. An evenness statistic based on the abundance-weighted variance of species proportions. Oikos 1997, 79, 413–416. [Google Scholar] [CrossRef]
  44. McCune, B.; Grace, J.B. Analysis of Ecological Communities, 1st ed.; MjM Software Design: Gleneden Beach, OR, USA, 2002. [Google Scholar]
  45. Oksanen, J.; Blanchet, F.G.; Kindt, R.; Legendre, P.; Minchin, P.R.; O’Hara, R.B.; Simpson, G.L.; Solymos, P.; Stevens, M.H.; Wagner, H. Vegan: Community Ecology Package. R package version 2.0-10, 2013. Available online: https://CRAN.R-project.org/package=vegan (accessed on 13 September 2013).
  46. Paine, R.T. Food-web analysis through field measurement of per capita interaction strength. Nature 1992, 355, 73–75. [Google Scholar] [CrossRef]
  47. Berlow, E.L.; Navarrete, S.A.; Briggs, C.J.; Power, M.E.; Menge, B.A. Quantifying variation in the strengths of species interactions. Ecology 1999, 80, 2206–2224. [Google Scholar] [CrossRef]
  48. Hesterberg, T. Resample: Resampling Functions. R package version 0.4, 2015. Available online: https://CRAN.R-project.org/package=resample (accessed on 25 April 2015).
  49. Hedges, L.V. Distribution theory for Glass’s estimator of effect size and related estimators. J. Educ. Behav. Stat. 1981, 6, 107–128. [Google Scholar] [CrossRef]
  50. Nagkawa, S.; Cuthill, I.C. Effect size, confidence interval and statistical significance: A practical guide for biologists. Biol. Rev. 2007, 82, 591–605. [Google Scholar] [CrossRef]
  51. Osenberg, C.W.; Sarnelle, O.; Cooper, S.D. Effect size in ecological experiments: The application of biological models in meta-analysis. Am. Nat. 1997, 150, 798–812. [Google Scholar] [CrossRef]
  52. Froese, R.; Pauly, D. FishBase. Available online: http://www.fishbase.org (accessed on 25 April 2015).
  53. Kirby, K.N.; Gerlanc, D. BootES: An R package for bootstrap confidence intervals on effect sizes. Behav. Res. Meth. 2013, 45, 905–927. [Google Scholar] [CrossRef] [PubMed]
  54. Ellison, A.M. Partitioning diversity. Ecology 2010, 91, 1962–1963. [Google Scholar] [CrossRef] [PubMed]
  55. Jost, L. Independence of alpha and beta diversities. Ecology 2010, 91, 1969–1974. [Google Scholar] [CrossRef] [PubMed]
  56. Bertelsen, R.D.; Cox, C. Sanctuary roles in population and reproductive dynamics of Caribbean spiny lobster. In Spatial Processes and Management of Marine Populations; Kruse, G.H., Bez, N., Booth, A., Dorn, M.W., Hills, S., Lipcius, R.N., Pelletier, D., Roy, C., Smith, S.J., Witherells, D., Eds.; University of Alaska Sea Grant: Fairbanks, AK, USA, 2001; pp. 591–605. [Google Scholar]
  57. Ellis, R.D. Species interactions through ontogeny: Effects of size-selective predation by red grouper on Caribbean spiny lobster in solution holes of Florida Bay. J. Exp. Mar. Biol. Ecol. 2018, 506, 115–123. [Google Scholar] [CrossRef]
  58. Jones, C.G.; Gutiérrez, J.L.; Byers, J.E.; Crooks, J.A.; Lambrinos, J.G.; Talley, T.S. A framework for understanding physical ecosystem engineering by organisms. Oikos 2010, 119, 1862–1869. [Google Scholar] [CrossRef]
  59. Thayer, G.W.; Powell, A.B.; Hoss, D.E. Composition of larval, juvenile, and small adult fishes relative to changes in environmental conditions in Florida Bay. Estuaries 1999, 22, 518–533. [Google Scholar] [CrossRef]
  60. Sponaugle, S.; Paris, C.; Walter, K.D.; Kourafalou, V.; Alessandro, E.D. Observed and modeled larval settlement of a reef fish to the Florida Keys. Mar. Ecol. Prog. Ser. 2012, 453, 201–212. [Google Scholar] [CrossRef] [Green Version]
  61. Silbiger, N.J.; Childress, M.J. Interspecific variation in anemone shrimp distribution and host selection in the Florida Keys (USA): Implications for marine conservation. Bull. Mar. Sci. 2008, 83, 329–345. [Google Scholar]
  62. Wicksten, M.K. Associations of fishes and their cleaners on coral reefs of Bonaire, Netherlands Antilles. Copeia 1995, 2, 477–481. [Google Scholar] [CrossRef]
  63. Zieman, J.; Fourqurean, J.W.; Iverson, R.L. Distribution, abundance and productivity of seagrasses and macroalgae in Florida Bay. Bull. Mar. Sci. 1989, 44, 292–311. [Google Scholar]
Figure 1. Map of the 35 solution holes located in southwest Florida Bay surveyed in 2011 and 2012. Circles indicate holes where red grouper were present one of the two years, triangles indicate holes where red grouper were present both years, and open squares indicate holes where red grouper were absent both years.
Diversity 11 00089 g001
Figure 2. Total abundance (A) and species richness (B) of fishes and motile invertebrates associated with solution holes in Florida Bay occupied by red grouper (control treatment, “CON”; filled circles; n = 16) versus holes where the red grouper was removed (removal treatment, “REM”; open circles; n = 16). Error bars are ± 1 SE.
Diversity 11 00089 g002
Figure 3. H1 diversity (Shannon-Weiner; A), H2 diversity (Simpson; B), and Hill’s evenness (C) of faunal communities associated with solution holes in Florida Bay that were occupied by red grouper (control treatment, “CON”; n = 16) versus holes where the red grouper was experimentally removed (removal treatment, “REM”; n = 16) Error bars are ± 1 SE.
Diversity 11 00089 g003aDiversity 11 00089 g003b
Figure 4. Non-metric multidimensional scaling (NMDS) plots of community structure of faunal communities associated with solution holes in Florida Bay before (A) and after (B) experimental exclusion of red grouper from treatment sites (REM; open circles; n = 16), compared to control sites (CON; filled circles; n = 16) where red grouper remained present.
Diversity 11 00089 g004
Figure 5. Distribution of interaction strengths between red grouper and species associated with solution-hole faunal communities in Florida Bay calculated with Paine’s index (PI) based on red grouper exclusion experiments conducted in 2011 and 2012.
Diversity 11 00089 g005
Figure 6. Size of the initially-removed red grouper versus the size of recolonizing red grouper removed from exclusion treatment solution holes in Florida Bay during experiments in 2011 (diamonds; N = 8) and 2012 (circles; N = 13). The dashed line represents a 1:1 size relationship. Filled points indicate single recolonization events, and open points represent multiple recolonization events.
Diversity 11 00089 g006
Table 1. Similarity percentage (SIMPER) contribution scores, ranks, and rank abundance of the 20 species with the highest influence on faunal community structure from surveys of solution hole communities with and without red grouper in 2011 and 2012.
Common NameSpeciesIndividual ContributionCumulative ContributionSIMPER RankRank Abundance
Juvenile gruntsHaemulon spp.0.2760.27613
White gruntHaemulon plumierii0.2160.49222
Caribbean spiny lobsterPanulirus argus0.2170.70931
French gruntHaemulon flavolineatum0.0720.78145
Pederson’s cleaner shrimpAncylomenes pedersoni0.0610.84254
Gray snapperLutjanus griseus0.0340.87666
PorkfishAnisotremus virginicus0.0150.89177
Channel clinging crabMithrax spinosissimus0.0130.90488
High-hatPareques acuminatus0.0120.91699
French angelfishPomacanthus arcuatus0.0100.9261013
Blue angelfishHolacanthus bermudensis0.0090.9351110
Florida stone crabMenippe mercenaria0.0090.9441211
Peppermint shrimpLysmata spp. 0.0070.9511316
Queen angelfishHolacanthus ciliaris0.0070.9581415
HogfishLachnolaimus maximus0.0060.9641514
Spotted cleaner shrimpPericlimenes yucatanicus0.0050.9691619
DoctorfishAcanthurus chirurgus0.0050.9741720
Striped parrotfishScarus iseri0.0040.9781817
Sand perchDiplectrum formosum0.0040.9821922
Bluestriped gruntHaemulon sciurus0.0030.9852018
Table 2. Species-specific interaction strengths based on Paine’s index (PI) values derived from exclusion experiments conducted in 2011 and 2012, with means ± 1 SE, and 95% confidence intervals generated from bootstrapped standard errors for the 28 species with non-negative PI values. Bold values indicate significant interactions based on 95% CI.
SpeciesCommon NameExperimental Effect [PI]Bootstrapped Effect (± SE)95% CI
Haemulon plumieriiWhite grunt4.964.97 (± 2.38)0.206, 9.737
Panulirus argusCaribbean spiny lobster3.393.29 (± 2.57)−1.85, 8.44
Haemulon spp.Juvenile grunts 1.571.56 (± 1.19)−0.811, 3.95
Ancylomenes pedersoniPederson’s cleaner shrimp0.5200.512 (± 0.257)−0.0031, 1.03
Lutjanus griseusGray snapper0.4820.482 (± 0.255)−0.0282, 0.992
Anisotremus virginicusPorkfish0.3620.356 (± 0.161)0.0332, 0.679
Haemulon flavolineatumFrench grunt0.2810.290 (± 0.449)−0.607, 1.19
Pareques acuminatusHigh-hat0.01910.0198 (± 0.082)−0.159, 0.198
Holacanthus bermudensisBlue angelfish−0.0125−0.0119 (± 0.0408)−0.0945, 0.0697
Lachnolaimus maximusHogfish−0.0333−0.0331 (± 0.0149)−0.0629, −0.00329
Haemulon chrysargyreumSmallmouth grunt−0.0375−0.0368 (± 0.0362)−0.109, 0.0356
Mycteroperca bonaciBlack grouper−0.0500−0.0515 (± 0.0485)−0.148, 0.0455
Lutjanus synagrisLane snapper−0.0583−0.0572 (± 0.0563)−0.170, 0.0554
Scarus coeruleusBlue parrotfish−0.0625−0.0624 (± 0.0607)−0.184, 0.0590
Pomacanthus paruFrench angelfish−0.0625−0.0634 (± 0.0563)−0.183, 0.0558
Balistes capriscusGray triggerfish−0.0625−0.0643 (± 0.0606)−0.185, 0.0568
Haemulon sciurusBluestriped grunt−0.0667−0.0685 (± 0.0438)−0.156, 0.0190
Menippe mercenariaFlorida stone crab−0.0750−0.0730 (± 0.0670)−0.207, 0.0611
Scarus iseriStriped parrotfish−0.0833−0.0812 (± 0.0551)−0.191, 0.0290
Holacanthus ciliarisQueen angelfish−0.100−0.0999 (± 0.0518)−0.204, 0.00373
Acanthurus chirurgusDoctorfish−0.104−0.103 (± 0.0686)−0.241, 0.0339
Equetus lanceolatusJackknife fish−0.108−0.107 (± 0.0712)−0.250, 0.0350
Mithrax spinosissimusChannel clinging crab−0.145−0.147 (± 0.0873)−0.321, 0.0279
Ocyurus chrysurusYellowtail snapper−0.163−0.161 (± 0.0812)−0.323, 0.00199
Pomacanthus arcuatusGray angelfish−0.169−0.172 (± 0.0632)−0.298, −0.0458
Lysmata spp.Peppermint shrimp−0.175−0.178 (± 0.0694)−0.317, −0.0395
Diplectrum formosumSand perch−0.215−0.211 (± 0.0911)−0.393, −0.0290
Periclimenes yucatanicusSpotted cleaner shrimp−0.244−0.244 (± 0.0794)−0.402, −0.0848
Table 3. Standardized effects of red grouper on the abundance of functional groups of fishes and motile invertebrates associated with solution holes in Florida Bay, calculated with Hedge’s g. Experimental effects based on results from red grouper exclusion experiments conducted in 2011 and 2012, described here. Observational effects are based on 99 observations of non-manipulated solution hole communities at three sites in Florida Bay between 2010 and 2013, described by Ellis et al. [29]. Functional group classifications for the fishes were based on reported diet information or by the location of individuals in relation to solution holes as observed during diver surveys. Functional group classifications for the invertebrates were based on reports of species known to be prey for red grouper. The functional group “cleaners” includes both fish and invertebrate species known to consume ectoparasites. Values in bold are statistically significant from zero.
Functional GroupEffect Size g, Experimental95% CIEffect Size g, Observational95% CI
All Fishes0.538−0.281, 1.091.411.11, 1.70
Herbivores0.224−0.550, 1.030.6260.216, 0.943
Planktivores0.012−0.650, 0.8231.020.792, 1.23
Benthivores0.546−0.194, 1.070.6450.375, 0.865
Invertivores0.6770.362, 1.110.4390.043, 0.734
Piscivores0.151−0.622, 0.7510.276−0.127, 0.716
Demersal Fishes0.469−0.215, 1.190.7680.249, 1.23
Water Column Fishes0.499−0.152, 1.101.341.07, 1.60
Transient Fishes0.396−0.340, 1.040.0239−0.393, 0.376
All Invertebrates0.346−0.446, 1.151.120.682, 1.51
Red grouper Prey0.309−0.464, 1.100.7710.375, 1.16
Not Prey0.184−0.479, 1.050.9590.561, 1.38
Cleaners 0.395−0.427, 1.160.9930.539, 1.39

