Article

Indications of Genetic Admixture in the Transition Zone between Fagus sylvatica L. and Fagus sylvatica ssp. orientalis Greut. & Burd

by
Markus Müller
1,
Precious Annie Lopez
1,
Aristotelis C. Papageorgiou
2,
Ioannis Tsiripidis
3 and
Oliver Gailing
1,4,*
1
Forest Genetics and Forest Tree Breeding, University of Goettingen, Büsgenweg 2, 37077 Göttingen, Germany
2
Molecular Biology and Genetics, Democritus University of Thrace, University Campus, Dragana, 68100 Alexandroupolis, Greece
3
School of Biology, Aristotle University of Thessaloniki, 54124 Thessaloniki, Greece
4
Center for Integrated Breeding Research (CiBreed), University of Goettingen, 37077 Göttingen, Germany
*
Author to whom correspondence should be addressed.
Diversity 2019, 11(6), 90; https://doi.org/10.3390/d11060090
Submission received: 22 May 2019 / Revised: 7 June 2019 / Accepted: 8 June 2019 / Published: 10 June 2019
(This article belongs to the Section Plant Diversity)

Abstract

:
Two subspecies of European beech (Fagus sylvatica L.) can be found in southeast Europe: Fagus sylvatica ssp. sylvatica L. and Fagus sylvatica ssp. orientalis (Lipsky) Greut. & Burd. (Fagus orientalis Lipsky). In a previous study, based on genetic diversity patterns and morphological characters, indications of hybridization between both subspecies were found in northeastern Greece, a known contact zone of F. sylvatica and F. orientalis. Nevertheless, potential genetic admixture has not been investigated systematically before. Here, we investigated genetic diversity and genetic structure of 14 beech populations originating from Greece and Turkey as well as of two reference F. sylvatica populations from Germany based on nine expressed sequence tag-simple sequence repeat (EST-SSR) markers. Very low genetic differentiation was detected among F. sylvatica populations (mean GST: 0.005) as well as among F. orientalis populations (mean GST: 0.008), but substantial differentiation was detected between populations of the two subspecies (mean GST: 0.122). Indications for hybridization between both subspecies were revealed for one population in Greece. One of the genetic markers showed specific allele frequencies for F. sylvatica and F. orientalis and may be used as a diagnostic marker in future studies to discriminate both subspecies.

1. Introduction

In southeast Europe, two subspecies of Fagus sylvatica L. can be found: Fagus sylvatica ssp. sylvatica (hereafter F. sylvatica) and Fagus sylvatica ssp. orientalis (Lipsky) Greut & Burd. (hereafter F. orientalis) [1,2], whereby the status of these two taxa as subspecies or species and their phylogeny still needs to be clarified [3,4]. F. sylvatica is distributed over large areas in Europe, whereas F. orientalis ranges from the southeastern Balkan to northern Iran [5]. Several studies were conducted to investigate morphological and genetic variation patterns within the distribution area of the two subspecies. For instance, Denk et al. [6] conducted a morphological analysis of beech populations covering the range of species in western Eurasia. The authors detected a west-east gradient of morphological characteristics with overlapping variability in morphological types. Differences in morphological traits were also revealed on a more regional scale. Thus, morphological forms resembling F. sylvatica were found in western parts of Greece, whereas morphological types resembling F. orientalis were found in the eastern parts of the country [7]. Populations of F. sylvatica and F. orientalis were also investigated using different types of genetic markers such as amplified fragment-length polymorphisms (AFLPs), chloroplast microsatellites, internal transcribed spacer (ITS) sequences, and isozymes [6,8,9,10,11,12,13]. Genetic analyses revealed clinal variation of increasing genetic diversity from west to east [9,11]. Much higher haplotype diversity was found for beech in southeastern Europe compared to central and western Europe [8,10,13], likely due to the migration history of the species during the Pleistocene. Based on AFLPs [10] and isozymes [12], it was possible to group beech populations into F. sylvatica and F. orientalis, albeit no clear species-specific alleles were identified.
Papageorgiou et al. [9] investigated both subspecies in their potential transition zone in the Rodopi Mountains in northeastern Greece. Morphological traits and genetic variation revealed characteristics resembling F. sylvatica mainly in the western parts of the mountains and at higher altitudes, whereas characteristics resembling F. orientalis were mainly found in the eastern parts of the mountains and at lower elevations. Intermediate phenotypes were also detected in the investigated populations [9]. The intermediate phenotypes and higher genetic diversity compared to other beech populations indicate introgression between F. sylvatica and F. orientalis in this area [7]. Here, we further analyzed the genetic structure of beech populations in the potential transition zone between F. sylvatica and F. orientalis in Greece and Turkey. Based on nine expressed sequence tag-simple sequence repeat (EST-SSR) markers, genetic diversity and differentiation of 16 beech populations were determined, and potential genetic admixture among populations was analyzed.

2. Materials and Methods
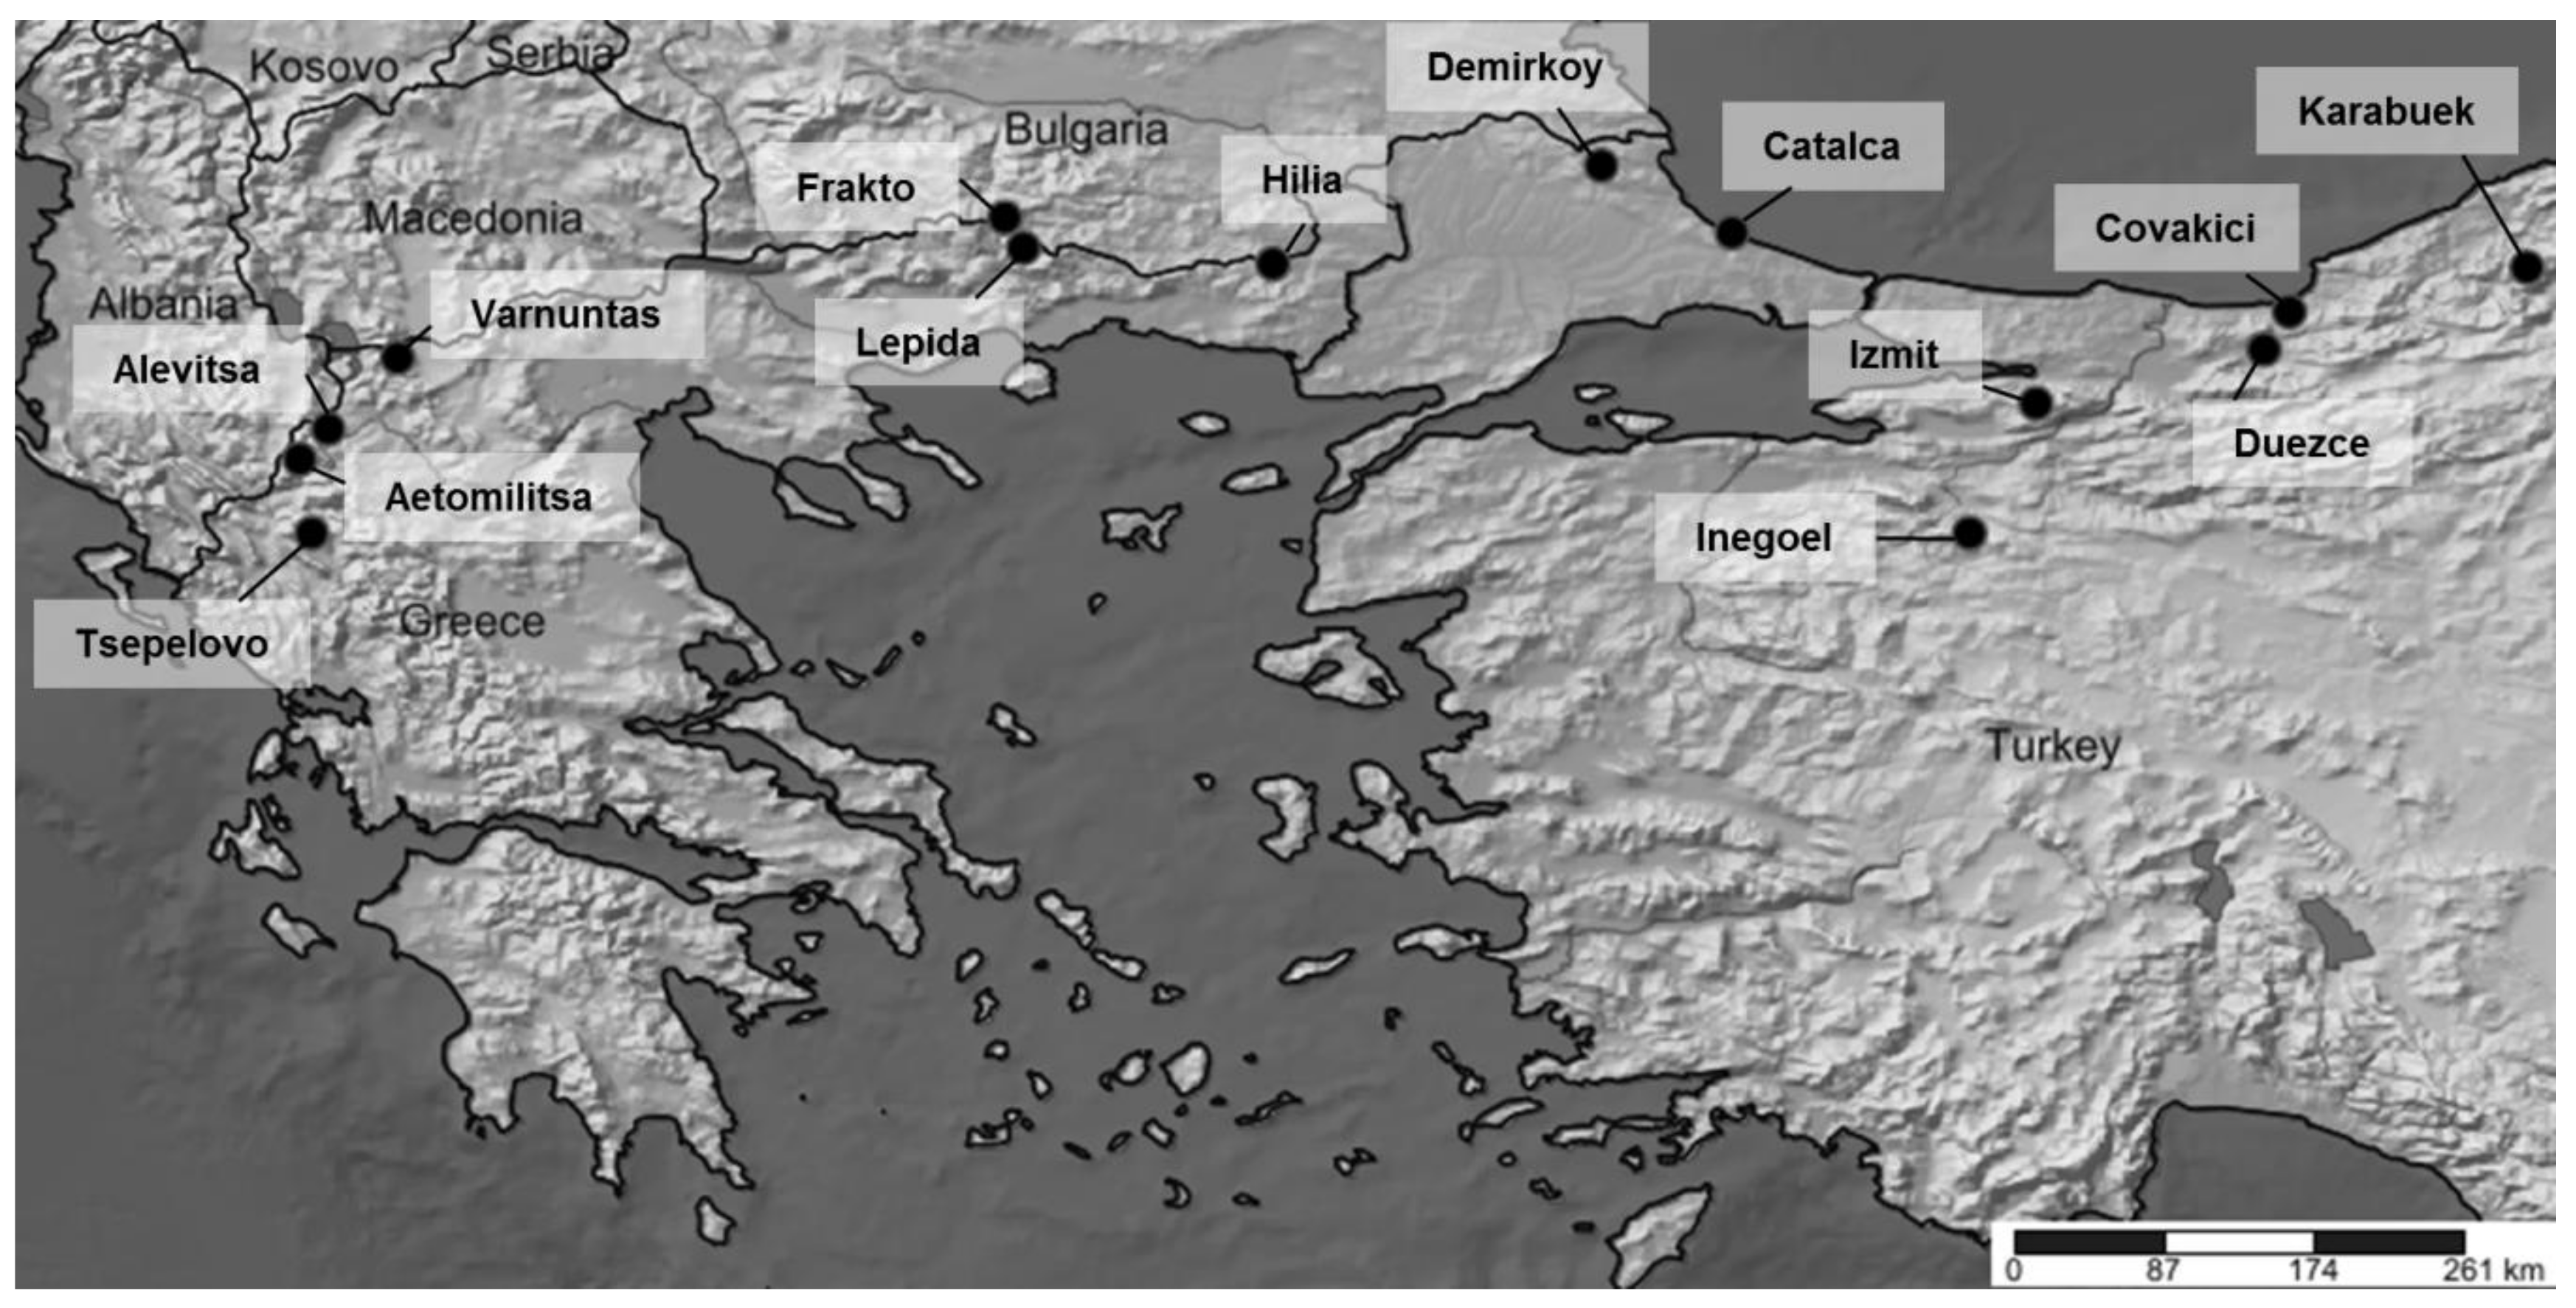
2.1. Plant Material

In total, 16 beech populations were investigated (Figure 1, Table 1). DNA samples of six Turkish F. orientalis populations (Covakici, Duezce, Catalca, Inegoel, Izmit, and Karabuek) were obtained (ten samples per population) from a previous study [10]; they originate from trees of a provenance trial in Germany that was established in 1986/1987 [14]. Furthermore, DNA samples from two North German F. sylvatica populations (Calvoerde and Goehrde, used as F. sylvatica reference populations in this study) were obtained (24 samples per population) from Seifert [15]. Four potential (based on morphological assessment) F. sylvatica populations were sampled in Northwest Greece (Alevitsa, Varnuntas, Aetomilitsa, and Tsepelovo), and two potential F. sylvatica populations were sampled in West Rodopi in Northeast Greece (Frakto, Lepida). Finally, one potential F. orientalis population was sampled in East Rodopi in Northeast Greece (Hilia), and one potential F. orientalis population was sampled in Northwest Turkey (Demirkoy). In each population, leaves from 24 randomly selected individuals, with a minimum distance of 100 m among each other, were sampled. For an easier identification of the populations in the manuscript, we will use the prefixes “Fs” for F. sylvatica and “Fo” for F. orientalis, and the country name will be used as a suffix to indicate the population origin (e.g., “Fo-Duezce-Turkey” for the F. orientalis population Duezce from Turkey).

2.2. DNA Extraction and Genotyping

Total DNA was extracted from dried leaves of the newly sampled populations with the DNeasy 96 Plant Kit (Qiagen, Hilden, Germany). All samples were genotyped at 9 EST-SSR markers (Table S1) obtained from previous studies [18,19]. The primer FS_C4971 was analyzed in a separate PCR, while the other primers were compiled into multiplex reactions (multiplex 1: FgSI0006, FgSI0024, FS_C1968, FS_C2361; multiplex 2: FgSI0009, FS_C7377; multiplex 3: FS_C6785, FS_C7797). The following touchdown PCR program was used for all reactions: an initial denaturation of 95 °C for 15 min, followed by 10 touchdown cycles of 94 °C for 1 min, 60 °C (−1 °C per cycle) for 1 min, and 72 °C for 1 min, 25 cycles of 94 °C for 1 min, 50 °C for 1 min, and 72 °C for 1 min, followed by a final extension step of 72 °C for 20 min. The PCR mix consisted of 1 µL DNA (ca. 0.6 ng/µL), 1.5 µL 10× reaction buffer B (Solis BioDyne, Tartu, Estonia), 1.5 µL MgCl2 (25 mM), 1 µL dNTPs (2.5 mM each dNTP), 0.2 µL (5 U/ µL) HOT FIREPol Taq DNA polymerase (Solis BioDyne, Tartu, Estonia), 0.2 µL (5 picomole/µL) tailed forward primer (a M13-specific sequence (5’-CACGACGTTGTAAACGAC-3’) was added to the 5’ end of the primer [20,21]), 0.5 µL (5 picomole/ µL) PIG-tailed (the sequence 5’- GTTTCTT-3’ was added to the 5‘ end of the primer [22]) reverse primer, 1 µL (5 picomole/µL) dye labeled (6-FAM or 6-HEX) M13 primer, and H2O (filled up to a volume of 12.4 µL). Fragments were separated on an ABI 3130xl Genetic Analyzer (Applied Biosystems, Foster City, USA) using GS 500 ROX (Applied Biosystems, Foster City, USA) as size standard. Allele scoring was conducted with the GeneMapper 4.0 software (Applied Biosystems, Foster City, CA, USA).

2.3. Data Analysis

The GenAlEx 6.5 software [23,24] was used to calculate the number of alleles (Na), the observed heterozygosity (Ho), and the expected heterozygosity (He). Furthermore, the software was used to calculate pairwise GST values [25,26] between populations based on 999 permutations. The inbreeding coefficient (FIS) and allelic richness (AR) were calculated with the FSTAT 2.9.4 software [27]. FIS values were corrected for multiple testing using a sequential Bonferroni correction [28] implemented in FSTAT. The software was further used to test for significant differences in AR, Ho, and He between F. sylvatica populations and F. orientalis populations (excluding the Fo-Hilia-Greece population, since it was revealed to be a hybrid population between the two subspecies) based on 1000 permutations. The presence of null alleles was checked with the MICRO-CHECKER 2.2.3 software [29]. Outlier analyses were performed with the LOSITAN 1.0 software [30] and the BayeScan 2.1 software [31]. For the LOSITAN analysis, the stepwise mutation model, 70,000 simulations, and a false discovery rate (FDR) of 0.05 were used. For the BayeScan analysis, default parameters were selected and loci with a q-value lower than 5% were considered to be outliers. The populations 1.2.32 software [32] was used to generate a neighbor-joining (NJ) dendrogram based on Nei’s genetic distances [33]. Bootstrap values were calculated based on 1000 permutations over loci. The tree was visualized using Tree Explorer implemented in MEGA 7.0.26 [34]. The STRUCTURE 2.3.4 software [35] was used to infer population structure. The admixture model and correlated allele frequencies were selected. A burn-in period of 30,000 and Markov chain Monte Carlo (MCMC) replicates of 100,000 were used. Potential clusters (K) from 1 to 20 were tested using 10 iterations. The Δ K method [36] was used to determine the most likely number of K with the STRUCTURE HARVESTER 0.6.94 program [37]. The CLUMPAK software [38] was employed for summation and graphical representation of the STRUCTURE results.

3. Results

The mean number of alleles (Na) over all populations ranged from 2.6 for marker FS_C6785 to 9.6 for marker FS_C1968 (Table 2). The observed heterozygosity (Ho) ranged from 0.284 for marker FS_C6785 to 0.769 for marker FS_C1968, and the expected heterozygosity (He) ranged from 0.278 for marker FS_C6785 to 0.761 for marker FS_C1968. For no marker, FIS values significantly different from zero were detected (Table 2).
The mean number of alleles (Na) ranged from 3.2 for the Fo-Covakici-Turkey population to 5.2 for the Fo-Demirkoy-Turkey population (Table 3). Mean allelic richness (AR) ranged from 2.9 for the Fs-Goehrde-Germany population to 4.2 for the Fo-Inegoel-Turkey population. The observed heterozygosity (Ho) ranged from 0.421 for the Fs-Goehrde-Germany population and 0.599 for the Fo-Karabuek-Turkey population (mean Ho: 0.515), while the expected heterozygosity (He) ranged from 0.402 for the Fs-Goehrde-Germany population to 0.582 for the Fo-Hilia-Greece population (mean He: 0.498). The mean FIS value was −0.002 over all populations, and FIS was not significantly different from zero in any population (Table 3). Mean genetic diversity indices (AR, Ho, and He) were higher for F. orientalis populations compared to F. sylvatica populations, but only AR was significantly higher in F. orientalis (mean in F. sylvatica: 3.3, mean AR in F. orientalis: 3.7).
Mean pairwise GST was 0.005 among F. sylvatica populations (excluding the two German reference populations), 0.008 among F. orientalis populations (without the potentially admixed Fo-Hilia-Greece population, see below), and 0.122 between F. sylvatica and F. orientalis populations (Table 4). Evidence for null alleles was only detected for markers FS_C1968 and FgSI0009 in population Fo-Hilia-Greece as well as for marker FS_C73377 in population Fo-Catalca-Turkey. Based on LOSITAN, four outlier loci (FgSI0006, FS_C2361, FS_C6785, and _FS_C7377) were detected, potentially under directional selection. With BayeScan, one outlier locus (FS_C1968) was found, which was potentially under balancing or purifying selection. Locus FS_C6785, located in a sequence annotated as a putative ribosomal protein [18], showed a high genetic differentiation between F. sylvatica and F. orientalis (GST: 0.504). The allele 189 at this locus showed a frequency of 0.849 in F. sylvatica, whereas the allele frequency was 0.070 in F. orientalis. The allele 192 showed a much lower frequency in F. sylvatica (0.148) compared to F. orientalis (0.842) (Figure 2). See Figure S1 for an electropherogram showing an example of peaks 189 and 192 of marker Fs_C6785.
The neighbor-joining dendrogram showed a separation between the Turkish populations and the German and Greek populations, with Fo-Hilia-Greece clustering with F. orientalis from Turkey in a basal position (Figure 3). Furthermore, the two West Rodopi populations Fs-Frakto-Greece and Fs-Lepida-Greece grouped together with F. sylvatica populations of North Western Greece.
Similar results were obtained from the STRUCTURE analysis. The Δ K method revealed a most likely number of two clusters (K = 2) (Figure S2), whereby the German and Greek populations formed one cluster and the Turkish populations the second one. The Fo-Hilia-Greece population was not assigned to one of the two clusters and shows a high degree of admixture (Figure 4). The two West Rodopi populations Fs-Frakto-Greece and Fs-Lepida-Greece cluster together with F. sylvatica populations.

4. Discussion

High genetic diversity was revealed for all analyzed beech populations (mean AR: 3.5, mean Ho: 0.515, mean He: 0.498), and no signs of inbreeding were detected. Genetic diversity values were similar to other studies based on EST-SSRs in beech [18,39,40]. Among the diversity indices, only allelic richness (AR) was significantly higher in F. orientalis (mean AR: 3.7) compared to F. sylvatica (mean AR: 3.3). Higher AR in F. orientalis compared to F. sylvatica populations was also found in a previous study based on isozyme markers [12]. Very low genetic differentiation was detected among F. sylvatica populations (mean GST: 0.005) as well as among F. orientalis populations (mean GST: 0.008). Low genetic differentiation among beech populations in southeast Europe was also found by Gömöry et al. [11] based on isozymes (mean GST: 0.019 for Fagus moesiaca, a putative hybrid form between F. sylvatica and F. orientalis). Papageorgiou et al. [9] found a genetic differentiation of GST: 0.089 among beech populations (F. sylvatica and F. orientalis) in the Rodopi Mountains in northeastern Greece based on AFLPs. These results indicate high gene flow levels among populations. As expected, higher genetic differentiation was detected based on maternally inherited cpDNA markers [8,9].
In the present study, substantial genetic differentiation was found between F. orientalis and F. sylvatica (mean GST: 0.122). Even the German reference F. sylvatica populations showed substantially lower differentiation to the Greek F. sylvatica populations (mean GST: 0.025) compared to differentiation values between subspecies (mean GST: 0.167) (Table 4). High genetic differentiation between the two subspecies was also reflected by the NJ dendrogram and the STRUCTURE analysis. In both analyses, two clusters were formed, one comprising F. sylvatica populations and the other one comprising F. orientalis populations. Two Greek populations located in West Rodopi (Fs-Frakto-Greece and Fs-Lepida-Greece), which previous studies based on chloroplast DNA markers have considered as intermediate or closer to F. orientalis [8], clearly group with F. sylvatica in both analyses, indicating that they are actually F. sylvatica. The population Fo-Hilia-Greece could not be assigned to one of the two subspecies. Previous studies have reported a morphological resemblance of trees from this population with F. orientalis [7,9,17]. In the NJ dendrogram, this population is located in an intermediate position between the two clusters, and in the STRUCTURE analysis, it showed a high degree of admixture. Defining individuals with assignment probabilities of ≥0.9 in one cluster as pure species, 0.4 to 0.6 in one cluster as hybrids, and 0.61 to 0.89 as introgressive forms [41], a total of 10 individuals are classified as pure (sub)species, 11 individuals are introgressed forms, and three individuals are hybrids in the population Fo-Hilia-Greece. In combination with intermediate frequencies of F. sylvatica and F. orientalis specific alleles (see below) in this population, these results indicate hybridization between both subspecies. The population is geographically located in East Rodopi, between F. sylvatica populations in the west and F. orientalis populations in the east (Figure 1), making contact via gene flow between the two subspecies very likely. Hybridization between F. sylvatica and F. orientalis has been suggested before for this area [9] and could be confirmed in the present study.
To investigate whether some of the EST-SSRs used in the present study are potentially under selection, outlier analyses were conducted based on grouping of populations into F. sylvatica and F. orientalis. The Fdist approach [42] implemented in the LOSITAN software [30] revealed four loci (FgSI0006, FS_C2361, FS_C6785, and FS_C7377) to be potentially under directional selection, whereas the Bayesian method implemented in the BayeScan software [31] revealed one potential outlier (FS_C1968), with indications of balancing or purifying selection. Thus, both methods revealed contrasting results. Recently, it was shown that FST-heterozygosity outlier methods such as the one implemented in LOSITAN are not working reliably if only few populations are compared [43]. In these cases, other methods such as BayeScan may reveal a lower number of false positive results. In the present study, two pooled demes (F. sylvatica and F. orientalis) were compared with each other, and hence, BayeScan should be the more suitable method in this case. The potential outlier locus (FS_C1968) revealed by BayeScan is located in a sequence annotated as a putative auxin-response protein [18]. Auxin-response factors have been shown to be involved in abiotic adaptation (e.g., precipitation/drought, bud burst) in different tree species [44,45,46,47], and it has been proposed that beech morphology is related to environmental conditions at its growing sites [7,17]. Furthermore, Varsamis et al. [48] detected significant differences in adaptive traits such as bud burst timing and survival under drought conditions between beech populations from West and East Rodopi in a provenance test and a growth chamber experiment. Thus, this locus may be involved in adaptation in F. sylvatica and F. orientalis. Albeit, the LOSITAN results may be inflated by false positive results, the outlier locus Fs_C6785 located in a sequence annotated as a putative ribosomal protein [18], and has not been detected in other outlier or environmental association analyses before, is worth noting. Based on a more relaxed q-value of 12% (compared to 5% used in the present study), this locus would also be revealed as an outlier by BayeScan. The locus showed a high genetic differentiation between F. sylvatica and F. orientalis (GST: 0.504). Strikingly, the allele 189 at this locus showed a high frequency (0.849) in F. sylvatica, whereas the allele frequency was low in F. orientalis (0.070) (Figure 2). In contrast, allele 192 showed a much lower frequency in F. sylvatica (0.148) compared to F. orientalis (0.842). The potential hybrid population Fo-Hilia-Greece showed intermediate frequencies for both alleles (allele 189: 0.458, allele 192: 0.500). Thus, this locus may be involved in genetic differentiation of the two subspecies and could be used as diagnostic marker to discriminate F. sylvatica and F. orientalis.

5. Conclusions

In the present study, we found indications of hybridization between F. sylvatica and F. orientalis in the transition zone of the two subspecies in northeastern Greece. Based on our marker set, it was possible to discriminate both subspecies. One of the markers (Fs_C6785) showed distinct allele frequencies between F. sylvatica and F. orientalis and can be used as a diagnostic marker to distinguish both subspecies. This study might be helpful for future studies to further narrow down the hybrid zone of the two subspecies. Future studies may take advantage of genotyping by sequencing approaches to investigate which genomic regions are involved in differentiation of F. sylvatica and F. orientalis.

Supplementary Materials

The following are available online at https://www.mdpi.com/1424-2818/11/6/90/s1, Figure S1: Electropherogram showing alleles 189 and 192 of EST-SSR locus Fs_C6785, Figure S2: Plots of delta K (a) and log likelihood for each K (b), Table S1: Primer characteristics, data file S1: Genotypic data used in the study.

Author Contributions

Conceptualization, A.C.P., M.M., I.T., and O.G.; methodology, M.M., P.A.L., A.C.P., I.T., and O.G.; validation, M.M., P.A.L., A.C.P., I.T., and O.G.; formal analysis, M.M. and P.A.L.; investigation, M.M. and P.A.L.; resources, O.G. and A.C.P.; data curation, M.M.; writing—original draft preparation, M.M.; writing—review and editing, M.M., P.A.L., A.C.P., I.T., and O.G.; visualization, M.M.; supervision, O.G.; project administration, O.G.; funding acquisition, O.G.

Funding

The APC was funded by the Open Access Grant Program of the German Research Foundation (DFG) and the Open Access Publication Fund of the University of Göttingen.

Acknowledgments

We thank Christine Radler for assistance with the lab work.

Conflicts of Interest

The authors declare no conflict of interest. The funders had no role in the design of the study; in the collection, analyses, or interpretation of data; in the writing of the manuscript, or in the decision to publish the results.

References

  1. Denk, T. The taxonomy of Fagus in western Eurasia, 1: Fagus sylvatica subsporientalis (= F. orientalis). Feddes Repert. 1999, 110, 177–200. [Google Scholar] [CrossRef]
  2. Denk, T. The taxonomy of Fagus in western Eurasia. 2: Fagus sylvatica subsp sylvatica. Feddes Repert. 1999, 110, 381–412. [Google Scholar] [CrossRef]
  3. Renner, S.S.; Grimm, G.W.; Kapli, P.; Denk, T. Species relationships and divergence times in beeches: New insights from the inclusion of 53 young and old fossils in a birth-death clock model. Philos. Trans. R. Soc. B 2016, 371, 20150135. [Google Scholar] [CrossRef] [PubMed]
  4. Gömöry, D.; Paule, L.; Mačejovský, V. Phylogeny of beech in western Eurasia as inferred by approximate Bayesian computation. Acta Soc. Bot. Pol. 2018, 87, 3582. [Google Scholar] [CrossRef]
  5. Euro+Med PlantBase. Available online: http://www.emplantbase.org/home.html (accessed on 20 May 2019).
  6. Denk, T.; Grimm, G.; Stögerer, K.; Langer, M.; Hemleben, V. The evolutionary history of Fagus in western Eurasia: Evidence from genes, morphology and the fossil record. Plant Syst. Evol. 2002, 232, 213–236. [Google Scholar] [CrossRef]
  7. Hatziskakis, S.; Tsiripidis, I.; Papageorgiou, A.C. Leaf morphological variation in beech (Fagus sylvatica L.) populations in Greece and its relation to their post-glacial origin. Bot. J. Linn. Soc. 2011, 165, 422–436. [Google Scholar] [CrossRef]
  8. Hatziskakis, S.; Papageorgiou, A.C.; Gailing, O.; Finkeldey, R. High chloroplast haplotype diversity in Greek populations of beech (Fagus sylvatica L.). Plant Biol. 2009, 11, 425–433. [Google Scholar] [CrossRef]
  9. Papageorgiou, A.C.; Vidalis, A.; Gailing, O.; Tsiripidis, I.; Hatziskakis, S.; Boutsios, S.; Galatsidas, S.; Finkeldey, R. Genetic variation of beech (Fagus sylvatica L.) in Rodopi (N.E. Greece). Eur. J. For. Res. 2008, 127, 81–88. [Google Scholar] [CrossRef]
  10. Gailing, O.; von Wuehlisch, G. Nuclear markers (AFLPs) and chloroplast microsatellites differ between Fagus sylvatica and F. orientalis. Silv. Genet. 2004, 53, 105–110. [Google Scholar] [CrossRef]
  11. Gömöry, D.; Paule, L.; Brus, R.; Zhelev, P.; Tomović, Z.; Gračan, J. Genetic differentiation and phylogeny of beech on the Balkan peninsula. J. Evol. Biol. 1999, 12, 746–754. [Google Scholar] [CrossRef] [Green Version]
  12. Gömöry, D.; Paule, L.; Vyšný, J. Patterns of allozyme variation in western Eurasian Fagus. Bot. J. Linn. Soc. 2007, 154, 165–174. [Google Scholar] [CrossRef]
  13. Magri, D.; Vendramin, G.G.; Comps, B.; Dupanloup, I.; Geburek, T.; Gömöry, D.; Latałowa, M.; Litt, T.; Paule, L.; Roure, J.M.; et al. A new scenario for the quaternary history of European beech populations: Palaeobotanical evidence and genetic consequences. New Phytol. 2006, 171, 199–221. [Google Scholar] [CrossRef] [PubMed]
  14. Von Wuehlisch, G.; Liesebach, M.; Muhs, H.-J.; Stephan, B.R. A Network of International Beech Provenance Trials. In First EUFORGEN Meeting on Social Broadleaves: 23–25 October 1997, Bordeaux, France; Turok, J., Kremer, A., De Vries, S.G.M., Eds.; IPGRI: Bordeaux, France, 1998; pp. 164–172. [Google Scholar]
  15. Seifert, S. Variation of Candidate Genes Related to Climate Change in European Beech (Fagus sylvatica L.). Ph.D. Thesis, University of Göttingen, Göttingen, Germany, 2012. [Google Scholar]
  16. Shorthouse, D. Simple Mappr, an Online Tool to Produce Publication-Quality Point Maps. Available online: http://www.simplemappr.net (accessed on 02 April 2019).
  17. Tsiripidis, I.; Athanasiadis, N. Contribution to the knowledge of the vascular flora of NE Greece: Floristic composition of the beech (Fagus sylvatica L.) forests in the Greek Rodopi. Willdenowia 2003, 33, 273–297. [Google Scholar] [CrossRef]
  18. Burger, K.; Müller, M.; Gailing, O. Characterization of EST-SSRs for European beech (Fagus sylvatica L.) and their transferability to Fagus orientalis Lipsky, Castanea dentata Bork., and Quercus rubra L. Silv. Genet. 2018, 67, 127–132. [Google Scholar] [CrossRef]
  19. Kubisiak, T.; Carey, D.; Burdine, C.; Koch, J. Characterization of ten EST-based polymorphic SSR loci isolated from American beech, Fagus grandifolia Ehrh. Permanent genetic resources note added to Molecular Ecology Resources. Mol. Ecol. Resour. 2009, 9, 1460–1466. [Google Scholar] [CrossRef]
  20. Kubisiak, T.L.; Nelson, C.D.; Staton, M.E.; Zhebentyayeva, T.; Smith, C.; Olukolu, B.A.; Fang, G.C.; Hebard, F.V.; Anagnostakis, S.; Wheeler, N.; et al. A transcriptome-based genetic map of Chinese chestnut (Castanea mollissima) and identification of regions of segmental homology with peach (Prunus persica). Tree Genet. Genomes 2013, 9, 557–571. [Google Scholar] [CrossRef]
  21. Schuelke, M. An economic method for the fluorescent labeling of PCR fragments. Nat. Biotechnol. 2000, 18, 233–234. [Google Scholar] [CrossRef] [PubMed]
  22. Brownstein, M.J.; Carpten, J.D.; Smith, J.R. Modulation of non-templated nucleotide addition by Taq DNA polymerase: Primer modifications that facilitate genotyping. BioTechniques 1996, 20, 1004–1006. [Google Scholar] [CrossRef] [PubMed]
  23. Peakall, R.; Smouse, P.E. Genalex 6: Genetic analysis in Excel. Population genetic software for teaching and research. Mol. Ecol. Notes 2006, 6, 288–295. [Google Scholar] [CrossRef]
  24. Peakall, R.; Smouse, P.E. GenAlEx 6.5: Genetic analysis in Excel. Population genetic software for teaching and research—An update. Bioinformatics 2012, 28, 2537–2539. [Google Scholar] [CrossRef] [PubMed]
  25. Nei, M.; Chesser, R.K. Estimation of fixation indices and gene diversities. Ann. Hum. Genet. 1983, 47, 253–259. [Google Scholar] [CrossRef] [PubMed]
  26. Meirmans, P.G.; Hedrick, P.W. Assessing population structure: F(ST) and related measures. Mol. Ecol. Resour. 2011, 11, 5–18. [Google Scholar] [CrossRef] [PubMed]
  27. Goudet, J. FSTAT (Version 1.2): A computer program to calculate F-statistics. J. Hered. 1995, 86, 485–486. [Google Scholar] [CrossRef]
  28. Rice, W.R. Analyzing tables of statistical tests. Evolution 1989, 43, 223–225. [Google Scholar] [CrossRef] [PubMed]
  29. Van Oosterhout, C.; Hutchinson, W.F.; Wills, D.P.M.; Shipley, P. MICRO-CHECKER: Software for identifying and correcting genotyping errors in microsatellite data. Mol. Ecol. Notes 2004, 4, 535–538. [Google Scholar] [CrossRef]
  30. Antao, T.; Lopes, A.; Lopes, R.J.; Beja-Pereira, A.; Luikart, G. LOSITAN: A workbench to detect molecular adaptation based on a Fst-outlier method. BMC Bioinform. 2008, 9, 323. [Google Scholar] [CrossRef] [PubMed]
  31. Foll, M.; Gaggiotti, O. A genome-scan method to identify selected loci appropriate for both dominant and codominant markers: A Bayesian perspective. Genetics 2008, 180, 977–993. [Google Scholar] [CrossRef]
  32. Langella, O. Populations Version 1.2.32. Available online: http://www.bioinformatics.org/project/?group_id=84 (accessed on 13 March 2019).
  33. Nei, M. Genetic distance between populations. Am. Nat. 1972, 106, 283–292. [Google Scholar] [CrossRef]
  34. Kumar, S.; Stecher, G.; Tamura, K. MEGA7: Molecular evolutionary genetics analysis version 7.0 for bigger datasets. Mol. Biol. Evol. 2016, 33, 1870–1874. [Google Scholar] [CrossRef]
  35. Pritchard, J.K.; Stephens, M.; Donnelly, P. Inference of population structure using multilocus genotype data. Genetics 2000, 155, 945–959. [Google Scholar]
  36. Evanno, G.; Regnaut, S.; Goudet, J. Detecting the number of clusters of individuals using the software STRUCTURE: A simulation study. Mol. Ecol. 2005, 14, 2611–2620. [Google Scholar] [CrossRef]
  37. Earl, D.A.; vonHoldt, B.M. STRUCTURE HARVESTER: A website and program for visualizing STRUCTURE output and implementing the Evanno method. Conserv. Genet. Resour. 2012, 4, 359–361. [Google Scholar] [CrossRef]
  38. Kopelman, N.M.; Mayzel, J.; Jakobsson, M.; Rosenberg, N.A.; Mayrose, I. CLUMPAK: A program for identifying clustering modes and packaging population structure inferences across K. Mol. Ecol. Resour. 2015, 15, 1179–1191. [Google Scholar] [CrossRef] [PubMed]
  39. Rajendra, K.C.; Seifert, S.; Prinz, K.; Gailing, O.; Finkeldey, R. Subtle human impacts on neutral genetic diversity and spatial patterns of genetic variation in European beech (Fagus sylvatica). For. Ecol. Manag. 2014, 319, 138–149. [Google Scholar] [CrossRef]
  40. Dounavi, A.; Netzer, F.; Celepirovic, N.; Ivanković, M.; Burger, J.; Figueroa, A.G.; Schön, S.; Simon, J.; Cremer, E.; Fussi, B.; et al. Genetic and physiological differences of European beech provenances (F. sylvatica L.) exposed to drought stress. For. Ecol. Manag. 2016, 361, 226–236. [Google Scholar] [CrossRef]
  41. Lind, J.F.; Gailing, O. Genetic structure of Quercus rubra L. and Quercus ellipsoidalis E. J. Hill populations at gene-based EST-SSR and nuclear SSR markers. Tree Genet. Genomes 2013, 9, 707–722. [Google Scholar] [CrossRef]
  42. Beaumont, M.A.; Nichols, R.A. Evaluating loci for use in the genetic analysis of population structure. Proc. R. Soc. B 1996, 263, 1619–1626. [Google Scholar] [CrossRef]
  43. Flanagan, S.P.; Jones, A.G. Constraints on the FST–heterozygosity outlier approach. J. Hered. 2017, 108, 561–573. [Google Scholar] [CrossRef]
  44. Modesto, I.S.; Miguel, C.; Pina-Martins, F.; Glushkova, M.; Veloso, M.; Paulo, O.S.; Batista, D. Identifying signatures of natural selection in cork oak (Quercus suber L.) genes through SNP analysis. Tree Genet. Genomes 2014, 10, 1645–1660. [Google Scholar] [CrossRef]
  45. Homolka, A.; Schueler, S.; Burg, K.; Fluch, S.; Kremer, A. Insights into drought adaptation of two European oak species revealed by nucleotide diversity of candidate genes. Tree Genet. Genomes 2013, 9, 1179–1192. [Google Scholar] [CrossRef]
  46. Derory, J.; Leger, P.; Garcia, V.; Schaeffer, J.; Hauser, M.T.; Salin, F.; Luschnig, C.; Plomion, C.; Glossl, J.; Kremer, A. Transcriptome analysis of bud burst in sessile oak (Quercus petraea). New Phytol. 2006, 170, 723–738. [Google Scholar] [CrossRef] [PubMed]
  47. Müller, M.; Gailing, O. Abiotic genetic adaptation in the Fagaceae. Plant Biol. 2019. [Google Scholar] [CrossRef] [PubMed]
  48. Varsamis, G.; Papageorgiou, A.C.; Merou, T.; Takos, I.; Malesios, C.; Manolis, A.; Tsiripidis, I.; Gailing, O. Adaptive diversity of beech seedlings under climate change scenarios. Front. Plant Sci. 2019, 9, 1918. [Google Scholar] [CrossRef] [PubMed]
Figure 1. Locations of the sampled populations in Greece and Turkey. The German reference populations are not shown. The map was generated with SimpleMappr [16].
Diversity 11 00090 g001
Figure 2. Frequencies of alleles 189 and 192 of locus Fs_C6785 for the different populations.
Diversity 11 00090 g002
Figure 3. Neighbor-joining (NJ) dendrogram for all populations. Bootstrap values ≥ 50 are shown.
Diversity 11 00090 g003
Figure 4. Clustering of individuals for K = 2.
Diversity 11 00090 g004
Table 1. Population characteristics.
Population NameOriginNo. of SamplesSubspeciesLatitudeLongitude
CalvoerdeGermany24F. sylvatica52.40396711.261017
GoehrdeGermany24F. sylvatica53.12298310.820400
AetomilitsaGreece24F. sylvatica **40.27295820.813221
TsepelovoGreece24F. sylvatica **39.88282620.876105
AlevitsaGreece24F. sylvatica **40.43211620.963033
VarnuntasGreece24F. sylvatica **40.80659221.328064
FraktoGreece24F. sylvatica **41.54545524.523565
LepidaGreece24F. sylvatica **41.38626924.621609
HiliaGreece24F. orientalis **41.30219525.934421
DemirkoyTurkey24F. orientalis **41.81999627.662091
CatalcaTurkey *10F. orientalis41.46667028.350000
InegoelTurkey *10F. orientalis39.88333029.600000
IzmitTurkey *10F. orientalis40.56667029.950000
DuezceTurkey *10F. orientalis40.85000031.150000
CovakiciTurkey *10F. orientalis41.05000031.283330
KarabuekTurkey *10F. orientalis41.28333032.533330
* Samples were obtained from a provenance trial in Germany (see Materials and Methods). ** Based on morphological assessment [9,17].
Table 2. Mean genetic diversity indices over all populations for each marker.
MarkerNNaHoHeFISGST
FgSI000618.63.00.3450.3490.0290.244 *
FgSI002418.64.60.5890.6000.0570.014
FS_C196818.49.60.7690.7610.0190.032 *
FS_C236118.43.80.5640.534−0.0320.118 *
FgSI000917.43.00.4470.4730.0850.099 *
FS_C678518.72.60.2840.2780.0120.469 *
FS_C737718.63.20.5210.509−0.0060.158 *
FS_C779718.53.60.4150.346−0.1450.016 *
FS_C497118.75.10.7060.636−0.0780.095 *
Mean18.44.30.5150.498−0.0070.132 *
N—number of individuals, Na—number of alleles, Ho—observed heterozygosity, He—expected heterozygosity, FIS—inbreeding coefficient, GST—fixation index (* p < 0.05).
Table 3. Sample size and mean genetic diversity indices for all populations.
PopulationNNaARHoHeFIS
Fs-Calvoerde-Germany243.83.10.5000.464−0.056
Fs-Goehrde-Germany243.42.90.4210.402−0.026
Fs-Aetomilitsa-Greece245.03.50.5510.528−0.022
Fs-Tsepelovo-Greece244.23.40.5160.5190.028
Fs-Alevitsa-Greece244.43.30.5060.4990.009
Fs-Varnuntas-Greece244.83.40.5270.512−0.007
Fs-Frakto-Greece244.73.30.5320.503−0.034
Fs-Lepida-Greece244.13.40.4850.5460.133
Fo-Hilia-Greece244.83.80.5630.5820.053
Fo-Demirkoy-Turkey245.23.70.5690.500−0.117
Fo-Catalca-Turkey103.93.70.4600.4720.079
Fo-Inegoel-Turkey104.44.20.4680.5120.143
Fo-Izmit-Turkey104.23.90.5430.490−0.054
Fo-Duezce-Turkey104.03.80.5580.500−0.062
Fo-Covakici-Turkey103.23.10.4470.421−0.002
Fo-Karabuek-Turkey104.03.80.5990.522−0.094
Mean18.84.33.50.5150.498−0.002
N—number of individuals, Na—number of alleles, AR—allelic richness, Ho—observed heterozygosity, He—expected heterozygosity, FIS—inbreeding coefficient.
Table 4. Pairwise GST values between populations.
PopulationsFs-Calvoerde-GermanyFs-Goehrde-GermanyFs-Aetomilitsa-GreeceFs-Tsepelovo-GreeceFs-Alevitsa-GreeceFs-Varnuntas-GreeceFs-Frakto-GreeceFs-Lepida-GreeceFo-Hilia-GreeceFo-Demirkoy-TurkeyFo-Catalca-TurkeyFo-Inegoel-TurkeyFo-Izmit-TurkeyFo-Duezce-TurkeyFo-Covakici-TurkeyFo-Karabuek-Turkey
Fs-Calvoerde-Germany0.000
Fs-Goehrde-Germany0.0160.000
Fs-Aetomilitsa-Greece0.0140.0390.000
Fs-Tsepelovo-Greece0.0140.0260.001 +0.000
Fs-Alevitsa-Greece0.0150.0460.000 +0.0100.000
Fs-Varnuntas-Greece0.0090.0320.003 +0.001 +0.0060.000
Fs-Frakto-Greece0.0090.0320.004 +0.002 +0.0120.005 +0.000
Fs-Lepida-Greece0.0200.0430.005 +0.0090.0130.0100.000 +0.000
Fo-Hilia-Greece0.0730.1040.0540.0470.0690.0620.0390.0350.000
Fo-Demirkoy-Turkey0.1500.1900.1250.1210.1430.1400.1160.1060.0190.000
Fo-Catalca-Turkey0.1590.2050.1190.1200.1390.1410.1140.0990.0240.0130.000
Fo-Inegoel-Turkey0.1240.1580.1110.1030.1270.1210.1010.0970.0180.006 +0.0190.000
Fo-Izmit-Turkey0.1390.1830.1150.1120.1360.1310.1020.0920.0120.004 +0.000 +0.000 +0.000
Fo-Duezce-Turkey0.1370.1720.1170.1150.1360.1360.1060.0920.0150.002 +0.017 +0.000 +0.000 +0.000
Fo-Covakici-Turkey0.1850.2310.1520.1450.1770.1680.1440.1360.0340.001 +0.010 +0.011 +0.005 +0.014 +0.000
Fo-Karabuek-Turkey0.1360.1730.1140.1030.1290.1260.1090.1060.0240.0150.0170.009 +0.013 +0.014 +0.004 +0.000
+ Not significant (p ≥ 0.05); all other GST values are significant (p < 0.05).

