Article

Differences in Bacterial Diversity, Composition and Function due to Long-Term Agriculture in Soils in the Eastern Free State of South Africa

1
Department of Plant and Soil Sciences, University of Pretoria, Private Bag X20, Hatfield, Pretoria 0083, South Africa
2
Department of Microbial, Biochemical and Food Biotechnology, University of the Free State, P.O. Box 339, Bloemfontein 9300, South Africa
3
Department of Biochemistry, Genetics, and Microbiology, University of Pretoria, Private Bag X20, Hatfield, Pretoria 0083, South Africa
*
Author to whom correspondence should be addressed.
Diversity 2019, 11(4), 61; https://doi.org/10.3390/d11040061
Submission received: 5 March 2019 / Revised: 11 April 2019 / Accepted: 13 April 2019 / Published: 17 April 2019

Abstract

:
Land-use change from natural to managed agricultural ecosystems significantly impacts soil bacterial diversity and function. The Eastern Free State (EFS) is one of the most productive agricultural regions in South Africa. However, no studies aiming to understand the changes in bacterial diversity, composition and function due to land-use change in this area have been conducted. This study investigated, using high-throughput 16S rRNA gene amplicon sequencing, the effects of long-term agriculture on bacterial diversity, composition and putative function in the EFS by comparing microbiomes from lands that have been under agronomic activity for over 50 years to those from uncultivated land. Results indicate that agriculture increased bacterial diversity. Soil chemical analysis showed that land-use shifted soils from being oligotrophic to copiotrophic, which changed bacterial communities from being Actinobacteria dominated to Proteobacteria dominated. Predictive functional analysis using Phylogenetic Investigation of Communities by Reconstruction of Unobserved States (PICRUSt) suggested that agricultural soil was abundant in genes associated with plant fitness and plant growth promotion, while non-agricultural soil was abundant in genes related to organic matter degradation. Together, these results suggest that edaphic factors induced by long-term agriculture resulted in shifts in bacterial diversity and putative function in the EFS.

1. Introduction

The global human population is expected to reach 10 billion by 2050 [1] and it has been projected that crop production must double in the next 50 years to face growing food demand and bioenergy needs [2]. The South African population, currently estimated at 57.7 million [3], is increasing at a rate of 2% per year and is expected to reach 82 million by 2035 [4], therefore presenting a threat to food security. This has resulted in an increase in land-use for food production in areas such as the Eastern Free State (EFS). The agricultural production area in the EFS increased from 11,321,192 ha in 1993 [5] to 12,945,800 ha in 2017 [6].
The Eastern Free State is one of the greatest contributors to agriculture in South Africa and is part of the “granary” or “breadbasket” of South Africa [7]. The EFS region is characterized by good soils and reliable rainfall, making it one of the most productive regions in South Africa, producing a wide range of crops [8]. The area falls under the cold interior climatic zone with a cold semi-arid climate and an aridity index of 0.2–0.5 [9]. The mean annual precipitation ranges 600–800 mm with an average daily temperature of 20–22 °C. To maximize yield in different crops, agronomic practices such as fertilization, conventional tillage and use of pesticides are common features of the Eastern Free State’s intensive farming regime [9]. However, there is concern regarding the effects of these agronomic practices on soil physical and chemical properties and health, particularly in relation to bacterial diversity and function.
Great attention is currently being given to adopting sustainable land-use practices that can reduce land degradation [10]. Globally, land under agricultural production has increased by 12%, and this has been associated with a decline in area under tropical forests and natural grasslands, especially in developing countries [11]. This reduction in natural habitats has largely been driven by agriculture for food production. Understanding the environmental effects of land-use conversion from natural habitats to intensively managed agricultural systems, specifically on bacterial communities that drive significant biogeochemical processes, is important for sustainable crop production. A few studies on soil microbiota have demonstrated the impact of agronomic practices on bacterial communities [12,13,14,15], made possible through advances in high-throughput sequencing [16,17]. These studies were conducted in temperate regions and in irrigated fields. However, no studies have been published on the impact of long-term agriculture on soil bacterial diversity and function in the semi-arid region of South-Africa where dry land cropping is practiced.
This study aimed to provide new insights into the long-term impact of agriculture on soil bacterial diversity and function using high-throughput sequencing. Specifically, the aim was to investigate differences in bacterial community structure and putative function in the EFS between uncultivated soil and soil under intensive agriculture, using 16S rRNA sequencing. To our knowledge, no work has been done to evaluate the effects of agronomic practices on the soil microbiota in the EFS. A previous ecological study in this region focused only on comparing conservation farming and no-tillage as sustainable practices [9].

2. Materials and Methods

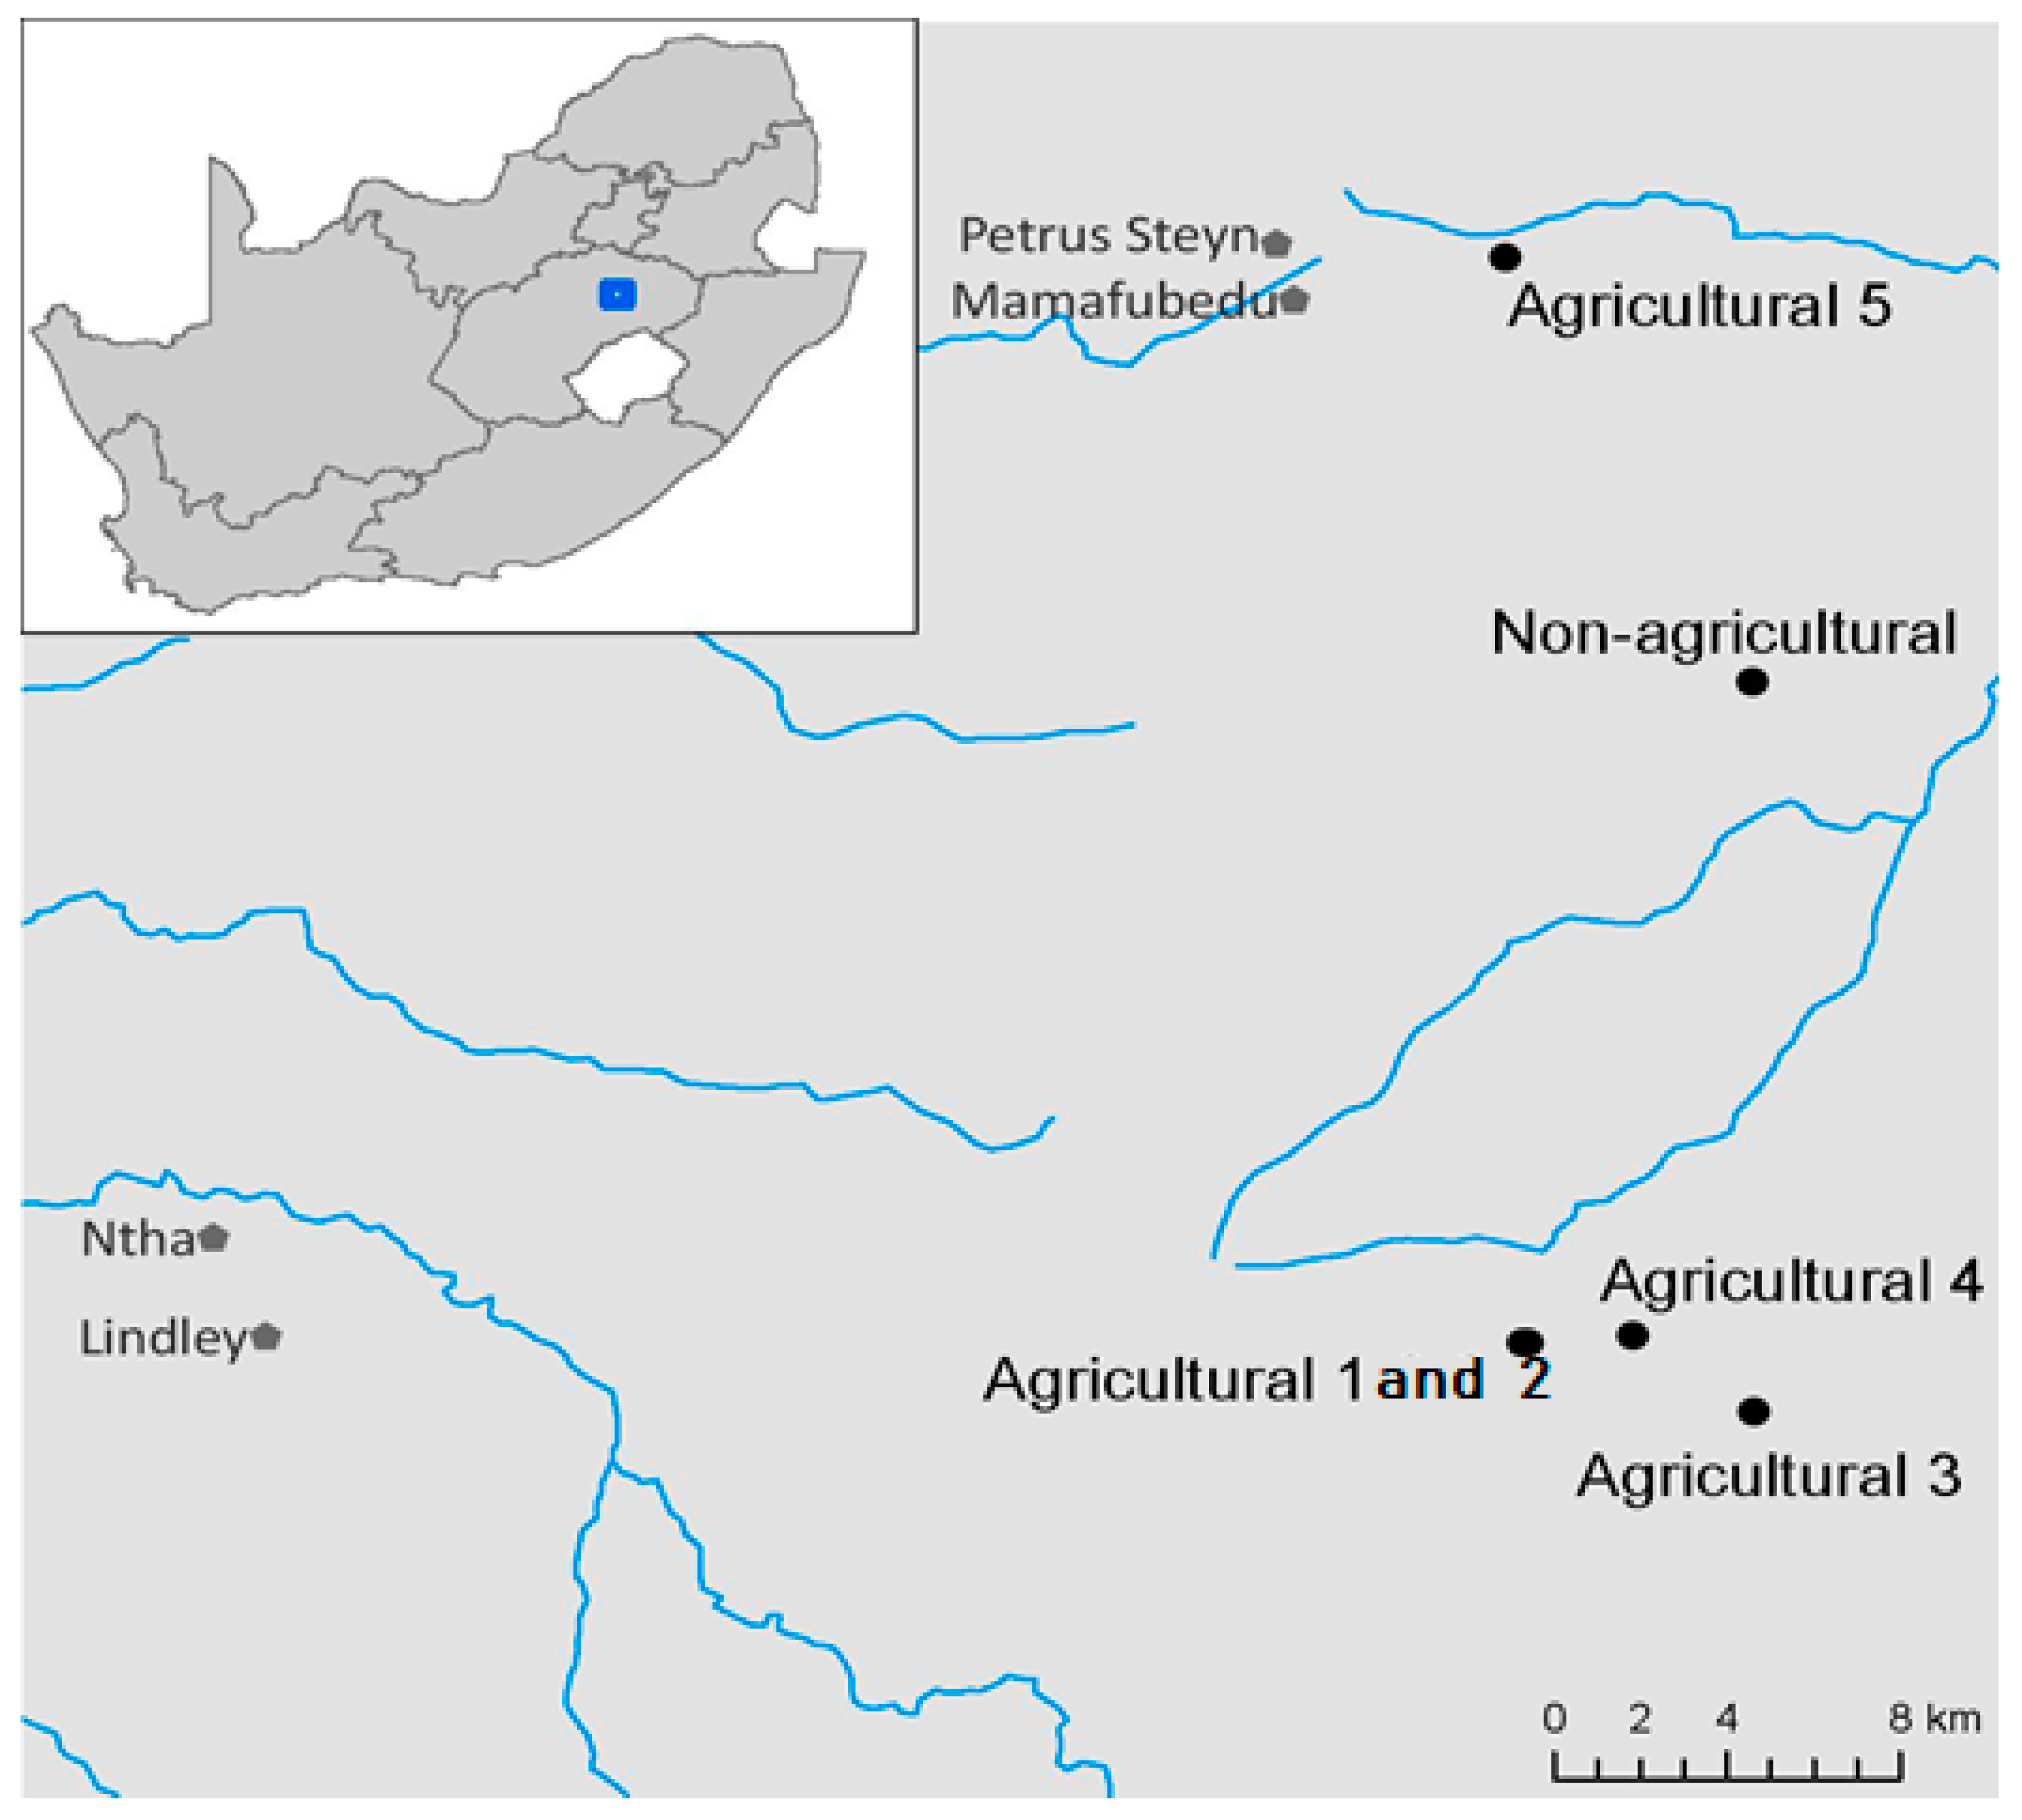
2.1. Site Description and Sampling

Soil samples were collected in August 2016 from six locations (from 10 m to 21 km apart) in the EFS farming area (Figure 1). Soil samples were collected from five fields with at least 50 years of agricultural history and one location with its natural flora representing uncultivated, non-agricultural land. At the time of sample collection, no crops were present in the agricultural fields. The natural flora in the non-agricultural location comprised 20% trees, 70% grass and 10% shrubs. Sampling and processing equipment were sterilized with 10% sodium hypochlorite and rinsed in distilled water between each sampling location. The agricultural fields ranged in size from 6 to 10 ha and the non-agricultural field was approximately 0.5 ha. Forty samples were collected at 20 m spacings in each agricultural field and at 2 m spacings in the non-agricultural site in a classical W-shaped pattern. Distances were closer in the non-agricultural location because the total field area was smaller than the agricultural fields. From the 40 samples, composite samples were made by pooling every 10 samples, resulting in four composite samples for each agricultural field and non-agricultural site. Therefore, a total of 20 agricultural (four composite samples x five fields) and 20 non-agricultural soil samples were collected and sent for Illumina sequencing. All soil samples (approximately 1.7 kg) were collected using a 10 cm diameter soil auger at a depth of 0–15 cm. Soil samples were stored at −80 °C within 24 h of sampling until further processing.

2.2. Soil Chemical Analyses

From each agricultural site, 10 soil samples, approximately 1.7 kg each and randomly collected from a sampling depth of 15 cm with the aid of a 10 cm diameter soil auger, were collected for chemical analysis. The 10 soil samples were combined to form a composite sample for chemical analysis for each sampling location. For the non-agricultural site, 10 soil cores, also approximately 1.7 kg each, were collected for soil chemical analysis at each subplot from a sampling depth of 15 cm with the aid of a 10 cm diameter soil auger. The 10 soil samples per non- agricultural subplot were also pooled to form a composite sample for chemical analysis. A total of ten soil samples (five agricultural and five non-agricultural) were submitted for soil chemical analyses. Soil chemical analyses were conducted in the analytical laboratory of the Department of Plant and Soil Sciences, University of Pretoria, South Africa, using standard protocols [18,19]. Basic soil parameters (pH, total C, P, N, Ca, Mg, Na and organic matter) were determined for each location. Soil pH was determined using the 1:1 water ratio method [20].

2.3. DNA Extraction

Total genomic DNA of each sample was extracted from 1 g of soil using the Mo Bio PowerSoil® DNA Isolation Kit (Carlsbad, CA, USA) according to the manufacturer’s recommendations. DNA was quantified using the Qubit 2.0 fluorometer (Invitrogen, Life Technologies, Carlsbad, CA, USA) and the quality was checked on a 1% agarose gel stained with Lonza Gel Stain, run at 90 V for 45 min and visualized on a Gel Doc XR system (Bio-Rad, Pleasanton, CA, USA). The DNA was stored at −20 °C until further analysis.

2.4. 16S rRNA Gene Sequencing

Sequencing was performed at MRDNA (www.mrdnalab.com, Shallowater, TX, USA) using the Illumina MiSeq workflow following the manufacturer’s guidelines. The Illumina (2 × 250 bp) tailed polymerase chain reaction (PCR) approach was used to generate amplicon libraries. Amplicons from different samples were mixed in equal concentrations and purified using Agencourt Ampure beads (Agencourt Bioscience Corporation, USA). The V4 variable region of 16S rRNA gene was amplified using PCR primer pair 515F (5′-GTGYCAGCMGCCGCGGRA-3′) and 806R (5′-CCCCGYCAATTCMTTTRAG-3′) [21]. The forward primer was tagged with a barcode and used in a 28 cycle PCR (5 cycle used on PCR products) using the HotStarTaq Plus Master Mix Kit (Qiagen, USA) under the following conditions: 94 °C for 3 min, followed by 28 cycles of 94 °C for 30 s, 53 °C for 40 s and 72 °C for 1 min, after which a final elongation step at 72 °C for 5 min was performed. PCR products were confirmed on a 2% agarose gel and samples with 200 bp amplicons were purified using calibrated Ampure XP beads. The purified PCR products were used to prepare a DNA library by following the Illumina TruSeq DNA library preparation protocol.

2.5. 16S Amplicon Analysis

Sequence data were processed using the Quantitative Insights into Microbial Ecology (QIIME) software version 1.9.1 [21]. The sequences were joined, and barcodes removed, and sequences of less than 200 bp or with more than two ambiguous base calls were also removed. Quality trimming was performed for all sequences greater than 200 bp by removing all sequences with quality scores less than 25 or containing more than one mismatch to the sample-specific barcode or to the primer sequences. Chimeric sequences and sequences with homopolymer runs exceeding 6 bp were also removed. OTUs were selected at 3% divergence (97% similarity level) using USEARCH v6.1 [22]. All bacterial taxonomies were assigned to an OTU using the RDP Naïve Bayesian Classifier [23] with the SILVA-ARB database (release 123). Final OTUs were taxonomically classified using BLASTn against a curated database derived from GreenGenes, RDPII and NCBI (www.ncbi.nlm.nih.gov; [24]; http://rdp.cme.msu.edu) and all unassigned OTUs at phylum level were removed for downstream analyses. All samples were rarefied to the same number of sequences (183,613) per sample, and a total of 40 (20 agricultural and 20 non-agricultural) samples were used for downstream analysis.

2.6. Bacterial Community Analysis

Alpha diversity parameters (richness, Shannon and Simpson’s Diversity index) were calculated using the vegan R package [25,26]. The Simpson’s Index of Diversity (1-D) was calculated by the R-vegan package, where D = sum p_i2 and p_i is the proportional abundance of species (OTUs) i. The observed differences in the Simpson index were not statistically significant. ACE and Chao1 parameters were calculated using Visual and Analysis of Microbial Population Structures (VAMPS) [27]. Analysis of variance (ANOVA) was carried out to determine significant differences in bacterial diversity and soil chemistry between agricultural and non-agricultural soil using the phia package [28]. Analysis of similarity (ANOSIM) was applied to determine significant differences in bacterial diversity and soil chemistry. Soil chemistry data were standardized and pair-wise distances computed based on Euclidean distances. Community data matrices were Hellinger-transformed, and the Bray–Curtis distance measure was used to generate a dissimilarity matrix. Weighted and unweighted UniFrac1 dissimilarities were also obtained [29]. Bacterial community structure and the environmental variables were visualized using Principal Component Analysis (PCA) plots generated using ClustVis [30]. PCA was used to explain the effect of environmental factors on variations observed in bacterial communities. Environmental variables that contributed to the variation in community composition were selected for further analysis. The Adonis function in Vegan was used to assess factors that contributed to differences in bacterial community composition for each habitat or land use type. The average relative abundance and frequency of occurrence values of each phylum across each sample type were plotted as a sunburst pie chart in Krona [31], to infer putative ecological relevance. Rarefaction curves were also constructed in VAMPS [27]

2.7. Community Gene Function Prediction

Functional inferences were performed according to the Phylogenetic Investigation of Communities by Reconstruction of Unobserved States (PICRUSt) [29]. Metagenomic inferences were done using the taxonomy generated from the GreenGenes database [24,32]. The OTU table was normalized based on the predicted 16S copy number for each organism in the OTU table using the normalize_by_copy_number.py script. Functional predictions of Kyoto Encyclopedia of Genes and Genomes (KEGG) Ortholog (KOs) were performed using the normalized OTU table as input. KOs were then categorized by function to collapse all KOs to the respective KEGG pathways. The contribution of each OTU to a given gene function was then estimated by multiplying OTU abundances by the set of gene abundances for each taxon. The resulting annotated table of predicted gene family counts for each sample was then visualized in Statistical Analysis of Metagenomic Profiles (STAMP) using Microbiome Helper. All predictions were subjected to a multiple test correction using the Benjamin–Hochberg FDR at a q-value filter of <0.05. Additionally, weighted nearest sequenced taxon index (NSTI) values were computed from metagenomic data using the -a option in the predict_metagenonmes.py script [33]. NSTI scores are a quality control measure that is used to validate the accuracy of functional annotations by quantifying the availability of nearby genome representatives for each microbiome sample [34].

3. Results

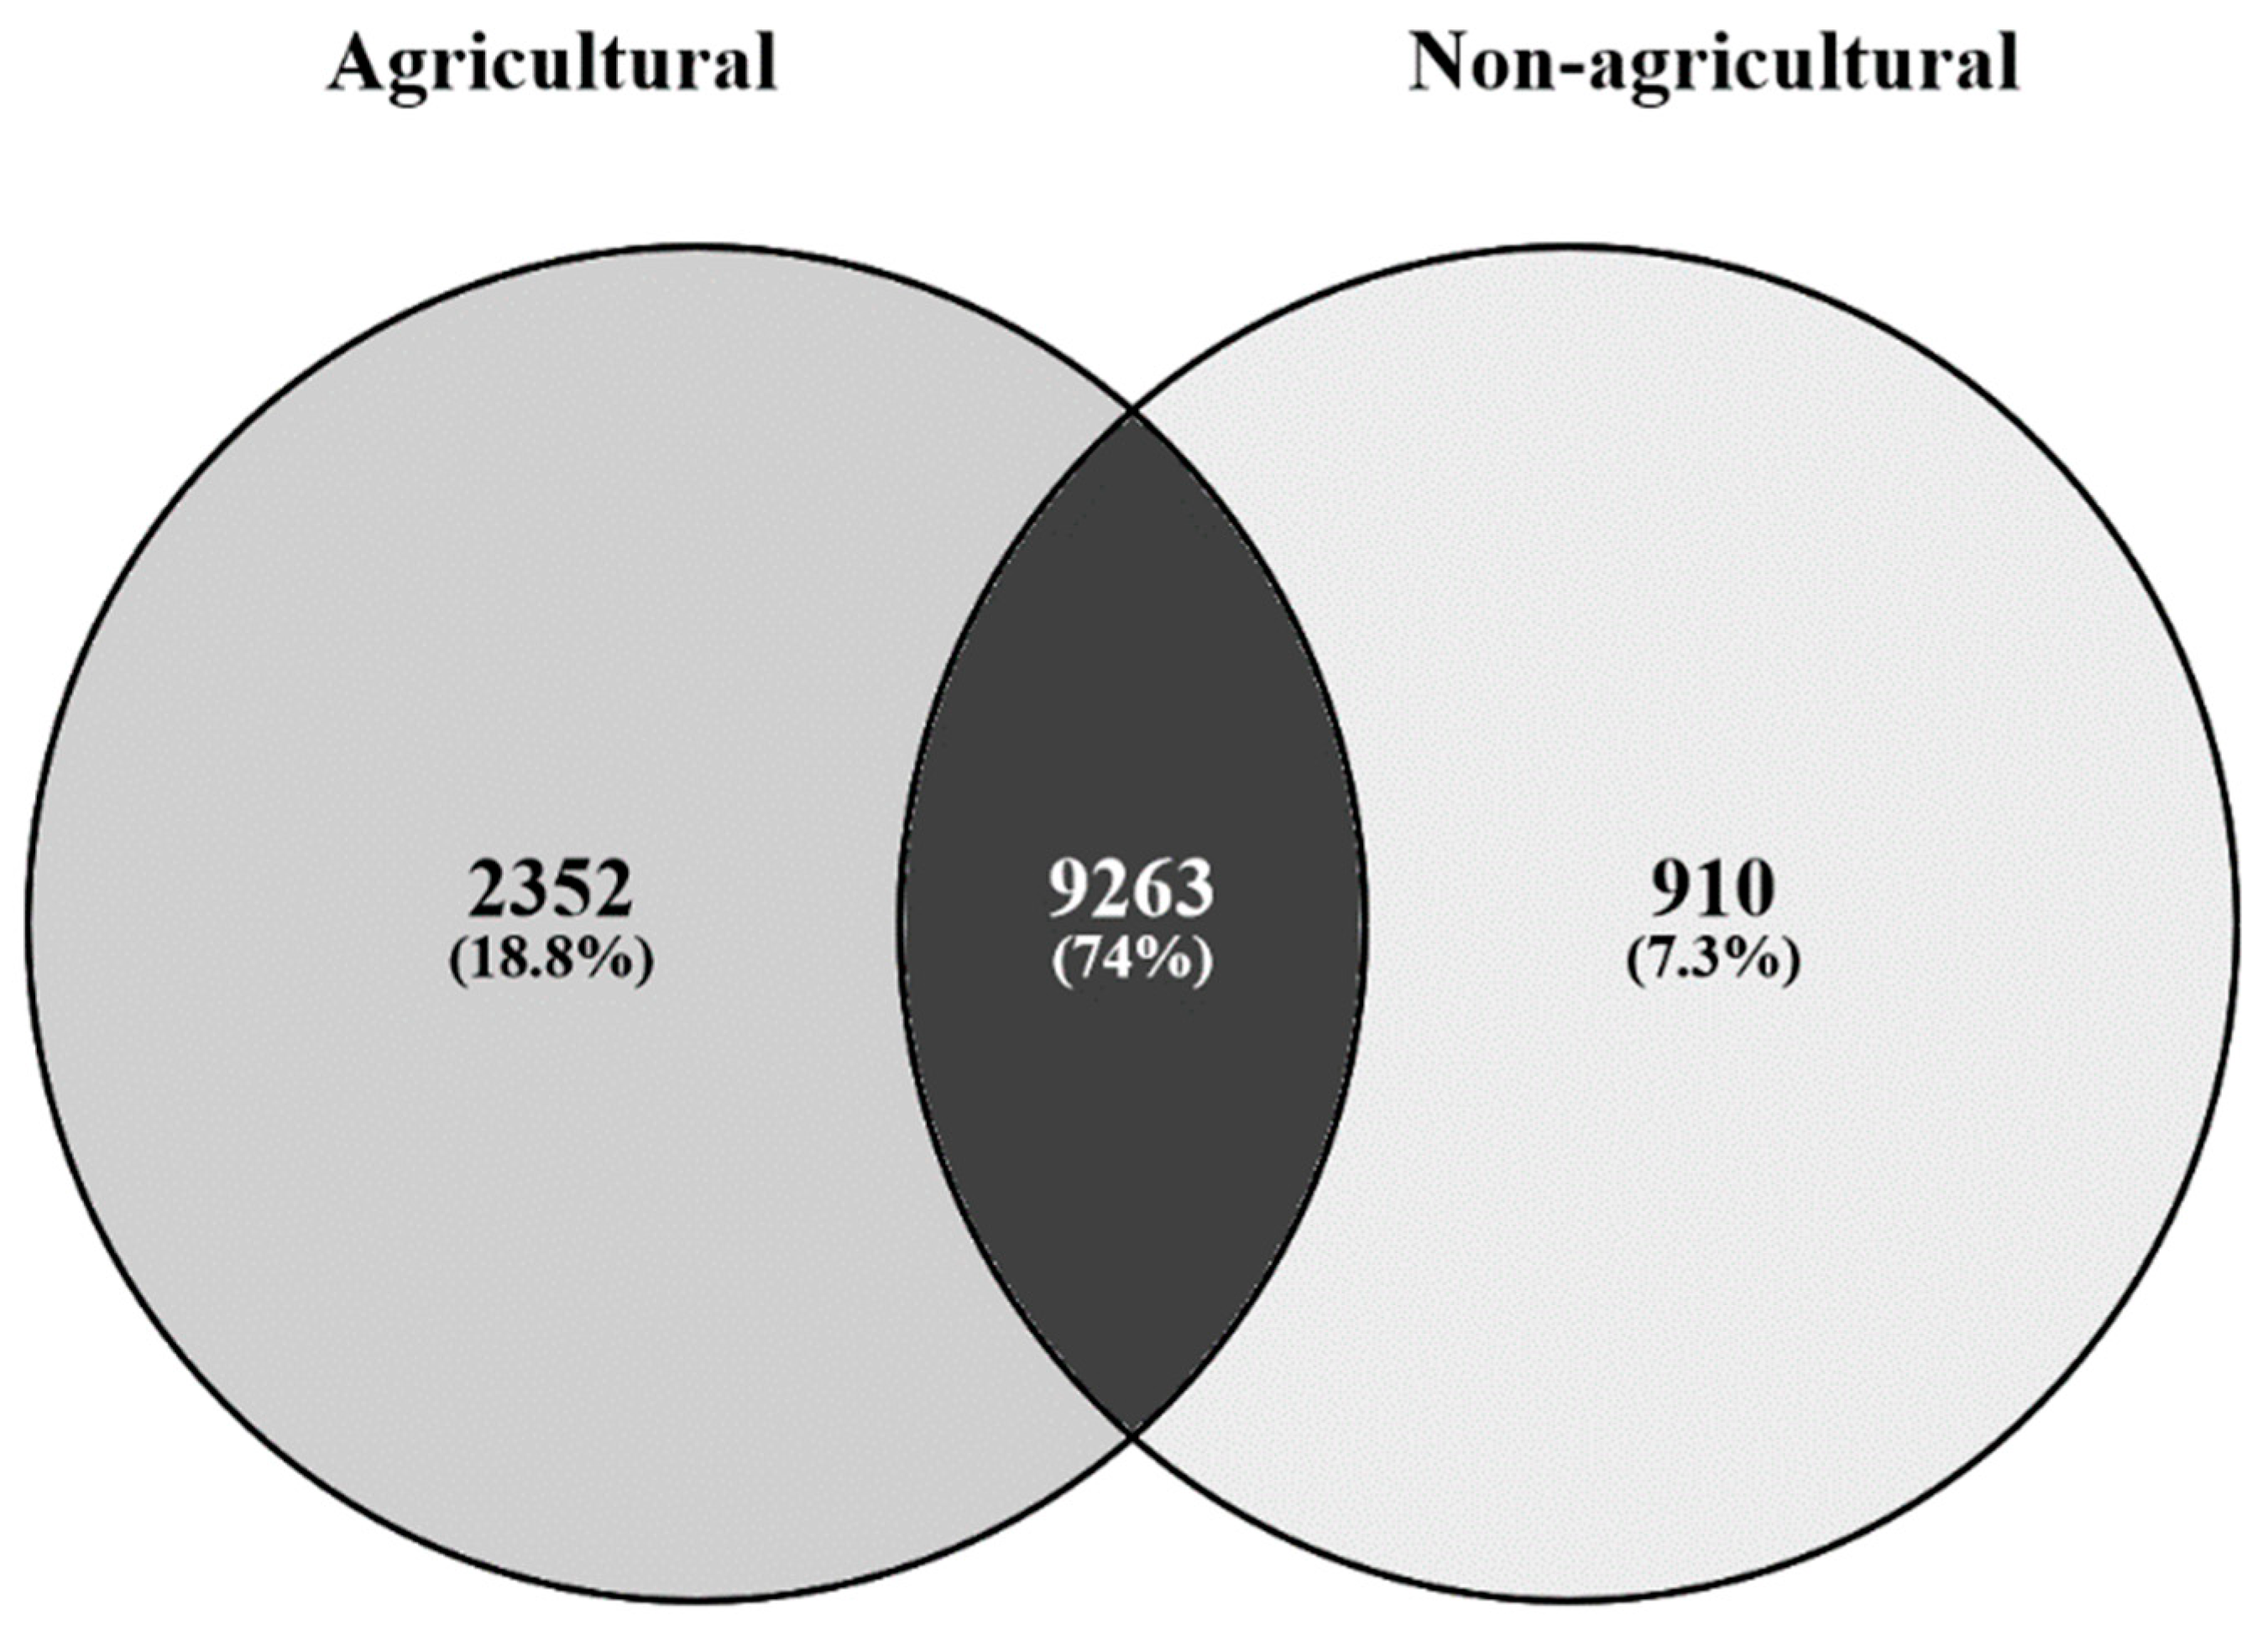
3.1. Bacterial Communities from Agricultural and Non-Agricultural Soils

A total of 7,344,520 high-quality 16S rRNA gene amplicon sequences were recovered after pair-end alignments, quality filtering and removal of chimeric sequences and singletons. Sequences were assigned to 11,615 OTUs. The six most abundant bacterial phyla across all samples were Proteobacteria (39%), Actinobacteria (27%), Bacteroidetes (10%), Chloroflexi (8%), Firmicutes (6%) and Acidobacteria (4%) (Figure S1). Members of the Nitrospirae, Cyanobacteria, Planctomycetes, and Verrucomicrobia were detected in lower frequencies (<1%). The OTUs within the Proteobacteria phylum were mostly identified as members of the classes Gammaproteobacteria (37%), Alphaproteobacteria (27%), Betaproteobacteria (26%), and Deltaproteobacteria (10%). Actinobacteria were mainly represented by members of the class Actinobacteria (89%) and Thermoleophilia (8%), while Bacteroidetes were mostly represented by members of the classes Saprospirae (53%), Sphingobacteria (22%), Flavobacteria (11%), and Cytophagia (7%). Chloroflexi were mostly represented by members of the class Ktedonobacteria (35%), C0119 (23%) and Thermomicrobia (13%), while Firmicutes were mostly represented by members of the class Bacilli (96%) and Clostridia (4%). Acidobacteria were mostly represented by members of the class Acidobacteriia (20%), Solibacteres (18%), Chloracidobacteria (16%), Acidobacteria-6 (25%), iii1-8 (13%) and DA 052 (4%). Overall, the genera Chitinophaga (5%), Enterobacteria (4%), Bacillus (3%), Dyella (3%), Streptomyces (3%) and Fulvimonas (3%) were the most abundant genera detected in all soil samples. Statistical analysis revealed highly significant differences (p < 0.0001, R2 = 0.489) at genus level between agricultural and non-agricultural soil.

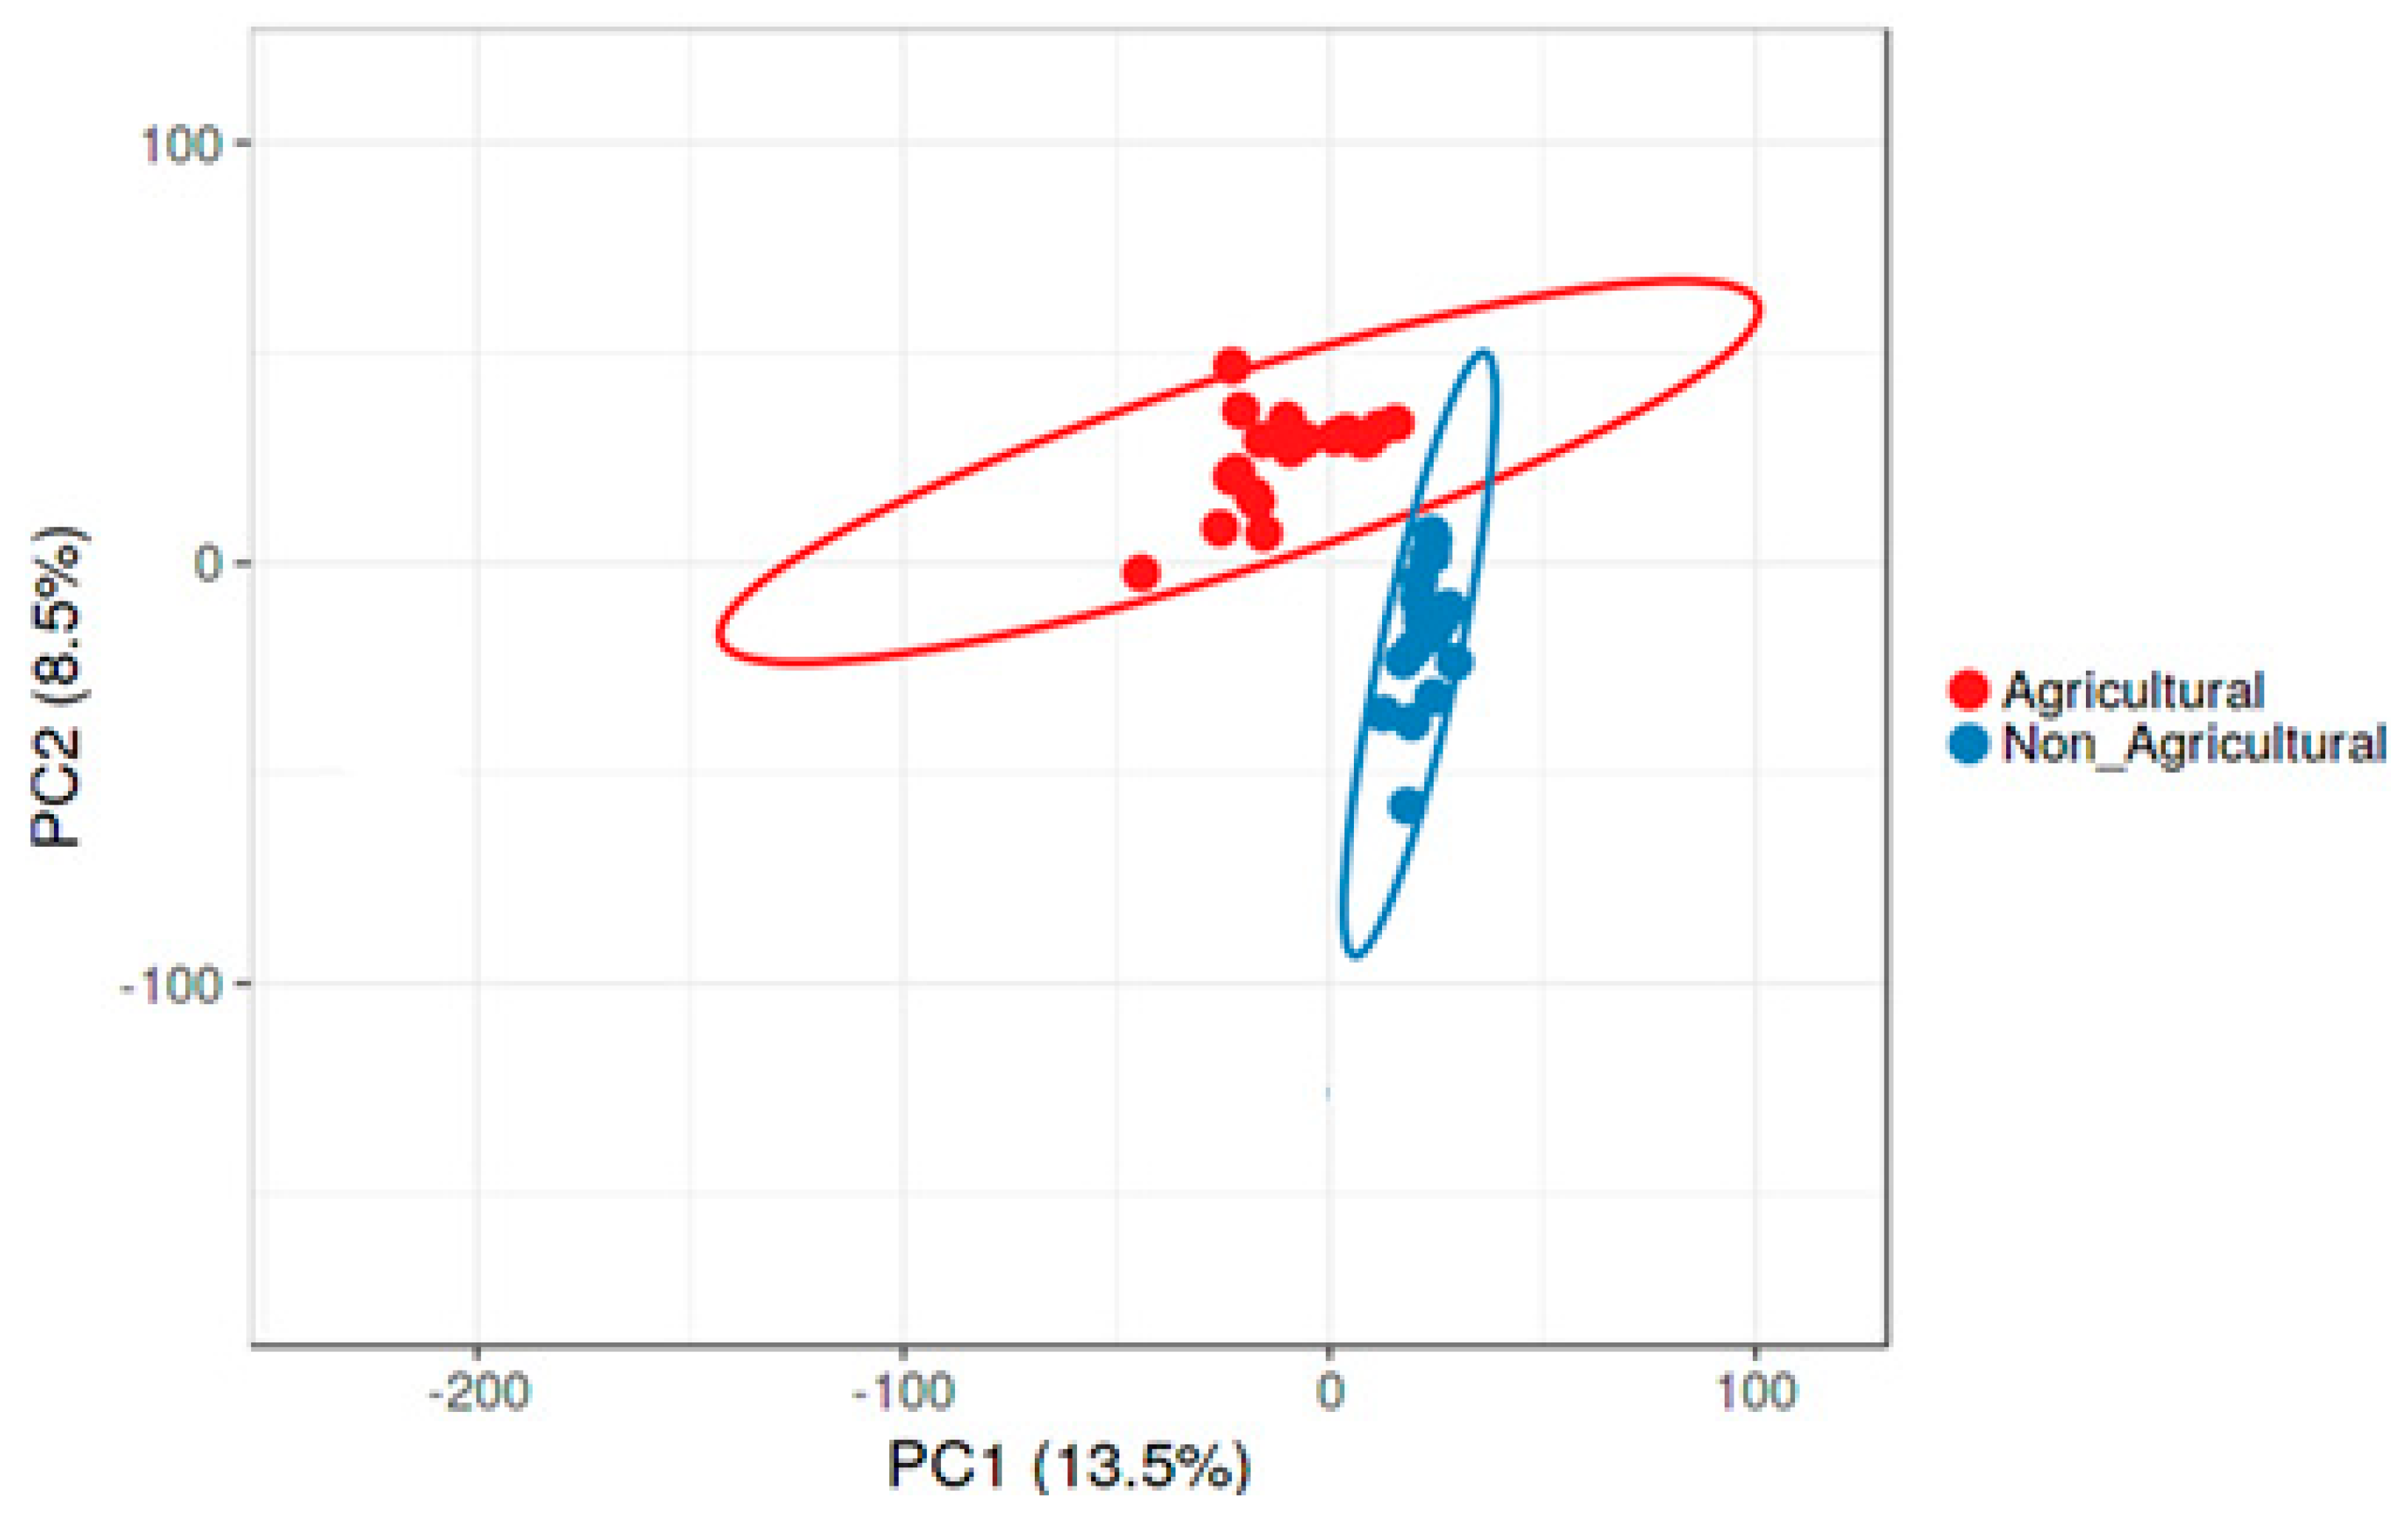
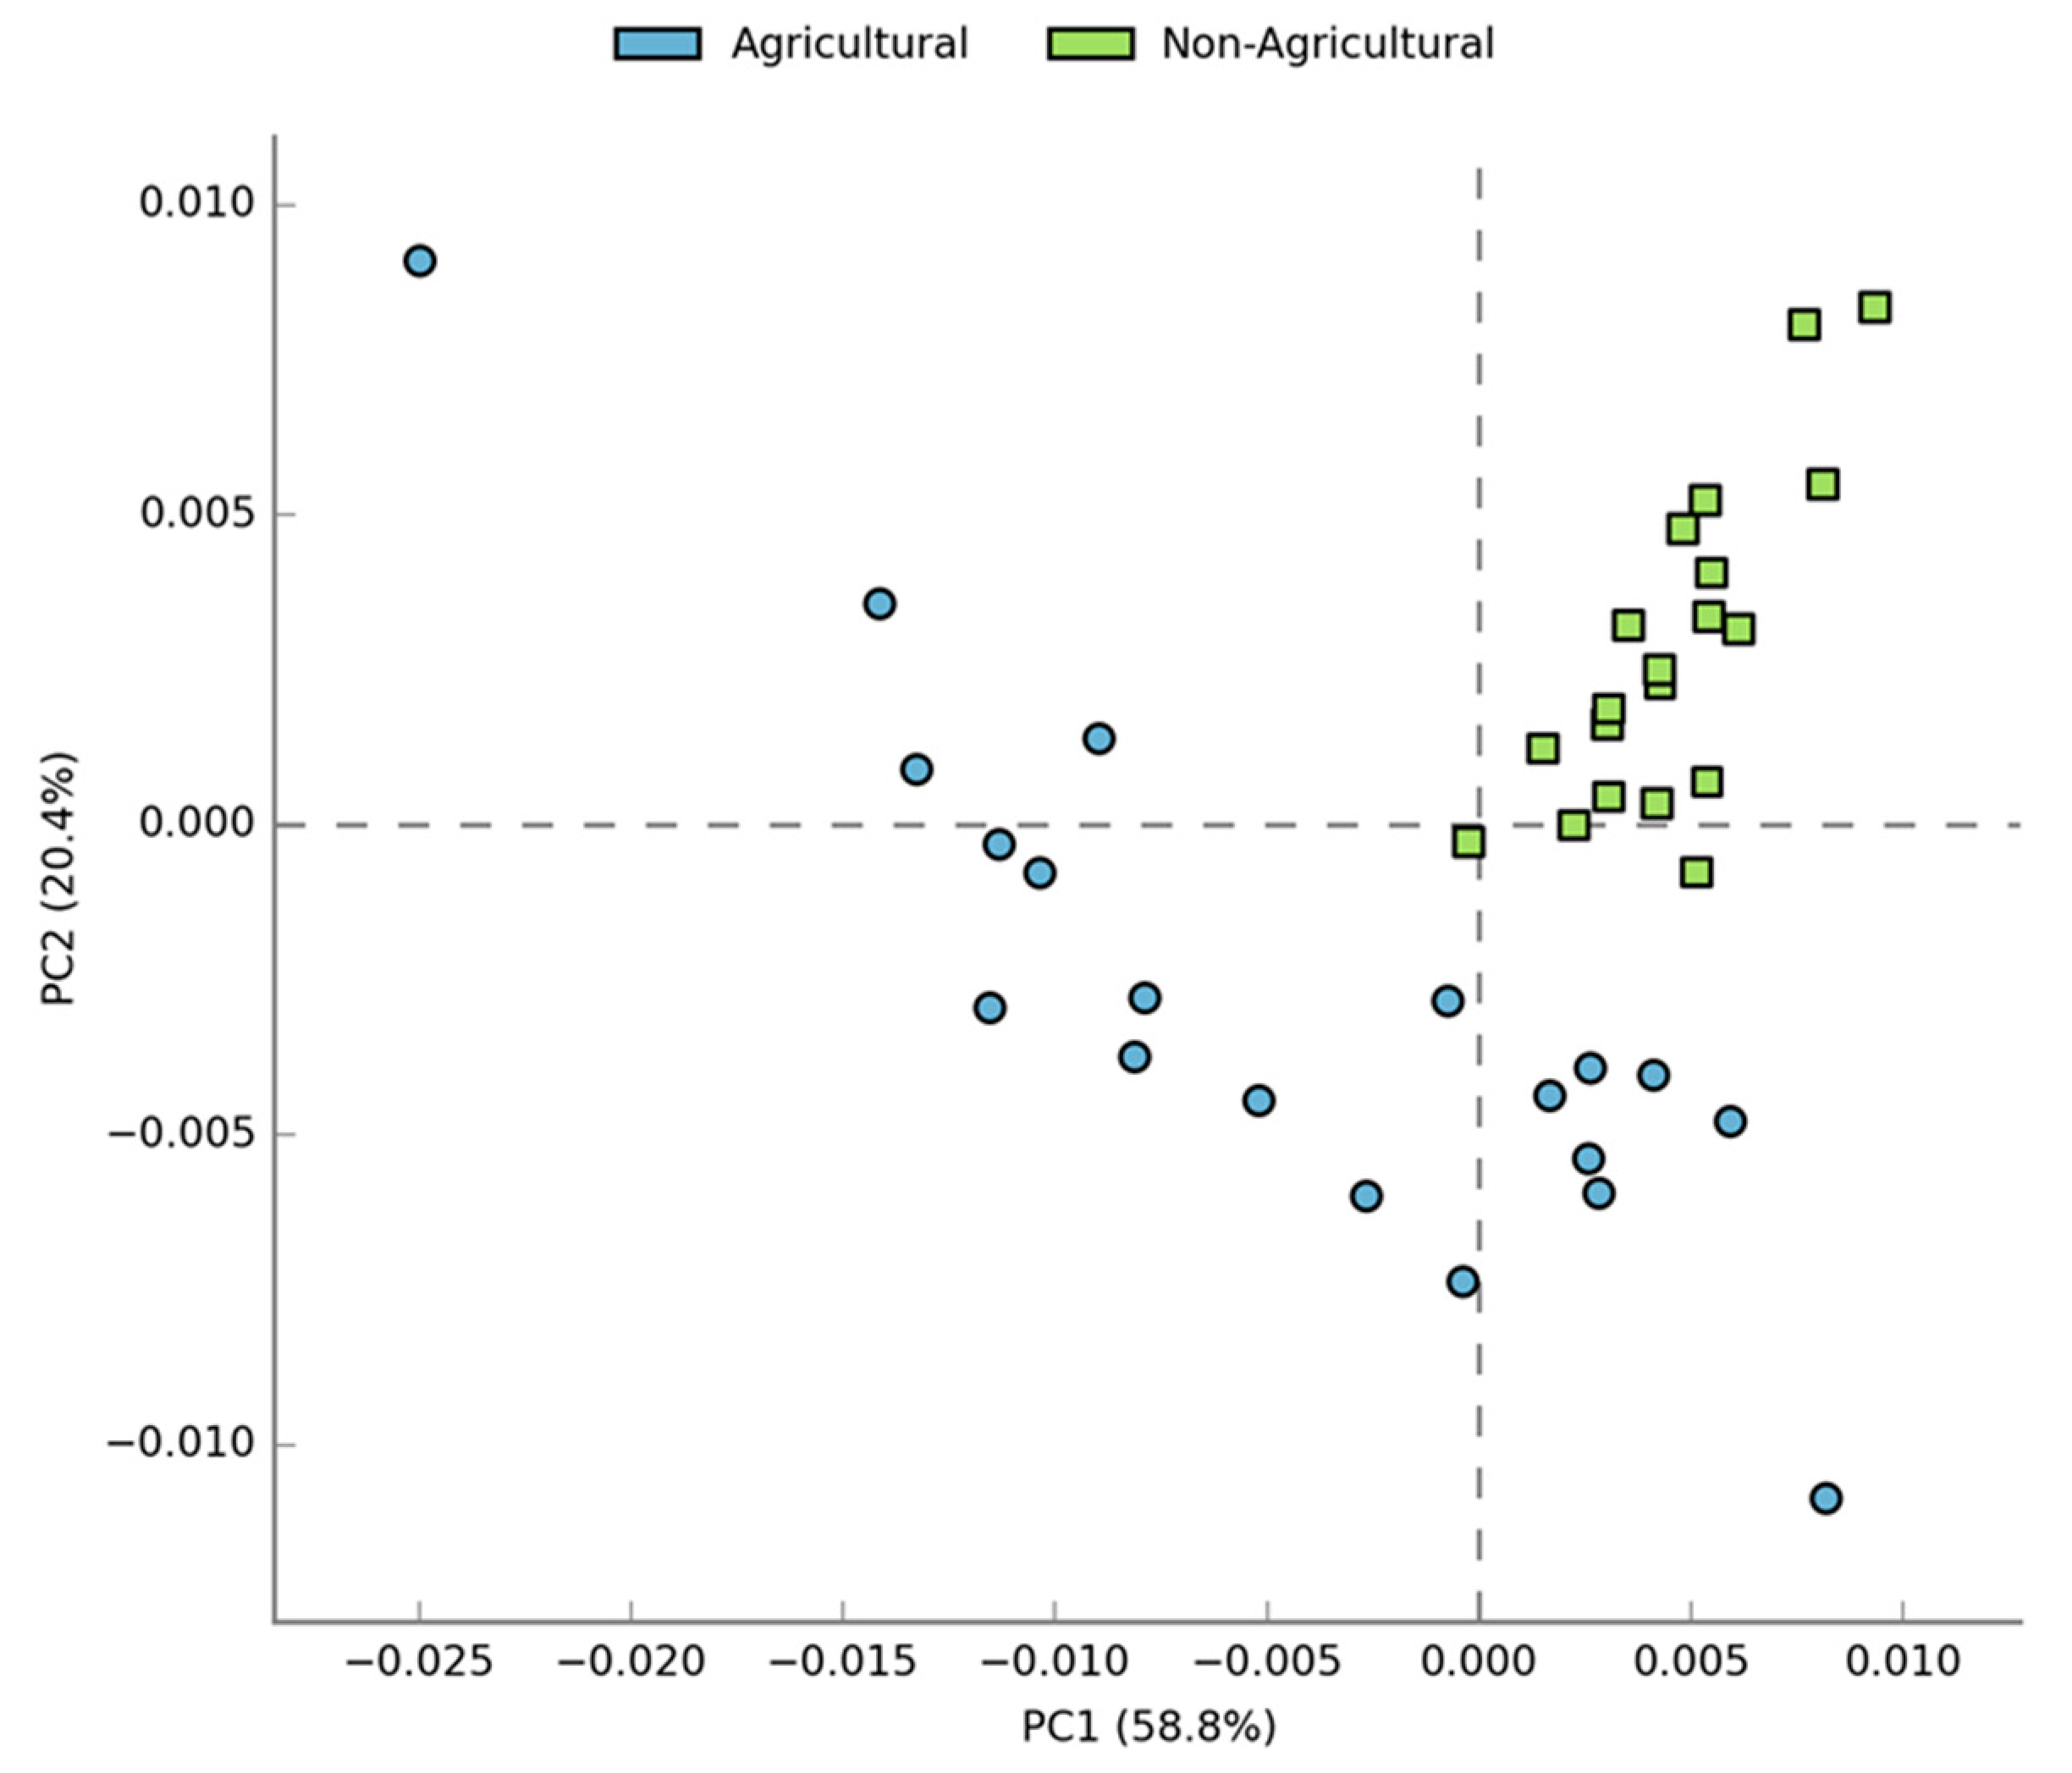
3.2. Compositional Differences in Bacterial Diversity Between Agricultural and Non-agricultural Soil

Significant compositional differences in bacterial microbiota were observed between agricultural and non-agricultural soils (Table 1) (p < 0.001, R2 = 0.241). The relative abundance of Proteobacteria (40%), Bacteroidetes (12%), Chloroflexi (8%), and Firmicutes (7%) was higher in agricultural samples than in non-agricultural samples. Actinobacteria (40%) and Acidobacteria (6%) were more abundant in non-agricultural soil (Figure 1) than in agricultural soil that had 23% and 3%, respectively. Agricultural samples exhibited more unique OTUs compared to non-agricultural samples. A total of 2352 unique OTUs (18.8%) were detected in agricultural soil compared to 910 unique OTUs (7.3%) detected in non-agricultural samples (Figure 2). There were 9263 shared OTUs between the two habitats which accounted for 74% of the OTUs.

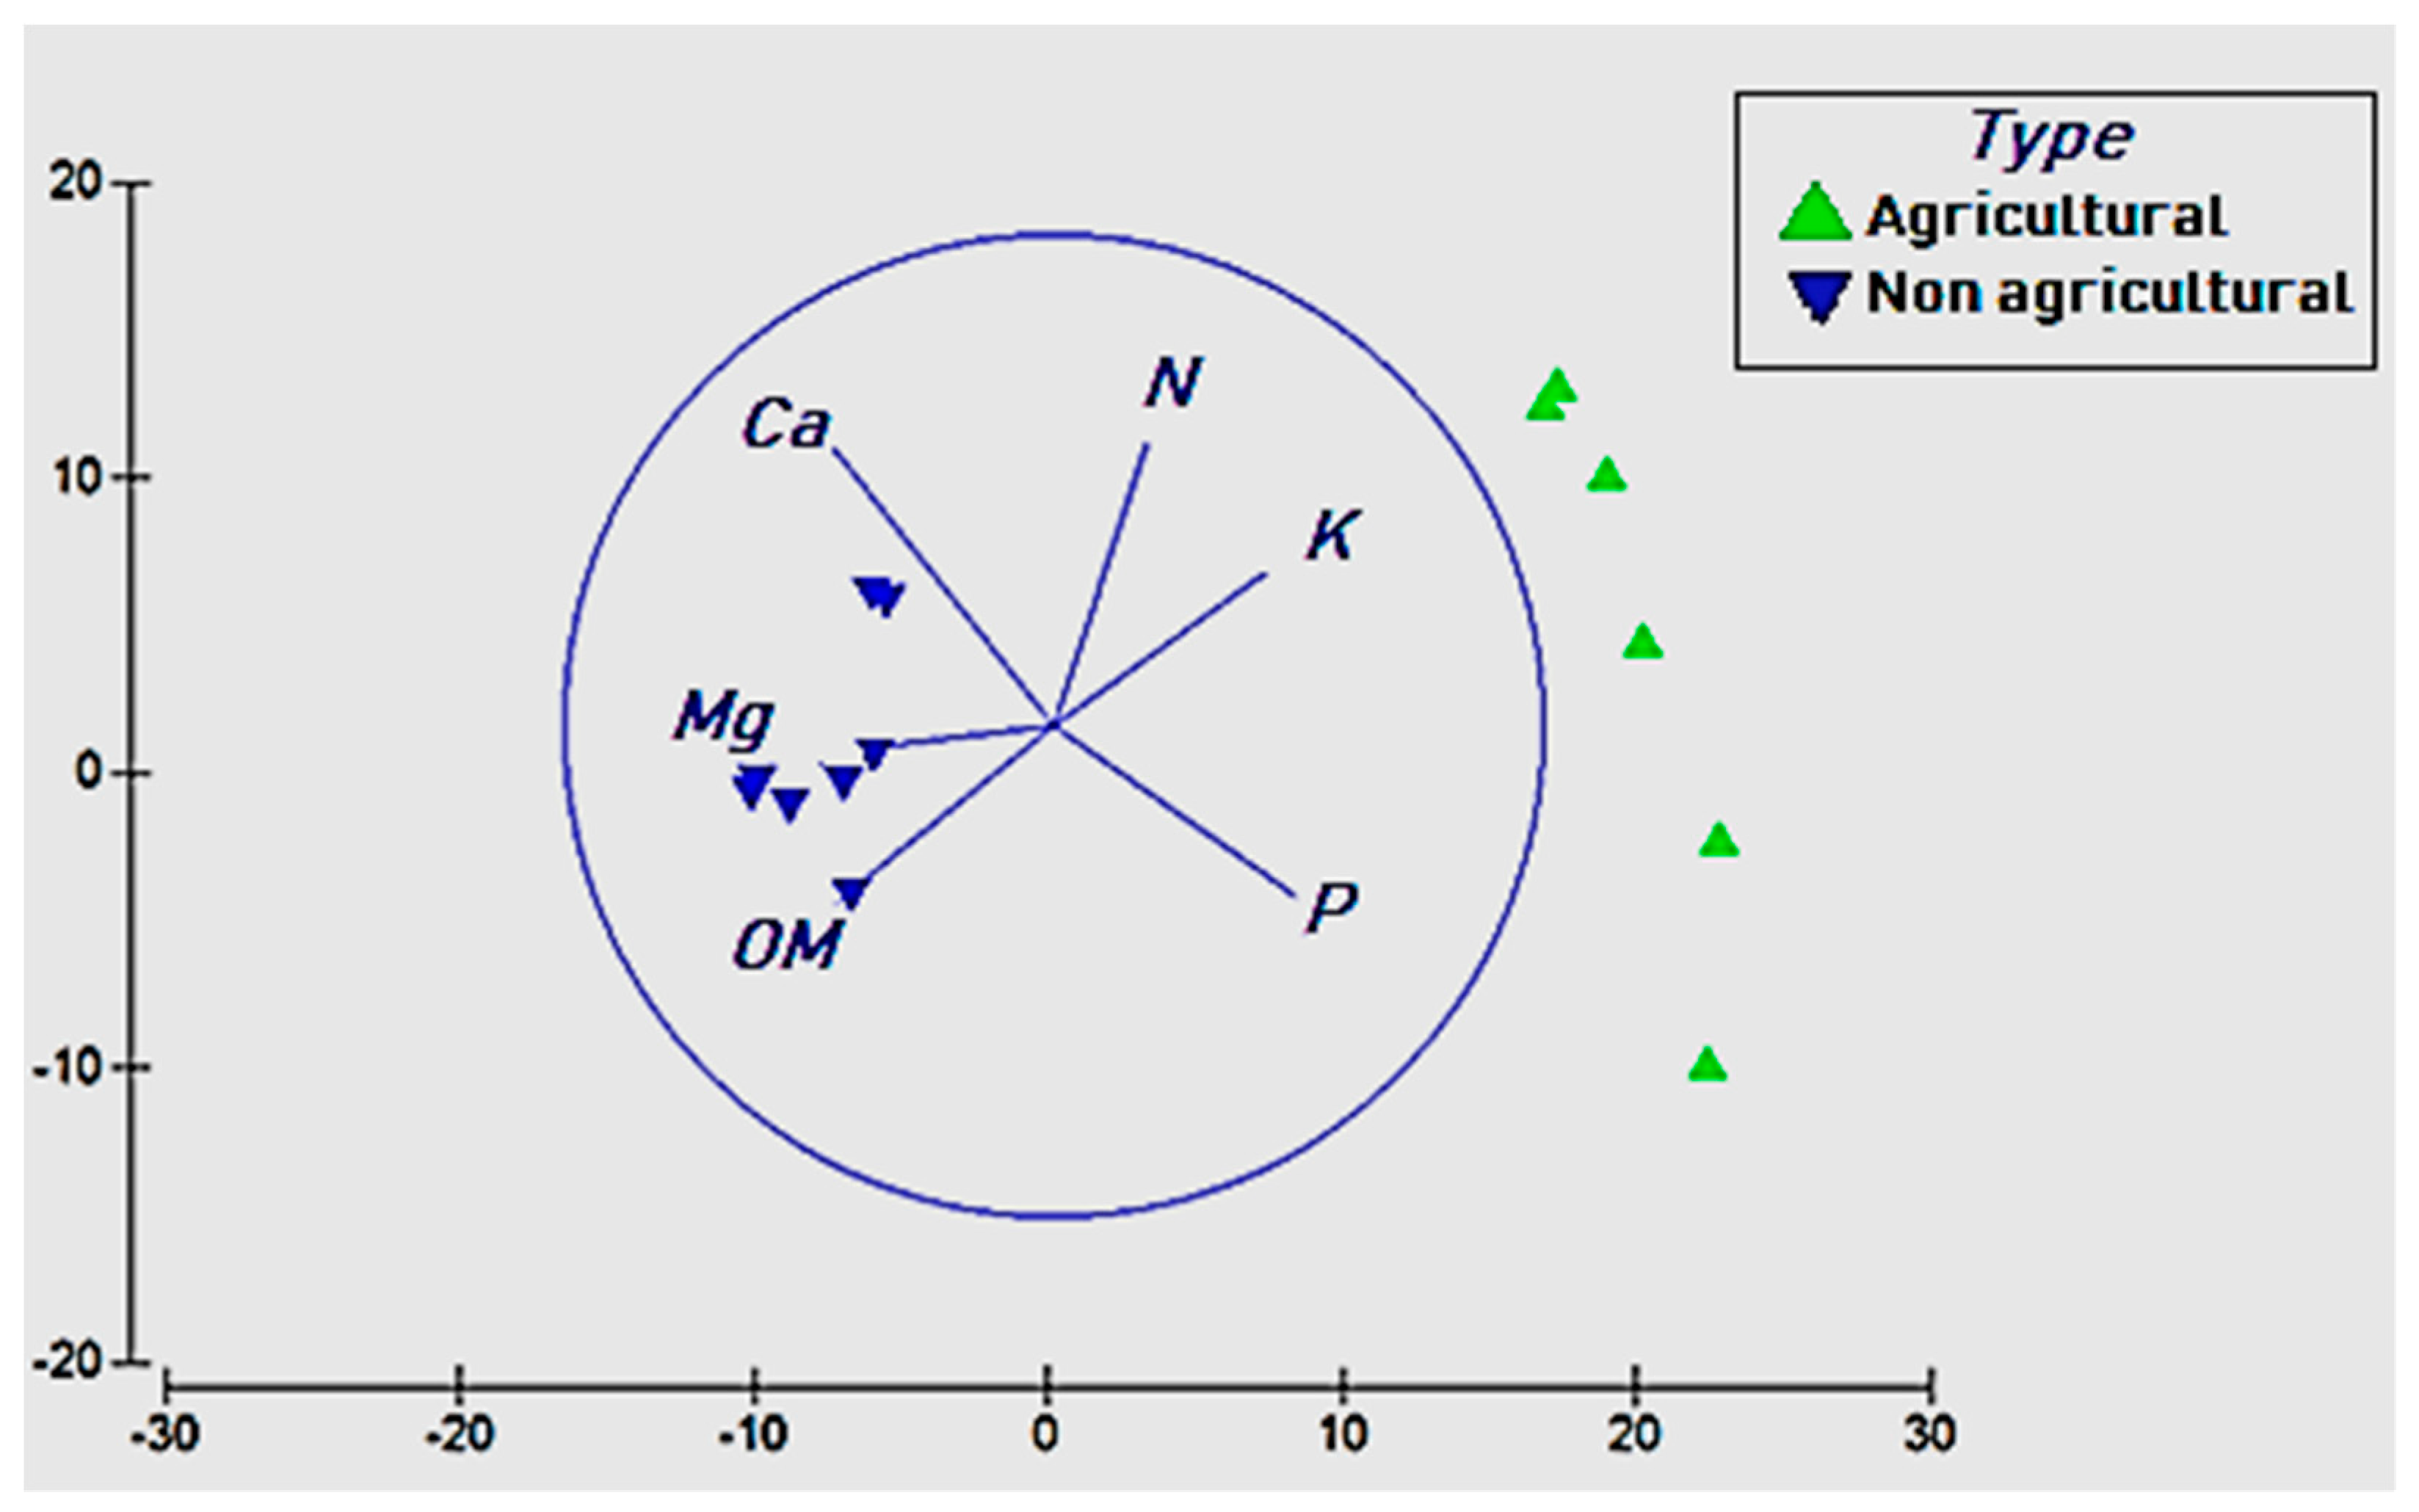
3.3. Effects of Soil Chemistry on Bacterial Diversity

Bray–Curtis distances analysis showed significant effects (p < 0.001) of soil chemistry on soil bacterial community structure. The redundancy analysis eluded that N, P and K played a significant (p < 0.05) role in shaping bacterial community composition in agricultural soils, while soil organic matter (OM), Mg and Ca significantly influenced bacterial diversity in non-agricultural soils (Figure 3). Soil pH and Na did not have any significant effect on bacterial community structure (p > 0.05). The multivariate linear models revealed that soil chemistry explained 89.4% (PCO1 = 67.9% and PCO2 = 21.5%) of the total variation observed in the number of OTUs between the two habitats. Bray–Curtis analysis also showed a highly significant shift in bacterial diversity as land-use changed from natural flora to intensive agriculture (p < 0.001), with good sample separation between agricultural and non-agricultural soil samples (ANOSIM R = 0.81).

3.4. Rarefaction Curves and Diversity Parameters

The OTU accumulation curves showed good sequence saturation at genus level for both agricultural and non-agricultural samples (Figure S2). All diversity measures (richness, ACE, Chao1, and Shannon index) were observed to be significantly higher in agricultural soil (p < 0.05) than in non-agricultural soil samples (Table 2). The Simpson index showed no significant differences between agricultural and non-agricultural soils.
A principal component analysis (PCA) using the sequence data revealed significant differences (p < 0.05) in bacterial community composition between agricultural and non-agricultural soils (Figure 4), with 22% (Principal Component 1 = 13.5% and Principal Component 2 = 8.5%) of the sequences explaining the observed variation. Soil samples from the respective habitats also showed separate clustering of agricultural samples from non-agricultural samples.

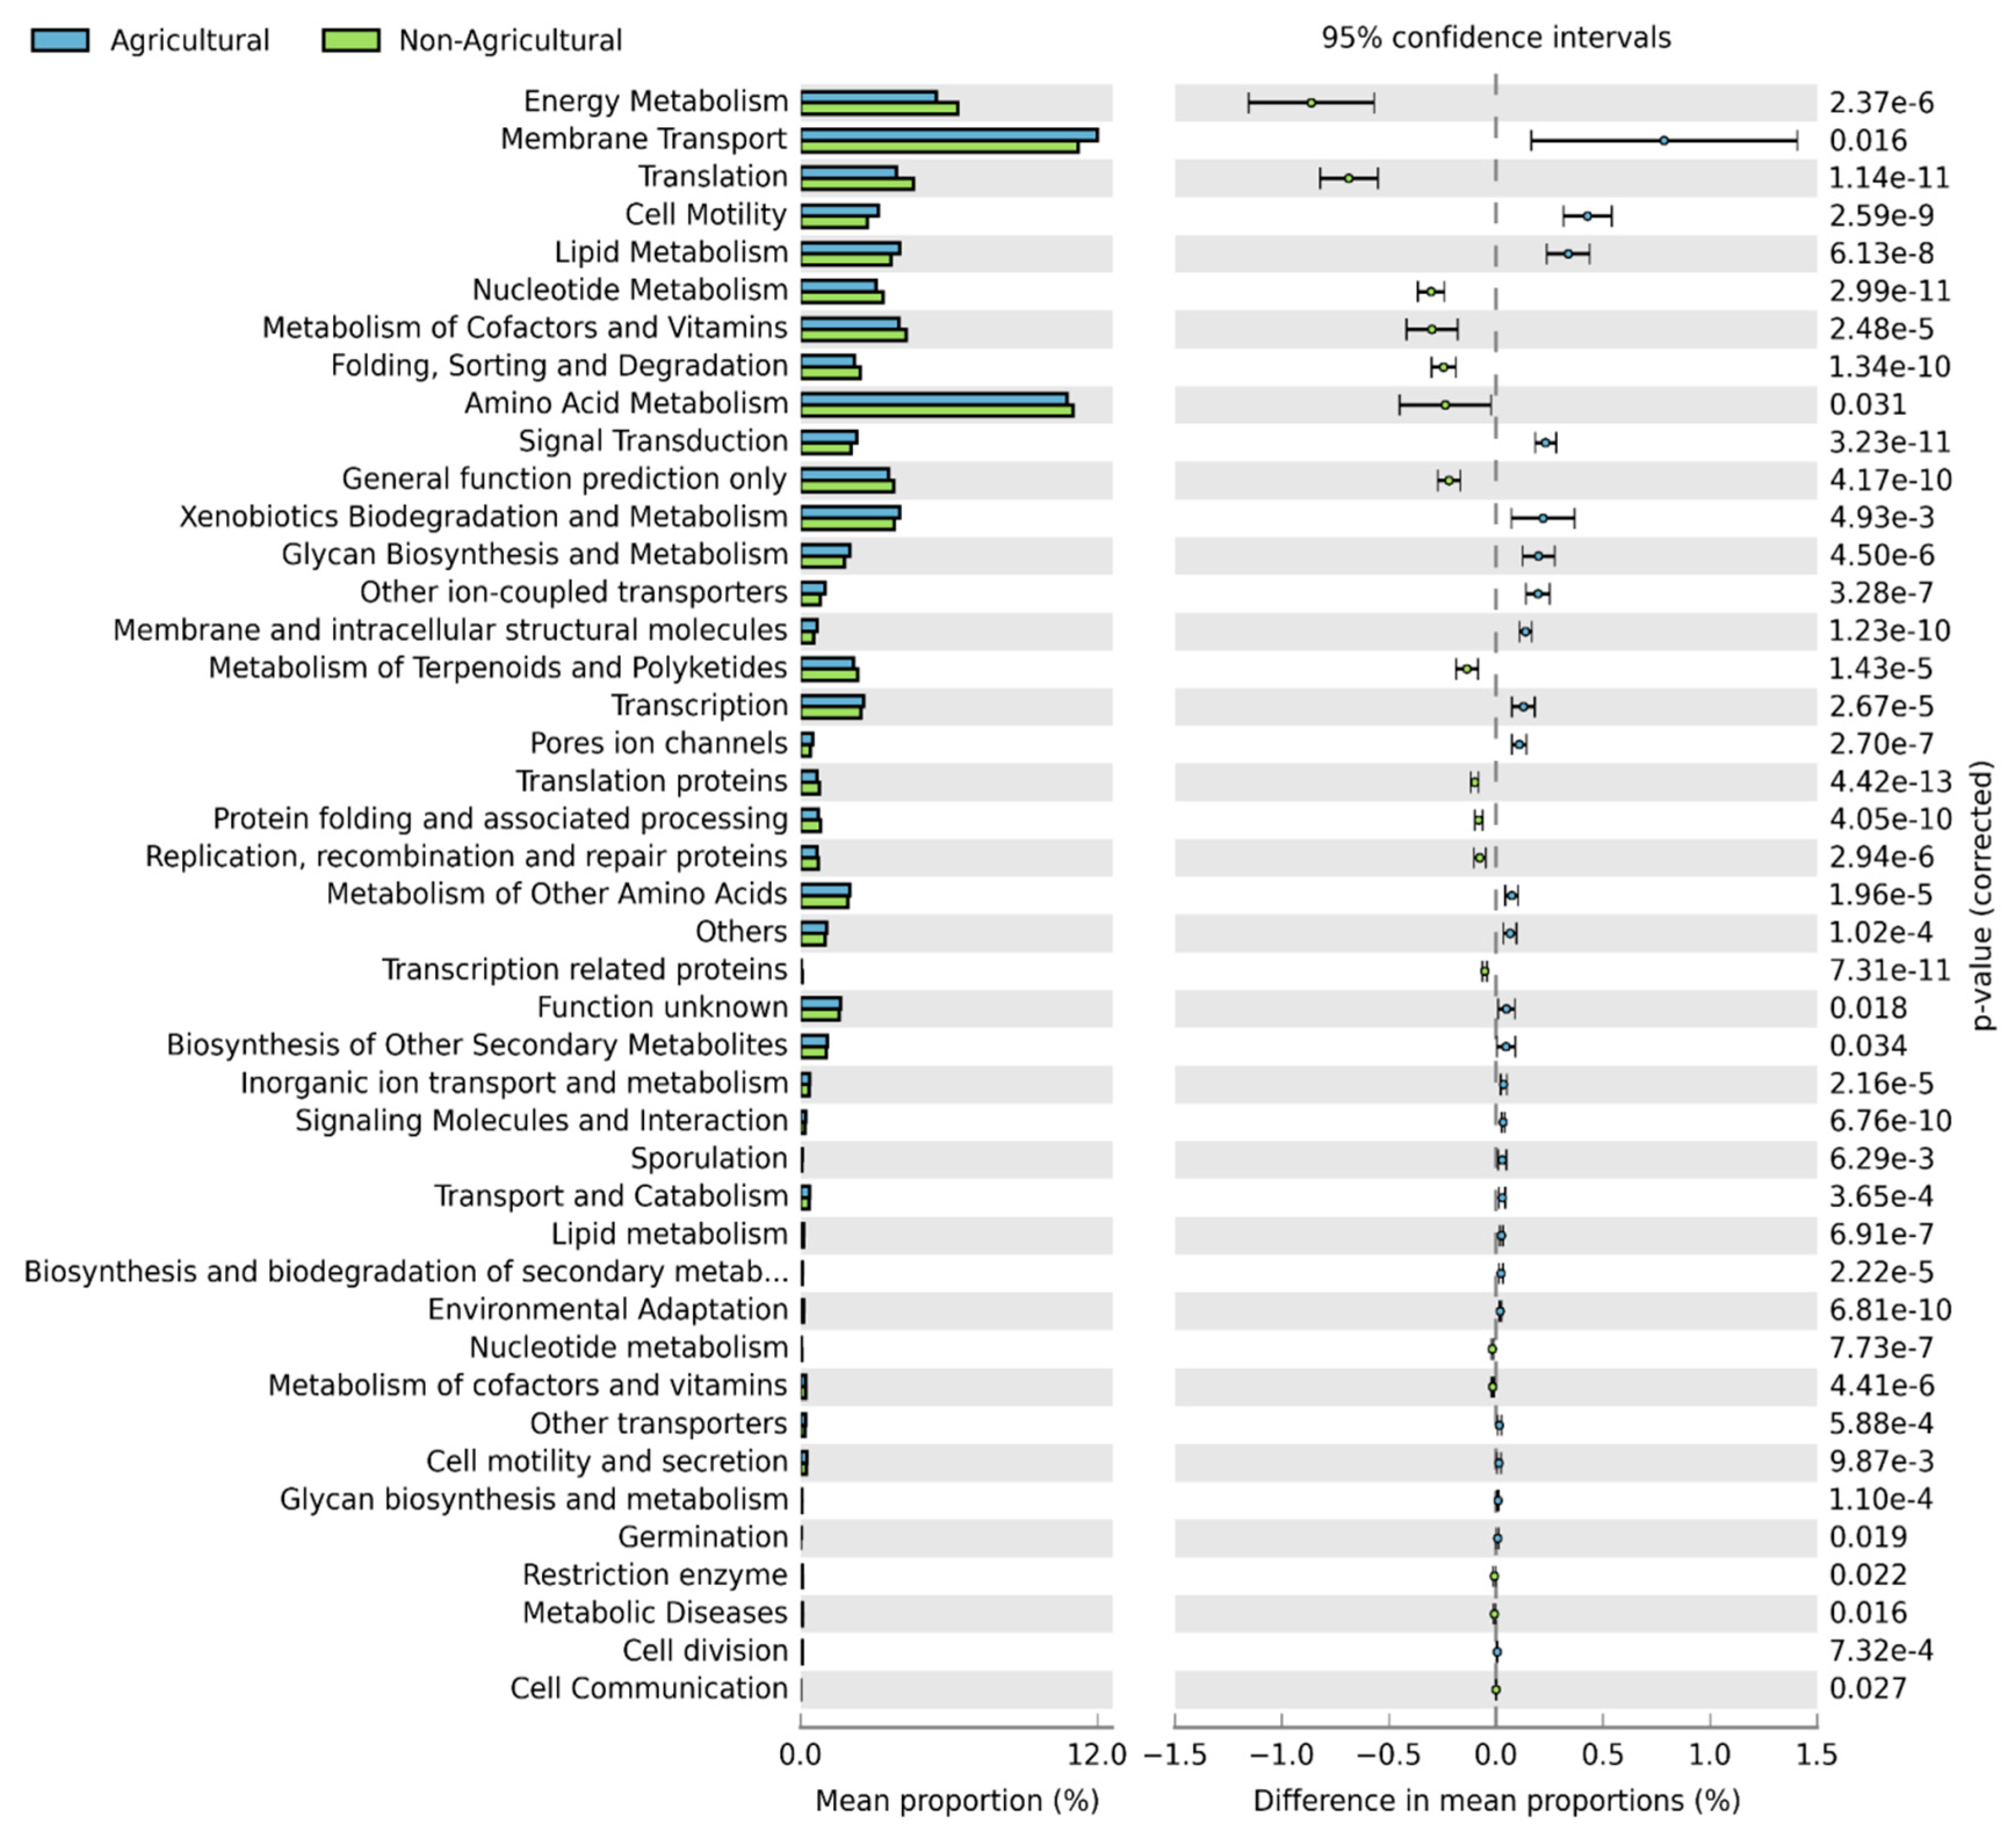
3.5. Functional Predictions

Functional predictions were generated using PICRUSt. A total of 6909 KEGG Orthology (KOs) groups were obtained, of which 6268 (90.7%) were assigned to functional categories, while 641 (9.3%) either did not have known functional roles or had uncharacterized functions and were filtered from the analysis. The two habitats shared 6104 (97.3%) KO groups, while 111 (1.8%) were unique to agricultural soil and 53 (0.8%) were unique to non-agricultural soil (Figure S3). A total of 328 active KEGG pathways were identified, although only 203 were statistically significant between agricultural and non-agricultural land. An extended error bar plot of the predicted functional profiles at the highest-level subsystems revealed that agricultural soil was significantly richer in KO groups for cellular processes, signaling, and environmental information processes, while non-agricultural soil was significantly richer in genetic information processing, metabolism and poorly characterized processes (Figure S4). Principal component analysis at level 1 illustrated that PC1 explained 58.8% while PC2 explained 20.4% of the variation observed in functional pathways between the two habitats (Figure 5). PICRUSt analyses also revealed significant differences (p < 0.0001) between average NSTI scores of agricultural soil (0.12 ± 0.031 standard deviation) and non-agricultural soil (0.20 ± 0.021 standard deviation), respectively. NSTI scores were thus lower in agricultural samples compared to non-agricultural samples.
Active features predicted in both habitats were amino acid metabolism, energy metabolism and membrane transport. The functional categories of translation, lipid metabolism, cell motility, nucleotide metabolism and metabolism of co-factors and enzymes were moderately abundant (Figure 6). Functional categories associated with plant growth promotion and plant fitness [35], including plant hormone balance, molecular communication, plant nutrition, plant adaptation to drought and disease suppression were compared between the two habitats (Figure S5). No significant differences were observed between the two habitats in any of the functions responsible for plant hormone balance. In terms of molecular communication, there were significant differences in secretion systems (p < 0.0001) and bacterial chemotaxis (p < 0.0001) between the two habitats. Agricultural soil exhibited higher relative abundance of genes coding for both secretion systems and bacterial chemotaxis functions compared to non-agricultural soil samples. For plant nutrition, nitrogen metabolism genes were significantly higher in agricultural soil (p < 0.0001) while calcium signaling was significantly higher in non-agricultural soil (p < 0.0001). For functions associated with plant adaptation to drought, lipopolysaccharide biosynthesis was observed to be significantly higher in agricultural samples (p < 0.0001) compared to non-agricultural samples. For disease suppression, sulfur metabolism and biosynthesis of siderophores were significantly higher in agricultural samples while streptomycin synthesis functions (although having a low percentage mean proportion) were significantly higher in non-agricultural soils (p < 0.0001).

4. Discussion

Differences in the relative abundances of the microbes and their predicted functions were investigated for two habitats, agricultural and non-agricultural soils in the Eastern Free State of South Africa. In this study, the dominant bacterial phyla in agricultural and non-agricultural soils were Proteobacteria, Actinobacteria, Bacteroidetes, Chloroflexi, Acidobacteria and Firmicutes. These results agree with the findings of Janssen [37] and Delgado-Baquerizo et al. [38] who reported these six phyla among the nine most dominant and ubiquitous bacterial phyla in soil. The relative abundances of phyla found in this study also support the trends observed in the most dominant phyla in 21 clone libraries prepared from soil samples across Europe [37]. The overall high abundance of Proteobacteria in agricultural samples was reported by Dai et al. [39], who concluded that, although long-term nitrogen fertilization decreases bacterial diversity, it generally favors the abundance of Proteobacteria and Actinobacteria in agro-ecosystems across the globe. The high relative abundance of Proteobacteria in agricultural soil can account for the high predicted abundance of functions responsible for plant growth promotion. Many genera under the phylum Proteobacteria are classified as plant growth promoting rhizobacteria (PGPR), which facilitate nutrient availability and plant fitness [40]. Conversely, although recent studies have shown that Actinobacteria increase with nitrogen application in agricultural soils [39,41], Actinobacteria were observed to be more abundant in non-agricultural soil in this study. These findings agree with the copiotroph/oligotroph hypothesis, as suggested by Fierer et al. [42], which postulates that oligotrophic bacteria are more abundant in soil with low nutrient levels. A previous study by Castro et al. [43] also confirms that members of the phylum Actinobacteria are predominant in oligotrophic soil. Additionally, the low relative abundance of cell division and cell cycle functions in non-agricultural soils further confirms its oligotrophic nature, as these functions were shown to be abundant in high-nutrient environments [44]. Overall, our comparative phylogenetic analyses suggest that the Actinobacteria are dominant in nutrient-deficient undisturbed soils, while Proteobacteria are dominant in nutrient-rich soils under intensive cultivation.
Several researchers have reported bacterial diversity loss due to agriculture, largely through conversion of natural habitats into intensely managed systems [45,46,47,48]. However, all the diversity indices calculated in this study indicated that land under intensive agricultural production for over 50 years had significantly higher bacterial diversity compared to the uncultivated land (Figure S6). Although most agricultural practices have been associated with soil microbial diversity loss, Altieri [49] found that some agricultural practices such as crop rotation have the potential to sustain soil biodiversity and enhance functional diversity. Crop rotation, as practiced in the EFS, could thus explain the observed increased diversity in the agricultural soils. Growing different crops in succession facilitates the supply of different nutrient sources in the form of root exudates and plant residue [50], which in turn may result in the selection or introduction of different types of microbes thereby continuously renewing biological activity in the soil [51]. In addition, management practices in agro-systems generate spatial and temporal changes in soil physical and chemical properties, creating rapidly fluctuating environments that provide a wide range of niches for microbial growth [15,52]. This selection process may gradually differentiate the soil microbiome of agricultural soil from the non-agricultural soil [53].
Our results also support previous views that soil microbes respond to differences in soil chemistry [54,55,56,57,58,59]. Soil chemical analyses indicated significant differences in soil chemistry due to cultivation. Lower levels of soil organic matter content in cultivated soil (compared to non-cultivated soils) have been widely reported [53,60,61,62,63,64,65,66]. The loss of soil organic matter in cultivated soils is attributed to management practices that involve the removal or burning of plant residues, and/or the accelerated breakdown, decomposition and mineralization of organic carbon [63,67,68]. In this study, uncultivated soil was also observed to be significantly higher (p < 0.0001) in soil organic matter and bacterial functions associated with high organic matter such as carbon fixation and methane metabolism. High levels of carbon fixation and methylotrophy functions correlate with high organic matter content in the soil [69,70]. In field experiments comparing the direct and residual effects of organic and inorganic fertilizers on microbial components [71], intensive use of fertilizers containing high levels of N, P and K have been associated with increased bacterial diversity in the soil. This is consistent with our findings, where N, P and K levels were the dominant drivers of bacterial diversity in cultivated soils.
Tools such as PICRUSt that predict function from metagenomes using phylogenetic marker genes can provide information on correlations between phylogeny and function. However, the reliability of such tools needs to be understood in assessing the validity of such predictions. Computing NSTI scores as a quality control measure has been widely used to validate metagenomic predictions from PICRUSt [72,73]. Although functional predictions from PICRUSt showed lower NSTI scores in agricultural soils (0.12 ± 0.031 s.d.) than in non-agricultural soils (0.20 ± 0.021 s.d.) in this study, these values indicate that most of the genomes from the soil samples have not yet been sequenced, suggesting poor sequence depth. Previous studies have shown that soil metagenomes have a moderate prediction accuracy (NSTI = 0.17) compared to human gut metagenomes that have a high prediction accuracy (NSTI < 0.03) [34]. This can be explained by the fact that much of the soil microbiome is still largely characterized and some of the functional capacities are unknown [74]. The discrepancy between results from the previous study and results from this study can also be explained by the differences in sequence read length, as the previous study used a 448 bp read length from the V3–V5 region to validate PICRUSt, compared to the 80 bp read length from the V6 region used in the present study [72].
A key finding in our study was the high relative abundance of predicted bacterial functions related to plant fitness, plant growth promotion and disease suppression (sulfur metabolism, lipopolysaccharide biosynthesis, and biosynthesis of siderophores) in agricultural soil compared to non-agricultural soil (Figure S5) [75,76]. Together with siderophore biosynthesis, lipopolysaccharide biosynthesis has been shown to be involved in induced systemic resistance in plants in response to a phytopathogen [77]. This is possibly related to the observed high relative abundances of bacteria that have been implicated in disease suppression (such as Bacilli, Burkholderia, Pseudomonas, Serratia, Streptomyces, and Stenotrophomonas species (Figure S7)) and were significantly more abundant in agricultural soil than in non-agricultural soil (p < 0.001). However, the number of sequences for streptomycin biosynthesis, which is responsible for the production of streptomycin, an important suppressive antibiotic, was observed to be significantly higher in non-agricultural soil. This could be attributed to the observed high relative abundance of Actinomycetes in non-agricultural soil [78].
Our results indicate that the soil bacterial diversity and composition of cultivated soil in the Eastern Free State is different from that of uncultivated soil. The agricultural soil microbiome was predicted to be abundant in functions that promote plant growth and fitness compared to non-agricultural soil. Using PICRUSt, we were able to suggest functional differences that may be a product of agricultural practices. The findings from this study can serve as a baseline for future studies focusing on the impact specific groups of bacteria on crop productivity. The focus of this study was limited to bacterial diversity and functional inferences based on the 16S rRNA gene. Information on diversity of fungi and viruses would also be required to ensure a wholistic understanding of the soil microbiome in the Eastern Free State.

Supplementary Materials

The following are available online at https://www.mdpi.com/1424-2818/11/4/61/s1, Figure S1: Sunburst chart showing the total relative abundance of bacterial phyla detected in investigated samples, Figure S2: Rarefaction analyses of samples at phylum level, Figure S3: Unique and shared KEGG Orthologs (KOs) between the agricultural and non-agricultural soils, Figure S4: Extended error bar plot for the six active features (high-level subsystems) that had significant differences between agricultural and non-agricultural samples, Figure S5. Extended error bar plot showing the abundances of functions associated with plant interaction that had significant differences between agricultural and non-agricultural samples, Figure S6: Heat map showing differences in relative abundance of the 50 most abundant bacterial genera as revealed by ClustVis statistical analysis, Figure S7. Relative abundance of different genera involved in plant growth promotion and plant fitness between agricultural and non- agricultural soils.

Author Contributions

Conceptualization, J.P.D., J.E.v.d.W., D.A.C., J.M.S., and A.V.; methodology, J.P.D., J.E.v.d.W., D.A.C., J.M.S., and A.V.; software, J.P.D., and A.V.; validation, J.P.D., and A.V.; formal analysis, J.P.D, J.E.v.d.W., and A.V.; investigation, J.P.D., J.E.v.d.W., D.A.C., J.M.S., and A.V.; resources, J.E.v.d.W., D.A.C., and J.M.S.; data curation, J.P.D., and A.V.; writing—original draft preparation, J.P.D., and J.E.v.d.W.; writing—review and editing, J.P.D., J.E.v.d.W., D.A.C. and A.V.; supervision, J.E.v.d.W., D.A.C., J.M.S. and A.V.; project administration, J.E.v.d.W., D.A.C. and J.M.S.; and funding acquisition, J.E.v.d.W., D.A.C. and J.M.S.

Funding

This research was funded by Potatoes South Africa, grant specific unique reference number (UID) 105649.

Acknowledgments

A special thanks goes to Mr. Gert Bester in the Eastern Free State of South Africa for giving us access to his farm and assisting in sample collection. We also would like to acknowledge Dr. Michelle Greve for assisting us with the mapping software and drawing the map.

Conflicts of Interest

Authors declare no conflict of interest. The funders had no role in the design of the study, in the collection, analyses, or interpretation of data; in the writing of the manuscript, or in the decision to publish the results.

References

  1. United Nations Department of Economic and Social Affairs (UNDESA) 2017. Available online: https://www.un.org/development/desa/en/news/population/world-population-prospects-2017.html (accessed on 20 June 2018).
  2. Hunter, M.C.; Smith, R.G.; Schipanski, M.E.; Atwood, L.W.; Mortensen, D.A. Agriculture in 2050: Recalibrating Targets for Sustainable Intensification. BioScience 2017, 67, 386–391. [Google Scholar] [CrossRef]
  3. Statistics South Africa (Stats S. A.). Statistical Release P0302: Mid-Year Population Estimates 2018. 2018. Available online: http://www.statssa.gov.za/?p=11341.pdf (accessed on 24 August 2018).
  4. Strydom, N.; Struweg, J. Agricultural Output Versus SA’s Population Growth. 29 July 2016 Issue of Farmer’s Weekly. Available online: https://www.farmersweekly.co.za/opinion/by-invitation/agricultural-output-versus-sas-population-growth/ (accessed on 15 May 2015).
  5. Department of Agriculture, Forestry and Fisheries (DAFF). Abstract of Agricultural Statistics. 2018. Available online: http://www.daff.gov.za/Daffweb3/Portals/0/Statistics%20and%20Economic%20Analysis/Statistical%20Information/Abstract%202018.pdf (accessed on 27 August 2018).
  6. Department of Agriculture and Rural Development (DARD). State of Readiness 2017/2018. Portfolio Committee on Agriculture, Forestry and Fisheries, Capetown. 2018. Available online: http://pmg-assets.s3-website-eu-west-1.amazonaws.com/171017freestate.pdf (accessed on 27 August 2018).
  7. Department of Agriculture, Forestry and Fisheries (DAFF). Free State: Provincial Overview. 2015. Available online: http://www.culturalguiding.com/Courses/FreeStateProvince/ProvincialOverview/ProvincialOverview/1577.pdf (accessed on 20 June 2015).
  8. Maphalla, L.T.; Salman, M.V. Provincial Report on Education and Training for Agriculture and Rural Development: Free State Province. 2002. Available online: https://www.nda.agric.za/doaDev/sideMenu/educationAndTraining/Free%20State.pdf (accessed on 12 April 2018).
  9. Knot, J. Conservation Agriculture and Commercial Farmers in the Eastern Free State: Promoting Conservation Agriculture in the Eastern Free State of South Africa. Ph.D. Thesis, University of Free State, Bloemfontein, South Africa, 2014. [Google Scholar]
  10. Branca, G.; McCarthy, N.; Lipper, L.; Jolejole, M.C. Climate-Smart Agriculture: A Synthesis of Empirical Evidence of Food Security and Mitigation Benefits from Improved Cropland Management. Mitigation of Climate Change in Agriculture Series 3: p1–43. 2015. Available online: http://www.fao.org/docrep/015/i2574e/i2574e00.pdf (accessed on 18 May 2015).
  11. Foley, J.A.; DeFries, R.; Asner, G.P.; Barford, C.; Bonan, G.; Carpenter, S.R.; Chapin, F.S.; Coe, M.T.; Daily, G.C.; Gibbs, H.K.; et al. Global Consequences of Land-Use. Science 2005, 309, 570–574. [Google Scholar] [CrossRef] [PubMed]
  12. Torsvik, V.; Daae, F.L.; Sandaa, R.A.; Ovreas, L. Novel techniques for analysing microbial diversity in natural and perturbed environments. J. Bacteriol. 1998, 64, 53–62. [Google Scholar] [CrossRef]
  13. Weibull, A.C.; Ostman, O.; Granqvist, A. Species richness in agroecosystems: The effect of landscape, habitat and farm management. Biodivers. Conserv. 2003, 12, 1335–1355. [Google Scholar] [CrossRef]
  14. Balota, E.L.; Colozzi, A.; Andrade, D.S.; Dick, R.P. Long-term tillage and crop rotation effects on microbial biomass and C and N mineralization in a Brazilian Oxisol. Soil Tillage Res. 2004, 77, 137–145. [Google Scholar] [CrossRef]
  15. Trivedi, P.; Delgado-Baquerizo, M.; Anderson, I.C.; Singh, B.K. Response of Soil Properties and Microbial Communities to Agriculture: Implications for Primary Productivity and Soil Health Indicators. Front. Plant Sci. 2016, 7, 990. [Google Scholar] [CrossRef]
  16. Osborn, A.M.; Moore, E.R.; Timmis, K.N. An evaluation of terminal-restriction fragment length polymorphism (T-RFLP) analysis for the study of microbial community structure and dynamics. Environ. Microbiol. 2000, 2, 39–50. [Google Scholar] [CrossRef]
  17. Rastogi, G.; Sani, R.K. Molecular Techniques to Assess Microbial Community Structure, Function and Dynamics in the Environment. In Microbes and Microbial Technology: Agricultural and Environmental Applications; Ahmad, I., Ahmad, F., Pichtel, J., Eds.; Springer Science+Business Media LLC: New York, NY, USA, 2011; pp. 29–58. [Google Scholar] [CrossRef]
  18. Mehlich, A. Uniformity of expressing soil test results. A case for calculating results on a volume basis. Commun. Soil Sci. Plant Anal. 1972, 3, 417–424. [Google Scholar] [CrossRef]
  19. Bray, R.H.; Kurtz, L.T. Determining of total, Organic and available forms of phosphorus in Soils. Soil Sci. 1945, 59, 39–45. [Google Scholar] [CrossRef]
  20. Al-Busaidi, A.; Yamamoto, T.; Bakheit, C.; Cookson, P. Soil Salinity Assessment by some destructive and non-destructive methods in calcareous soils. J. Jpn. Soc. Soil Phys. 2006, 104, 27–40. [Google Scholar]
  21. Caporaso, J.G.; Lauber, C.L.; Walters, W.A.; Berg-Lyons, D.; Lozupone, C.A.; Turnbaugh, P.J.; Fierer, N.; Knight, R. Global patterns of 16S rRNA diversity at a depth of millions of sequences per sample. Proc. Natl. Acad. Sci. USA 2011, 15, 4516–4522. [Google Scholar] [CrossRef] [PubMed]
  22. Edgar, R.C. Search and clustering orders of magnitude faster than BLAST. Bioinformatics 2010, 26, 2460–2461. [Google Scholar] [CrossRef] [Green Version]
  23. Wang, Q.; Garrity, G.M.; Tiedje, J.M.; Cole, J.R. Naive Bayesian Classifier for Rapid Assignment of rRNA Sequences into the New Bacterial Taxonomy. Appl. Environ. Microbiol. 2007, 73, 5261–5267. [Google Scholar] [CrossRef] [PubMed]
  24. DeSantis, T.Z.; Hugenholtz, P.; Larsen, N.M.R.; Brodie, E.L.; Keller, K.; Huber, T.; Dalevi, D.; Hu, P.; Andersen, G.L. Greengenes, a chimera-checked 16S rRNA gene database and workbench compatible with ARB. Appl. Environ. Microbiol. 2006, 72, 5069–5072. [Google Scholar] [CrossRef] [PubMed]
  25. Oksanen, J.; Kindt, R.; Legendre, P.; O’Hara, B.; Stevens, M.H.H.; Oksanen, M.J.; Suggests, M. The Vegan package. Community Ecol. Package 2007, 10, 631–637. [Google Scholar]
  26. R Development Core Team. R: A Language and Environment for Statistical Computing. R Foundation for Statistical Computing. Vienna, Austria, 2013. Available online: https://www.R-project.org/ (accessed on 20 November 2017).
  27. Visual and Analysis of Microbial Population Structures (VAMPS). Bay Paul Center, MBL, 2016. Available online: https://vamps.mbl.edu/utils/login.php (accessed on 4 January 2017).
  28. De Rosario-Martinez, H. Phia: Post-Hoc Interaction Analysis. R package version 0.1–5. 2013. 2015. Available online: https://github.com/heliosdrm/phia (accessed on 21 November 2017).
  29. Lozupone, C.; Knight, R. UniFrac: A New Phylogenetic Method for Comparing Microbial Communities. Appl. Environ. Microbiol. 2005, 71, 8228–8235. [Google Scholar] [CrossRef] [PubMed]
  30. Metsalu, T.; Vilo, J. ClustVis: A web tool for visualizing clustering of multivariate data using Principal Component Analysis and heatmap. Nucleic Acids Res. 2015, 43, W566–W570. [Google Scholar] [CrossRef]
  31. Ondov, B.; Bergman, N.; Phillippy, A. Interactive metagenomic visualization in a Web browser. BMC Bioinform. 2011, 12. [Google Scholar] [CrossRef]
  32. Langille, M.; Douglas, G. PICRUSt Tutorial. Available online: https://github.com/LangilleLab/microbiome_helper/wiki/PICRUSt-tutorial (accessed on 2 December 2017).
  33. De Voogd, N.; Cleary, D.; Polónia, A.; Gomes, N. Bacterial community composition and predicted functional ecology of sponges, sediment and seawater from the thousand islands reef complex, West Java, Indonesia. FEMS Microbiol. Ecol. 2015, 91. [Google Scholar] [CrossRef] [Green Version]
  34. Langille, M.; Zaneveld, J.; Caporaso, J.; McDonald, D.; Knights, D.; Reyes, J.; Clemente, J.; Burkepile, D.; Vega Thurber, R.; Knight, R.; et al. Predictive functional profiling of microbial communities using 16S rRNA marker gene sequences. Nat. Biotechnol. 2013, 31, 814–821. [Google Scholar] [CrossRef] [Green Version]
  35. Lemanceau, P.; Blouin, M.; Muller, D.; Moënne-Loccoz, Y. Let the Core Microbiota Be Functional. Trends Plant Sci. 2017, 22, 583–595. [Google Scholar] [CrossRef] [PubMed]
  36. White, J.R.; Nagarajan, N.; Pop, M. Statistical methods for detecting differentially abundant features in clinical metagenomic samples. PLoS Comput. Biol. 2009, 5, e1000352. [Google Scholar] [CrossRef] [PubMed]
  37. Janssen, P.H. Identifying the Dominant Soil Bacterial Taxa in Libraries of 16S rRNA and 16S rRNA Genes. Appl. Environ. Microbiol. 2006, 72, 1719–1728. [Google Scholar] [CrossRef] [Green Version]
  38. Delgado-Baquerizo, M.; Oliverio, A.M.; Brewer, T.E.; Benavent-Gonzalez, A.; Eldridge, D.J.; Bardgett, R.D.; Maestre, F.T.; Singh, B.K.; Fierer, N. A global atlas of the dominant bacteria found in soil. Science 2018, 359, 320–325. [Google Scholar] [CrossRef]
  39. Dai, Z.; Su, W.; Chen, H.; Barberan, A.; Zhao, H.; Yu, M.; Yu, L.; Brookes, P.C.; Schadt, C.W.; Chang, S.X.; et al. Long-term nitrogen fertilization decreases bacterial diversity and favours the growth of Actinobacteria and Proteobacteria in agro-ecosystems across the globe. Glob. Chang. Biol. 2018, 24, 3452–3461. [Google Scholar] [CrossRef]
  40. Lugtenberg, B.; Kamilova, F. Plant-growth-promoting rhizobacteria. Annu. Rev. Microbiol. 2009, 63, 541–556. [Google Scholar] [CrossRef] [PubMed]
  41. Wang, Q.; Wang, C.; Yu, W.; Turak, A.; Chen, D.; Huang, Y.; Ao, J.; Jiang, Y.; Huang, Z. Effects of Nitrogen and Phosphorus Inputs on Soil Bacterial Abundance, Diversity, and Community Composition in Chinese Fir Plantations. Front. Microbiol. 2018, 9, 1543. [Google Scholar] [CrossRef] [PubMed]
  42. Fierer, N.; Bradford, M.A.; Jackson, R.B. Toward an ecological classification of soil bacteria. Ecology 2007, 88, 1354–1364. [Google Scholar] [CrossRef]
  43. Castro, V.H.L.; Schroeder, L.F.; Quirino, B.F.; Kruger, R.H.; Barreto, C.C. Acidobacteria from oligotrophic soil from the Cerrado can grow in a wide range of carbon source concentrations. Can. J. Microbiol. 2013, 59, 746–753. [Google Scholar] [CrossRef]
  44. Song, H.; Song, W.; Kim, M.; Tripathi, B.; Kim, H.; Jablonski, P.; Adams, J. Bacterial strategies along nutrient and time gradients, revealed by metagenomic analysis of laboratory microcosms. FEMS Microbiol. Ecol. 2017, 93, fix114. [Google Scholar] [CrossRef]
  45. Mahamane, L.; Mahamane, S. Biodiversity of ligneous species in semi-arid to arid ones of southwestern Niger according to anthropogenic and natural factors. Agric. Ecosyst. Environ. 2005, 105, 267–271. [Google Scholar] [CrossRef]
  46. Underwood, E.C.; Viers, J.H.; Klausmeyer, K.R.; Cox, R.L.; Shaw, M.R. Threats and biodiversity in the Mediterranean biome. Divers. Distrib. 2009, 15, 188–197. [Google Scholar] [CrossRef]
  47. Ding, G.C.; Piceno, Y.M.; Heuer, H.; Weinert, N.; Dohrmann, A.B.; Carrillo, A.; Andersen, G.L.; Castellanos, T.; Tebbe, C.; Smalla, K. Changes of soil bacterial diversity as a consequence of agricultural land-use in a semi-arid ecosystem. PLoS ONE 2013, 8, e59497. [Google Scholar] [CrossRef] [PubMed]
  48. Dudley, N.; Alexander, S. Agriculture and biodiversity: A review. Biodiversity 2017, 18, 45–49. [Google Scholar] [CrossRef]
  49. Altieri, M.A. The ecological role of biodiversity in agroecosystems. Agric. Ecosyst. Environ. 1999, 74, 19–31. [Google Scholar] [CrossRef] [Green Version]
  50. Szoboszlay, M.; Dohrmann, A.; Poeplau, C.; Don, A.; Tebbe, C. Impact of land-use change and soil organic carbon quality on microbial diversity in soils across Europe. FEMS Microbiol. Ecol. 2017, 93, fix146. [Google Scholar] [CrossRef] [PubMed]
  51. Tiemann, L.; Grandy, A.; Atkinson, E.; Marin-Spiotta, E.; McDaniel, M. Crop rotational diversity enhances belowground communities and functions in an agroecosystem. Ecol. Lett. 2015, 18, 761–771. [Google Scholar] [CrossRef]
  52. Carbonetto, B.; Rascovan, N.; Álvarez, R.; Mentaberry, A.; Vázquez, M.P. Structure, composition and metagenomic profile of soil microbiomes associated to agricultural land-use and tillage systems in Argentine pampas. PLoS ONE 2014, 9, e99949. [Google Scholar] [CrossRef]
  53. Liiri, M.; Hasab, M.; Haimi, J.; Setala, H. History of land-use intensity can modify the relationship between functional complexity of the soil fauna and soil ecosystem services—A microcosm study. Appl. Soil Ecol. 2012, 55, 53–61. [Google Scholar] [CrossRef]
  54. Steenwerth, K.L.; Jackson, L.E.; Caldero, F.J.; Stromberg, M.R.; Scow, K.M. Soil microbial community composition and land-use history in cultivated and grassland ecosystems of coastal California. Soil Biol. Biochem. 2002, 34, 1599–1611. [Google Scholar] [CrossRef]
  55. Nemergut, D.R.; Townsend, A.R.; Sattin, S.R.; Freeman, K.R.; Fierer, N.; Neff, J.C.; Bowman, W.D.; Schadt, C.W.; Weintraub, M.N.; Schmidt, S.K. The effects of chronic nitrogen fertilization on alpine tundra soil microbial communities: Implications for carbon and nitrogen cycling. Environ. Microbiol. 2008, 10, 3093–3105. [Google Scholar] [CrossRef] [PubMed]
  56. Ramirez, K.S.; Lauber, C.L.; Knight, R.; Bradford, M.A.; Fierer, N. Consistent effects of nitrogen fertilization on soil bacterial communities in contrasting systems. Ecology 2010, 91, 3463–3470. [Google Scholar] [CrossRef] [Green Version]
  57. Fierer, N.; Leff, J.W.; Adams, B.J.; Nielsen, U.N.; Bates, S.T.; Lauber, C.L.; Owens, S.; Jack, G.A.; Wall, D.H.; Caporaso, J.G. Cross-biome metagenomic analyses of soil microbial communities and their functional attributes. Proc. Natl. Acad. Sci. USA 2012, 109, 21390–21395. [Google Scholar] [CrossRef] [PubMed] [Green Version]
  58. García-Orenes, F.; Morugán-Coronado, A.; Zornoza, R.; Scow, K. Changes in Soil Microbial Community Structure Influenced by Agricultural Management Practices in a Mediterranean Agro-Ecosystem. PLoS ONE 2013, 8, e80522. [Google Scholar] [CrossRef] [PubMed]
  59. Knelman, J.E.; Schmidt, S.K.; Lynch, R.C.; Darcy, J.L.; Castle, S.C.; Cleveland, C.C.; Nemergut, D.R. Nutrient addition dramatically accelerates microbial community succession. PLoS ONE 2014, 9, e102609. [Google Scholar] [CrossRef] [PubMed]
  60. Ladd, J.N.; Foster, R.C.; Skjemstad, J.O. Soil structure: Carbon and nitrogen metabolism. Geoderma 1993, 56, 401–434. [Google Scholar] [CrossRef]
  61. Beare, M.H.; Cabrera, M.L.; Hendrix, P.F.; Coleman, D.C. Aggregate-protected and unprotected organic matter pools in conventional and no-tillage soil. Soil Sci. Soc. Am. J. 1994, 58, 787–795. [Google Scholar] [CrossRef]
  62. Bardgett, R.D.; McAlister, E. The measurement of soil fungal: Bacterial biomass ratios as an indicator of ecosystem self-regulation in temperate meadow grasslands. Biol. Fertil. Soils 1999, 29, 282–290. [Google Scholar] [CrossRef]
  63. Bot, A.; Benites, J. The Importance of Soil Organic Matter; FAO: Viale delle Terme di Caracalla, Rome, Italy, 2005; ISBN 9251053669. [Google Scholar]
  64. Lal, R. Soil carbon stocks under present and future climate with specific reference to European ecoregions. Nutr. Cycl. Agroecosyst. 2008, 81, 113–127. [Google Scholar] [CrossRef]
  65. Smith, P. Land-use change and soil organic carbon dynamics. Nutr. Cycl. Agroecosyst. 2008, 81, 169–178. [Google Scholar] [CrossRef]
  66. Mishra, U.; Ussiri, D.A.N.; Lal, R. Tillage effects on soil organic carbon storage and dynamics in Corn Belt of Ohio, USA. Soil Tillage Res. 2010, 107, 88–96. [Google Scholar] [CrossRef]
  67. Glanz, J. Saving Our Soil: Solutions for Sustaining Earth’s Vital Resource; Johnson Printing: Boulder, CO, USA, 1995. [Google Scholar]
  68. Taghipour, A.; Rezapour, S.; Dovlati, B.; Hamzenejad, R. Effects of Land-use Changes on Some Soil Chemical Properties in Khoy, West Azerbaijan Province. Majallah-i āb va Khāk 2016, 29, 418–431. [Google Scholar] [CrossRef]
  69. Butterfield, C.N.; Li, Z.; Andeer, P.F.; Spaulding, S.; Thomas, B.C.; Singh, A.; Hettich, R.L.; Suttle, K.B.; Probst, A.J.; Tringe, S.G.; et al. Proteogenomic analyses indicate bacterial methylotrophy and archaeal heterotrophy are prevalent below the grass root zone. PeerJ 2016, 4, e2687. [Google Scholar] [CrossRef] [PubMed] [Green Version]
  70. Zhuang, G.; Heuer, V.; Lazar, C.; Goldhammer, T.; Wendt, J.; SaSongmarkin, V.; Elvert, M.; Teske, A.; Joye, S.; Hinrichs, K. Relative importance of methylotrophic methanogenesis in sediments of the Western Mediterranean Sea. Geochim. Et Cosmochim. Acta 2018, 224, 171–186. [Google Scholar] [CrossRef]
  71. Tedla, A.B. Direct and Residual Effects of Organic and Inorganic Fertilizers on Soil Chemical Properties, Microbial Components and Maize Yield Under Long-term Crop Rotation. Ph.D. Thesis, University of Pretoria, Pretoria, South Africa, 2013. [Google Scholar]
  72. Staley, C.; Gould, T.; Wang, P.; Phillips, J.; Cotner, J.; Sadowsky, M. Core functional traits of bacterial communities in the Upper Mississippi River show limited variation in response to land cover. Front. Microbiol. 2014, 5, 414. [Google Scholar] [CrossRef]
  73. Hariharan, J.; Sengupta, A.; Grewal, P.; Dick, W. Functional Predictions of Microbial Communities in Soil as Affected by Long-term Tillage Practices. Agric. Environ. Lett. 2017, 2, 1–5. [Google Scholar] [CrossRef]
  74. Jansson, J.; Hofmockel, K. The soil microbiome—From metagenomics to metaphenomics. Curr. Opin. Microbiol. 2018, 43, 162–168. [Google Scholar] [CrossRef]
  75. Lemanceau, P.; Bakker, P.; De Kogel, W.J.; Alabouvette, C.; Schippers, B. Effect of pseudobactin 358 production by Pseudomonas putida WCS358 on suppression of Fusarium wilt of carnations by non-pathogenic Fusarium oxysporum Fo47. Appl. Environ. Microbiol. 1992, 58, 2978–2982. [Google Scholar]
  76. Zaccardelli, M.; De Nicola, F.; Villecco, D.; Scotti, R. The development and suppressive activity of soil microbial communities under compost amendment. J. Soil Sci. Plant Nutr. 2013, 13, 730–742. [Google Scholar] [CrossRef]
  77. Van Loon, L.C.; Bakker, P.A.H.M.; Pieterse, C.M.J. Systemic resistance induced by rhizosphere bacteria. Annu. Rev. Phytopathol. 1998, 36, 453–483. [Google Scholar] [CrossRef]
  78. Baltz, R.H. Antimicrobials from Actinomycetes: Back to the Future. Microbe 2007, 2, 125–131. Available online: https://www.semanticscholar.org/paper/Antimicrobials-from-Actinomycetes-%3A-Back-to-the-are-Baltz/b80edf2f02e88eb7cf024fa1a5c593721cb713be#citing-papers (accessed on 13 September 2018).
Figure 1. Map of the study area showing the location of sampling areas in the Eastern Free State of South Africa. Black dots indicate the sampling locations. Map courtesy of Dr. Michelle Greve (University of Pretoria).
Diversity 11 00061 g001
Figure 2. Unique and shared phyla in agricultural and non-agricultural soils.
Diversity 11 00061 g002
Figure 3. Distance-based redundancy analysis (db-RDA) biplot of a) bacterial communities and soil chemistry parameters. Only the environmental variables that significantly (p < 0.05) explained variability in microbial community structure are shown (arrows). The direction of the vectors indicates the direction of maximum change of that variable, whereas the length of the vector represents how well the parameter explains the distribution of the data.
Diversity 11 00061 g003
Figure 4. A principal component analysis (PCA) plot showing differences in structure of bacterial communities between agricultural (red circles) and non-agricultural (blue circles) soil at phylum level. Unit variance scaling is applied to rows; Singular value decomposition (SVD) with imputation was used to calculate principal components. X and Y axes show Principal Component 1 and Principal Component 2 that explain 13.5% and 8.5% of the total variance, respectively. Prediction ellipses are such that with a 0.95 probability, a new observation from the same group will fall inside the ellipse. N = 40 data points.
Diversity 11 00061 g004
Figure 5. Principal Component Analysis plot of primary features computed using the STAMP software, based on multiple group analysis, applying ANOVA test, Games–Howell post hoc test for confidence interval method and Benjamin–Hochberg FDR for correction. X and Y axes indicate that Principal Components 1 and 2 explain 58.8% and 20.4% of the total variation in the predicted functions, respectively.
Diversity 11 00061 g005
Figure 6. Extended error bar plot showing the mean proportion (%) of significantly different predicted functional categories at level 3 found in soil bacterial communities. Points indicate the differences between agricultural and non-agricultural soil (blue and green bars, respectively), and the values on the right show the p-values that were derived from a White’s non-parametric t-test [36].
Diversity 11 00061 g006
Table 1. Total relative abundance of bacterial phyla detected in agricultural and non-agricultural soil samples from the EFS. P-values marked with an asterisk (*) indicate significant differences (p < 0.05).
PhylumAgriculturalNon-Agriculturalp-Value
Proteobacteria40%34%3.788 × 10⁻⁵ *
Actinobacteria23%40%0.0323 *
Bacteroidetes12%4%0.0410 *
Chloroflexi8%6%0.8106
Firmicutes7%4%0.4156
Acidobacteria3%6%3.877 × 10⁻⁵ *
Table 2. Differences in bacterial richness and diversity measures of the 16S rRNA gene libraries between the agricultural and non-agricultural soil samples. Standard deviations (SD) from the means are indicated in parentheses. Values with marked with an asterisk indicate the land use type that was significantly higher for each diversity index.
Diversity IndexAgriculturalNon-Agricultural
Richness598 (2.85) *504 (2.56)
ACE46.4 (2.78) *34.1 (3.20)
Chao144.5 (4.96) *33.0 (4.09)
Shannon2.80 (0.31) *2.58 (0.12)
Simpson0.76 (0.10)0.80 (0.03)

