Aquaculture-Mediated Invasion of the Genetically Improved Farmed Tilapia (Gift) into the Lower Volta Basin of Ghana
Abstract
1. Introduction
2. Materials and Methods
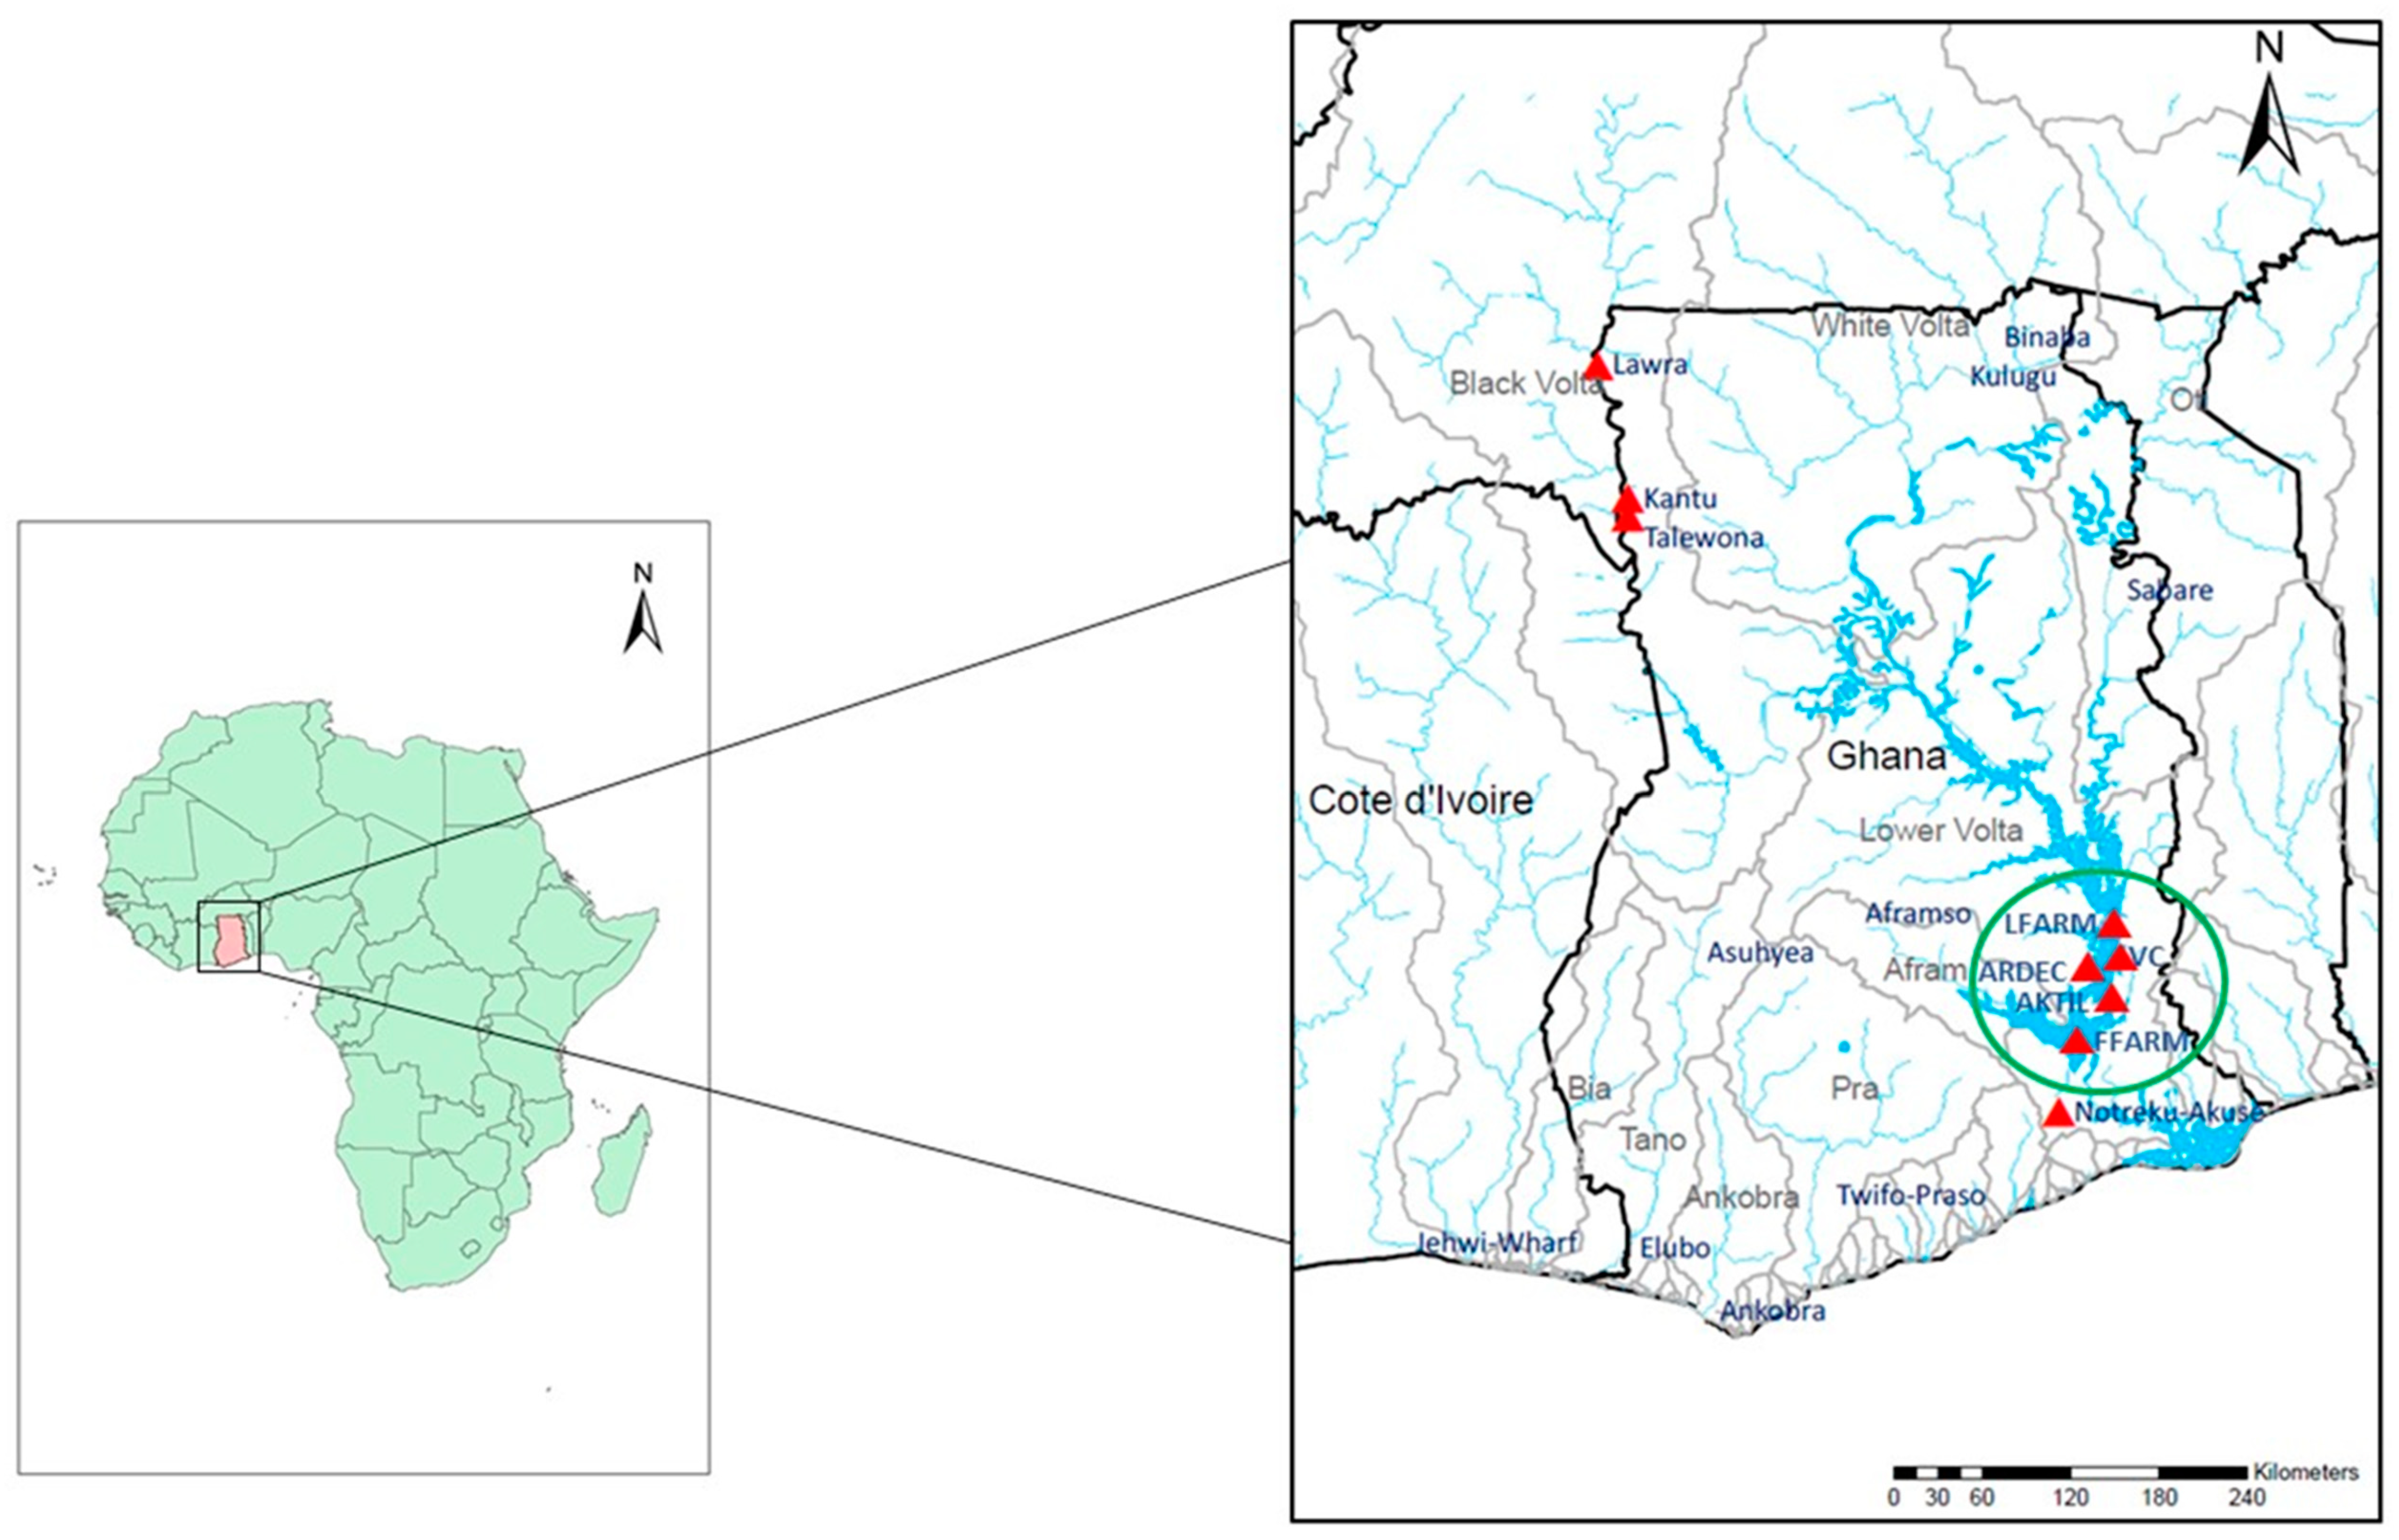
2.1. Fish Sampling and DNA Extraction
2.2. Mitochondrial DNA Sequences
2.2.1. D-loop Phylogenetic Relationships
2.2.2. CO1 Phylogenetic Relationships
2.3. Nuclear DNA Microsatellites
3. Results
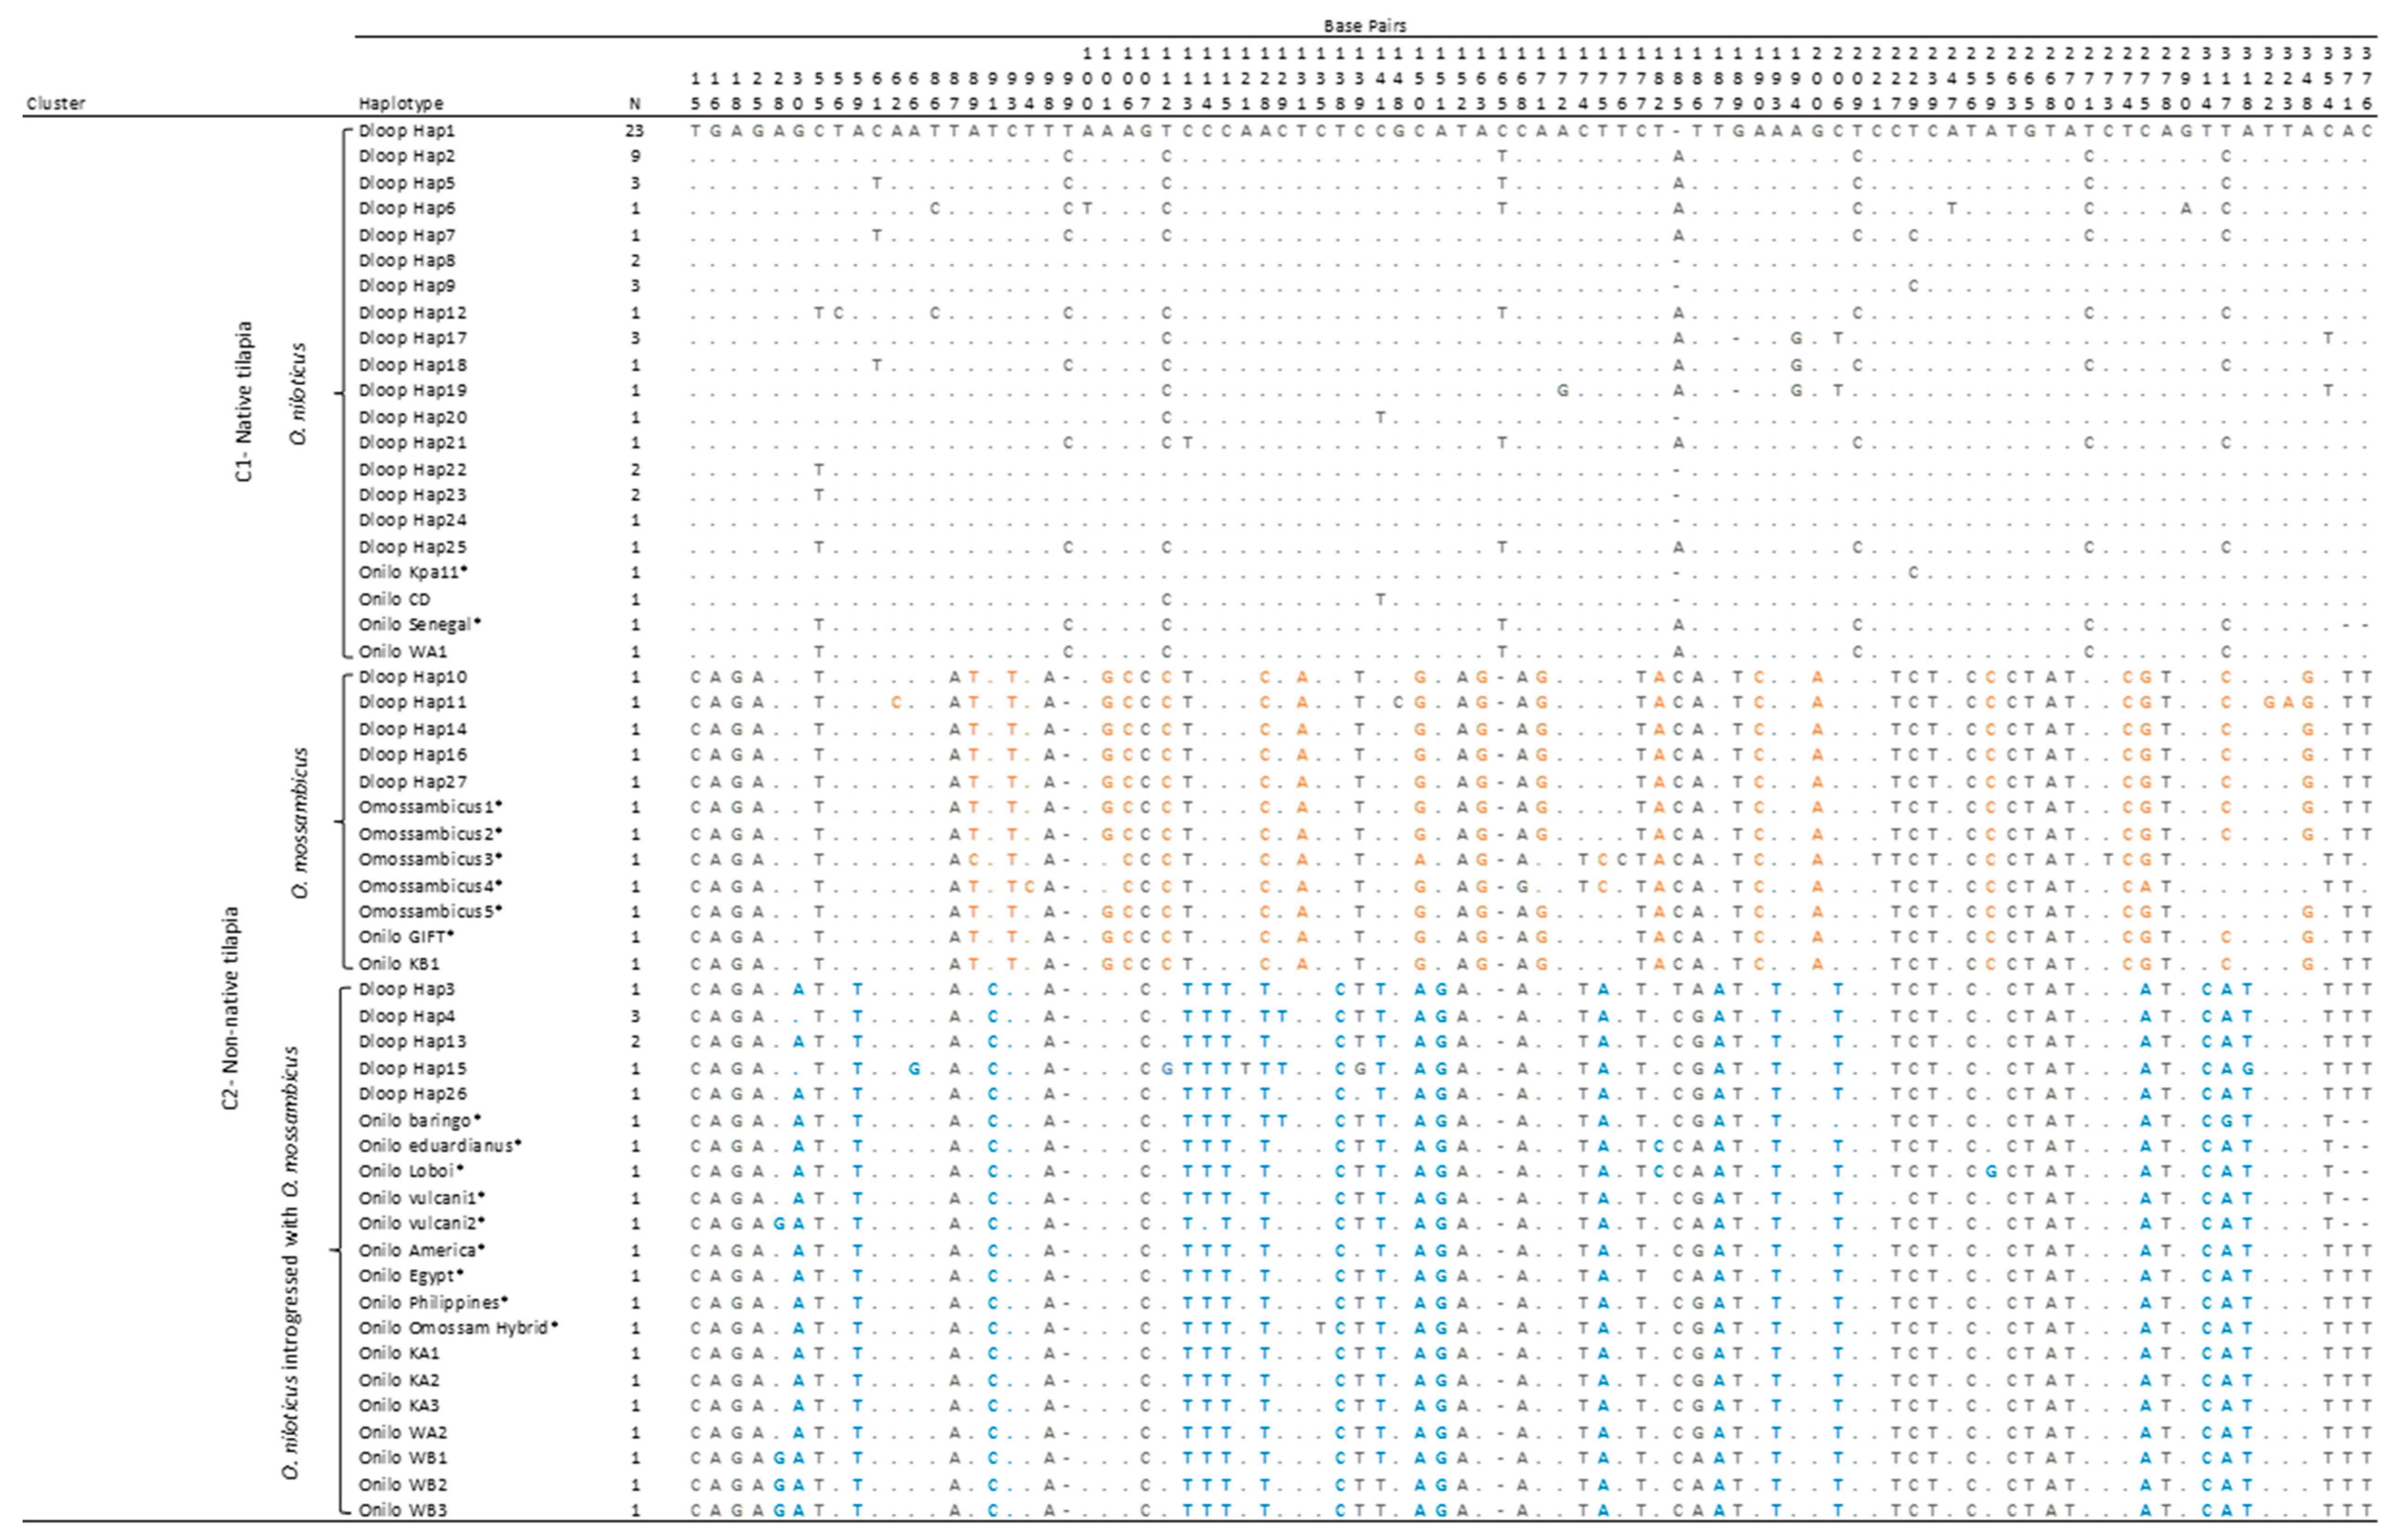
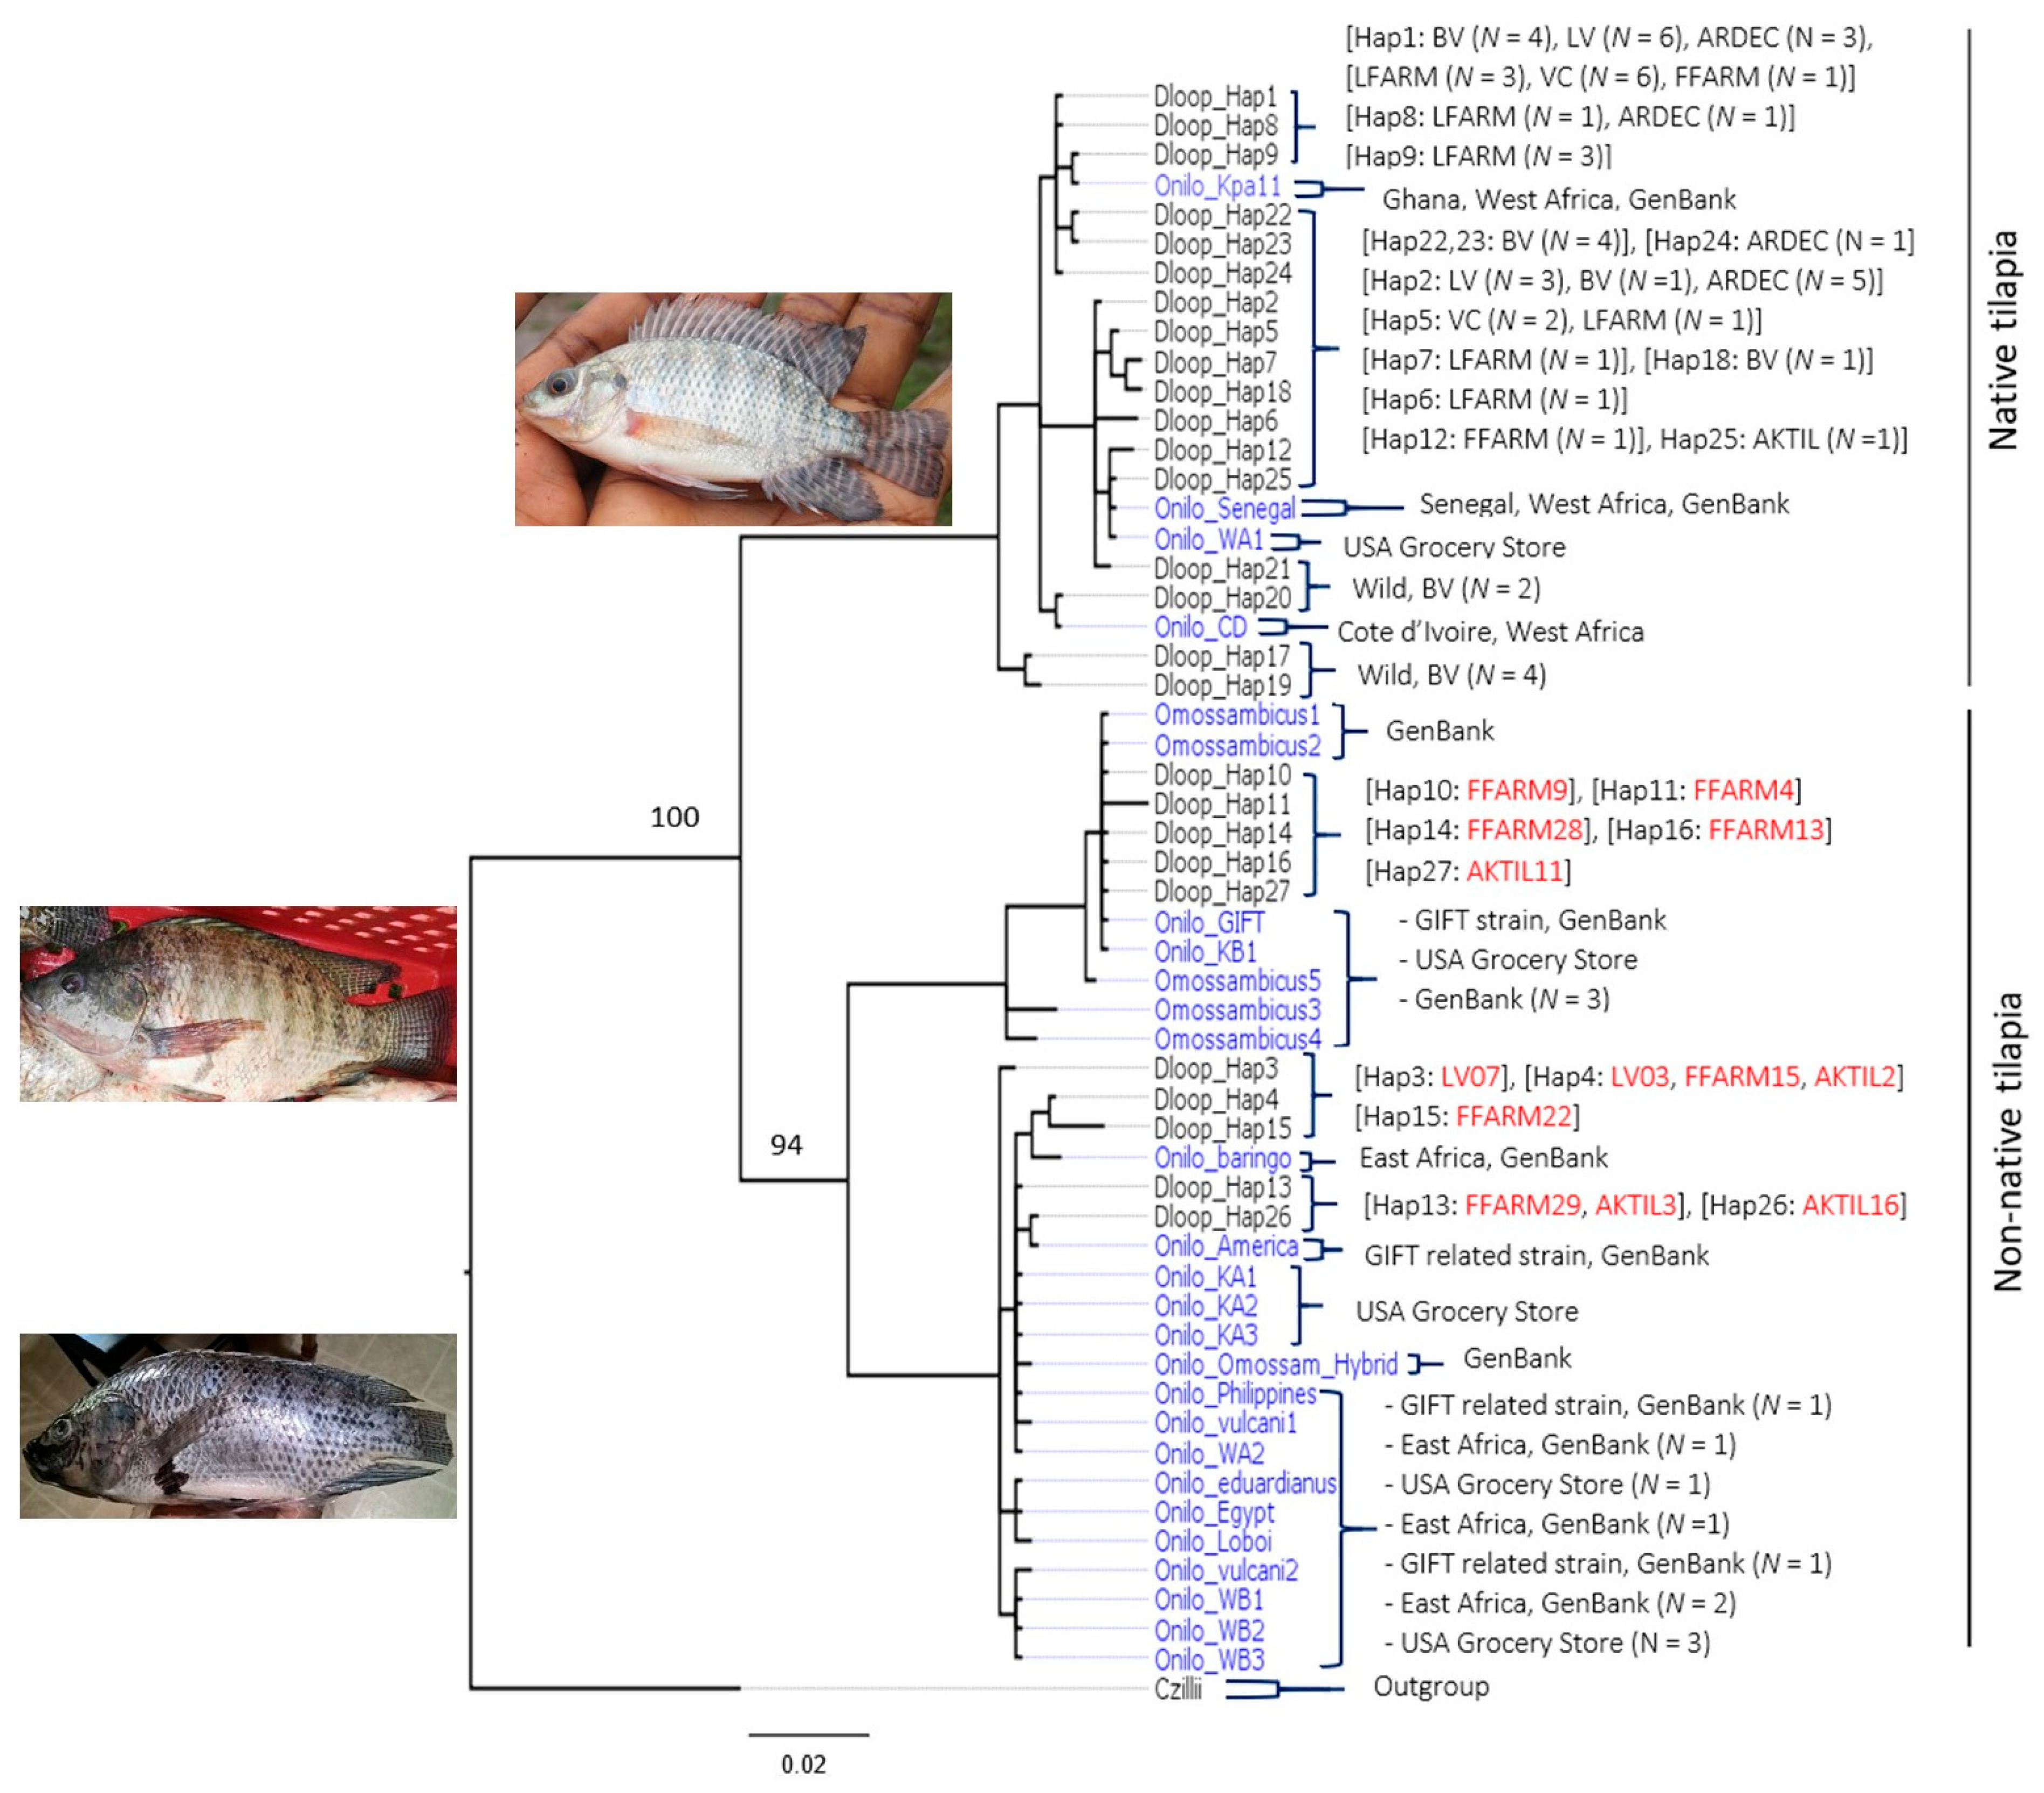
3.1. D-loop Haplotypes and Phylogenetic Relationships
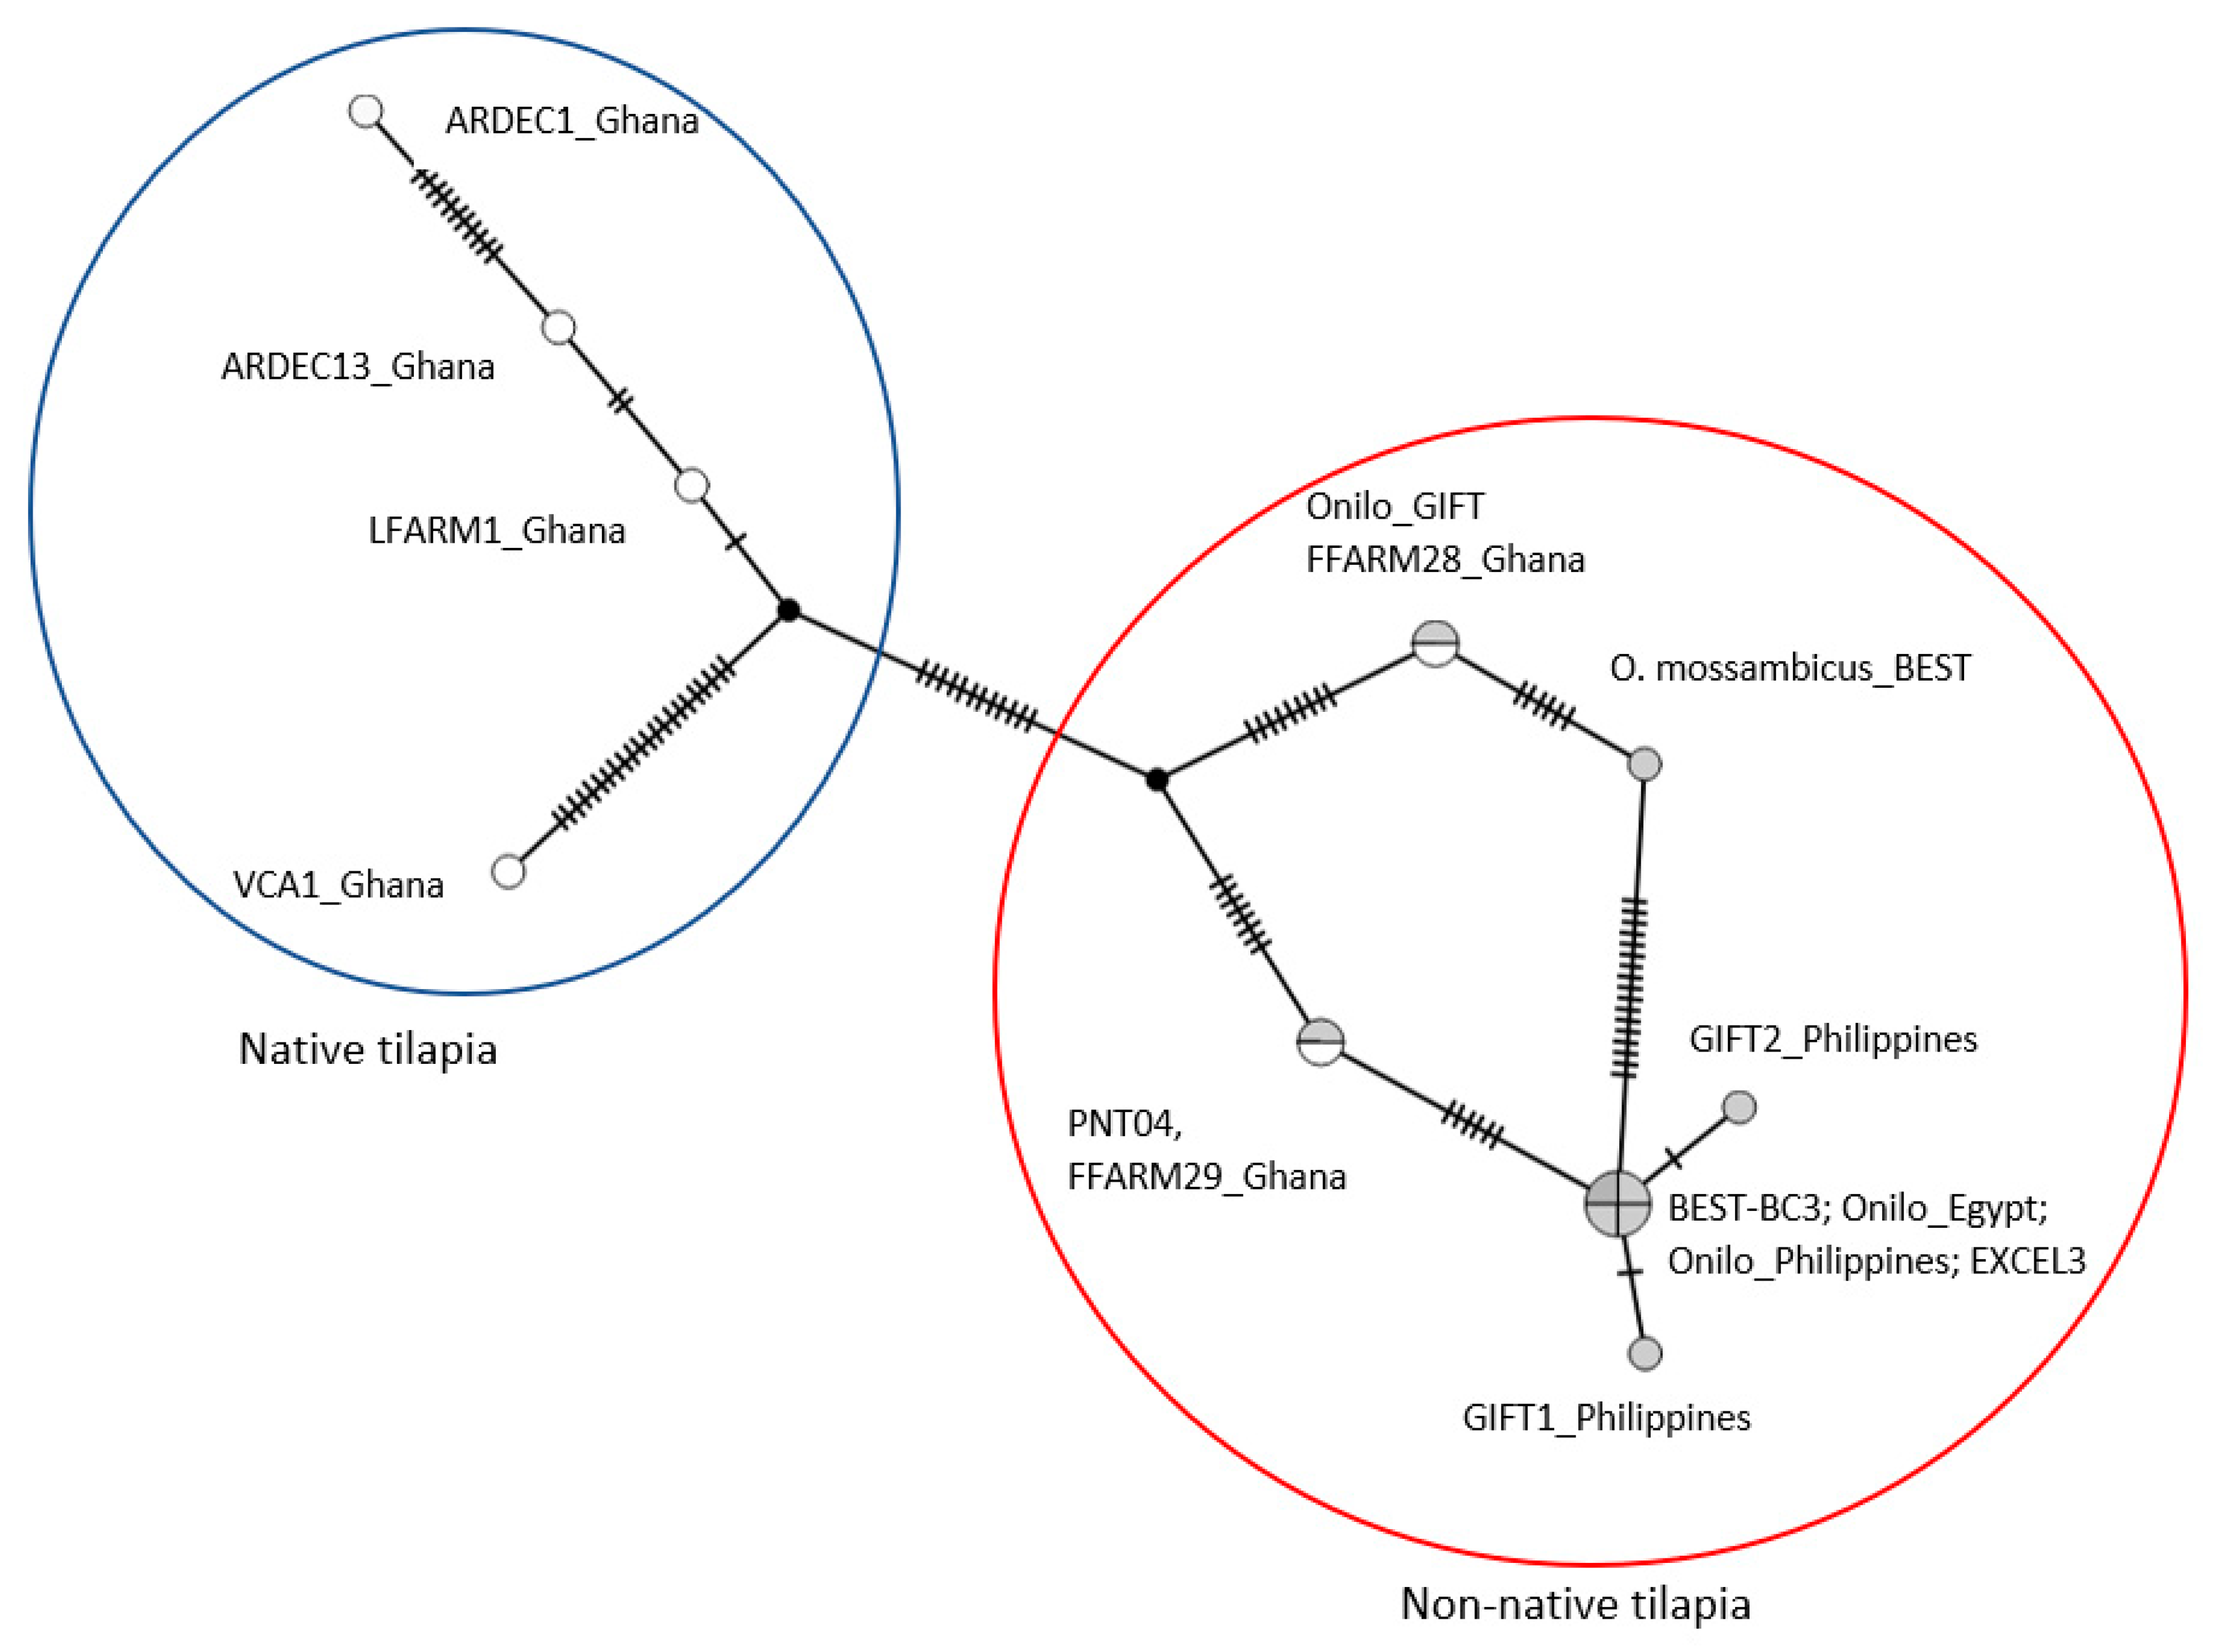
3.2. CO1 Phylogenetic Relationships
3.3. Genetic Variability in Microsatellite Genotypes
4. Discussion
4.1. Native Versus Non-Native Populations of O. Niloticus in Ghana
4.2. Aquaculture Mediating the Invasion of Non-Native Tilapia Strains
5. Conclusions and Implications
Author Contributions
Funding
Acknowledgments
Conflicts of Interest
Appendix A. Materials and Methods
| Population (N) | ||||||||
|---|---|---|---|---|---|---|---|---|
| Black Volta River | Lower Volta River | ARDEC | Lee’s Farm | Volta Catch | Akosombo Tilapia | Fujian Farm | ||
| Haplotype | N | (16) | (11) | (10) | (10) | (8) | (5) | (9) |
| Dloop Hap1 | 23 | 4 | 6 | 3 | 3 | 6 | 1 | |
| Dloop Hap2 | 9 | 1 | 3 | 5 | ||||
| Dloop Hap3 | 1 | 1 | ||||||
| Dloop Hap4 | 3 | 1 | 1 | 1 | ||||
| Dloop Hap5 | 3 | 1 | 2 | |||||
| Dloop Hap6 | 1 | 1 | ||||||
| Dloop Hap7 | 1 | 1 | ||||||
| Dloop Hap8 | 2 | 1 | 1 | |||||
| Dloop Hap9 | 3 | 3 | ||||||
| Dloop Hap10 | 1 | 1 | ||||||
| Dloop Hap11 | 1 | 1 | ||||||
| Dloop Hap12 | 1 | 1 | ||||||
| Dloop Hap13 | 2 | 1 | 1 | |||||
| Dloop Hap14 | 1 | 1 | ||||||
| Dloop Hap15 | 1 | 1 | ||||||
| Dloop Hap16 | 1 | 1 | ||||||
| Dloop Hap17 | 3 | 3 | ||||||
| Dloop Hap18 | 1 | 1 | ||||||
| Dloop Hap19 | 1 | 1 | ||||||
| Dloop Hap20 | 1 | 1 | ||||||
| Dloop Hap21 | 1 | 1 | ||||||
| Dloop Hap22 | 2 | 2 | ||||||
| Dloop Hap23 | 2 | 2 | ||||||
| Dloop Hap24 | 1 | 1 | ||||||
| Dloop Hap25 | 1 | 1 | ||||||
| Dloop Hap26 | 1 | 1 | ||||||
| Dloop Hap27 | 1 | 1 | ||||||

| Hap1 | Hap2 | Hap5 | Hap9 | Hap17 | Hap10 | Hap11 | Hap14 | Hap16 | Hap27 | Hap3 | Hap4 | Hap13 | Hap15 | Hap26 | |
|---|---|---|---|---|---|---|---|---|---|---|---|---|---|---|---|
| Hap1 (LVOLTA) | 0.000 | ||||||||||||||
| Hap2 (ARDEC) | 0.008 | 0.001 | |||||||||||||
| Hap5 (LVOLTA) | 0.011 | 0.003 | 0.000 | ||||||||||||
| Hap9 (LFARM) | 0.003 | 0.011 | 0.014 | 0.000 | |||||||||||
| Hap17 (BVOLTA) | 0.011 | 0.014 | 0.017 | 0.014 | 0.000 | ||||||||||
| Hap10 (FFARM) | 0.152 | 0.148 | 0.152 | 0.148 | 0.160 | N = 1 | |||||||||
| Hap11 (FFARM) | 0.152 | 0.148 | 0.152 | 0.156 | 0.160 | 0.042 | N = 1 | ||||||||
| Hap14 (FFARM) | 0.141 | 0.137 | 0.141 | 0.145 | 0.149 | 0.022 | 0.019 | N = 1 | |||||||
| Hap16 (FFARM) | 0.144 | 0.140 | 0.144 | 0.148 | 0.152 | 0.011 | 0.042 | 0.028 | N = 1 | ||||||
| Hap27 (AKTIL) | 0.148 | 0.144 | 0.148 | 0.152 | 0.156 | 0.008 | 0.045 | 0.025 | 0.003 | N = 1 | |||||
| Hap3 (LVOLTA) | 0.134 | 0.143 | 0.147 | 0.138 | 0.134 | 0.138 | 0.131 | 0.124 | 0.134 | 0.137 | N = 1 | ||||
| Hap4 (LVOLTA) | 0.134 | 0.143 | 0.147 | 0.138 | 0.134 | 0.134 | 0.127 | 0.120 | 0.133 | 0.137 | 0.008 | 0.000 | |||
| Hap13 (FFARM) | 0.134 | 0.143 | 0.147 | 0.138 | 0.134 | 0.134 | 0.127 | 0.120 | 0.133 | 0.137 | 0.003 | 0.005 | 0.000 | ||
| Hap15 (FFARM) | 0.146 | 0.150 | 0.154 | 0.150 | 0.142 | 0.145 | 0.138 | 0.131 | 0.145 | 0.149 | 0.022 | 0.014 | 0.019 | N = 1 | |
| Hap26 (AKTIL) | 0.130 | 0.138 | 0.143 | 0.134 | 0.130 | 0.138 | 0.131 | 0.123 | 0.137 | 0.141 | 0.005 | 0.008 | 0.003 | 0.019 | N = 1 |
| Locus | Populations (N) | |||||||
|---|---|---|---|---|---|---|---|---|
| AD (30) | LE (32) | VC (29) | AT (19) | FF (30) | LV (33) | BV (39) | ||
| UNH123 | HE | 0.76 | 0.79 | 0.84 | 0.84 | 0.85 | 0.74 | 0.78 |
| HO | 0.90 | 0.88 | 0.89 | 0.89 | 0.80 | 0.58 | 0.69 | |
| A | 10.00 | 9.00 | 10.00 | 11.00 | 11.00 | 10.00 | 11.00 | |
| PHWE | NS | NS | NS | NS | NS | * | * | |
| UNH178 | HE | 0.83 | 0.77 | 0.85 | 0.68 | 0.51 | 0.81 | 0.77 |
| HO | 0.80 | 0.81 | 0.93 | 0.89 | 0.57 | 0.82 | 0.54 | |
| A | 8 | 10 | 8 | 6 | 8 | 9 | 10 | |
| PHWE | NS | NS | NS | NS | NS | NS | * | |
| UNH180 | HE | 0.58 | 0.65 | 0.47 | 0.76 | 0.77 | 0.53 | 0.72 |
| HO | 0.40 | 0.61 | 0.31 | 0.63 | 0.63 | 0.48 | 0.69 | |
| A | 4 | 5 | 6 | 5 | 7 | 7 | 6 | |
| PHWE | NS | * | * | NS | NS | * | * | |
| UNH203 | HE | 0.69 | 0.70 | 0.52 | 0.83 | 0.82 | 0.68 | 0.40 |
| HO | 0.60 | 0.75 | 0.62 | 0.68 | 0.67 | 0.67 | 0.28 | |
| A | 4 | 5 | 3 | 7 | 8 | 4 | 3 | |
| PHWE | NS | NS | NS | NS | NS | NS | * | |
| UNH858 | HE | 0.85 | 0.88 | 0.68 | 0.87 | 0.87 | 0.90 | 0.83 |
| HO | 0.83 | 0.81 | 0.66 | 0.89 | 0.73 | 0.97 | 0.74 | |
| A | 9 | 11 | 10 | 10 | 12 | 15 | 16 | |
| PHWE | * | * | NS | NS | * | * | * | |
| UNH898 | HE | 0.75 | 0.75 | 0.70 | 0.86 | 0.86 | 0.83 | 0.80 |
| HO | 0.47 | 0.69 | 0.48 | 0.95 | 0.80 | 0.73 | 0.59 | |
| A | 10 | 11 | 6 | 13 | 13 | 14 | 12 | |
| PHWE | * | NS | * | NS | NS | NS | * | |
| UNH934 | HE | 0.36 | 0.60 | 0.42 | 0.69 | 0.73 | 0.70 | 0.63 |
| HO | 0.37 | 0.69 | 0.45 | 0.53 | 0.67 | 0.67 | 0.54 | |
| A | 5 | 7 | 5 | 4 | 6 | 10 | 10 | |
| PHWE | NS | NS | NS | NS | NS | NS | * | |
| UNH991 | HE | 0.62 | 0.73 | 0.62 | 0.88 | 0.88 | 0.55 | 0.72 |
| HO | 0.67 | 0.78 | 0.55 | 0.95 | 0.87 | 0.58 | 0.72 | |
| A | 5 | 6 | 5 | 10 | 10 | 9 | 6 | |
| PHWE | NS | NS | NS | NS | NS | NS | NS | |
| Mean ± SD | HE | 0.68 ± 0.15 | 0.73 ± 0.08 | 0.64 ± 0.15 | 0.80 ± 0.08 | 0.79 ± 0.12 | 0.72 ± 0.12 | 0.71 ± 0.13 |
| HO | 0.63 ± 0.19 | 0.75 ± 0.08 | 0.61 ± 0.20 | 0.80 ± 0.15 | 0.72 ± 0.09 | 0.69 ± 0.14 | 0.60 ± 0.14 | |
| A | 6.88 ± 2.47 | 8.00 ± 2.40 | 6.63 ± 2.34 | 8.25 ± 2.99 | 9.38 ± 2.34 | 9.75 ± 3.31 | 9.25 ± 3.83 | |
| AD | LE | VC | AT | FF | LV | BV | |
|---|---|---|---|---|---|---|---|
| AD | ─ | ||||||
| LE | 0.028 | ─ | |||||
| VC | 0.045 | 0.043 | ─ | ||||
| AT | 0.176 | 0.118 | 0.195 | ─ | |||
| FF | 0.188 | 0.118 | 0.207 | 0.002 NS | ─ | ||
| LV | 0.024 | 0.039 | 0.069 | 0.153 | 0.155 | ─ | |
| BV | 0.102 | 0.088 | 0.101 | 0.186 | 0.188 | 0.091 | ─ |
References
- De Silva, S.S.; Subasinghe, R.P.; Bartley, D.M.; Lowther, A. Tilapias as Alien Aquatics in Asia and the Pacific: A Review; Food and Agriculture Organization: Rome, Italy, 2004; Volume 453. [Google Scholar]
- Eknath, A.E.; Hulata, G. Use and exchange of genetic resources of Nile tilapia (Oreochromis niloticus). Rev. Aquac. 2009, 1, 197–213. [Google Scholar] [CrossRef]
- Ordoñez, J.F.F.; Ventolero, M.F.H.; Santos, M.D. Maternal mismatches in farmed tilapia strains (Oreochromis spp.) in the Philippines as revealed by mitochondrial COI gene. Mitochondrial DNA Part A 2017, 28, 526–535. [Google Scholar] [CrossRef] [PubMed]
- Ponzoni, R.W.; Nguyen, N.H.; Khaw, H.L.; Hamzah, A.; Bakar, K.R.A.; Yee, H.Y. Genetic improvement of Nile tilapia (Oreochromis niloticus) with special reference to the work conducted by the WorldFish Center with the GIFT strain. Rev. Aquac. 2011, 3, 27–41. [Google Scholar] [CrossRef]
- Eknath, A.E.; Tayamen, M.M.; Palada-de Vera, M.S.; Danting, J.C.; Reyes, R.A.; Dionisio, E.E.; Capili, J.B.; Bolivar, H.L.; Abella, T.A.; Circa, A.V.; et al. Genetic improvement of farmed tilapias: The growth performance of eight strains of Oreochromis niloticus tested in different farm environments. Aquaculture 1993, 111, 171–188. [Google Scholar] [CrossRef]
- Eknath, A.E.; Dey, M.M.; Rye, M.; Gjerde, B.; Abella, T.A.; Sevilleja, R.; Tayamen, M.M.; Reyes, R.A.; Bentsen, H.B. Selective breeding of Nile tilapia for Asia. In Proceedings of the 6th World Congress of Genetics Applied to Livestock Production, Armidale, Australia, 11–16 January 1998; ICLARM Contribution No. 1397. International Center for Living Aquatic Resources Management: Manila, The Philippines, 1998. [Google Scholar]
- Dey, M.M. The impact of genetically improved farmed Nile tilapia in Asia. Aquac. Econ. Manag. 2000, 4, 107–124. [Google Scholar] [CrossRef]
- Eknath, A.E.; Bentsen, H.B.; Ponzoni, R.W.; Rye, M.; Nguyen, N.H.; Thodesen, J.; Gjerde, B. Genetic improvement of farmed tilapias: Composition and genetic parameters of a synthetic base population of Oreochromis niloticus for selective breeding. Aquaculture 2007, 273, 1–14. [Google Scholar] [CrossRef]
- Gupta, M.V.; Acosta, B.O. From drawing board to dining table: The success story of the GIFT project. NAGA World Fish Center Q. 2004, 27, 4–14. [Google Scholar]
- Attipoe, F.Y.; Blay Jnr, J.; Agyakwah, S.; Ponzoni, R.W.; Khaw, H.L.; Abban, E.K. Genetic parameters and response to selection in the development of Akosombo strain of the Nile tilapia (Oreochromis niloticus) in the Volta Basin, Ghana. In Proceedings of the International Symposium on Tilapia in Aquaculture, Jerusalem, Palestine, 6–10 October 2013. [Google Scholar]
- Dewedar, R. Fast-Growing Fish Variety Could Benefit Egypt and West Africa. The Science and Development Network. Available online: http://www.scidev.net/en/agriculture-and-environment/fisheries/news/fast-growing-fish-variety-could-benefit-egypt-and-west-africa-.html (accessed on 4 November 2016).
- Mireku, K.K.; Kassam, D.; Changadeya, W.; Attipoe, F.Y.K.; Adinortey, C.A. Assessment of genetic variations of Nile Tilapia (Oreochromis niloticus L.) in the Volta Lake of Ghana using microsatellite markers. Afr. J. Biotechnol. 2017, 16, 312–321. [Google Scholar] [CrossRef]
- Ansah, Y.B.; Frimpong, E.A.; Hallerman, E.M. Genetically-improved tilapia strains in Africa: Potential benefits and negative impacts. Sustainability 2014, 6, 3697–3721. [Google Scholar] [CrossRef]
- Rognon, X.; Andriamanga, M.; McAndrew, B.; Guyomard, R. Allozyme variation in natural and cultured populations in two tilapia species: Oreochromis niloticus and Tilapia zillii. Heredity 1996, 76, 640–650. [Google Scholar] [CrossRef][Green Version]
- Bezault, E.; Balaresque, P.; Toguyeni, A.; Fermon, A.; Araki, H.; Baroiller, J.-F.; Rognon, X. Spatial and temporal variation in population genetic structure of wild Nile tilapia (Oreochromis niloticus) across Africa. BMC Genet. 2011, 12, 102. [Google Scholar] [CrossRef] [PubMed]
- Falk, T.M.; Abban, E.K. Genetic diversity of the Nile tilapia Oreochromis niloticus (Teleostei, Cichlidae) from the Volta System in Ghana. In Biodiversity, Management and Utilization of West African Fishes, WorldFish Center Conference Proceedings; Abban, E.K., Casal, C.M.V., Dugan, P., Falk, T.M., Eds.; WorldFish Center: Penang, Malaysia, 2004; pp. 13–15. [Google Scholar]
- Agnèse, J.-F.; Adepo-Gourene, B.; Abban, E.K.; Fermon, Y. Genetic differentiation among natural populations of the Nile tilapia Oreochromis niloticus (Teleostei, Cichlidae). Heredity 1997, 79, 89–96. [Google Scholar] [CrossRef] [PubMed][Green Version]
- Ward, R.D.; Hanner, R.; Hebert, P.D. The campaign to DNA barcode all fishes, FISH-BOL. J. Fish Biol. 2009, 74, 329–356. [Google Scholar] [CrossRef] [PubMed]
- Nyingi, D.; De Vos, L.; Aman, R.; Agnèse, J.-F. Genetic characterization of an unknown and endangered native population of the Nile tilapia Oreochromis niloticus (Linnaeus, 1758) (Cichlidae; Teleostei) in the Loboi Swamp (Kenya). Aquaculture 2009, 297, 57–63. [Google Scholar] [CrossRef]
- Ivanova, N.V.; Zemlak, T.S.; Hanner, R.H.; Hebert, P.D.N. Universal primer cocktails for fish DNA barcoding. Mol. Ecol. Notes 2007, 7, 544–548. [Google Scholar] [CrossRef]
- Larkin, M.A.; Blackshields, G.; Brown, N.P.; Chenna, R.; McGettigan, P.A.; McWilliam, H.; Valentin, F.; Wallace, I.M.; Wilm, A.; Lopez, R.; et al. Clustal W and Clustal X version 2.0. Bioinformatics 2007, 23, 2947–2948. [Google Scholar] [CrossRef]
- Kumar, S.; Stecher, G.; Tamura, K. MEGA7: Molecular Evolutionary Genetics Analysis version 7.0 for bigger datasets. Mol. Biol. Evol. 2016, 33, 1870–1874. [Google Scholar] [CrossRef]
- Rozas, J.; Ferrer-Mata, A.; Sanchez-DelBarrio, J.C.; Guirao-Rico, S.; Librado, P.; Ramos-Onsins, S.E.; Sanchez-Gracia, A. DnaSP 6: DNA sequence polymorphism analysis of large datasets. Mol. Biol. Evol. 2017, 34, 3299–3302. [Google Scholar] [CrossRef]
- Altschul, S.F.; Gish, W.; Miller, W.; Myers, E.W.; Lipman, D.J. Basic local alignment search tool. J. Mol. Biol. 1990, 215, 403–410. [Google Scholar] [CrossRef]
- Nylander, J.A.A. MrModeltest 2.3. Program Distributed by the Author. Evolutionary Biology Centre, Uppsala University. Available online: https://github.com/nylander/MrModeltest2 (accessed on 6 June 2018).
- Swafford, D.L. PAUP; Version 4.0; Sinauer Associates, Inc.: Sunderland, MA, USA, 2002. [Google Scholar]
- Ronquist, F.; Teslenko, M.; van der Mark, P.; Ayres, D.L.; Darling, A.; Höhna, S.; Larget, B.; Liu, L.; Suchard, M.A.; Huelsenbeck, J.P. MrBayes 3.2: Efficient Bayesian phylogenetic inference and model choice across a large model space. Syst. Biol. 2012, 61, 539–542. [Google Scholar] [CrossRef]
- Rambaut, A. Figtree. Tree Figure Drawing Tool. Version 1.4.2. Available online: http://tree.bio.ed.ac.uk/software/figtree (accessed on 6 June 2018).
- Templeton, A.R.; Crandall, K.A.; Sing, C.F. A cladistic analysis of phenotypic associations with haplotypes inferred from restriction endonuclease mapping and DNA sequence data. III. Cladogram estimation. Genetics 1992, 132, 619–633. [Google Scholar] [PubMed]
- Clement, M.; Snell, Q.; Walker, P.; Posada, D.; Crandall, K. TCS: Estimating gene Genealogies. In Proceedings of the 16th International Parallel and Distributed Processing Symposium (IPDPS 2002), Fort Lauderdale, FL, USA, 15–19 April 2002; p. 184. [Google Scholar]
- Carleton, K.L.; Streelman, J.T.; Lee, B.-Y.; Garnhart, N.; Kidd, M.; Kocher, T.D. Rapid isolation of CA microsatellites from the tilapia genome. Anim. Genet. 2002, 33, 140–144. [Google Scholar] [CrossRef] [PubMed]
- Streelman, J.T.; Kocher, T.D. Microsatellite variation associated with prolactin expression and growth of salt-challenged tilapia. Physiol. Genom. 2002, 9, 1–4. [Google Scholar] [CrossRef] [PubMed]
- Cnaani, A.; Hallerman, E.M.; Ron, M.; Weller, J.I.; Kashi, Y.; Gall, G.A.E.; Hulata, G. A chromosomal region with quantitative trait loci affecting cold tolerance and fish size in an F2 tilapia hybrid. Aquaculture 2003, 223, 117–128. [Google Scholar] [CrossRef]
- Frimpong, E.A.; Amisah, S.; Anane-Taabeah, G.; Ampofo-Yeboah, A. Identifying Local Strains of Oreochromis Niloticus that Are Adapted to Future Climate Conditions; Report Submitted to United States Agency for International Development (USAID); Aquaculture Innovation Lab, Oregon State University: Corvallis, OR, USA, 2016; p. 32. [Google Scholar]
- Van Oosterhout, C.; Hutchinson, W.F.; Willis, D.P.M.; Shipley, P. Microchecker: Software for identifying and correcting genotyping errors in microsatellite data. Mol. Ecol. Notes 2004, 4, 535–538. [Google Scholar] [CrossRef]
- Sokal, R.R.; Rohlf, F.J. Biometry: The Principles and Practice of Statistics in Biological Research, 3rd ed.; W.H. Freeman: New York, NY, USA, 1994. [Google Scholar]
- Excoffier, L.; Laval, G.; Schneider, S. ARLEQUIN, version 3.0: An integrated software package for population genetics data analysis. Evol. Bioinform. 2005, 1, 47–50. [Google Scholar] [CrossRef]
- Guo, S.; Thompson, E. Performing the exact test of Hardy–Weinberg proportion for multiple alleles. Biometrics 1992, 48, 361–372. [Google Scholar] [CrossRef]
- Slatkin, M.; Excoffier, L. Testing for linkage disequilibrium in genotypic data using the EM algorithm. Heredity 1996, 76, 377–383. [Google Scholar] [CrossRef]
- Rice, W.R. Analyzing tables of statistical tests. Evolution 1989, 43, 223–225. [Google Scholar] [CrossRef]
- Wright, S. Evolution and the Genetics of Populations, Vol. 4, Variability Within and Among Natural Populations; University of Chicago Press: Chicago, IL, USA, 1978. [Google Scholar]
- Raymond, M.; Rousset, F. GENEPOP (version 1.2): Population genetics software for exact tests and ecumenicism. J. Hered. 1995, 86, 248–249. [Google Scholar] [CrossRef]
- Pritchard, J.K.; Stephens, M.; Donnelly, P. Inference of population structure using multilocus genotype data. Genetics 2000, 155, 945–959. [Google Scholar] [PubMed]
- Falush, D.; Stephens, M.; Pritchard, J.K. Inference of population structure using multilocus genotype data: Linked loci and correlated allele frequencies. Genetics 2003, 164, 1567–1587. [Google Scholar] [PubMed]
- Evanno, G.; Regnaut, S.; Goudet, J. Detecting the number of clusters of individuals using the software structure: A simulation study. Mol. Ecol. 2005, 14, 2611–2620. [Google Scholar] [CrossRef]
- Earl, D.A.; von Holdt, B.M. STRUCTURE HARVESTER: A website and program for visualizing STRUCTURE output and implementing the Evanno method. Conserv. Genet. Resour. 2012, 4, 359–361. [Google Scholar] [CrossRef]
- Kopelman, N.M.; Mayzel, J.; Jakobsson, M.; Rosenberg, N.A.; Mayrose, I. Clumpak: A program for identifying clustering modes and packaging population structure inferences across K. Mol. Ecol. Resour. 2015, 15, 1179–1191. [Google Scholar] [CrossRef]
- Falk, T.M.; Teugels, G.G.; Abban, E.D.; Villwock, W.; Renwrantz, L. Phylogeographic patterns in populations of the black-chinned tilapia complex (Teleostei, Cichlidae) from coastal areas in West Africa: Support for the refuge zone theory. Mol. Phylogenet. Evol. 2003, 27, 81–92. [Google Scholar] [CrossRef]
- Eknath, A.E.; Macaranas, J.M.; Agustin, L.Q.; Velasco, R.R.; Ablan, M.C.A.; Pante, M.J.R.; Pullin, R.S.V. Biochemical and morphometric approaches to characterize farmed tilapias. NAGA 1991, 14, 7–9. [Google Scholar]
- Rognon, X.; Guyomard, R. Large extent of mitochondrial DNA transfer from Oreochromis aureus to O. niloticus in West Africa. Mol. Ecol. 2003, 12, 435–445. [Google Scholar] [CrossRef] [PubMed]
- Ford, A.G.; Bullen, T.R.; Pang, L.; Genner, M.J.; Bills, R.; Flouri, T.; Ngatunga, B.P.; Rüber, L.; Schliewen, U.K.; Seehausen, O.; et al. Molecular phylogeny of Oreochromis (Cichlidae: Oreochromini) reveals mito-nuclear discordance and multiple colonisation of adverse aquatic environments. Mol. Phylogenet. Evol. 2019, 136, 215–226. [Google Scholar] [CrossRef]
- Todesco, M.; Pascual, M.A.; Owens, G.L.; Ostevik, K.L.; Moyers, B.T.; Hübner, S.; Heredia, S.M.; Hahn, M.A.; Caseys, C.; Bock, D.G.; et al. Hybridization and extinction. Evol. Appl. 2016, 9, 892–908. [Google Scholar] [CrossRef]
- Ndiwa, T.C.; Nyingi, D.W.; Agnèse, J.-F. An important natural genetic resource of Oreochromis niloticus (Linnaeus, 1758) threatened by aquaculture activities in Loboi Drainage, Kenya. PLoS ONE 2014, 9, e106972. [Google Scholar] [CrossRef] [PubMed]
- Shechonge, A.; Ngatunga, B.P.; Bradbeer, S.J.; Day, J.J.; Ford, A.G.P.; Kihedu, J.; Richmond, T.; Mzighani, S.; Smith, A.M.; Sweke, E.A.; et al. Widespread colonisation of Tanzanian catchments by introduced Oreochromis tilapia fishes: The legacy from decades of deliberate introduction. Hydrobiologia 2019, 832, 235–253. [Google Scholar] [CrossRef] [PubMed]
- Romana-Eguia, M.R.R.; Ikeda, M.; Basiao, Z.U.; Taniguchi, N. Genetic diversity in farmed Asian Nile and red hybrid tilapia stocks evaluated from microsatellite and mitochondrial DNA analysis. Aquaculture 2004, 236, 131–150. [Google Scholar] [CrossRef]
- Van Bers, N.E.M.; Crooijmans, R.P.M.A.; Dibbits, B.W.; Komen, J.; Groenen, M.A.M. SNP marker detection and genotyping in tilapia. Mol. Ecol. Resour. 2012, 12, 932–941. [Google Scholar] [CrossRef] [PubMed]
- Xia, J.H.; Wan, Z.Y.; Ng, Z.L.; Wang, L.; Fu, G.H.; Liu, G.; Liu, F.; Yue, G.H. Genome-wide discovery and in-silico mapping of gene-associated SNPs in Nile tilapia. Aquaculture 2014, 432, 67–73. [Google Scholar] [CrossRef]
- Delomas, T.A.; Gomelsky, B.; Vu, N.; Campbell, M.R.; Novelo, N.D. Single-nucleotide polymorphism discovery and genetic variation in YY-male and mixed-sex strains of Nile tilapia available in the United States. N. Am. J. Aquac. 2019, 81, 183–188. [Google Scholar] [CrossRef]


| Site Name | Sampling Location | Source | Nuclear DNA (N) | mtDNA (N) |
|---|---|---|---|---|
| Black Volta River | Kantu ** | Wild | 39 | 16 |
| Lower Volta River | Notreku-Akuse | Wild | 33 | 11 |
| ARDEC * | Akosombo | Farm | 30 | 10 |
| Lee’s Farm | Akosombo | Farm | 32 | 10 |
| Volta Catch | Asokwa-Kumasi | Farm | 29 | 8 |
| Akosombo Tilapia | Ashaiman | Farm | 19 | 5 |
| Fujian Farm | Asutuare | Farm | 30 | 9 |
| Locus | Primer Sequences (5′ to 3′) | Base-pair Range | Annealing Temp (°C) | GenBank Accession Number |
|---|---|---|---|---|
| UNH123 | F: CATCATCACAGACAGATTAGA | 171–245 | 54 | G12276.1 |
| R: GATTGAGATTTCATTCAAG | ||||
| UNH130 | F: AGGAAGAATAGCATGTAGCAAGTA | 164–242 | 58 | G12283.1 |
| R: GTGTGATAAATAAAGAGGCAGAAA | ||||
| UNH178 | F: GTCACACCTCCATCATC | 114–144 | 58 | G12330.1 |
| R: AGTTGTTTGGTCGTGTAAG | ||||
| UNH180 | F: GCAACTAATCACACAATTTT | 121–187 | 58 | G12332.1 |
| R: GTTTAAGTTAAAAACAAATTCGTTT | ||||
| UNH203 | F: CACAAAGATGTCTAAACATGT | 65–97 | 56 | G12354.1 |
| R: GAATTTGACAGTTTGTTGTTTAC | ||||
| UNH858 | F: TTCAAACAGCTTCACGGTCA | 196–252 | 58 | G68194.1 |
| R: CTATGCCATGGCTAAAGTCAC | ||||
| UNH898 | F: GATGTCCCCACAAGGTATGAA | 214–292 | 58 | G68215.1 |
| R: TAATCCACTCACCCCGTTTC | ||||
| UNH925 | F: GTAGCTGCTGGGGTCTGAAG | 172–252 | 58 | G68234.1 |
| R: TAGCACTCTGCCACTTGTCC | ||||
| UNH934 | F: ACTGCAATGAAATGCTGCTT | 214–246 | 58 | G68240.1 |
| R: CCATTCCTCAGAGCACAACA | ||||
| UNH991 | F: AAGCCTTGCATAAAACAGCA | 150-182 | 58 | G68271.1 |
| R: AAAGTTTGCTGCCCTCAGTG |
| Source of Variation | d.f. | Sum of Squares | Percentage of Variation |
|---|---|---|---|
| Among populations | 6 | 129.88 | 11.15 |
| Within populations | 417 | 1054.86 | 88.85 |
| Total | 423 | 1184.74 |
© 2019 by the authors. Licensee MDPI, Basel, Switzerland. This article is an open access article distributed under the terms and conditions of the Creative Commons Attribution (CC BY) license (http://creativecommons.org/licenses/by/4.0/).
Share and Cite
Anane-Taabeah, G.; Frimpong, E.A.; Hallerman, E. Aquaculture-Mediated Invasion of the Genetically Improved Farmed Tilapia (Gift) into the Lower Volta Basin of Ghana. Diversity 2019, 11, 188. https://doi.org/10.3390/d11100188
Anane-Taabeah G, Frimpong EA, Hallerman E. Aquaculture-Mediated Invasion of the Genetically Improved Farmed Tilapia (Gift) into the Lower Volta Basin of Ghana. Diversity. 2019; 11(10):188. https://doi.org/10.3390/d11100188
Chicago/Turabian StyleAnane-Taabeah, Gifty, Emmanuel A. Frimpong, and Eric Hallerman. 2019. "Aquaculture-Mediated Invasion of the Genetically Improved Farmed Tilapia (Gift) into the Lower Volta Basin of Ghana" Diversity 11, no. 10: 188. https://doi.org/10.3390/d11100188
APA StyleAnane-Taabeah, G., Frimpong, E. A., & Hallerman, E. (2019). Aquaculture-Mediated Invasion of the Genetically Improved Farmed Tilapia (Gift) into the Lower Volta Basin of Ghana. Diversity, 11(10), 188. https://doi.org/10.3390/d11100188


