Article

Age-Independent Adult Mortality in a Long-Lived Herb

by
Stina Edelfeldt
1,2,*,
Torbjörn Lindell
3 and
Johan P. Dahlgren
1,2
1
Department of Biology, University of Southern Denmark, Campusvej 55, 5230 Odense M, Denmark
2
Interdisciplinary Centre on Population Dynamics, University of Southern Denmark, Campusvej 55, 5230 Odense M, Denmark
3
Department of Ecology, Environment and Plant Sciences, Stockholm University, 106 91 Stockholm, Sweden
*
Author to whom correspondence should be addressed.
Diversity 2019, 11(10), 187; https://doi.org/10.3390/d11100187
Submission received: 28 July 2019 / Revised: 25 September 2019 / Accepted: 27 September 2019 / Published: 1 October 2019
(This article belongs to the Special Issue Bayesian Survival Trajectory Analysis in Wildlife)

Abstract

:
Relative to mammals and birds, little is known about the mortality trajectories of perennial plants, as there are few long-term demographic studies following multiple yearly cohorts from birth to death. This is particularly important because if reproductively mature individuals show actuarial senescence, current estimations of life spans assuming constant survival would be incorrect. There is also a lack of studies documenting how life history trade-offs and disturbance influence the mortality trajectories of plants. We conducted Bayesian survival trajectory analyses (BaSTA) of a 33-year individual-based dataset of Pulsatilla vulgaris ssp. gotlandica. Mortality trajectories corresponded to “Type III” survivorship patterns, with rapidly decreasing annual mortality rates for young plants, but with constant mortality for reproductively mature individuals. We found trade-off effects resulting in a cost of growth for non-reproductive plants but no apparent cost of reproduction. Contrarily to our expectation, young plants that had previously shrunk in size had a lower mortality. However, accounting for trade-offs and disturbance only had minor effects on the mortality trajectories. We conclude that BaSTA is a useful tool for assessing mortality patterns in plants if only partial age information is available. Furthermore, if constant mortality is a general pattern in polycarpic plants, long-term studies may not be necessary to assess their age-dependent demography.

1. Introduction

Understanding the mortality trajectories of plants is important for developing life history theory and to predict the dynamics of populations of special interest, such as threatened or economically important populations. Increasing mortality with age in reproductively mature individuals, i.e., actuarial senescence, seems to occur in some perennial plants [1,2,3,4], while other studies show no evidence of this [5,6,7,8]. However, as there are few long-term plant-demographic studies collecting data on individual plants for a time period longer than the average life span of the species [9], general patterns are still unknown. In addition, age-based demographic parameters, such as life expectancy, are typically calculated based on stage-based models [10,11,12], and as such, models assume that there is no age-dependency in mortality that is not correlated with life cycle stage, these estimations may be incorrect.
Although there are numerous studies about the life spans of trees, where growth rings have been used to estimate ages, little is still known about the life spans of long-lived perennials herbs (reviewed in Dahlgren and Roach [9]). Herbaceous perennials typically display Type III survivorship curves, with a very low seedling survival and a low initial life expectancy, but with high survival and life expectancy for reproductively mature plants [13,14,15]. However, little is known about the mortality trajectories at older ages.
Trade-offs between survival, growth and reproduction are common in plants, even though they have often been difficult to detect in short-term within-population studies [3,16]. Such trade-offs may alter the shape of mortality trajectories. Increased growth rates have been shown to be correlated with higher mortality [17], particularly in tree and shrub seedlings and saplings [18,19,20,21]. Relationships between reproduction and mortality vary considerably [16]. High reproduction can sometimes be correlated with high mortality [9,22], while in other long-lived plants, the same level of reproduction can continue up to old ages without any apparent effect on mortality [6,23,24]. It is hard to predict how individual variation in growth and reproduction may influence mortality trajectories, because growth [25] and reproduction [9], can both be affected by age as well.
The shape of mortality trajectories can also be affected by the environment [2,26]. In the “damage accumulation” hypothesis of the evolutionary cause of senescence, the onset of senescence varies with the environment [27]. Disturbances or stochastic environmental fluctuations, could favor allocation to reproduction rather than growth or survival [28]. In many cases, perennial plants can be expected to shrink as a result of a disturbance, for instance, if they lose biomass due to herbivory or trampling. A decrease in size may have an adverse effect on survival. However, adaptive shrinkage in response to external influence has also been suggested as one way by which plants may achieve greater longevity [29,30].
In this study, we present analyses of long-term demographic data on plant individuals of Pulsatilla vulgaris ssp. gotlandica, collected between 1985 and 2018 at three study sites on the Baltic island Gotland in Sweden. Despite its exceptional length, this study does not cover the entire potential life span of the herb, and a number of the monitored individuals lived throughout the study. To still be able to estimate mortality trajectories for this plant, we used the BaSTA R package [31]. BaSTA was developed with incomplete recapture/recovery data from animal studies in mind but has also been used in long-term plant studies, for instance when analyzing senescence effects in an orchid [3], seedling survival [32] and deadwood decay [33]. Our main aim was to assess the mortality trajectory of Pulsatilla vulgaris ssp. gotlandica and to investigate whether it is influenced by growth and reproduction trade-offs, or by disturbance in terms of how frequently plants have been recorded to shrink. We addressed the following specific questions:
  • Does the predicted mortality trajectory support the existence of demographic senescence?
  • What is the life expectancy at different ages, as projected by the best-fitting mortality trajectory?
  • Is there evidence of trade-offs between survival, reproduction and growth?
  • How does plant shrinkage influence survival?

2. Materials and Methods

2.1. Study Plants

Pulsatilla vulgaris ssp. gotlandica is a perennial, 20–30-cm-tall herb with large violet blue flowers, found only at three parishes (Ardre, Kräklingbo and Gammelgarn) on the island of Gotland, Sweden [34]. It grows in open areas on thin calcareous soils. Fruit production is common [35], but dispersal is normally limited, with seeds travelling only short distances by wind, resulting in new populations rarely being formed [36]. Plants typically reach an age of at least 10 years before flowering [37]. As the ability to germinate quickly decreases after the first year, persistent seed banks are virtually non-existent [37]. The plant produces upright rhizomes with leaf rosettes that sometimes branch so that individuals may form several shoots with one or two stems per shoot, each stem bearing only one flower. Pulsatilla vulgaris ssp. gotlandica is currently listed as vulnerable in the IUCN Red List of Threatened Species.

2.2. Study Sites

All three study sites with Pulsatilla vulgaris ssp. gotlandica are located in similar environments but differ in that site 1 (Botvalde in Ardre parish at 57°22′56.3″ N, 18°40′33.7″ E) is a sparsely-wooded pine forest with a low tree-layer, while site 2 (Russvätar in Ardre parish at 57°23′11.7″ N, 18°43′41.8″ E) and site 3 (Hällträsk in Gammelgarn parish at 57°26′11.8″ N, 18°47′3.4″ E) are semi-open areas with scattered pine trees and junipers. The main differences between the sites are that site 2 is the most open, with patches of bare soil, and that site 3 is more densely vegetated by other plant species. In addition, the population at site 1 consists of about 1000 flowering individuals (counted 2009) and was apparently discovered in 1939, site 2 hosts about 39,000 flowering individuals (counted 2009) and has existed since before 1910 when it was first discovered by botanists, and site 3 has fewer than 100 individuals and was first reported in 1966 [34]. The plants were counted by dividing each population into 30 m × 30 m squares and noting the approximate number of visible flowering individuals per square. We did not observe any indication of effects of intraspecific density-dependence in these populations.

2.3. Data Collection and Calculation

Five permanent one-square-meter plots were placed at each site in 1985 and fixed with iron rods. First, an area with many flowering individuals was chosen. A profile consisting of five plots adjacent to each other was then placed within the chosen area. The location and orientation of the first plot in the profile were chosen randomly, with the prerequisite that all plots should contain flowering individuals in order to assure a sufficient sample size of reproductively mature individuals. Within each plot, the position of each individual was measured with a fixed ruler. In addition, maps of each plot were made. On the rare occasion when plants grew close enough to risk being mistaken for each other, they were marked with aluminum rings. All plants per plot were measured each year between 1985 and 2018 in the end of July or in August when the leaf rosettes were fully developed. The total numbers of plants included in the demographic study were 544, 454 and 212 at sites 1–3, respectively. Sample size per year varied from 26 to 271 (average 56), 29 to 196 (average 50) and 7 to 178 (average 34). In the plots, the number of individuals varied from 2 to 89 (average 11.1), 1 to 74 (average 10.1) and 1 to 48 (average 3.2). The total numbers of observations from all years during the study period were 1888, 1718 and 1159. During the years 1996–1998, 2007–2009, and 2016–2017, only flowering and survival were recorded. Data for diameter these years were interpolated, assuming linear growth (or shrinkage) across the missing years. All the plants that germinated during the study were mapped and incorporated in future monitoring. Due to the limited number of individuals in population 3, all the plants outside of the permanent plots were also followed, although the year of germination for these plants is more uncertain. Size was measured as the largest diameter (mm) of the leaf rosette. Growth (average diameter/year) was estimated for individuals that were observed at least two years using a mixed effects linear regression model of size as a function of age and with growth slopes varying among individuals (lmer function in R [38]). Reproductive output was measured as the number of flowers per year. Shrinkage was used as an indicator of the frequency of individual-level disturbances, presumably caused by factors such as trampling, predation, or drought or cold damage, causing plants to directly or indirectly decrease in size and was calculated for plants with at least two observations as the proportion of yearly transitions the plant decreased in size. Drought was probably one of the most common disturbances due to the thin soil and exposed environment where high summer temperatures are common, but predation and damage by animals were observed at the sites and were probably also common. We looked at the frequency of shrinkage rather than the absolute amount over time, as we wanted to describe the disturbance over the entire life course of the plants and avoid large effects of one-time extreme events. We did not observe any indication of damage caused by humans over the study years.

2.4. Analysis and Modelling
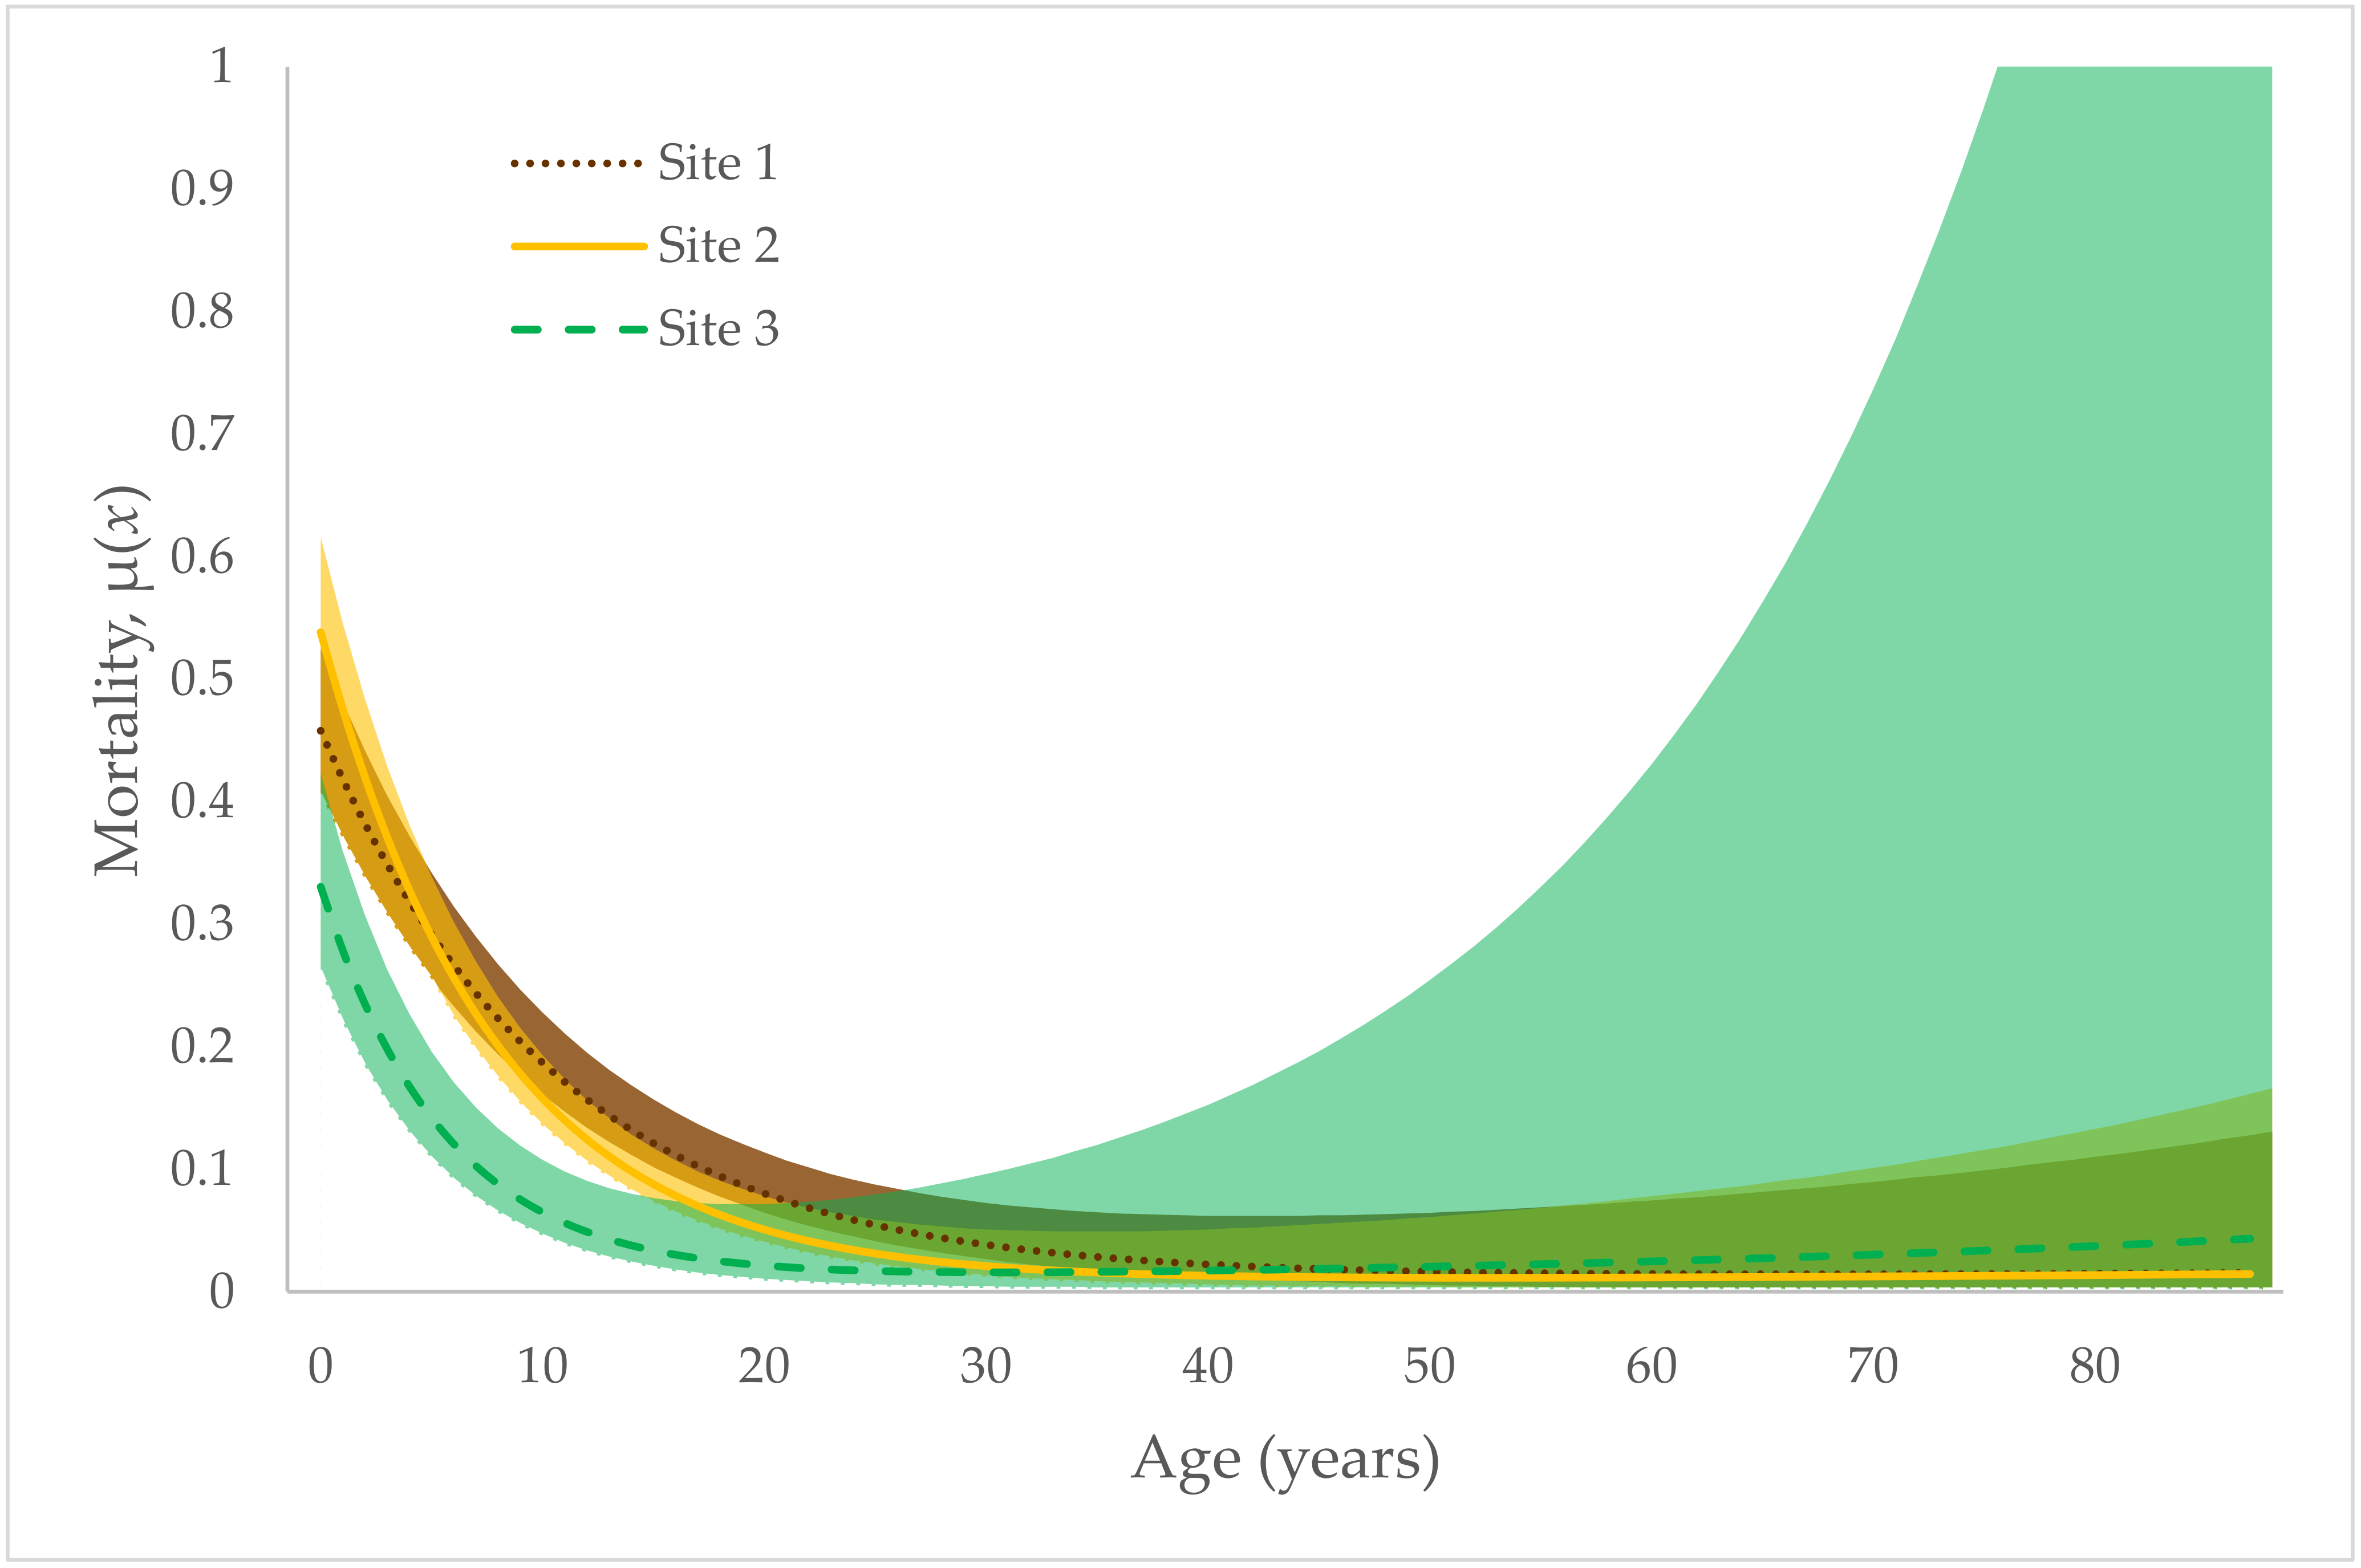
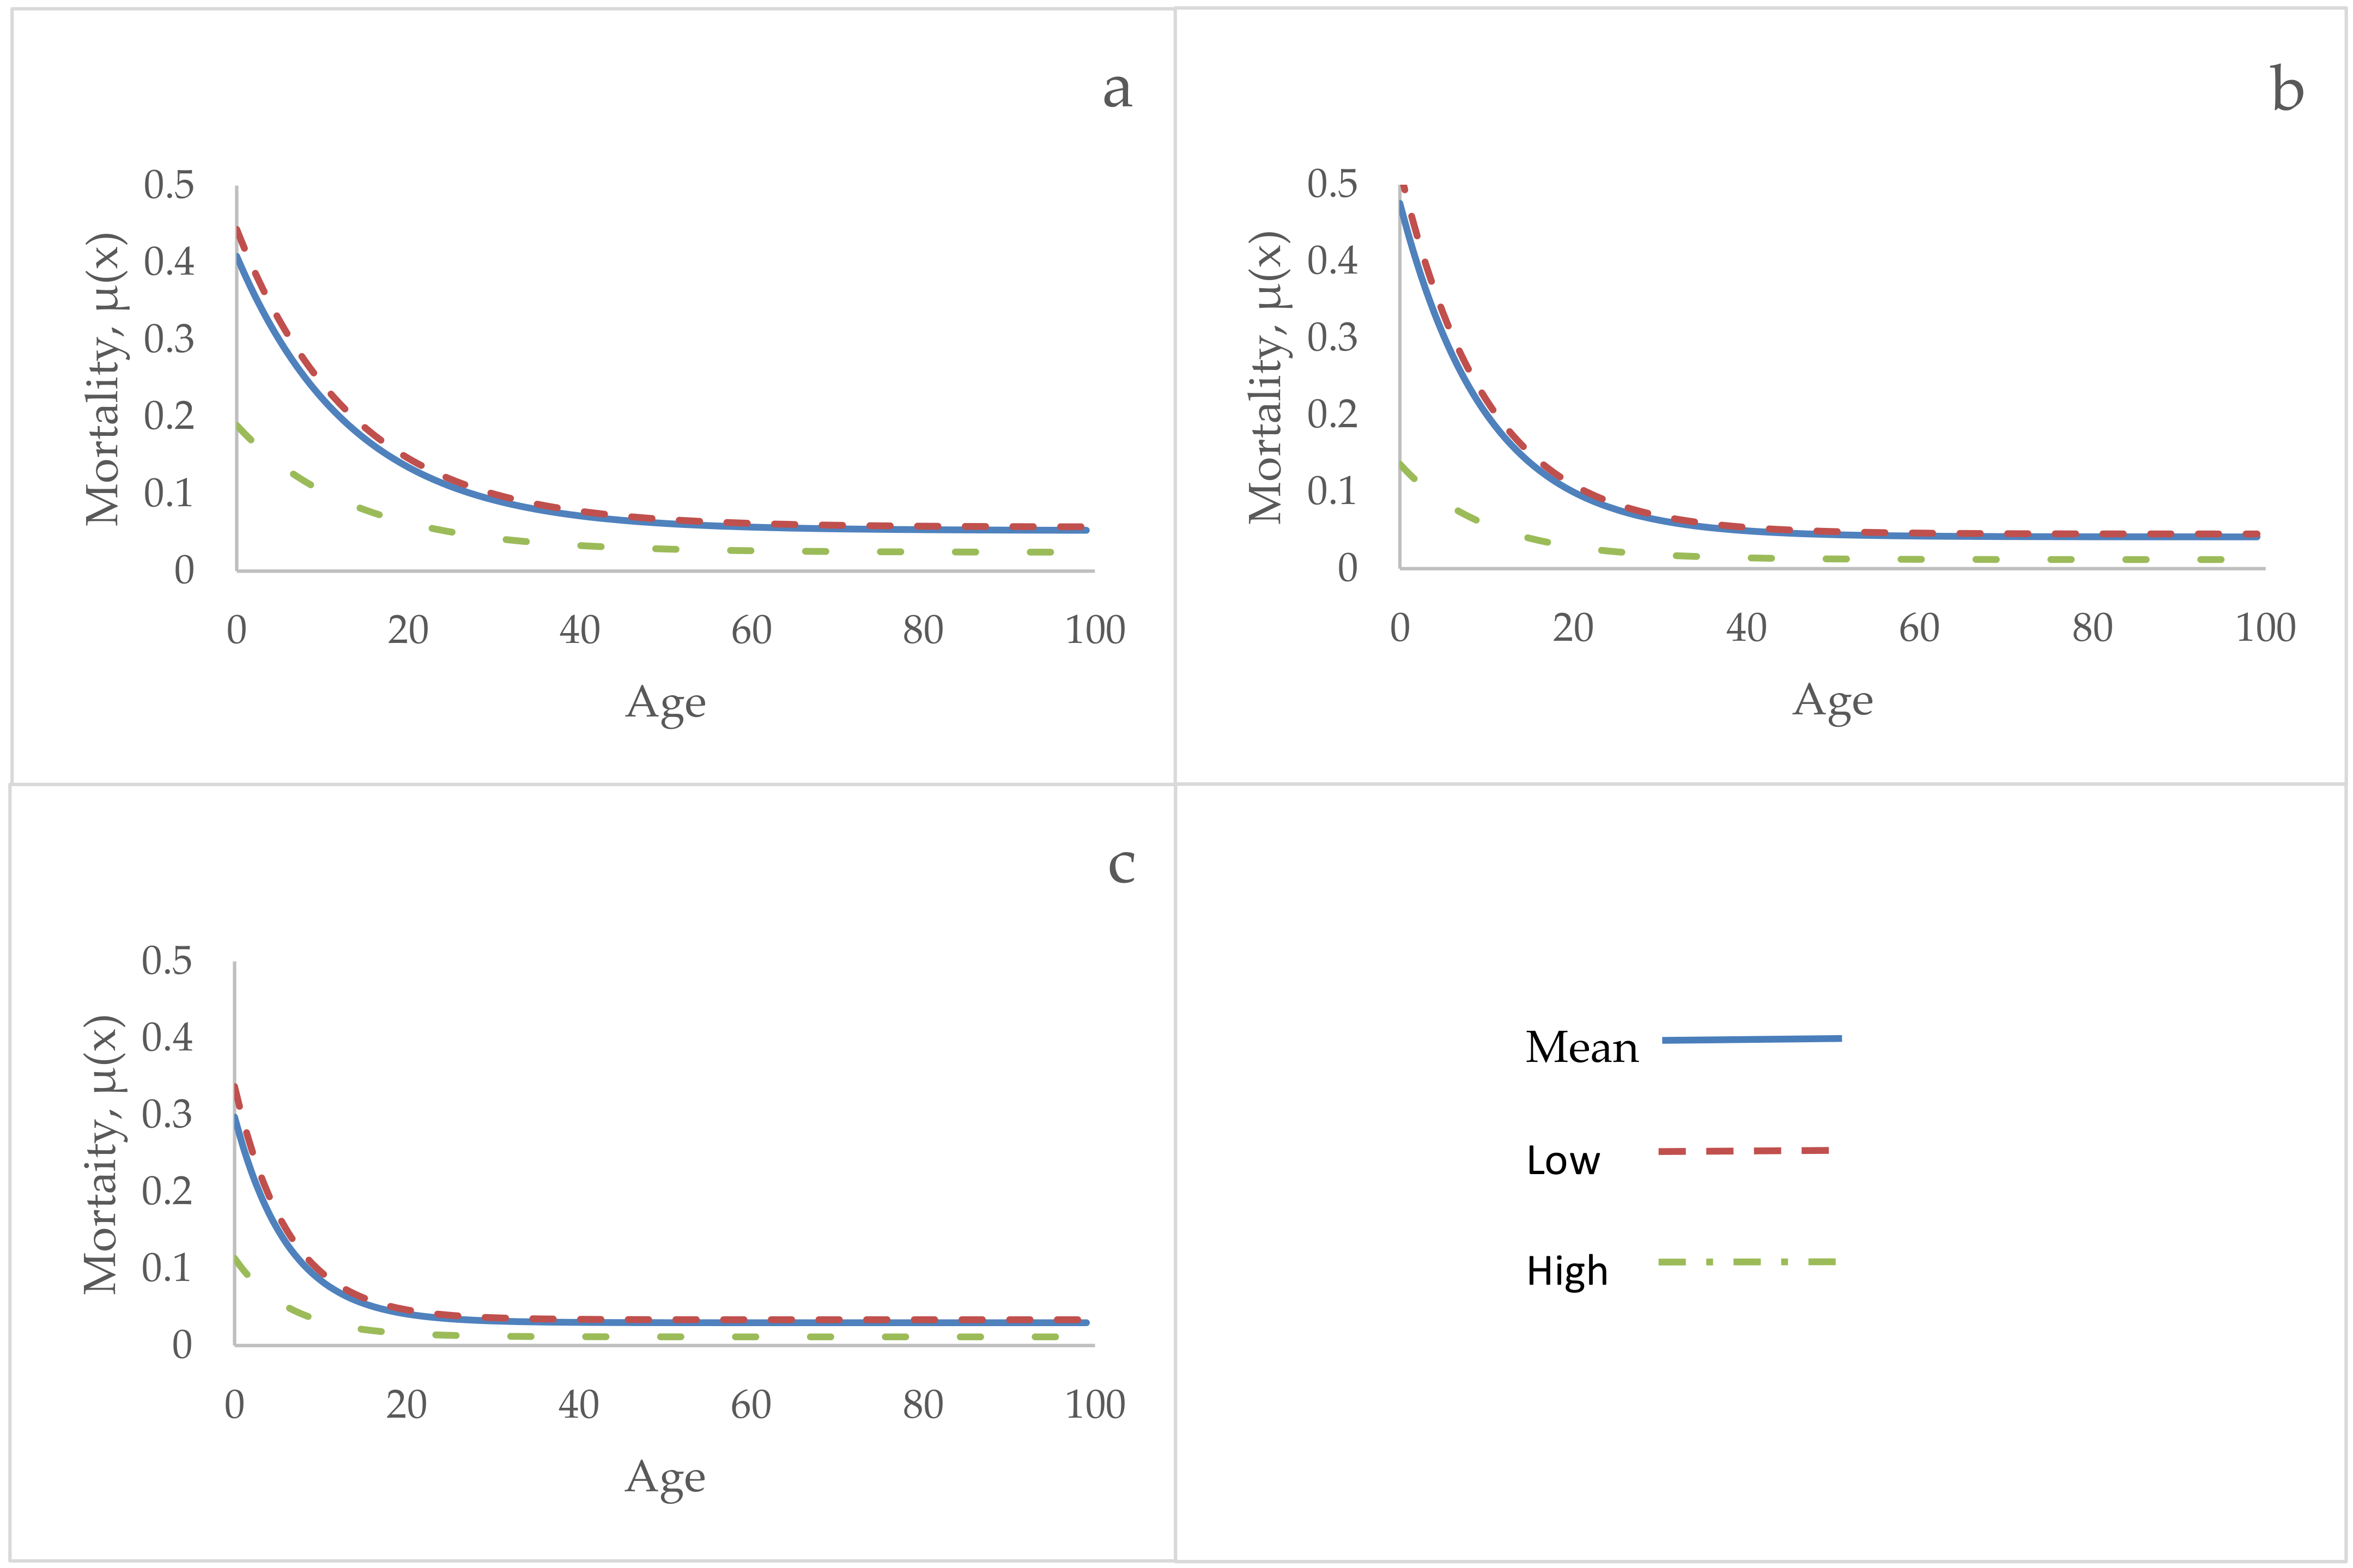
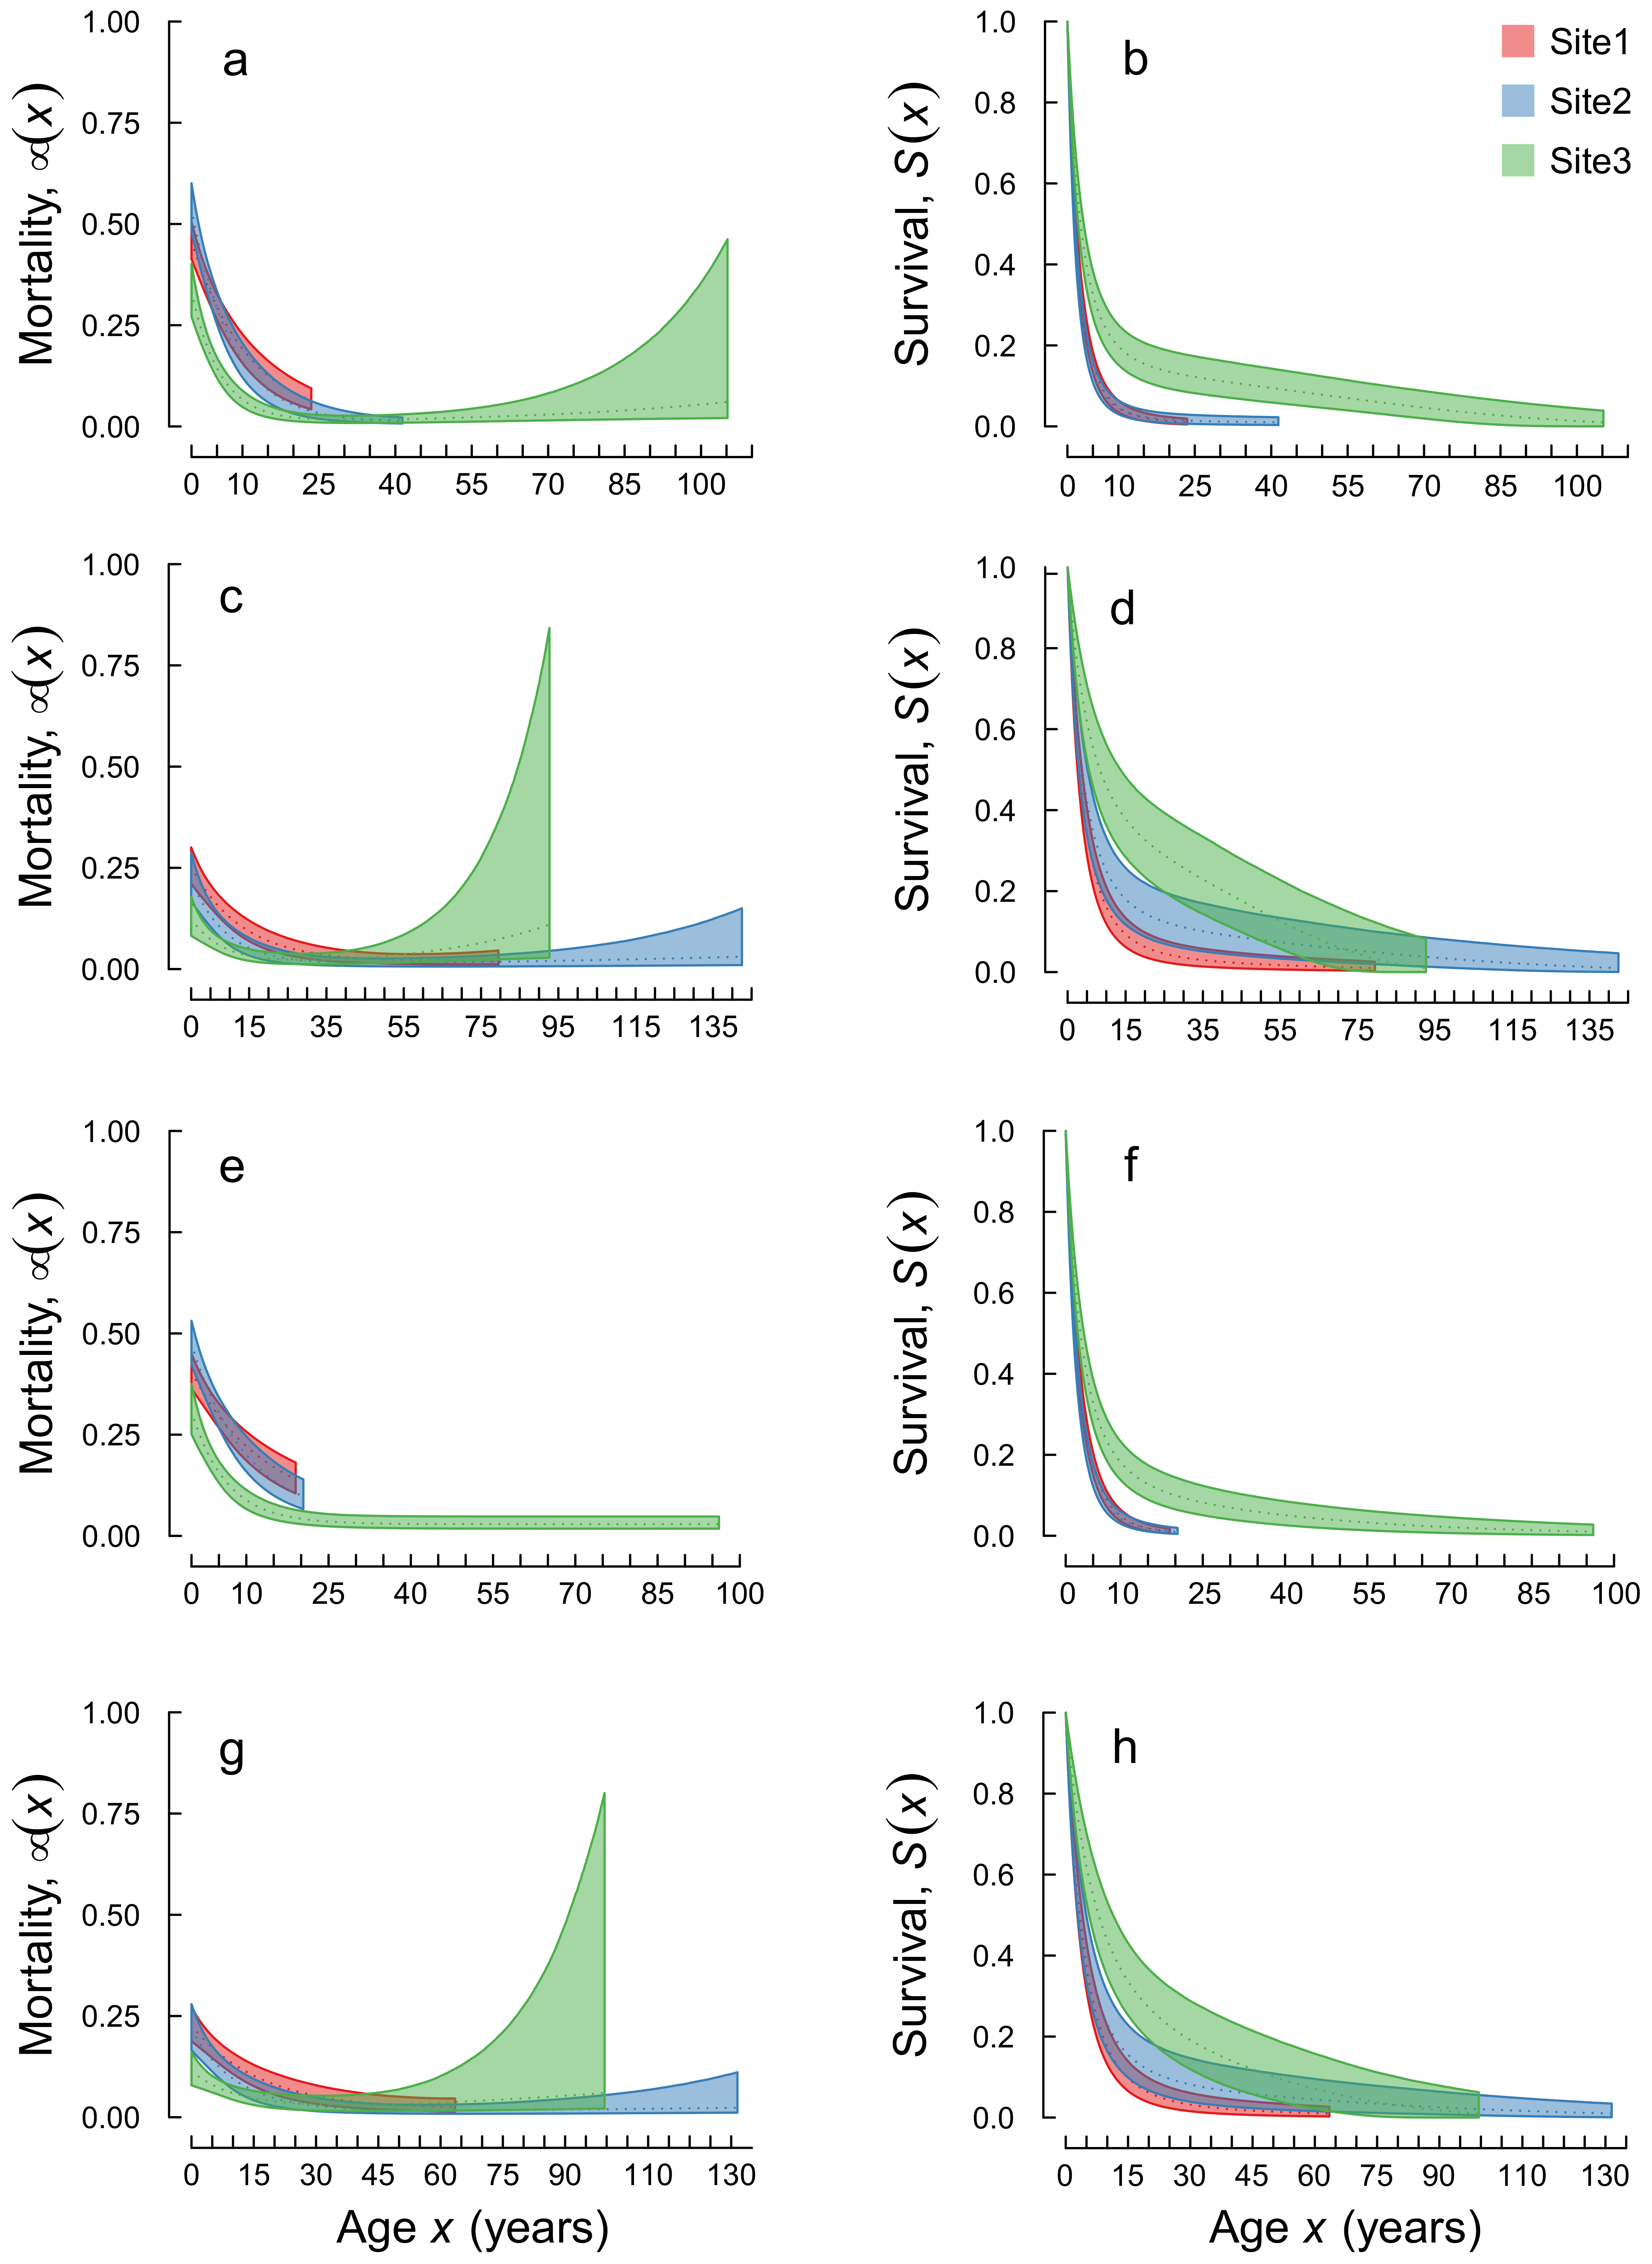
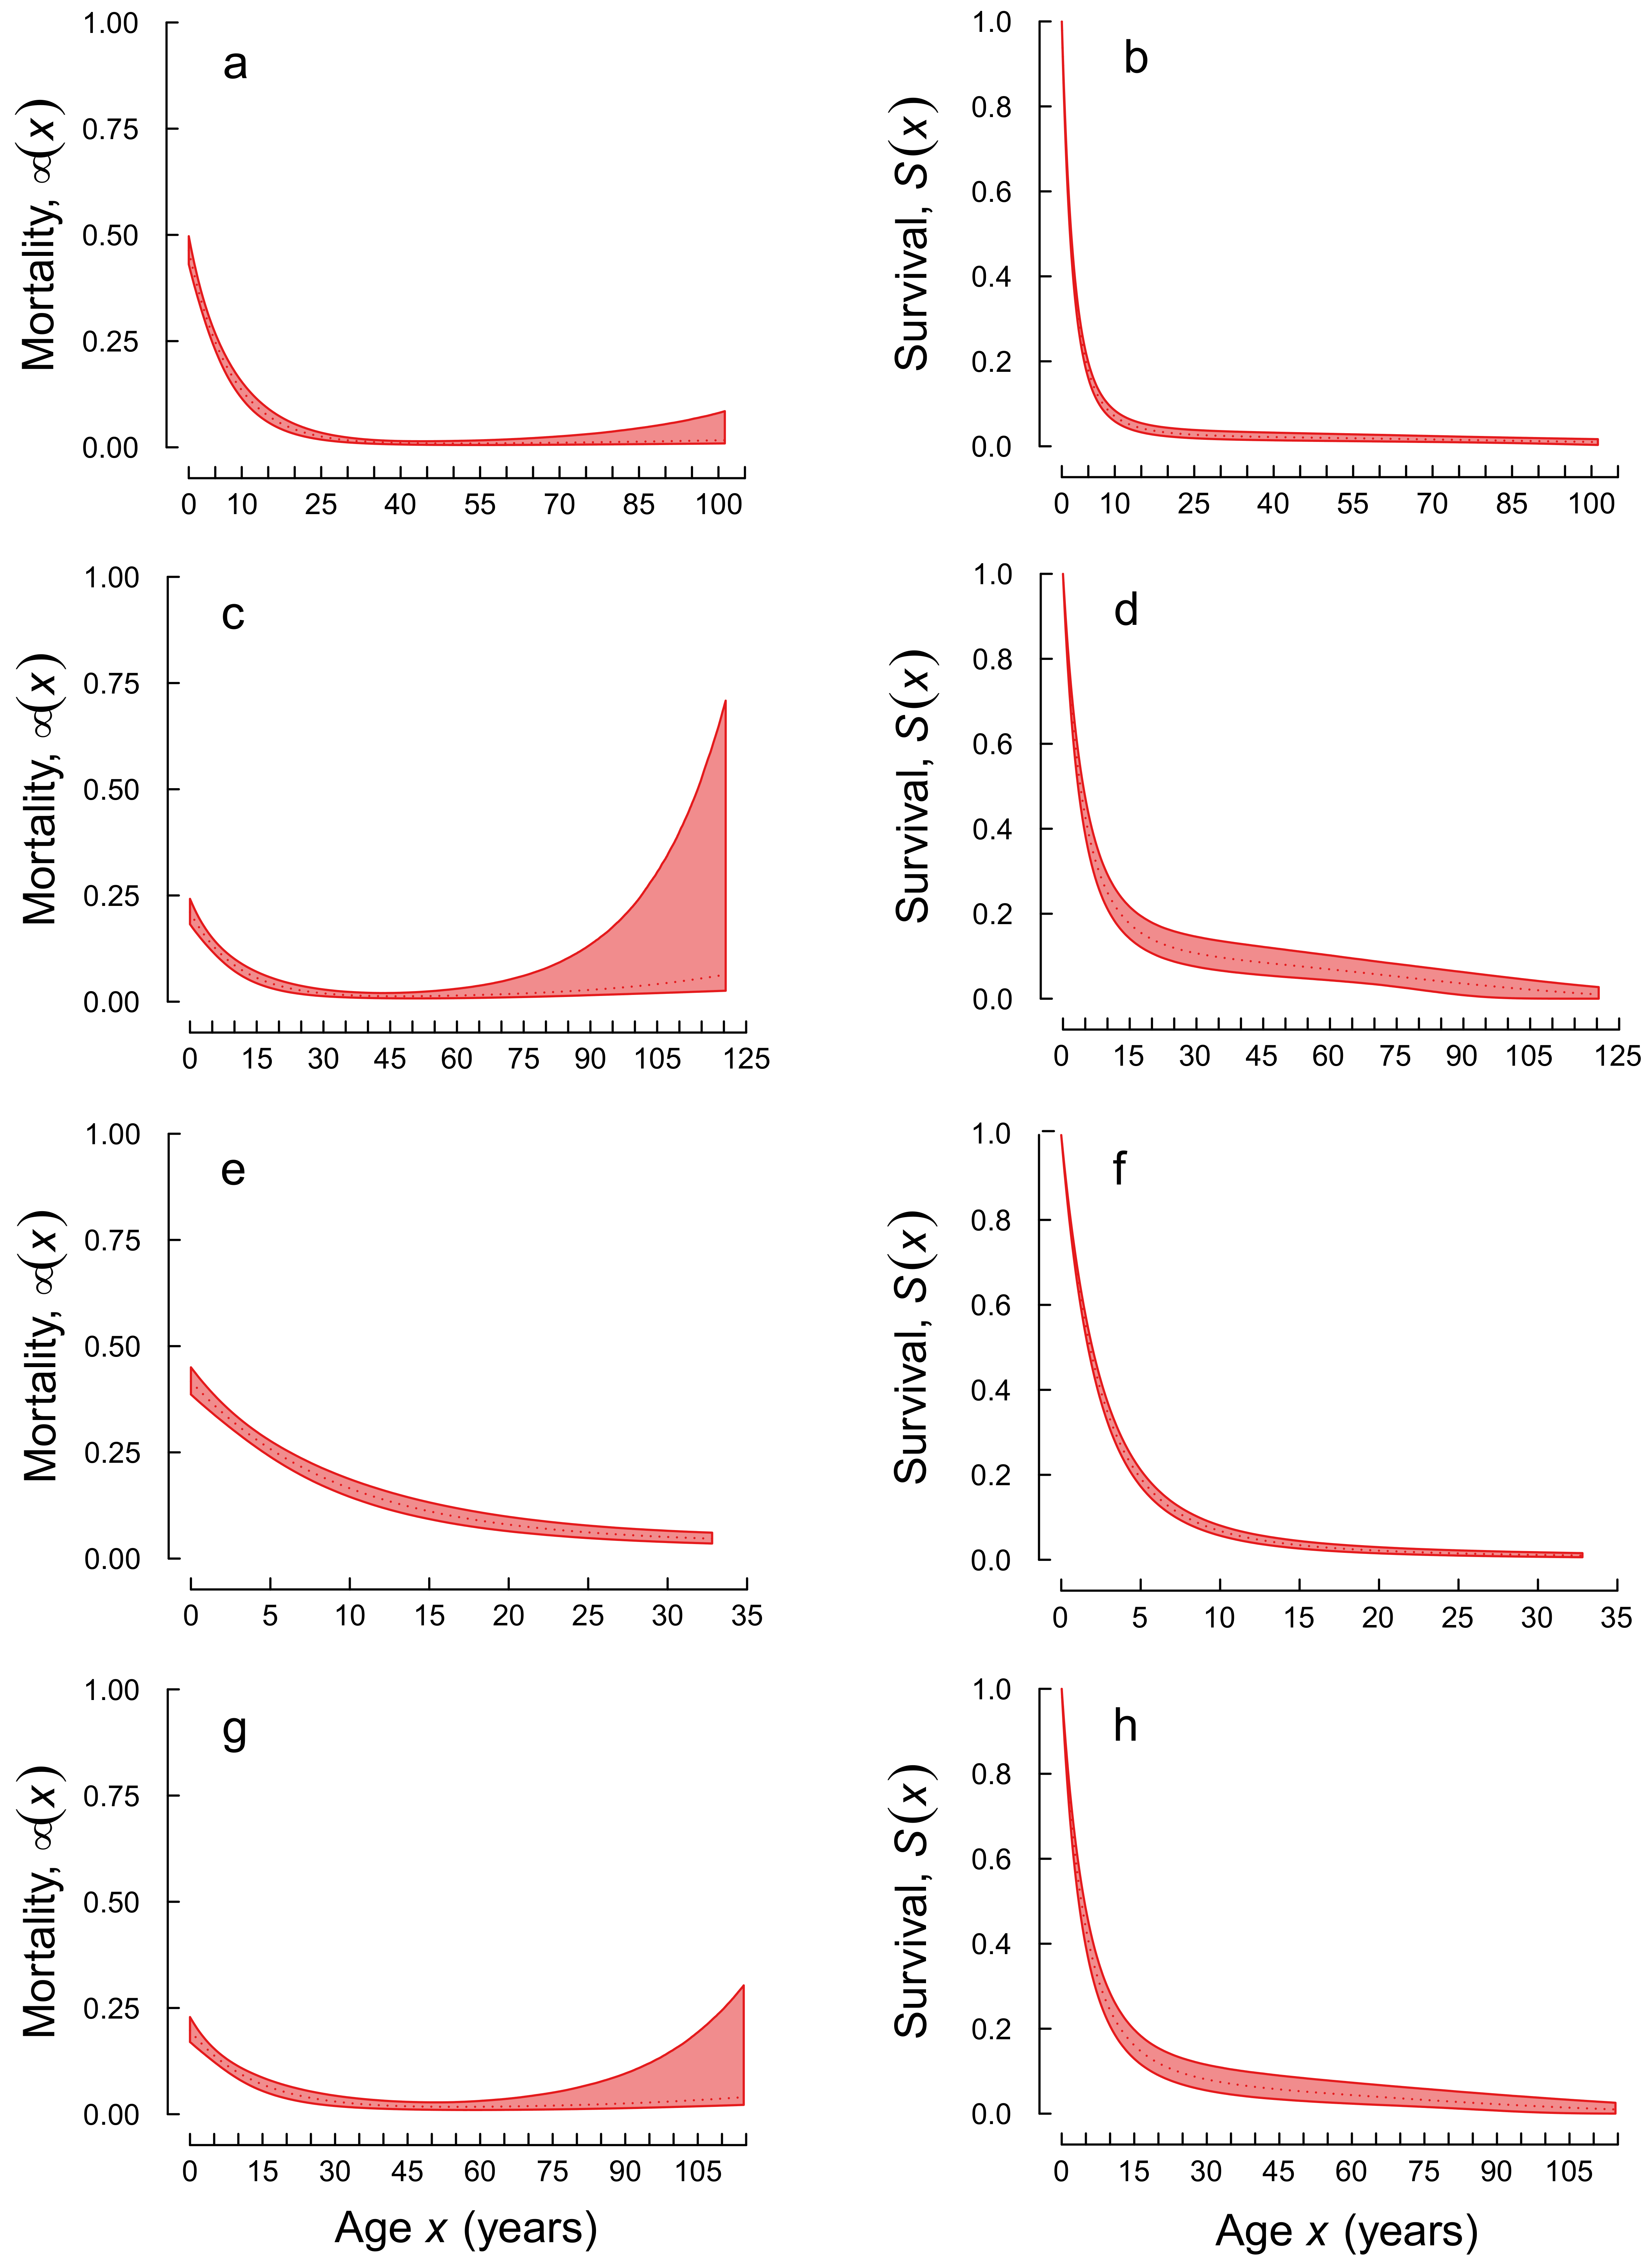
We modelled plant survival trajectories and present results as mortality curves at the three sites using the BaSTA package (version 1.9.4) in R (version 3.4.2). BaSTA uses a Monte Carlo Markov Chain (MCMC) algorithm to estimate age-specific mortality patterns from capture-recapture/recovery data when many individuals (or all) have unknown birth and/or death dates [31]. This enabled us to use our entire data set, including already established plants at the start of the study and the plants in site 3 with uncertain germination year information. As we expected mortality trajectories to possibly change shape after the age of sexual maturity, models were run using data either from all years the plants were measured or for only mature plants (≥10 years old).
The mortality function in BaSTA describes how the risk of mortality changes with age and is defined as µ(x|θ), where x is age and θ a vector of parameters [39]. We compared a basic model with only site as a covariate to models including growth, reproductive output and shrinkage. All four different underlying mortality models in BaSTA were tested to find the model best suitable for each site, life period and covariate: the exponential mortality model (EX) where mortality is constant,
µ b ( x | b ) = b ,
the Gompertz model (GO) where mortality increases exponentially with age,
µ b ( x | b ) = exp ( b 0 + b 1   x ) ,
the Weibull model (WE) where mortality increases or decreases as a power function of age,
µ b ( x | b ) = b 0 b 1 b 0 x b 0 1 ,
and the logistic mortality model (LO) where survival may plateau at advanced ages
µ b ( x | b ) = exp ( b 0   + b 1   x ) 1 + b 2 exp b 0 / b 1 exp b 1 x 1 ,
For Gompertz, Weibull and the logistic model, we also assessed the model fit when including a “Makeham term” as an additional constant
µ 0 x | c , b = µ b x | b + c ,
and a “bathtub” (U-shaped) shape allowing declines in early mortality [39,40]
µ 0 x | c , b , a = exp a 0 a 1 x + c + µ b ( x | b ) ,
All covariates were evaluated using the “fused” option, which defines all categorical variables as covariates for each mortality parameter and all continuous covariates under a proportional hazards structure [31]. The optimal models were chosen as those with the lowest DIC (Deviance Information Criterion) [41]. The DIC is similar to the AIC (Akaike Information Criterion) and the BIC (Bayesian Information Criterion), but penalizes model complexity in a different way, estimating the number of “effective parameters”, which is more appropriate in Bayesian models. The number of iterations (total number of MCMC steps) used in the models was 55,000 with a burn-in of 5000, thinning set to 20 and nsim (number of simulations) set to 8. Parameter convergence was in BaSTA assessed based on the similarities of parameter values in each of these simulations, using the “potential scale reduction factor” [31]. The burn-in argument represents the number of steps at the beginning of the MCMC run that is to be discarded. The thinning argument specifies the number of steps to be skipped in order to reduce serial autocorrelation. In models with continuous covariates, we calculated age trajectories for mean, low (1st percentile) and high (99th percentile) values of each covariate.
Life expectancy (ex) was calculated for plants at ages x = 0 (germination), 10 years, and 30 years Models with growth and shrinkage as covariates were based on data that had two or more measurements, i.e., plants that reached an age of at least two years, complicating the comparisons between models based on full data sets. To test if using different data sets would considerably influence results, we also ran the basic model and the model with reproductive output using the limited data set. As life expectancy results were similar to when the entire data set was used, results from the limited data set analysis are not presented. Possible trade-offs between growth and reproduction and relationships of growth and reproduction with the shrinkage measure were assessed using Spearman correlations.

3. Results

When fitting mortality trajectories from germination and using only site as a covariate (basic model), the Gompertz bathtub model had the lowest DIC (Table 1). Mortality curves mostly corresponded to Type III survivorship patterns, with decreasing mortality in the early years, followed by a low almost constant mortality after maturity (Figure 1; see Figure A2 for the mortality trajectory when data from all sites were pooled). This initial high mortality pattern was also confirmed from observations of plants with known age as 308 of 510 (site 1), 330 of 425 (site 2) and 107 of 125 (site 3) died during their first year. Several plants surviving the first years lived to high ages. Of all plants observed, 20 (site 1), 23 (site 2) and 8 (site 3) germinated before the study started and were still alive in 2018. Site 3 showed a slightly lower initial mortality than the other sites, and patterns for high ages were extremely uncertain due to low sample sizes. Life expectancy at germination (e0) varied from 2.8 to 11.0, e10 varied from 27.1 to 49.6, and e30 varied from 31.5 to 50.5 (Table 2). When fitting trajectories from maturity (age 10), the low number of data points caused models to frequently fail to converge, both with and without covariates. However, all converging models showed near constant mortality at all sites for all covariates, and thus, the simple exponential model was used in models starting from maturity.
Growth (mm/year) in our study varied from −9.9 to 3.0 (mean 0.47), −7.1 to 3.8 (mean −0.016) and −13.8 to 3.6 (mean −1.14) at sites 1–3, respectively. Size (mm) varied from 15 to 430 (mean 107), 15 to 455 (mean 124) and 15 to 715 (mean 148) at sites 1–3, respectively. The optimal model when including growth as a covariate and starting from germination was Gompertz bathtub (Table 1). Mortality curves from germination were similar to the basic model but slightly less pronounced, life expectancy being similar to or slightly lower compared to the basic model. Growth had a significant positive correlation with mortality when modelling from germination (Table 2), higher growth leading to higher initial mortality (Figure 2). The effect of mortality at site 3 was not statistically significant when modelling sites separately (not shown). When modelling from maturity, growth still had a significant effect on mortality. However, the correlation was reversed from positive to negative (Table 2).
Reproductive output (flowers/year) in our study varied from 0 to 2.8 (mean 0.04), 0 to 2.9 (mean 0.04) and 0 to 1.6 (mean 0.06) at sites 1–3, respectively. The optimal model when including reproductive output as a covariate and starting from germination was Gompertz Makeham (Table 1). Mortality curves were again similar to the basic model. Reproductive output was negatively correlated with mortality, both when modelling from germination and maturity; higher reproductive output led to a lower average mortality (Figure 3). The general age when the plants started to flower (around 10 years) coincided with the time when the decrease in mortality started to become less pronounced, turning toward a more constant value. Most plants never reached reproductive maturity and only 6.3% (34), 6.8% (31) and 17.5% (37) of the individuals at sites 1–3 flowered at all during the study period.
Shrinkage varied from 0 (never) to 1 (all observed years) for all sites, while mean shrinkage was 0.16, 0.24 and 0.28 at sites 1–3, respectively. The optimal model when including shrinkage as a covariate and starting from germination was Gompertz bathtub (Table 1). Survival curves from germination were slightly less pronounced than in the basic model, life expectancy being similar or slightly higher compared to the basic model (Table 2). Shrinkage was negatively correlated with mortality only when modelling from germination, leading to lower initial mortality (Figure 4). Shrinkage was relatively common at all sites, with 36.7% (87), 54.8% (68) and 60.4% (64) of the plants at sites 1–3 shrinking sometime during the observation period.
There was a negative correlation between growth and reproductive output (Spearman’s ρ = −0.36, −0.57, −0.41 for sites 1–3, respectively, and p < 0.0001 at all sites). Growth and shrinkage (including only individuals that shrunk) were not significantly correlated (Spearman’s ρ = −0.01, −0.20, −0.05 and p = 0.89, 0.10, 0.08 for sites 1–3). Reproductive output and shrinkage were not significantly correlated (Spearman’s ρ = 0.06, 0.31, −0.09 and p = 0.73, 0.09, 0.61 for sites 1–3). Age and size of individuals with known age, were initially positively correlated (Spearman’s ρ = 0.64, 0.80, 0.86 for sites 1–3, and p < 0.00001 for all sites). This correlation became non-significant at p = 0.05 when the analyses were started from higher ages (5–15 years) (Spearman’s ρ = 0.12, 0.16, 0.30 and p = 0.21, 0.16, 0.44 for sites 1–3).

4. Discussion

Pulsatilla vulgaris ssp. gotlandica showed a typical Type III survivorship pattern, with high mortality in young plants and negligible effects of age in older plants. Life expectancy at germination varied between 3–11 years among the three populations, but at age ten, it had increased to 27–50 years. Similar patterns were found when including covariates, suggesting that individual variation in growth, reproductive output or environmental conditions resulting in shrinkage did not mask any effects of age on survival in mature plants, even though we did detect possible growth-survival trade-off effects and negative correlations of mortality with reproduction and shrinkage. Overall, our results show that at least for older plants, life history trade-offs, environmental disturbance and plant age had limited effects on survival of this long-lived plant.
In this study, the Gompertz bathtub models generally fit the data best (using data from germination), but other models capturing the decrease in mortality with age for young plants had similar DIC values. Since the exponential model, with constant mortality, had the best fit for plants after mortality stabilized, it is somewhat surprising that the logistic model allowing exactly constant mortality did not have the best fit. However, this model also has one more parameter than the Gompertz model, which should increase its DIC. Regardless of model choice, visual inspection showed that a decrease in mortality followed by a constant or negligibly changing mortality was the pattern most supported by the data.
Differences in mortality trajectories and effects of covariates between the two older sites (1 and 2) were relatively modest. This suggests either that environments are similar, or that the effect of spatial environmental variation is low. This is contrasting with results from another long-lived perennial, Fumana procumbens, on the neighboring island Öland where survival trajectories differed substantially between similar-appearing sites [42]. For Pulsatilla at site 3, where the population is younger and possibly in an expanding phase, initial mortality was lower and effects of covariates weaker. However, as this population was also the smallest and models for it more uncertain, we do not attempt to draw any conclusions regarding how environmental differences among sites may affect mortality trajectories.
Individuals that grew more generally had higher mortality when considering all ages, indicating a trade-off between growth and survival [43,44]. Interestingly, the effect was reversed for ages above 10 (i.e., from reproductive maturity). This positive growth-survival correlation when considering only mature plants is likely caused by these plants having a higher resource state, being able to both grow more and being more robust [16]. This is probably due to older plants having a more developed root system, as the plants start to allocate more resources to roots after maturity, building up a larger storage system even if the leaf rosette in itself does not increase in size. Similar results were found in a study of eight rosette-forming perennials [45], suggesting a negative relationship between growth and survival in small plants, but none in larger plants. In trees and shrubs, young seedlings and saplings have shown susceptibility to survival-growth trade-offs [18,19,20,21]. If growth generally comes at the expense of survival only for younger plants, this may be an explanation of why they often seem to display type III survivorship curves [14].
Reproduction was negatively correlated with mortality. The fact that we did not find evidence for a cost of reproduction may be because healthy plants, for example due to growing in more favorable microenvironments, can be expected to both survive and reproduce better, and experimental approaches may be needed to determine the existence of reproduction-survival trade-offs [16,24,46]. In addition, long-lived plants are not expected to invest so much in reproduction that it affects survival, as their population growth rates should typically be more sensitive to variation in survival [47,48,49]. Furthermore, in our study, reproduction and growth were negatively correlated, potentially indicating that young plants allocating more to somatic maintenance and survival do so at the expense of growth rather than reproduction. Villellas [50] also found that growth in the herb Plantago coronopus was negatively related to reproduction. These results suggest that trade-offs with growth should be considered in more demographic studies of herbaceous plants.
In contrast to our expectations of prior disturbance leading to higher mortality, there was a negative relationship between shrinkage and mortality. This negative relationship suggests that observed reductions in size may be examples of adaptive shrinkage. That is, shrinkage may boost plant survival, as has been suggested in several studies [29,30,51,52]. Thus, even if the observed shrinkages were caused by damage, the resulting reduction in size was beneficial for plant survival. Indeed, injuries have been shown to prolong life span in some species [53]. Nevertheless, the effects on life expectancy and mortality trajectories were only minor, and the pattern was only detected for young plants in our study.
In summary, no signs of actuarial senescence were detected for Pulsatilla vulgaris ssp. gotlandica, and although we did detect evidence for effects on mortality of young plants of both life history trade-offs and prior disturbance, this did not affect mortality trajectories substantially. The lacking signs of senescence, taken together with the facts that we found a strong correlation between age and size for young plants but not for old (indicating reduced growth at high ages), and that age affected only the mortality of young plants, is in line with the current assumption that the demography of most plants is size—rather than age-driven [54]. Our results also illustrate the importance of evaluating patterns in different parts of the plant life cycle separately, especially before and after maturity, as effects of trade-offs and disturbance may show considerable variation between life cycle stages. We conclude that if constant mortality for old aged plants is a general pattern in polycarpic plants, then extremely long-term studies may not be necessary to assess their demography. We also conclude that BaSTA is a useful tool for estimating age-dependent demographical parameters in long lived plants, as even very long-term studies are likely to result in only partial age information.

Author Contributions

Conceptualization, S.E., T.L. and J.P.D.; Methodology, S.E. and J.P.D.; Formal Analysis, S.E.; Investigation, T.L.; Writing—Original Draft Preparation, S.E.; Writing—Review & Editing, S.E., T.L. and J.P.D.; Visualization, S.E.; Supervision, J.P.D.

Funding

This research was funded by Danish Council for Independent Research for the “SEAD-Plant” project.

Acknowledgments

We would like to acknowledge the two anonymous referees, who helped us improve this paper by means of relevant and constructive comments.

Conflicts of Interest

The authors declare no conflict of interest.

Appendix A

Figure A1. Mortality and survival trajectories of Pulsatilla vulgaris ssp. gotlandica from germination for the basic model with only sites (a,b), growth (c,d), reproductive output (e,f) and shrinkage (g,h). Lines end where the population reaches 1% of its original size.
Diversity 11 00187 g0a1
Figure A2. Mortality and survival trajectories of Pulsatilla vulgaris ssp. gotlandica from germination for all sites pooled for the basic model (a,b), growth (c,d), reproductive output (e,f) and shrinkage (g,h). Lines end where the population reaches 1% of its original size.
Diversity 11 00187 g0a2

References

  1. Pico, F.X.; Retana, J. Age-specific, density-dependent and environment-based mortality of a short-lived perennial herb. Plant. Biol. 2008, 10, 374–381. [Google Scholar] [CrossRef]
  2. Roach, D.A.; Ridley, C.E.; Dudycha, J.L. Longitudinal analysis of Plantago: Age by environment interactions reveal aging. Ecology 2009, 90, 1427–1433. [Google Scholar] [CrossRef] [PubMed]
  3. Dahlgren, J.P.; Colchero, F.; Jones, O.R.; Øien, D.; Moen, A.; Sletvold, N. Actuarial senescence in a long-lived orchid challenge our current understanding of ageing. Proc. Biol. Sci. 2016, 283, 20161217. [Google Scholar] [CrossRef] [PubMed]
  4. Quarles, B.M.; Roach, D.A. Ageing in an herbaceous plant: Increases in mortality and decreases in physiology and seed mass. J. Ecol. 2019, 107, 1409–1418. [Google Scholar] [CrossRef]
  5. Harper, J.L.; White, J. The Demography of Plants. Annu. Rev. Ecol. Syst. 1974, 5, 419–463. [Google Scholar] [CrossRef] [Green Version]
  6. Rose, R.J.; Clarke, R.T.; Chapman, S.B. Individual variation and the effects of weather, age and flowering history on survival and flowering of the long-lived perennial Gentiana pneumonanthe. Ecography 1998, 21, 317–326. [Google Scholar] [CrossRef]
  7. Fair, J.; Lauenroth, W.; Coffin, D. Demography of Bouteloua gracilis in a mixed prairie: Analysis of genets and individuals. J. Ecol. 1999, 87, 233–243. [Google Scholar] [CrossRef]
  8. Hutchings, M.J. The population biology of the early spider orchid Ophrys sphegodes Mill: III. Demography over three decades. J. Ecol. 2010, 98, 867–878. [Google Scholar] [CrossRef]
  9. Dahlgren, J.; Roach, D.A. Demographic Senescence in Herbaceous Plants. In The Evolution of Senescence in the Tree of Life; Shefferson, R.P., Jones, O.R., Salguero-Gómez, R., Eds.; Cambridge University Press: Cambridge, UK, 2017; pp. 303–319. [Google Scholar] [Green Version]
  10. Cochran, M.E.; Ellner, S. Simple methods for calculating age-based life history parameters for stage- structured populations. Ecol. Monogr. 1992, 62, 345–364. [Google Scholar] [CrossRef]
  11. Menges, E.S. Population viability analyses in plants: Challenges and opportunities. Trends Ecol. Evol. 2000, 15, 51–56. [Google Scholar] [CrossRef]
  12. Ehrlén, J.; Lehtilä, K. How perennial are perennial plants? Oikos 2002, 98, 308–322. [Google Scholar] [CrossRef]
  13. Fenner, M. Seedlings. New Phytol. 1987, 106, 35–47. [Google Scholar] [CrossRef]
  14. Lauenroth, W.K.; Adler, P.B. Demography of perennial grassland plants: Survival, life expectancy and life span. J. Ecol. 2008, 96, 1023–1032. [Google Scholar] [CrossRef]
  15. Chu, C.; Havstad, K.M.; Kaplan, N.; Lauenroth, W.K.; McClaran, M.P.; Peters, D.P.; Vermeire, L.T.; Adler, P.B. Life form influences survivorship for 109 herbaceous perennials from six semi-arid ecosystems. J. Veg. Sci. 2014, 25, 947–954. [Google Scholar] [CrossRef]
  16. Obeso, J.R. The costs of reproduction in plants. New Phytol. 2002, 155, 320–348. [Google Scholar] [CrossRef]
  17. Bigler, C.; Veblen, T.T. Increased early growth rates decrease longevities of conifers in subalpine forests. Oikos 2009, 118, 1130–1138. [Google Scholar] [CrossRef]
  18. Seiwa, K. Trade-offs Between Seedling Growth and Survival in Deciduous Broadleaved Trees in a Temperate Forest. Ann. Bot. 2007, 99, 537–544. [Google Scholar] [CrossRef] [PubMed] [Green Version]
  19. Gilbert, B.; Wright, S.J.; Muller-Landau, H.C.; Kitajima, K.; Hernandez, A. Life history trade-offs in tropical trees and lianas. Ecology 2006, 87, 1281–1288. [Google Scholar] [CrossRef]
  20. Negreiros, D.; Fernandes, G.W.; Efremova, A.A.; Stradic, S.; Neves, A.C.O. Growth-survival trade-off in shrub saplings from Neotropical mountain grasslands. S. Afr. J. Bot. 2016, 106, 17–22. [Google Scholar] [CrossRef]
  21. Kunstler, G.; Falster, D.; Coomes, D.A.; Hui, F.; Kooyman, R.M.; Laughlin, D.C.; Poorter, L.; Vanderwel, M.; Vieilledent, G.; Joseph Wright, S.J.; et al. Plant functional traits have globally consistent effects on competition. Nature 2016, 529, 204–207. [Google Scholar] [CrossRef]
  22. Silvertown, J.; Franco, M.; Perez-Ishiwara, R. Evolution of senescence in iteroparous perennial plants. Evol. Ecol. Res. 2001, 3, 393–412. [Google Scholar]
  23. Ehlers, B.; Olesen, J.M. Flower production in relation to individual plant age and leaf production among different patches of Corydalis intermedia. Plant. Ecol. 2004, 174, 71–78. [Google Scholar] [CrossRef]
  24. Tuomi, J.; Crone, E.E.; Gremer, J.R.; Jäkäläniemi, A.; Lesica, P.; Pedersen, B.; Ramula, S. Prolonged dormancy interacts with senescence for two perennial herbs. J. Ecol. 2013, 101, 566–576. [Google Scholar] [CrossRef]
  25. Shefferson, R.P.; Roach, D.A. Longitudinal analysis in Plantago: Strength of selection and reverse-age reveal age-indeterminate senescence. J. Ecol. 2013, 101, 577–584. [Google Scholar] [CrossRef] [PubMed]
  26. Williams, P.; Day, T.; Fletcher, Q.; Rowe, L. The shaping of senescence in the wild. Trends Ecol. Evol. 2006, 21, 458–463. [Google Scholar] [CrossRef]
  27. Martin, J.G.; Festa-Bianchet, M. Age-independent and age-dependent decreases in reproduction of females. Ecol. Lett. 2011, 14, 576–581. [Google Scholar] [CrossRef]
  28. Koenig, W.D.; Knops, J.M.H.; Carmen, W.J.; Pesendorfer, M.B. Testing the terminal investment hypothesis in California oaks. Am. Nat. 2017, 189, 564–569. [Google Scholar] [CrossRef]
  29. Horvitz, C.C.; Schemske, D.W. Spatiotemporal variation in demographic transitions of a tropical understory herb: Projection matrix analysis. Ecol. Monogr. 1995, 65, 155–192. [Google Scholar] [CrossRef]
  30. Morris, W.F.; Doak, D.F. Life history of the long-lived gynodioecious cushion plant, Silene acaulis (Caryophyllaceae), inferred from size-based population projection matrices. Am. J. Bot. 1998, 85, 784–793. [Google Scholar] [CrossRef] [PubMed]
  31. Colchero, F.; Jones, O.R.; Rebke, M. BaSTA: An R package for Bayesian estimation of age-specific survival from incomplete mark-recapture/recovery data with covariates. Methods Ecol. Evol. 2012, 3, 466–470. [Google Scholar] [CrossRef]
  32. Record, S.; Kobe, R.K.; Vriesendorp, C.F.; Finley, A.O. Seedling survival responses to conspecific density, soil nutrients, and irradiance vary with age in a tropical forest. Ecology 2016, 97, 2406–2415. [Google Scholar] [CrossRef] [Green Version]
  33. Přívětivý, T.; Adama, D.; Vrška, T. Decay dynamics of Abies alba and Picea abies deadwood in relation to environmental conditions. For. Ecol. Manag. 2018, 427, 250–259. [Google Scholar] [CrossRef]
  34. Johansson, B.G.; Petersson, J.; Ingmansson, G. Gotlands Flora Band 2; SBF-förlag: Uppsala, Sweden, 2016. [Google Scholar]
  35. Lindell, T. Breeding systems and crossing experiments in Anemone patens and in the Anemone pulsatilla group (Ranunculaceae). Nord. J. Bot. 1998, 18, 549–561. [Google Scholar] [CrossRef]
  36. Lindell, T. Åtgärdsprogram för Nipsippa och Gotlandssippa 2006–2010; Rapport 5672; Naturvårdsverket: Stockholm, Sweden, 2007; pp. 9–19. [Google Scholar]
  37. Lindell, T. Pulsatilla. In Flora Nordica; Jonsell, B., Ed.; The Bergius Foundation: Stockholm, Sweden, 2001; Volume 2, pp. 305–310. [Google Scholar]
  38. R Core Team. R: A Language and Environment for Statistical Computing. R Foundation for Statistical Computing, Vienna, Austria. Available online: https://www.R-project.org/ (accessed on 12 September 2019).
  39. Colchero, F.; Jones, O.; Rebke, M. Package ‘BaSTA’. Available online: https://CRAN.R-project.org/package=BaSTA (accessed on 12 September 2019).
  40. Makeham, W.M. On the law of mortality. J. Inst. Actuar. 1867, 13, 325–358. [Google Scholar] [CrossRef]
  41. Spiegelhalter, D.J.; Best, N.G.; Carlin, B.P.; van der Linde, A. Bayesian measures of model complexity and fit. J. R. Statist. Soc. B 2002, 64, 583–639. [Google Scholar] [CrossRef] [Green Version]
  42. Edelfeldt, S.; Bengtsson, K.; Dahlgren, J.P. Demographic Senescence and Effects on Population Dynamics of a Perennial Plant. Ecology in Press. Available online: https://esajournals.onlinelibrary.wiley.com/doi/abs/10.1002/ecy.2742 (accessed on 12 September 2019).
  43. Ferrer, M.M.; Montaña, C.; Franco, M. Habitat-specific demography, source-sink dynamics, and the niche of a common shrub in a heterogeneous and fluctuating environment. Ecography 2015, 38, 930–938. [Google Scholar] [CrossRef]
  44. Flores-Torres, A.; Montaña, C.; Franco, M. Coexistence and the niche in a nurse–cactus interaction: Is cyclic dynamics justified? J. Ecol. 2019, 107, 407–417. [Google Scholar] [CrossRef]
  45. Metcalf, C.J.E.; Rees, M.; Alexander, J.M.; Rose, K. Growth-survival trade-offs and allometries in rosette-forming perennials. Funct. Ecol. 2006, 20, 217–225. [Google Scholar] [CrossRef]
  46. Sletvold, N.; Ågren, J. Nonlinear costs of reproduction in a long-lived plant. J. Ecol. 2015, 130, 1205–1213. [Google Scholar] [CrossRef]
  47. Pfister, C.A. Patterns of variance in stage-structured populations: Evolutionary predictions and ecological implications. Proc. Natl. Acad. Sci. USA 1998, 95, 213–218. [Google Scholar] [CrossRef] [Green Version]
  48. Morris, W.F.; Doak, D.F. Buffering of life histories against environmental stochasticity: Accounting for a spurious correlation between the variabilities of vital rates and their contributions to fitness. Am. Nat. 2004, 163, 579–590. [Google Scholar] [CrossRef] [PubMed]
  49. Garcia, M.B.; Picó, F.X.; Ehrlén, J. Life span correlates with population dynamics in perennial herbaceous plants. Am. J. Bot. 2008, 95, 258–262. [Google Scholar] [CrossRef] [PubMed] [Green Version]
  50. Villellas, J.; Garcia, M.B. Life-history trade-offs vary with resource availability across the geographic range of a widespread plant 2018. Plant Biol. 2018, 20, 483–489. [Google Scholar]
  51. Salguero-Gómez, R.; Casper, B.B. Keeping plant shrinkage in the demographic loop. J. Ecol. 2010, 98, 312–323. [Google Scholar] [CrossRef]
  52. Salguero-Gómez, R.; Siewert, W.; Casper, B.B.; Tielbörger, K. A demographic approach to study effects of climate change in desert plants. Philos. Trans. R. Soc. 2012, 367, 3100–3114. [Google Scholar] [CrossRef] [PubMed] [Green Version]
  53. Martínková, M.; Šmilauer, P.; Mihulka, S.; Latzel, V.; Klimešová, J. The effect of injury on whole-plant senescence: An experiment with two root-sprouting Barbarea species. Ann. Bot. 2016, 117, 667–679. [Google Scholar] [CrossRef]
  54. Harper, J.L. Population Biology of Plants; Academic Press: New York, NY, USA, 1977; pp. 195–196, 600–604. [Google Scholar]
Figure 1. Mortality trajectories from germination for each site of Pulsatilla vulgaris ssp. gotlandica using the Gompertz bathtub model. Lines end where the population from the site with the lowest mortality (site 3) reaches 1% of its original size (Figure A1).
Diversity 11 00187 g001
Figure 2. Age trajectories of mortality as function of different levels of growth (mean, low (2.5th percentile) and high (97.5th percentile)) at sites 1–3 (ac) using the Gompertz bathub model. Mortality is presented from germination to the age where the population from the site with the lowest mortality (site 2) reaches 1% of its original size (Figure A1). Mean= 0.47, −0.016, −1.14, Low = −4.53, −4.71, −8.25, High = 1.16, 1.24, 1.57 mm/year at sites 1–3, respectively.
Diversity 11 00187 g002
Figure 3. Age trajectories of mortality as function of different levels of reproductive output (mean, low (2.5th percentile) and high (97.5th percentile)) at site 1–3 (ac) using the Gompertz Makeham model. Mortality is presented from germination to the age where the population from the site with the lowest mortality (site 3) reaches 1% of its original size (Figure A1). Mean = 0.040, 0.042, 0.061, Low = 0, High = 0.41, 0.65, 0.53 flowers/year at sites 1–3, respectively.
Diversity 11 00187 g003
Figure 4. Age trajectories of mortality as function of different levels of shrinkage (mean, low (2.5th percentile) and high (97.5th percentile)) at site 1–3 (ac) using the Gompertz bathtub model. Mortality is presented from germination to the age where the population from the site with the lowest mortality (site 2) reaches 1% of its original size (Figure A1). Mean = 0.16, 0.24 and 0.28, Low = 0, High = 1 at sites 1–3, respectively.
Diversity 11 00187 g004
Table 1. DICs of all converging models when using only sites (basic model) and when including growth, reproductive output and shrinkage as covariate.
Basic ModelGrowthReproductive OutputShrinkage
ModelDICModelDICModelDICModelDIC
GO bathtub13,251GO bathtub6399GO Makeham13,040GO bathtub6443
LO bathtub13,344WE Makeham6453GO bathtub13,051WE Makeham6452
LO Makeham13,505EX simple6471LO bathtub13,140WE simple6453
LO simple13,508WE simple6531LO Makeham13,320EX simple6476
GO simple13,631LO bathtub6547LO simple13,348GO simple6514
WE simple13,775LO Makeham6554GO simple13,476WE bathtub6535
WE Makeham13,778LO simple6569WE Makeham13,615GO Makeham6579
EX simple13,988GO simple6577WE simple13,616
GO Makeham6604EX simple13,819
Table 2. Best-fitting Bayesian survival trajectory (BaSTA) models for each site and covariate of P. vulgaris spp. gotlandica, from germination and maturity. DIC = Deviance Information Criterion, ex = life expectancy for plants x years old.
Model CovariateOptimal ModelMin AgeDICCovariate Mortality CoefficientSite 1Site 2Site 3
e0e10e30e0e10e30e0e10e30
Basic modelGO bathtub013,251-2.8 27.131.53.2 49.550.511.0 49.632.7
Basic modelEX simple1012,360--31.528.9-40.850.3-55.344.1
GrowthGO bathtub063990.118 *4.623.622.38.341.231.124.348.229.8
GrowthEX simple106226−0.098 *-39.128.6-60.262.5-63.950.1
Reproductive outputGO Makeham013,040−2.080 *2.7 18.314.32.8 52.946.912.5 59.947.7
Reproductive outputEX simple1012,373−0.620 *-29.337.3-47.449.7-53.341.8
ShrinkageGO bathtub06443−1.798 *4.928.932.09.655.250.122.951.234.5
ShrinkageEX simple106285−0.194-35.126.3-45.452.5-57.944.7
* statistically significant at α = 0.05. these values become similar to e0 values for growth/shrinkage when based on the limited data set of these models.

