Article

Effectiveness of DNA Barcoding in Speyeria Butterflies at Small Geographic Scales

1
Department of Biological Sciences, University of the Pacific, Stockton, CA 95211, USA
2
Department of Ecology & Evolution, University of Chicago, Chicago, IL 60637, USA
3
Department of Biological Sciences, Boston University, Boston, MA 02215, USA
4
Department of Biological Sciences, University of Massachusetts, Lowell, MA 01854, USA
*
Author to whom correspondence should be addressed.
Diversity 2018, 10(4), 130; https://doi.org/10.3390/d10040130
Submission received: 15 October 2018 / Revised: 29 November 2018 / Accepted: 10 December 2018 / Published: 14 December 2018
(This article belongs to the Special Issue DNA Barcoding for Biodiversity)

Abstract

:
North American Speyeria butterflies are a group of conservation concern and a challenge to butterfly systematists. Establishing species delimitation and evolutionary relationships among Speyeria has proven difficult due to the polytypic nature of many species, coupled with the similarity of wing patterns of sympatric species. Recent molecular work has found not all Speyeria species to be monophyletic, which could be explained by improper species definitions, incomplete lineage sorting, or ongoing hybridization and introgression. However, these studies involved broad geographic sampling where molecular markers such as the DNA barcode may be especially subject to incomplete lineage sorting. Here we focus on a more local scale, analyzing the mitochondrial gene cytochrome oxidase subunit I (CoI) to test whether this marker recovers four sympatric Speyeria species: adiaste (W. H. Edwards, 1864), callippe (Boisduval, 1852), coronis (Behr, 1864), and zerene (Boisduval, 1852), in the greater San Francisco Bay Area. We found that CoI works well to separate all four species. Subspecies were less well-defined, with the S. adiaste subspecies clustering separately, but more mixed for the S. zerene and S. callippe subspecies. Overall, our analyses illustrate the utility of the DNA barcode for separating the Speyeria species and suggest further studies to investigate different geographic scales in order to elucidate genetic diversity patterns in this genus in North America.

1. Introduction

Speyeria (Scudder, 1872) butterflies (Nymphalidae) are a challenging group to identify and classify. Field workers seeking to identify them describe the utility of collecting many individuals at a location [1,2] to help separate sympatric species and understand subspecific variation. Using observation alone, enthusiasts may often have to settle for “Speyeria sp” [3], unless they can capture good photographs of both dorsal and ventral surfaces, and compare with local knowledge (i.e., collections) of the fauna. The taxonomic history of Speyeria species reflects this difficulty, with subspecies being moved from one species to another (e.g., gunderi (J. A. Comstock, 1925) and carolae (dos Passos and Grey, 1942)), and in some cases, subspecies are given species status [4,5,6].
The polytypic nature of many Speyeria species [7] contributes to identification and classification challenges. Speyeria species show extensive variation within populations, and subspecies often differ markedly in wing phenotype. Adding to this variation is convergence among sympatric taxa. The result is local phenotypes that can be difficult to assign to species, as well as subspecific taxa that may be placed in the wrong species. Traditional traits such as genitalic morphology have proven important for understanding the relationships between genera and species groups [8,9,10,11], but unfortunately contributed little to clarifying species identification or intrageneric relationships.
The identification and classification of Speyeria are important because many of the species are of significant conservation concern. Many Speyeria species have been in decline for the past 200 years across North America [12,13,14] as a result of habitat loss and degradation [12,15]. In western North America, several taxa are federally listed as endangered species (e.g., S. callippe callippe (Boisduval, 1852), S. zerene hippolyta (W. H. Edwards, 1879)), and in California many more are on the verge of extinction (e.g., S. adiaste adiaste (W. H. Edwards, 1864), S. egleis tehachapina (J. A. Comstock, 1920)) or are thought to have gone extinct (S. adiaste atossa (W. H. Edwards, 1890), S. z. myrtleae (dos Passos and Grey, 1945) see [16]). Conservation efforts are needed to combat these effects. This requires a robust understanding of Speyeria ecology and population structure, including distinctiveness of populations.
Molecular approaches hold promise for clarifying species boundaries and relationships within Speyeria. However, recent studies have perhaps provided more questions than answers. For example, studies using the mitochondrial gene cytochrome oxidase subunit I or subunit II (CoI or CoII) and multiple individuals per species have found several species to be paraphyletic [5,17]. Similar patterns of paraphyly were observed when analyzing several nuclear genes in combination with CoI for multiple individuals per species [8]. Thus, these studies call into question the utility of DNA barcoding as a molecular tool for species delimitation in Speyeria, and may even challenge the validity of the species themselves. However, further research is needed before ascribing these genetic patterns to improper species definitions, given that other factors such as incomplete lineage sorting (ILS) and hybridization can also explain such patterns. We interpret Speyeria species, as presently defined [18], to be valid given that they generally show morphological, ecological, and/or behavioral differences in sympatry [7,19], traits which should be associated with multilocus genetic differences.
Although mitochondrial DNA (mtDNA) has not provided clear confirmation of Speyeria species so far, it may be premature to dismiss its potential utility. As stated by Sperling [20]: “It remains important to establish the effectiveness of mtDNA as a phylogenetic marker, and to investigate conditions under which variation in the molecule may fail to indicate species boundaries.” The studies of Speyeria to date have involved geographically widespread samples from different subspecies, leaving open the explanation that ancestral polymorphism within and among populations (i.e., subspecies) of each species, have not coalesced to single gene variants within their species (ILS), resulting in a pattern of incongruent gene trees and species trees. ILS seems a likely hypothesis for the findings of paraphyly in widespread sampling of Speyeria given the polymorphism in this group and the recent and rapid radiation in North America [8]. However, hybridization between sympatric species could also result in a pattern of paraphyly through the introgression of alleles from one species into another. Many interspecific crosses between Speyeria species result in viable offspring, making this a likely hypothesis [6]. Analyzing CoI at a more local scale could help distinguish whether paraphyletic patterns are a result of ILS over longer time spans, or ongoing hybridization. If Speyeria species are behaving as reproductively isolated entities in sympatry (i.e., no hybridization), the paraphyly seen in recent work is much less likely to be present at local scales (i.e., subpopulations), where ancestral polymorphism is more likely to have been eliminated by drift or selection.
In this paper, we focused on a more restricted geographic scale to test the validity of morphological species of Speyeria in the California Coast ranges near the San Francisco Bay Area. In this region there are four species, S. adiaste, S. callippe, S. coronis and S. zerene [18]. Three of these species have subspecies of conservation concern in the Bay Area with S. callippe callippe and S. zerene myrtleae listed as federally endangered species, and S. adiaste adiaste and S. zerene sonomensis (J. Emmel, T. Emmel and Mattoon, 1998) known from few, sporadic, small populations. Sympatry among the four species in the sampled area from Lake Co. to Monterey Co. is not always complete, with S. callippe and S. coronis showing the most overlap (Figure 1 and Table S1). However, the close and overlapping distributions in the Bay Area offer ample opportunities for hybridization between species if they are not completely reproductively isolated (see examples in [6]). Here we used CoI data for multiple subspecies for each of the four species S. adiaste, S. callippe, S. coronis and S. zerene to test: 1) whether this marker recovers each species, and 2) whether there is evidence of ILS or hybridization.

2. Materials and Methods

Samples were collected from the Northern and Southern California Coast ranges from Lake Co. in the north to Monterey and San Benito Co. in the south. Multiple species of Speyeria were collected at each site where possible to allow for the comparison of sequences at both the local and regional scales. Individuals were collected with aerial nets and identified based on wing color and pattern. In total, 188 specimens were analyzed. We followed the taxonomic arrangement of Pelham [18] except for Speyeria zerene. For S. zerene we used the name S. z. puntareyes (J. Emmel and T. Emmel, 1998) for the endangered taxon S. z. myrtleae from Marin Co. following the arrangement of Emmel and Emmel [16]. Specimens were dissected the same day they were captured, with the body preserved in 95% ethanol and frozen. In populations deemed to be low abundance or endangered, tissue was sometimes obtained from pieces of the hind wing tornus, and the individuals were photographed and released. For S. zerene sonomensis, the area was visited multiple times and one topotype was collected, and three individual paratypes as well as several additional topotypes were provided by J. Emmel.
Tissue from the wings, legs or thorax were used for extraction using a QIAGEN DNeasy kit, and modified using two final elution steps of 100 µL AE buffer. A ~900 bp portion of the mitochondrial gene cytochrome oxidase subunit I containing the DNA barcode region was sequenced using the primers LCO, HCO, Lep 3.1F and Lep 3.1R. Details of the primer sequence and cycling conditions are provided in Dasmahapatra et al. [21], Elias et al. [22], and Folmer et al. [23]. PCR product was sent to Sequetech Corporation (www.sequetech.com) for sequencing in both the forward and reverse directions. Raw sequence files were assembled and edited using Seqman Pro 2.1.0 [24], and the resulting fasta files were aligned using MUSCLE 3.8.31 [25]. The aligned dataset was checked for ambiguities and stop codons in Mesquite 3.04 [26] and trimmed to a final dataset containing 860 bp for all individuals. Two Speyeria cybele (Fabricius 1775) individuals were added as an outgroup. The sequences are available in GenBank, and the accession numbers are MK175061-MK175244, KY773309, KY773317, KY773324, KY773326, KY773331, DQ922863.
To test whether CoI recovers the four Bay Area species we conducted a neighbor-joining (NJ) analysis using the p-distance (number of base differences per site), and 500 bootstrap replicates generated in MEGA 7.0 [27]. In addition, we analyzed the dataset in BEAST v2.4.7 [28] after finding the best fitting model with jModelTest 2.1.10 using the lowest AICc (HKY + I + G, p-inv = 0.741, gamma = 0.815). In BEAST, a random local clock and birth/death model was used, with birth/death rate priors using a normal distribution, and with 20 million generations and 25% burn-in. Additional models were run in BEAST, resulting in qualitatively similar results. We also examined genetic distances (p-distance) within and between species and subspecies. The inter-individual distances calculated in MEGA 7.0 were output to Excel and minimum interspecific distances, maximum intraspecific distances, as well as maximum distances within, and minimum distances between subspecies were calculated.

3. Results

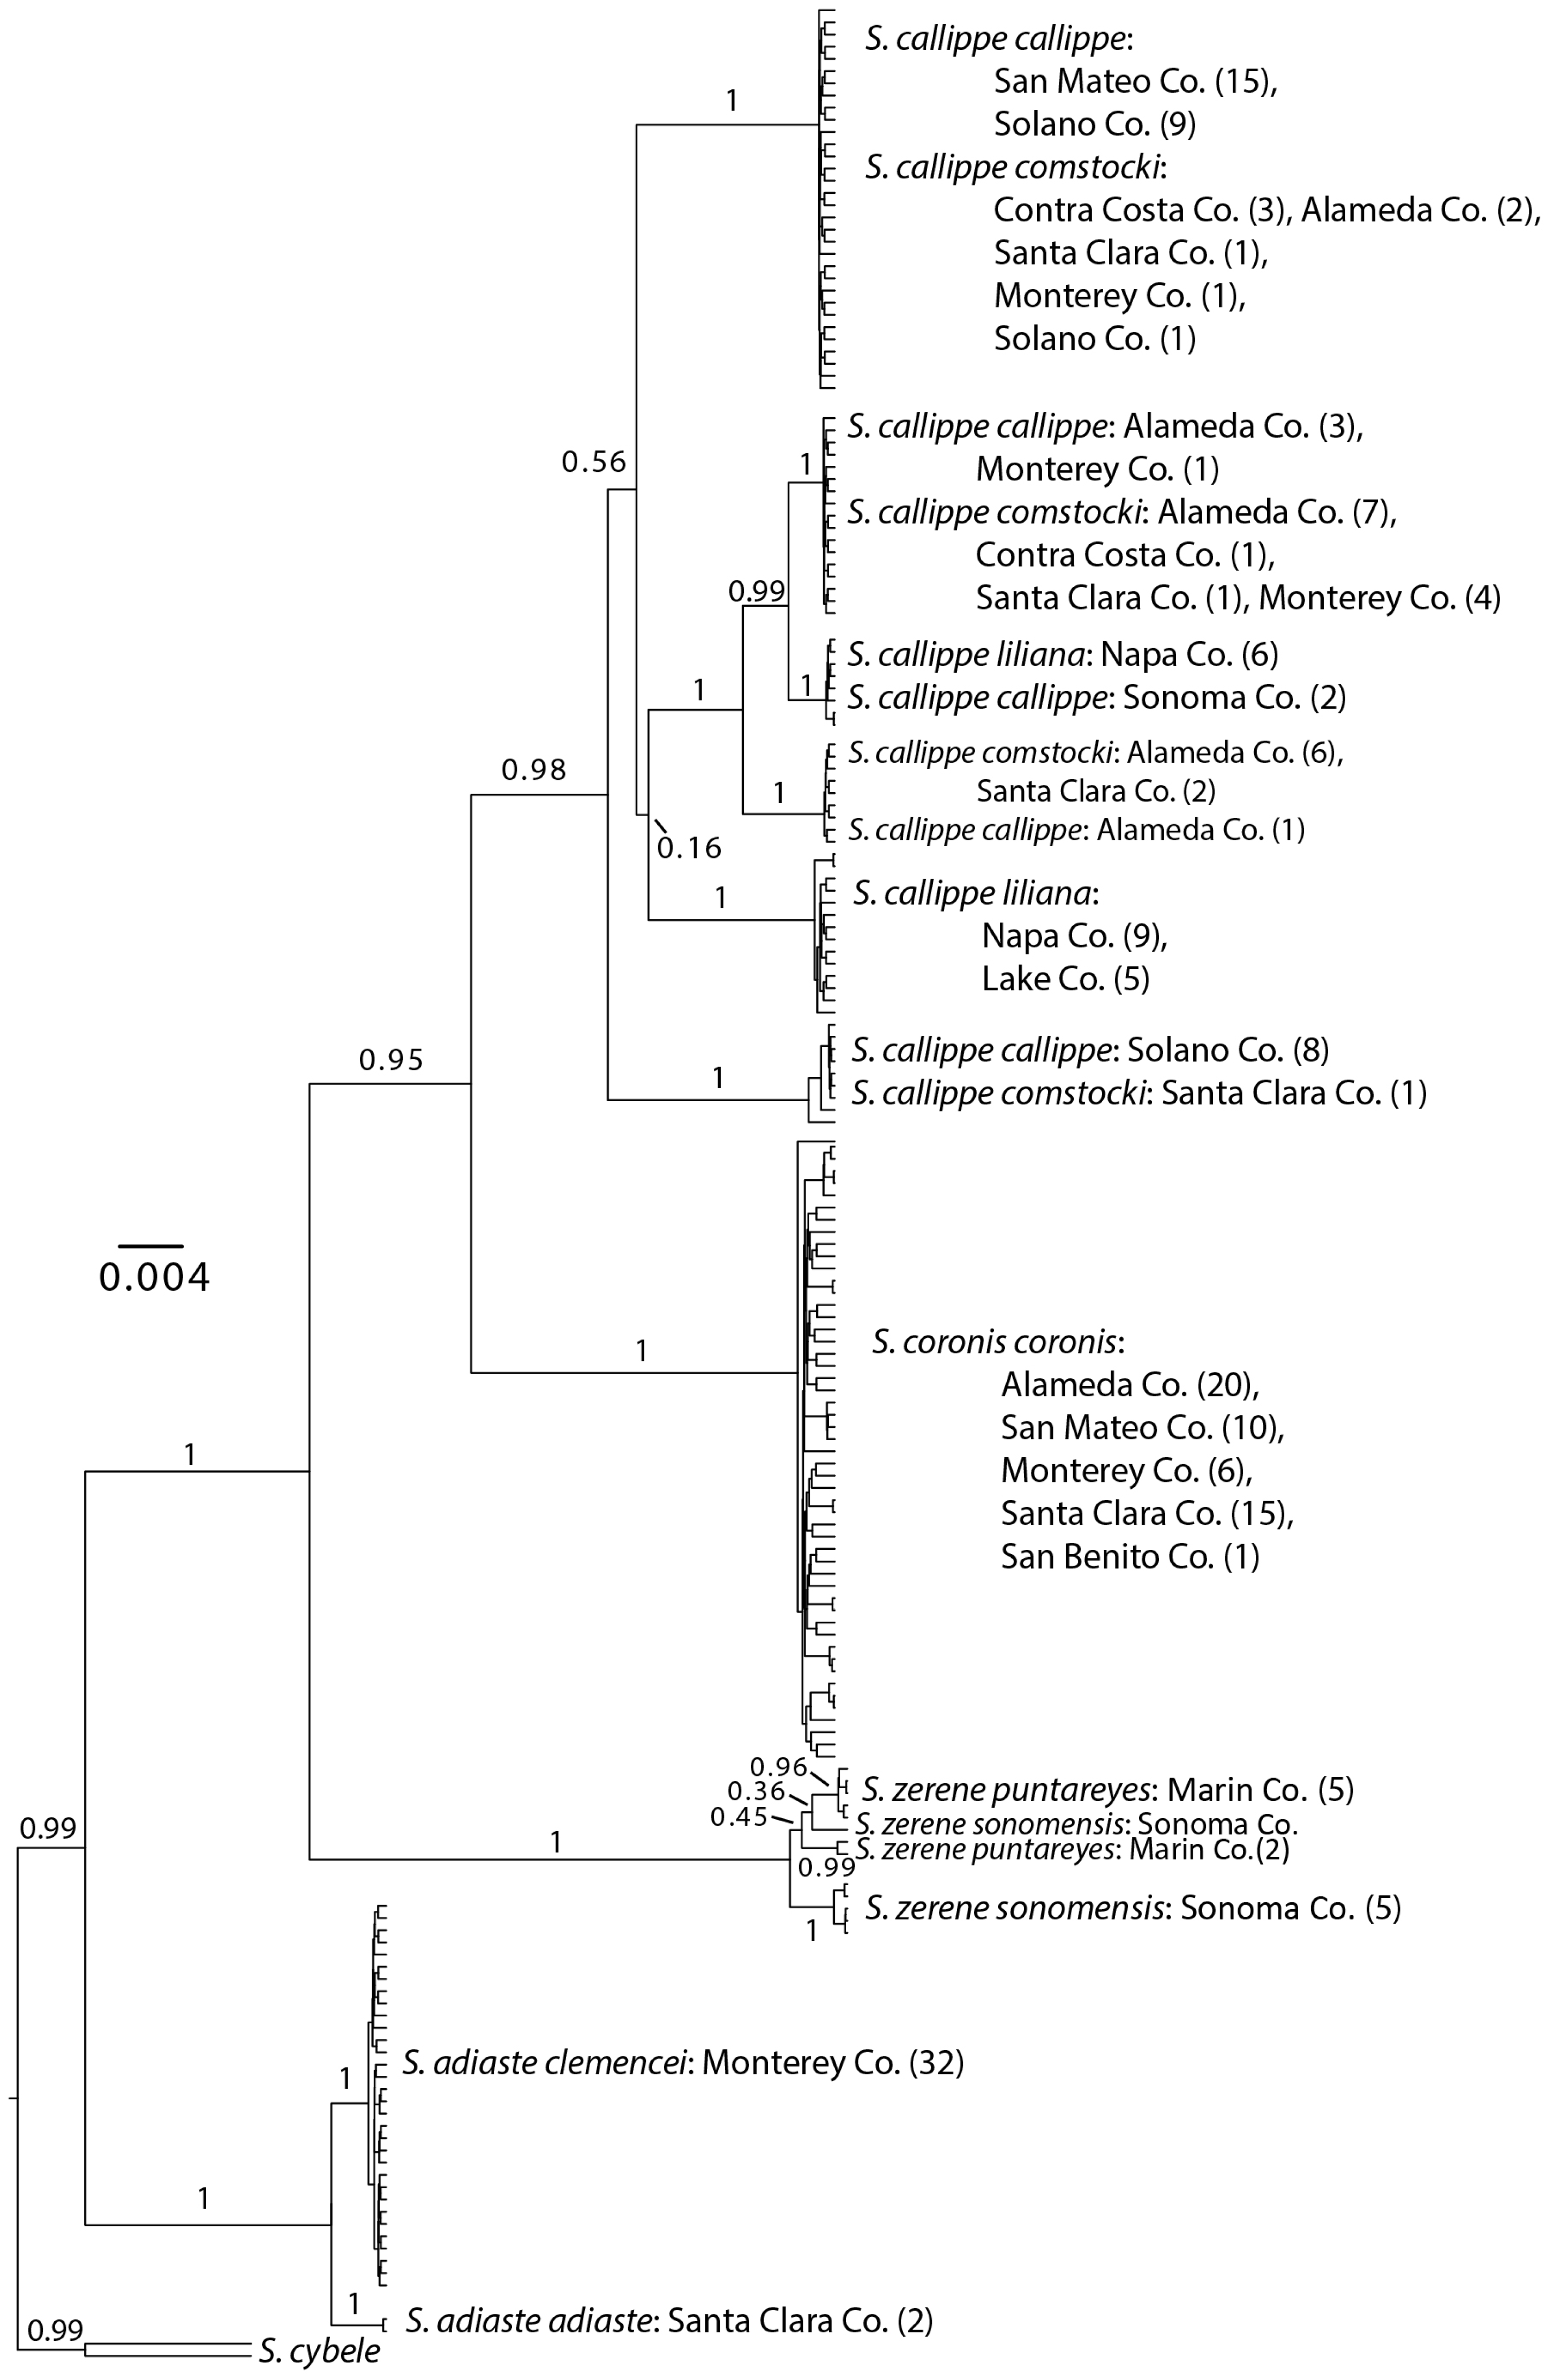
3.1. Neighbor-Joining and Bayesian Results

The NJ and Bayesian analysis clearly clustered species based on their wing morphology identification (Figure 2 and Figure S1). Individuals of S. zerene and S. adiaste all clustered by their respective species with very high bootstrap and posterior probability values (Figure 2). The S. coronis individuals also clustered together with very high bootstrap and posterior probability values (Figure 2). Individuals of S. callippe grouped together with bootstrap value of 0.66 (Figure S1) and a posterior probability of 0.98 (Figure 2). It is worth noting here that S. callippe had the greatest number of sampled subspecies and widest geographic sampling in this analysis. The relationships among species in the Bayesian analysis were consistent with other recent work [8,29].
Underlying the correct clustering of individuals identified by morphology is the fact that all samples clustered by species, rather than geographic location, even when samples from different species were collected at the same sites. For example, Solano Co. S. callippe and S. zerene were from essentially the same locality, as were S. adiaste, S. callippe and S. coronis from Monterey Co. S. callippe and S. coronis samples were also often from the same localities in the various counties.
Within species, both analyses showed some clustering of individuals by subspecies and location. S. adiaste subspecies came out separately with high bootstrap and posterior values, whereas S. zerene subspecies were more mixed (Figure 2). S. callippe had nearly all well-supported clusters containing a mix of subspecies, although intraspecific clusters were somewhat associated with subspecies. S. callippe liliana (H. Edwards, 1877) had one distinct cluster in both analyses, albeit with a low NJ bootstrap value. Two clusters with very high bootstrap/posterior probability values were comprised of large numbers of S. c. callippe. However, individuals identified as S. callippe callippe were mixed with S. callippe comstocki (Gunder, 1925) or S. callippe liliana in three other clusters with bootstrap/posterior values of 1.0.

3.2. Distance Results

In the analysis of genetic distance within and between species, there was clear evidence of a gap between the maximum intraspecific distance and minimum interspecific distance, but the gap was reduced in comparisons involving S. callippe. The values for the minimum interspecific distances ranged from 2.3% to 3.7% (Table 1) between Bay Area species and >2.6% between Bay Area species and S. cybele. The maximum intraspecific distances ranged from 0.5% to 2.8%, with highest value for S. callippe. With the high maximum intraspecific distance for S. callippe, there was still a gap with S. adiaste, and S. cybele, but not with S. zerene and S. coronis.
The analysis of genetic distance within and between subspecies exhibited slight differentiation between subspecies of each species, with little evidence of gaps between subspecies. Differences between subspecies from different species (non-underlined below diagonal in Table 2) reflected the interspecific differences in Table 1, with minimum differences that ranged from 2.3% to 4.0%. In terms of minimum inter-subspecies differences (underlined in Table 2), comparisons involving samples separated by larger distances such as S. adiaste adiaste vs. S. adiaste clemencei (J. A. Comstock, 1925), and S. callippe comstocki vs. S. callippe liliana showed the largest differences of 0.5% and 0.7%, respectively. In the case of S. adiaste the 0.5% minimum difference between subspecies showed a very small gap, with the maximum intra-subspecies distances. In contrast, for S. callippe the 0.7% minimum difference between subspecies overlapped markedly with the maximum intra-subspecies distances of 1.7% to 2.8%. Comparisons between subspecies that are closer geographically (i.e., S. z. puntareyes vs. S. z. sonomensis or S. callippe callippe vs. S. callippe liliana) or intergrade (i.e., S. callippe callippe and S. callippe comstocki) showed minimum differences between subspecies that ranged from 0.0% to 0.2%. The high maximum differences within S. callippe subspecies reflected the pattern seen in the neighbor-joining and Bayesian analyses, where well-supported clusters were comprised of multiple subspecies.

4. Discussion

Together with recent phylogenetic work, this study helps clarify the geographic scale and approaches required to understand Speyeria butterflies and their evolution. Previous work with few nuclear and mtDNA (CoI or CoII) genes indicated the species were weakly differentiated [5,8] or that clustering depended on the data set [5] when sampling multiple subspecies at larger scales (i.e., west of the Rocky Mountains). In contrast, our analysis produced consistent clustering of species using a single marker when focusing on a scale of < 100 km between populations of S. zerene, S. adiaste and S. coronis, and < 300 km for S. callippe, in the California Coast ranges. This result strongly supports the current species taxonomy. Our analysis also detected patterns consistent with ILS.
Although both hybridization and ILS can lead to a mismatch between mtDNA and morphological phenotype in Speyeria, ILS appears more important given the consistent clustering of species found at smaller scales, coupled with the variation in CoI found within and among subspecies, and the paraphyly found at larger scales. If hybridization was rampant or species were poorly defined, individuals would not have clustered so well. In addition, this recent, rapid radiation is thought to have been shaped by patterns of glaciation across North America [8], and today these butterflies often exist in relatively isolated populations. This makes it likely that natural selection for local adaptation causes differentiation between populations, selecting different alleles in populations in different regions. Furthermore, dispersal abilities are typically low for species without reproductive diapause [30,31], and genetic drift may work to randomly sort ancestral genetic diversity among populations in different regions.
Our results indicate that the DNA barcode is useful in the genus Speyeria for differentiating species at smaller geographic scales. It may thus be helpful in identifying damaged or worn samples, or as a useful conservation tool for comparing rare or extinct taxa from museum specimens with other local populations using small amounts of tissue, as was done here for some samples. For example, the placement of the potentially extinct S. zerene myrtleae from San Mateo Co. [16], or other extinct populations, could potentially be evaluated. In addition, CoI may be useful for detecting hybrids of sympatric individuals at local scales, although none were detected here.
Along with corroborating morphological species designations, our analyses support the distinctiveness of several Bay Area subspecies of conservation concern. S. adiaste adiaste and S. adiaste clemencei clustered by subspecies, whereas S. zerene puntareyes and S. zerene sonomensis, showed some separation, but were associated with low bootstrap/posterior values and depended on the analysis (Figure 2 and Figure S1). S. callippe had multiple clusters with high bootstrap/posterior values (Figure 2 and Figure S1), with two clusters dominated by individuals of the endangered S. callippe callippe, one cluster dominated by S. callippe liliana, and three a mix of S. c. callippe and either S. c. comstocki or S. c. liliana. The mixed subspecies in the NJ and Bayesian analysis should not be interpreted as a lack of distinctiveness of S. c. callippe or other subspecies, but rather as an indication that a population genetics approach examining allele frequency differences among multiple populations will be more informative below the species level.
In line with the population genetics approach just suggested, our analysis also sheds light on the genetic diversity of species of conservation concern for which there were increased sample sizes. This is especially true for the endangered S. callippe callippe, which was most broadly sampled. Our analysis indicates wide mtDNA diversity within S. c. callippe, given its presence in nearly all of the well-supported clusters, and the maximum intra-subspecies distance of 2.8%. Together this indicates a healthy genetic diversity among the scattered few remaining populations of S. c. callippe, which can be revealed through population genetics approaches. Beyond S. callippe, the results for S. zerene also indicated relatively high genetic diversity, with maximum within-subspecies distances similar to S. coronis coronis, despite the much smaller ranges of S. z. puntareyes and S. z. sonomensis (Table 2). The S. adiaste subspecies showed the lowest within-subspecies variation in our analysis.
In conclusion, the utility and limits of DNA barcoding in Speyeria butterflies should be further tested in other species and other regions. Doing so will provide data to corroborate morphological hypotheses and help clarify the relative contribution of hybridization and ILS to patterns of diversity in this radiation. In addition, approaches similar to recent work examining loci across the genome [29] would also help in resolving patterns of diversification in Speyeria. For example, the RADseq analysis of Campbell, Davis, Dupuis, Muirhead and Sperling [29] resolved the species for which multiple individuals were sampled, despite the potential for hybridization [6] and ILS. Finally, as suggested for S. callippe above, a population genetics approach focusing on allele frequency differences among several populations can help confirm evolutionarily significant units or distinct population segments. This population genetics approach is the topic of further research on S. callippe in the Bay Area.

Supplementary Materials

The following are available online at https://www.mdpi.com/1424-2818/10/4/130/s1, Figure S1: Results of NJ analysis, Table S1: Summary of sampling.

Author Contributions

Conceptualization, W.K.S. and R.I.H.; methodology, W.K.S. and R.I.H.; formal analysis, R.I.H., L.W. and M.G.; investigation, R.I.H., L.W., M.G. and W.K.S.; resources, S.P.M., M.R.K., W.K.S., R.I.H.; data curation, R.I.H. and W.K.S.; writing—original draft preparation, R.I.H., L.W., and M.G.; writing—review and editing, R.I.H., W.K.S., S.P.M., M.R.K.; project administration, R.I.H. and W.K.S.; funding acquisition, W.K.S., S.P.M., M.R.K. and R.I.H.

Funding

This research was funded by the Department of Biological Sciences at the University of the Pacific, the Pacific Fund and the Eberhardt Research Fellowship of the University of the Pacific, the Federal Bureau of Reclamation’s Central Valley Project Conservation Program, and the U.S. Fish and Wildlife Service.

Acknowledgments

This work would not have been possible without the help and support of the following people and organizations helping with access to field sites and obtaining samples: C. Tenney, L. O’Brien, A. Launer, P. Kobernus, J. Hull, D. Kelly, J. Meisler, J. Silverman, S. Wickham, L. Harrington, J. Cleckler, G. Smick, J. DiDonato, J. Emmel, B. Becker, P. Johnson, the Fletcher family, the Phizackerley family, California State Parks, East Bay Regional Parks, San Mateo Co. Parks, Santa Clara Co. Parks, Midpeninsula Regional Open Space District, Solano Land Trust, Sonoma Land Trust, Land Trust of Napa County. We thank B. Becker and D. Kelly for help obtaining S. zerene samples and the USFWS for help obtaining S. callippe samples (TE-07064A-0).

Conflicts of Interest

The authors declare no conflict of interest. The funders had no role in the design of the study; in the collection, analyses, or interpretation of data; in the writing of the manuscript, or in the decision to publish the results.

References

  1. Emmel, J.F.; Emmel, T.C.; Mattoon, S.O. A new subspecies of Speyeria zerene (Lepidoptera: Nymphalidae) from the San Francisco Bay Area of California. In Systematics of Western North American Butterflies; Emmel, T.C., Ed.; Mariposa Press: Gainesville, FL, USA, 1998; pp. 455–460. [Google Scholar]
  2. Shapiro, A.M. Montane insular butterfly biogeography: Fauna of Ball Mountain, Siskiyou County, California. Great Basin Nat. 1986, 46, 336–347. [Google Scholar]
  3. Glassberg, J. Butterflies through Binoculars: The West; Oxford University Press: New York, NY, USA, 2001. [Google Scholar]
  4. Emmel, T.C.; Austin, G.T. What is Argynnis carolae? The cytotaxonomy and systematic position of a Speyeria relic from Nevada (Lepidoptera: Nymphalidae). In Systematics of Western North American Butterflies; Emmel, T.C., Ed.; Mariposa Press: Gainesville, FL, USA, 1998; pp. 443–450. [Google Scholar]
  5. McHugh, A.; Bierzychudek, P.; Greever, C.; Marzulla, T.; Van Buskirk, R.; Binford, G. A molecular phylogenetic analysis of Speyeria and its implications for the management of the threatened Speyeria zerene hippolyta. J. Insect Conserv. 2013, 17, 1237–1253. [Google Scholar] [CrossRef]
  6. Hammond, P.C.; McCorkle, D.V.; Bergman, W. Hybridization studies of genomic compatibility and phenotypic expression in the Greater Fritillary Butterflies (Nymphalidae: Argynnini). J. Lepid. Soc. 2013, 67, 263–273. [Google Scholar] [CrossRef]
  7. Hammond, P.C. Patterns of geographic variation and evolution in polytypic butterflies. J. Res. Lepid. 1990, 29, 54–76. [Google Scholar]
  8. De Moya, R.S.; Savage, W.; Tenney, C.; Bao, V.; Wahlberg, N.; Hill, R.I. Interrelationships and diversification of Argynnis Fabricius and Speyeria Scudder butterflies. Syst. Entomol. 2017, 42, 635–649. [Google Scholar] [CrossRef]
  9. Simonsen, T.J. Fritillary phylogeny, classification, and larval host plants: Reconstructed mainly on the basis of male and female genitalic morphology (Lepidoptera: Nymphalidae: Argynnini). Biol. J. Linn. Soc. 2006, 89, 627–673. [Google Scholar] [CrossRef]
  10. Simonsen, T.J. Glands, muscles and genitalia. Morphological and phylogenetic implications of histological characters in the male genitalia of Fritillary butterflies (Lepidoptera: Nymphalidae: Argynnini). Zool. Scr. 2006, 35, 231–241. [Google Scholar] [CrossRef]
  11. Dos Passos, C.F.; Grey, L.P. A genitalic survey of the Argynninae (Lepidoptera, Nymphalidae). Am. Mus Novit. 1945, 1296, 1–29. [Google Scholar]
  12. Hammond, P.C.; McCorkle, D.V. The decline and extinction of Speyeria populations resulting from human environmental disturbances (Nymphalidae: Argynninae). J. Res. Lepid. 1983, 22, 217–224. [Google Scholar]
  13. Wells, C.N.; Tonkyn, D.W. Range collapse in the Diana fritillary, Speyeria diana (Nymphalidae). Insect Conserv. Divers. 2014, 7, 365–380. [Google Scholar] [CrossRef]
  14. Shepherd, S.; Debinski, D. Reintroduction of Regal Fritillary (Speyeria idalia) to a Restored Prairie. Ecol. Restor. 2005, 23, 4. [Google Scholar] [CrossRef]
  15. Sims, S.R. Speyeria (Lepidoptera: Nymphalidae) Conservation. Insects 2017, 8, 13. [Google Scholar] [CrossRef] [PubMed]
  16. Emmel, J.F.; Emmel, T.C. A previously unrecognized subspecies of Speyeria zerene (Lepidoptera: Nymphalidae) from Coastal Northern California. In Systematics of Western North American Butterflies; Emmel, T.C., Ed.; Mariposa Press: Gainesville, FL, USA, 1998; pp. 451–454. [Google Scholar]
  17. Dunford, J. The Genus Speyeria and the Speyeria atlantis/Speyeria hesperis Complex: Species and Subspecies Accounts, Systematics, and Biogeography (Lepidoptera: Nymphalidae). Ph.D. Thesis, University of Florida, Gainesville, FL, USA, 2007. [Google Scholar]
  18. Pelham, J.P. A catalogue of the butterflies of the United States and Canada, with a complete bibliography of the descriptive and systematic literature. J. Res. Lepid. 2008, 40, 1–658. [Google Scholar]
  19. Hammond, P.C. The colonization of violets and Speyeria butterflies on the ash-pumice fields deposited by Cascadian volcanoes. J. Res. Lepid. 1981, 20, 179–191. [Google Scholar]
  20. Sperling, F.A.H. Mitochondrial DNA variation and Haldane’s rule in the Papilio glaucus and P. troilus species groups. Heredity 1993, 71, 227–233. [Google Scholar] [CrossRef]
  21. Dasmahapatra, K.K.; Silva-Vasquez, A.; Chung, J.-W.; Mallet, J. Genetic analysis of a wild-caught hybrid between non-sister Heliconius butterfly species. Biol. Lett. 2007, 3, 660–663. [Google Scholar] [CrossRef]
  22. Elias, M.; Hill, R.I.; Willmott, K.R.; Dasmahapatra, K.K.; Brower, A.V.Z.; Mallet, J.; Jiggins, C.D. Limited performance of DNA barcoding in a diverse community of tropical butterflies. Proc. R. Soc. B Biol. Sci. 2007, 274, 2881–2889. [Google Scholar] [CrossRef] [Green Version]
  23. Folmer, O.; Black, M.; Hoeh, W.; Lutz, R.; Vrijenhoek, R. DNA primers for amplification of mitochondrial cytochrome c oxidase subunit I from diverse metazoan invertebrates. Mol. Mar. Biol. Biotechnol. 1994, 3, 294–299. [Google Scholar]
  24. DNAstar. Version 2.1.0.; DNAstar: Maddison, WI, USA, 2011. [Google Scholar]
  25. Edgar, R.C. MUSCLE: Multiple sequence alignment with high accuracy and high throughput. Nucleic Acids Res. 2004, 32, 1792–1797. [Google Scholar] [CrossRef]
  26. Maddison, W.P.; Maddison, D.R. Mesquite: A Modular System for Evolutionary Analysis. Version 2.7.3. 2010. Available online: http://mesquiteproject.org (accessed on 1 January 2017).
  27. Kumar, S.; Stecher, G.; Tamura, K. MEGA7: Molecular Evolutionary Genetics Analysis version 7.0 for bigger datasets. Mol. Biol. Evol. 2016, 33, 1870–1874. [Google Scholar] [CrossRef] [Green Version]
  28. Bouckaert, R.; Heled, J.; Kühnert, D.; Vaughan, T.; Wu, C.-H.; Xie, D.; Suchard, M.; Rambaut, A.; Drummond, A.J. BEAST 2: A software platform for Bayesian evolutionary analysis. Public Libr. Sci. Comput. Biol. 2014, 10, e1003537. [Google Scholar] [CrossRef] [PubMed]
  29. Campbell, E.O.; Davis, C.S.; Dupuis, J.R.; Muirhead, K.; Sperling, F.A.H. Cross-platform compatibility of de novo-aligned SNPs in a nonmodel butterfly genus. Mol. Ecol. Resour. 2017, 17, e84–e93. [Google Scholar] [CrossRef] [PubMed]
  30. Zaman, K.; Tenney, C.; Rush, C.E.; Hill, R.I. Population ecology of a California endemic: Speyeria adiaste clemencei. J. Insect Conserv. 2015, 19, 753–763. [Google Scholar] [CrossRef]
  31. Longcore, T.; Lam, C.S.; Kobernus, P.; Polk, E.; Wilson, J.P. Extracting useful data from imperfect monitoring schemes: Endangered butterflies at San Bruno Mountain, San Mateo County, California (1982–2000) and implications for habitat management. J. Insect Conserv. 2010, 14, 335–346. [Google Scholar] [CrossRef]
Figure 1. Bay Area and Coast Range counties sampled for each species. Red is a county where S. callippe was sampled, yellow for S. coronis, orange where both S. callippe and S. coronis were sampled, left diagonal is S. zerene and right diagonal is S. adiaste. The counties sampled for subspecies are indicated in Figure 2. Note that species may be present in the adjacent counties shown, though they were not analyzed here. County codes are as follows: La = Lake; Na = Napa; Sn = Sonoma; Sl = Solano; Ma = Marin; CC = Contra Costa; Al = Alameda; SM = San Mateo; SC = Santa Clara; SB = San Benito; Mo = Monterey.
Diversity 10 00130 g001
Figure 2. Results of the Bayesian analysis. Posterior probability values are indicated near branches. The scale bar is substitutions per site. Parentheses indicate the number of samples.
Diversity 10 00130 g002
Table 1. Intra- and interspecific genetic distances. The maximum intraspecific distances are along the diagonal, and the minimum interspecific distances are below the diagonal. P-distance represents the number of base differences per site.
S. adiasteS. callippeS. coronisS. zerene
S. adiaste0.006
S. callippe0.0310.028
S. coronis0.0370.0230.005
S. zerene0.0250.0230.0360.010
Table 2. Genetic distances within and between subspecies. Maximum distance within subspecies along the diagonal, and minimum distances between subspecies below the diagonal. Underlined values are comparisons within the same species. P-distance represents number of base differences per site.
S. a. adiasteS. a. clemenceiS. cal. callippeS. cal. comstockiS. cal. lilianaS. cor. coronisS. z. puntareyesS. z. sonomensis
S. a. adiaste0.000
S. a. clemencei0.0050.002
S. cal. callippe0.0340.0370.028
S. cal. comstocki0.0350.0370.0000.024
S. cal. liliana0.0310.0310.0000.0070.017
S. cor. coronis0.0370.0400.0260.0280.0230.005
S. z. puntareyes0.0280.0330.0270.0290.0270.0360.007
S. z. sonomensis0.0250.0290.0230.0230.0250.0360.0020.004

