Seasonal Use of Railways by Wildlife

Abstract
1. Introduction
2. Materials and Methods
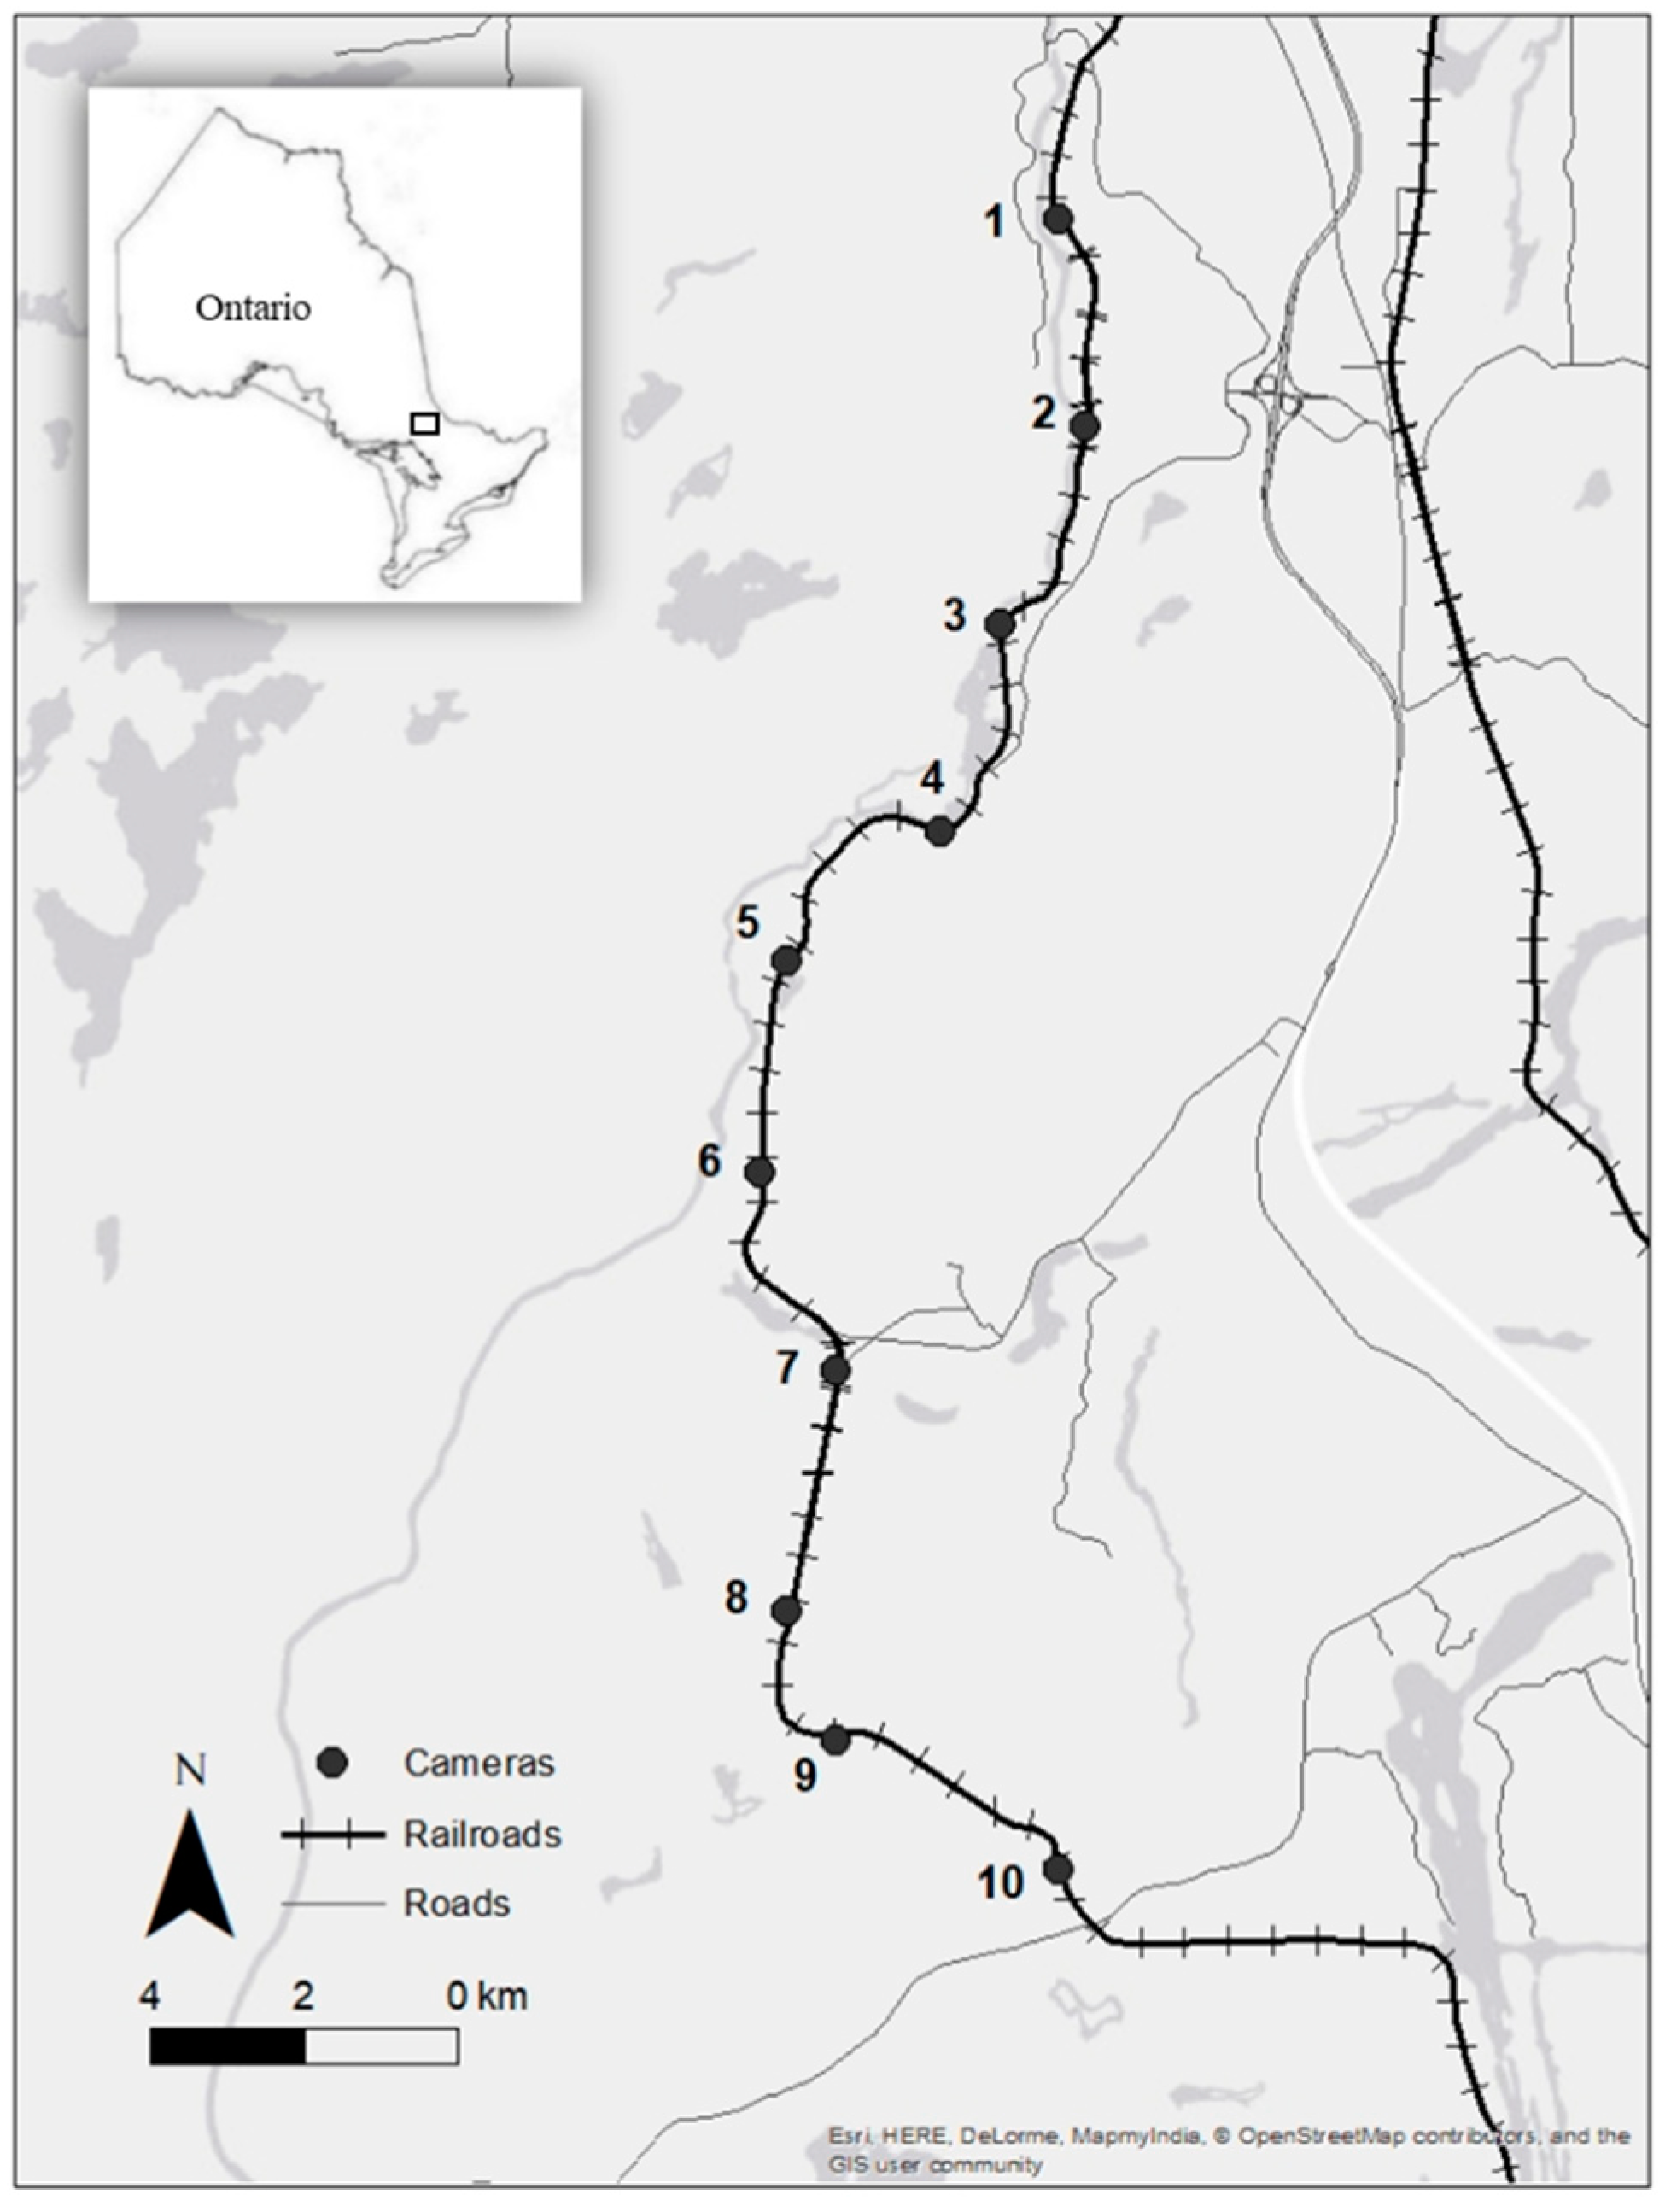
2.1. Study Area
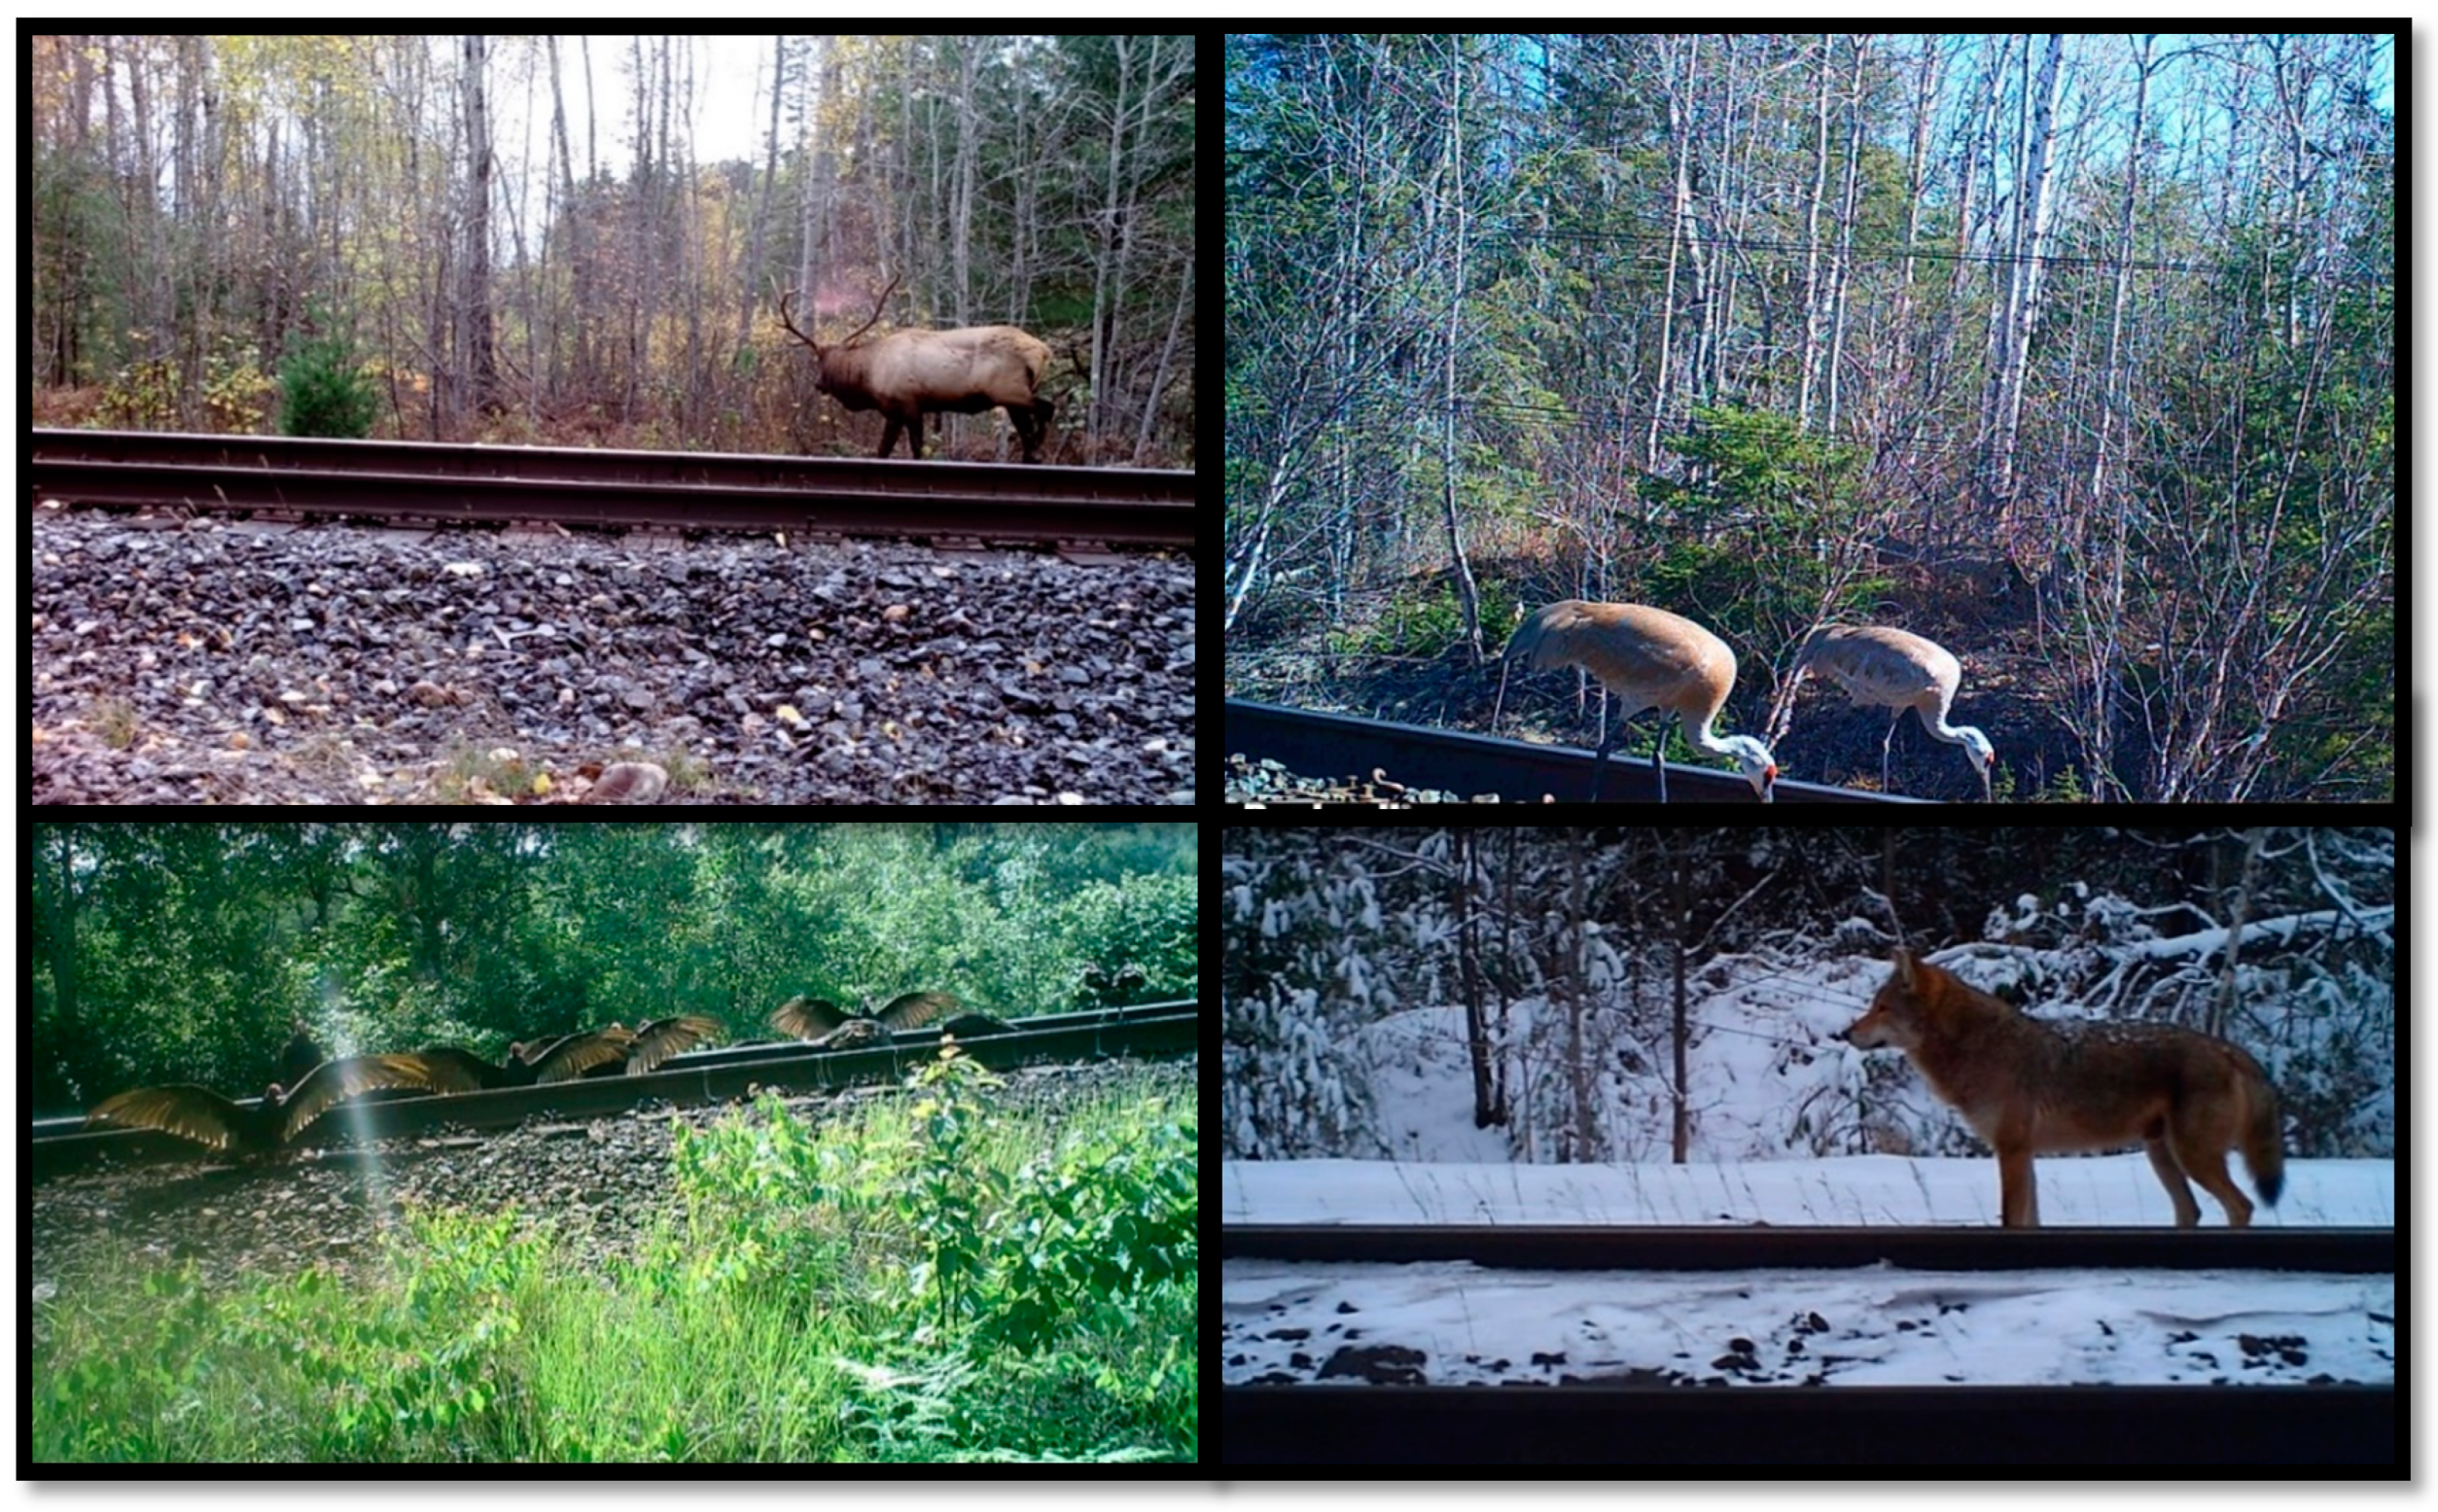
2.2. Cameras
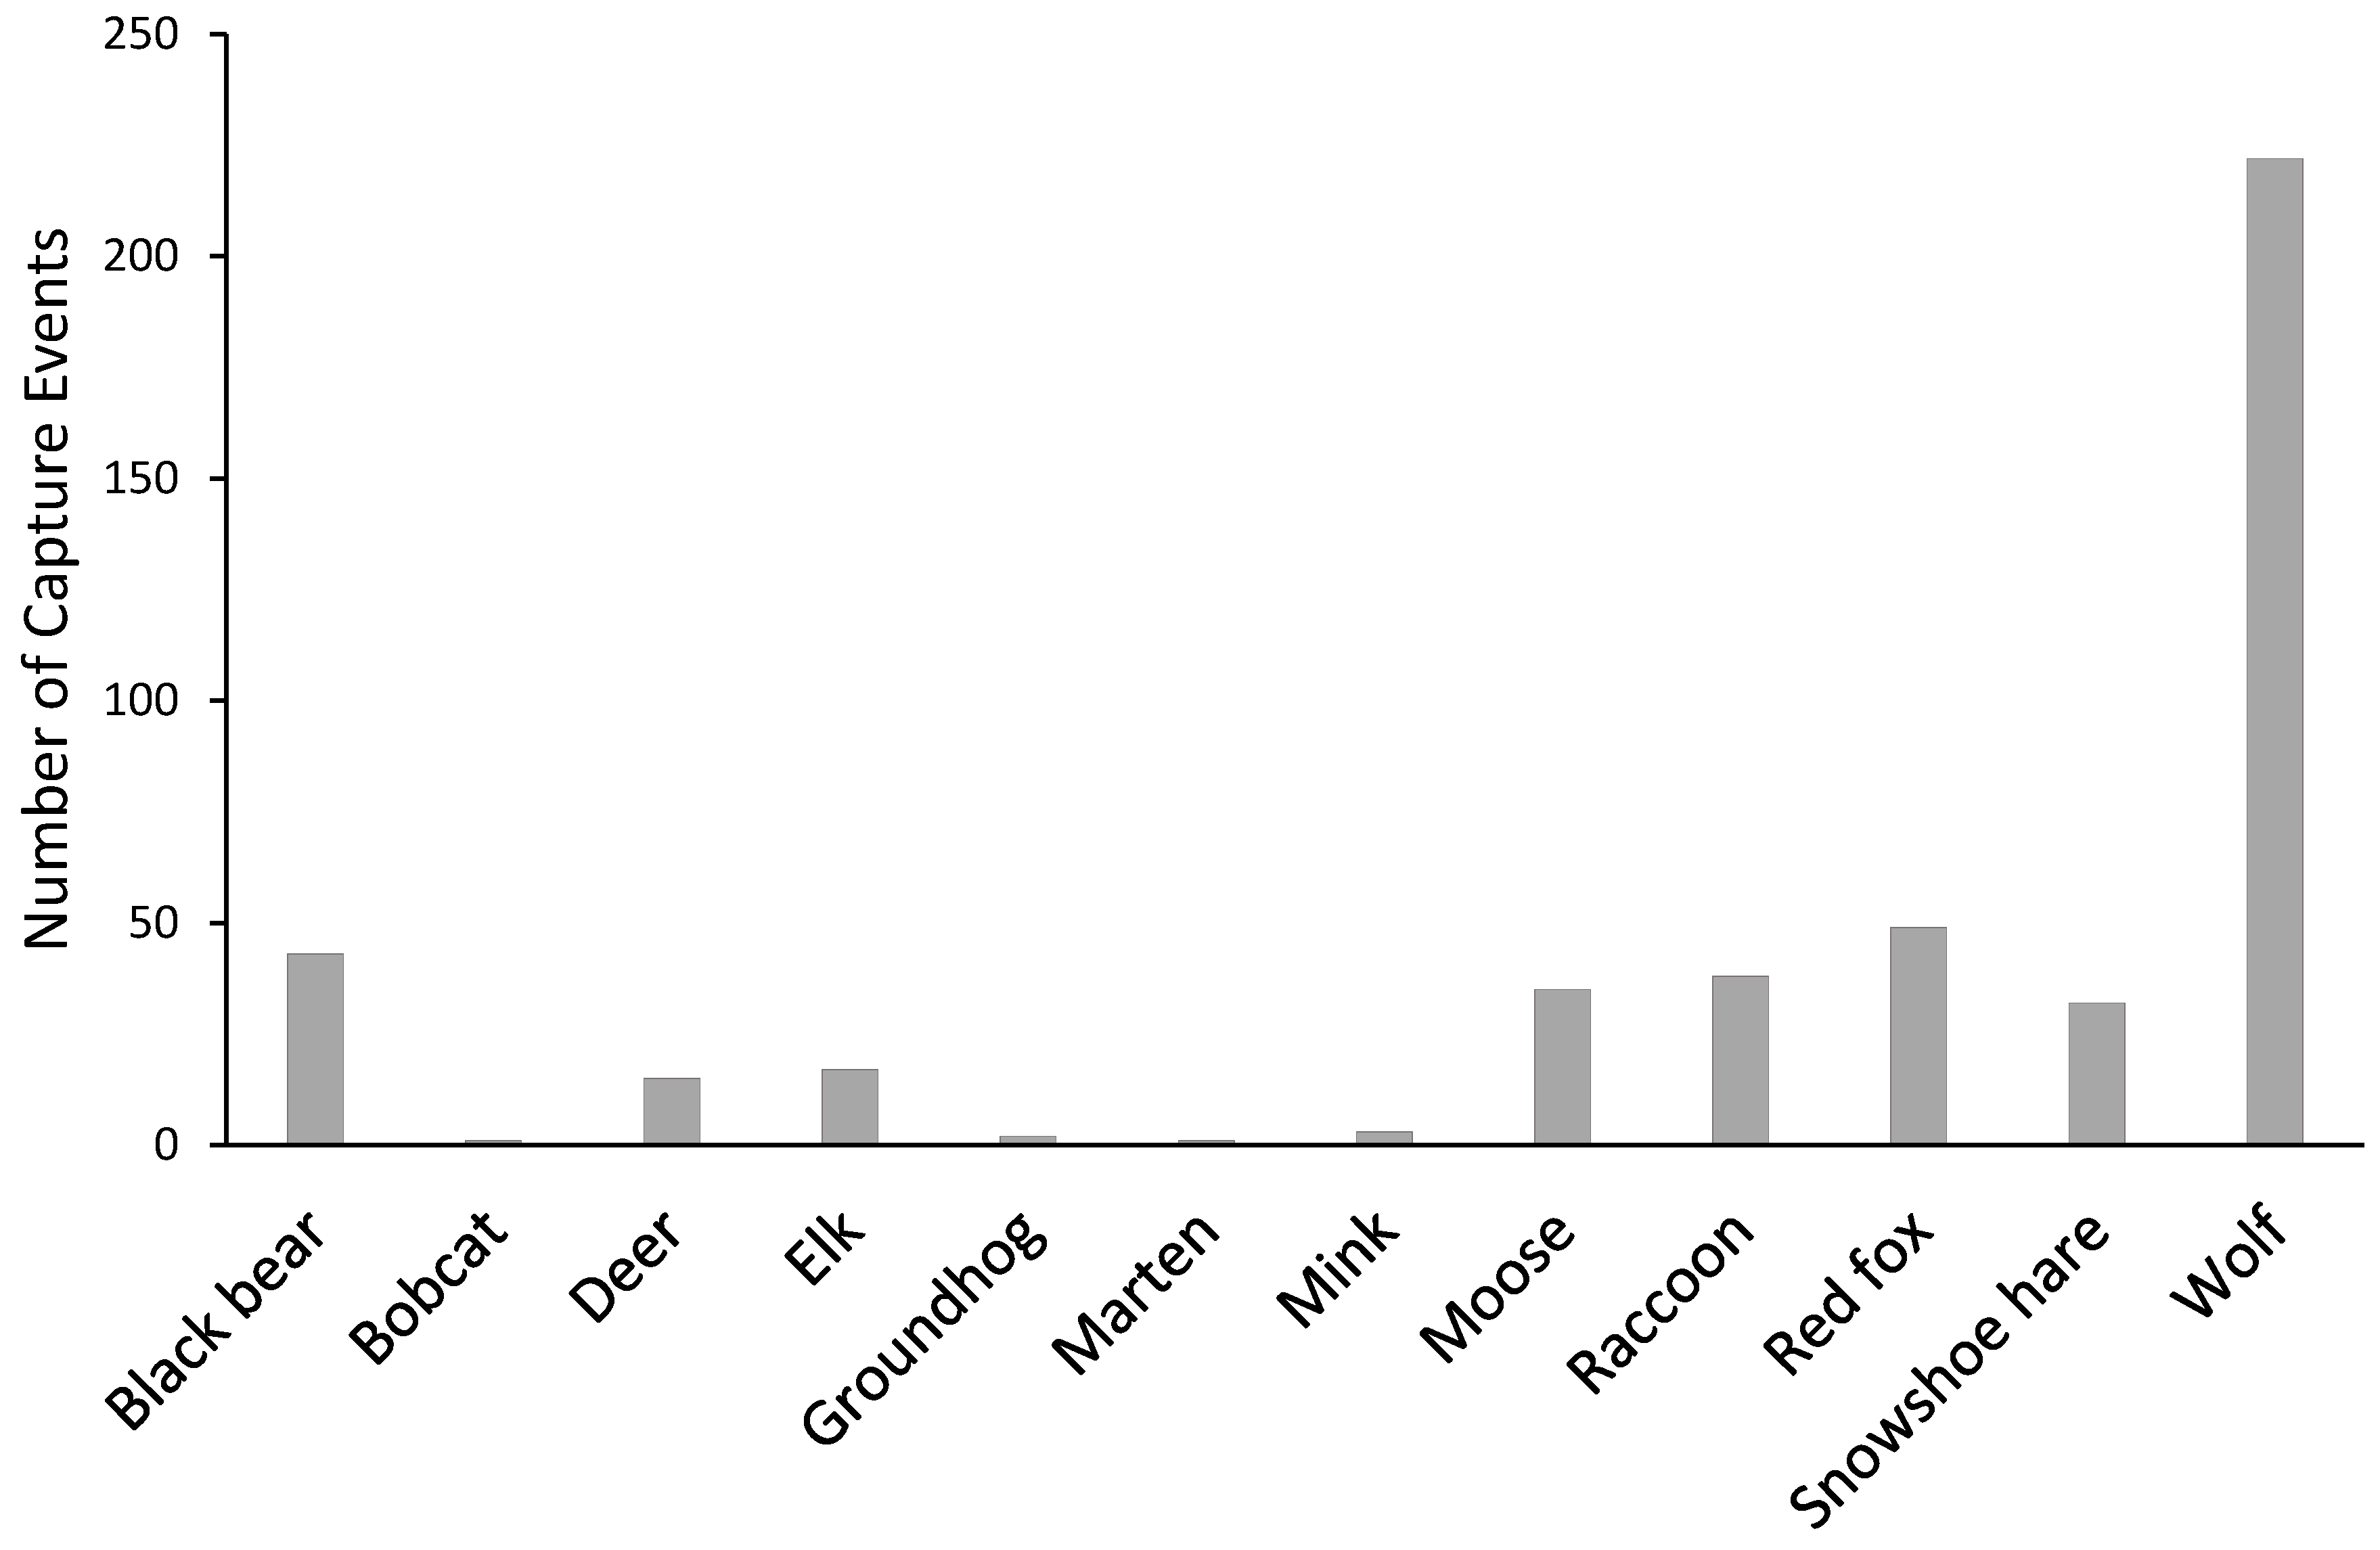
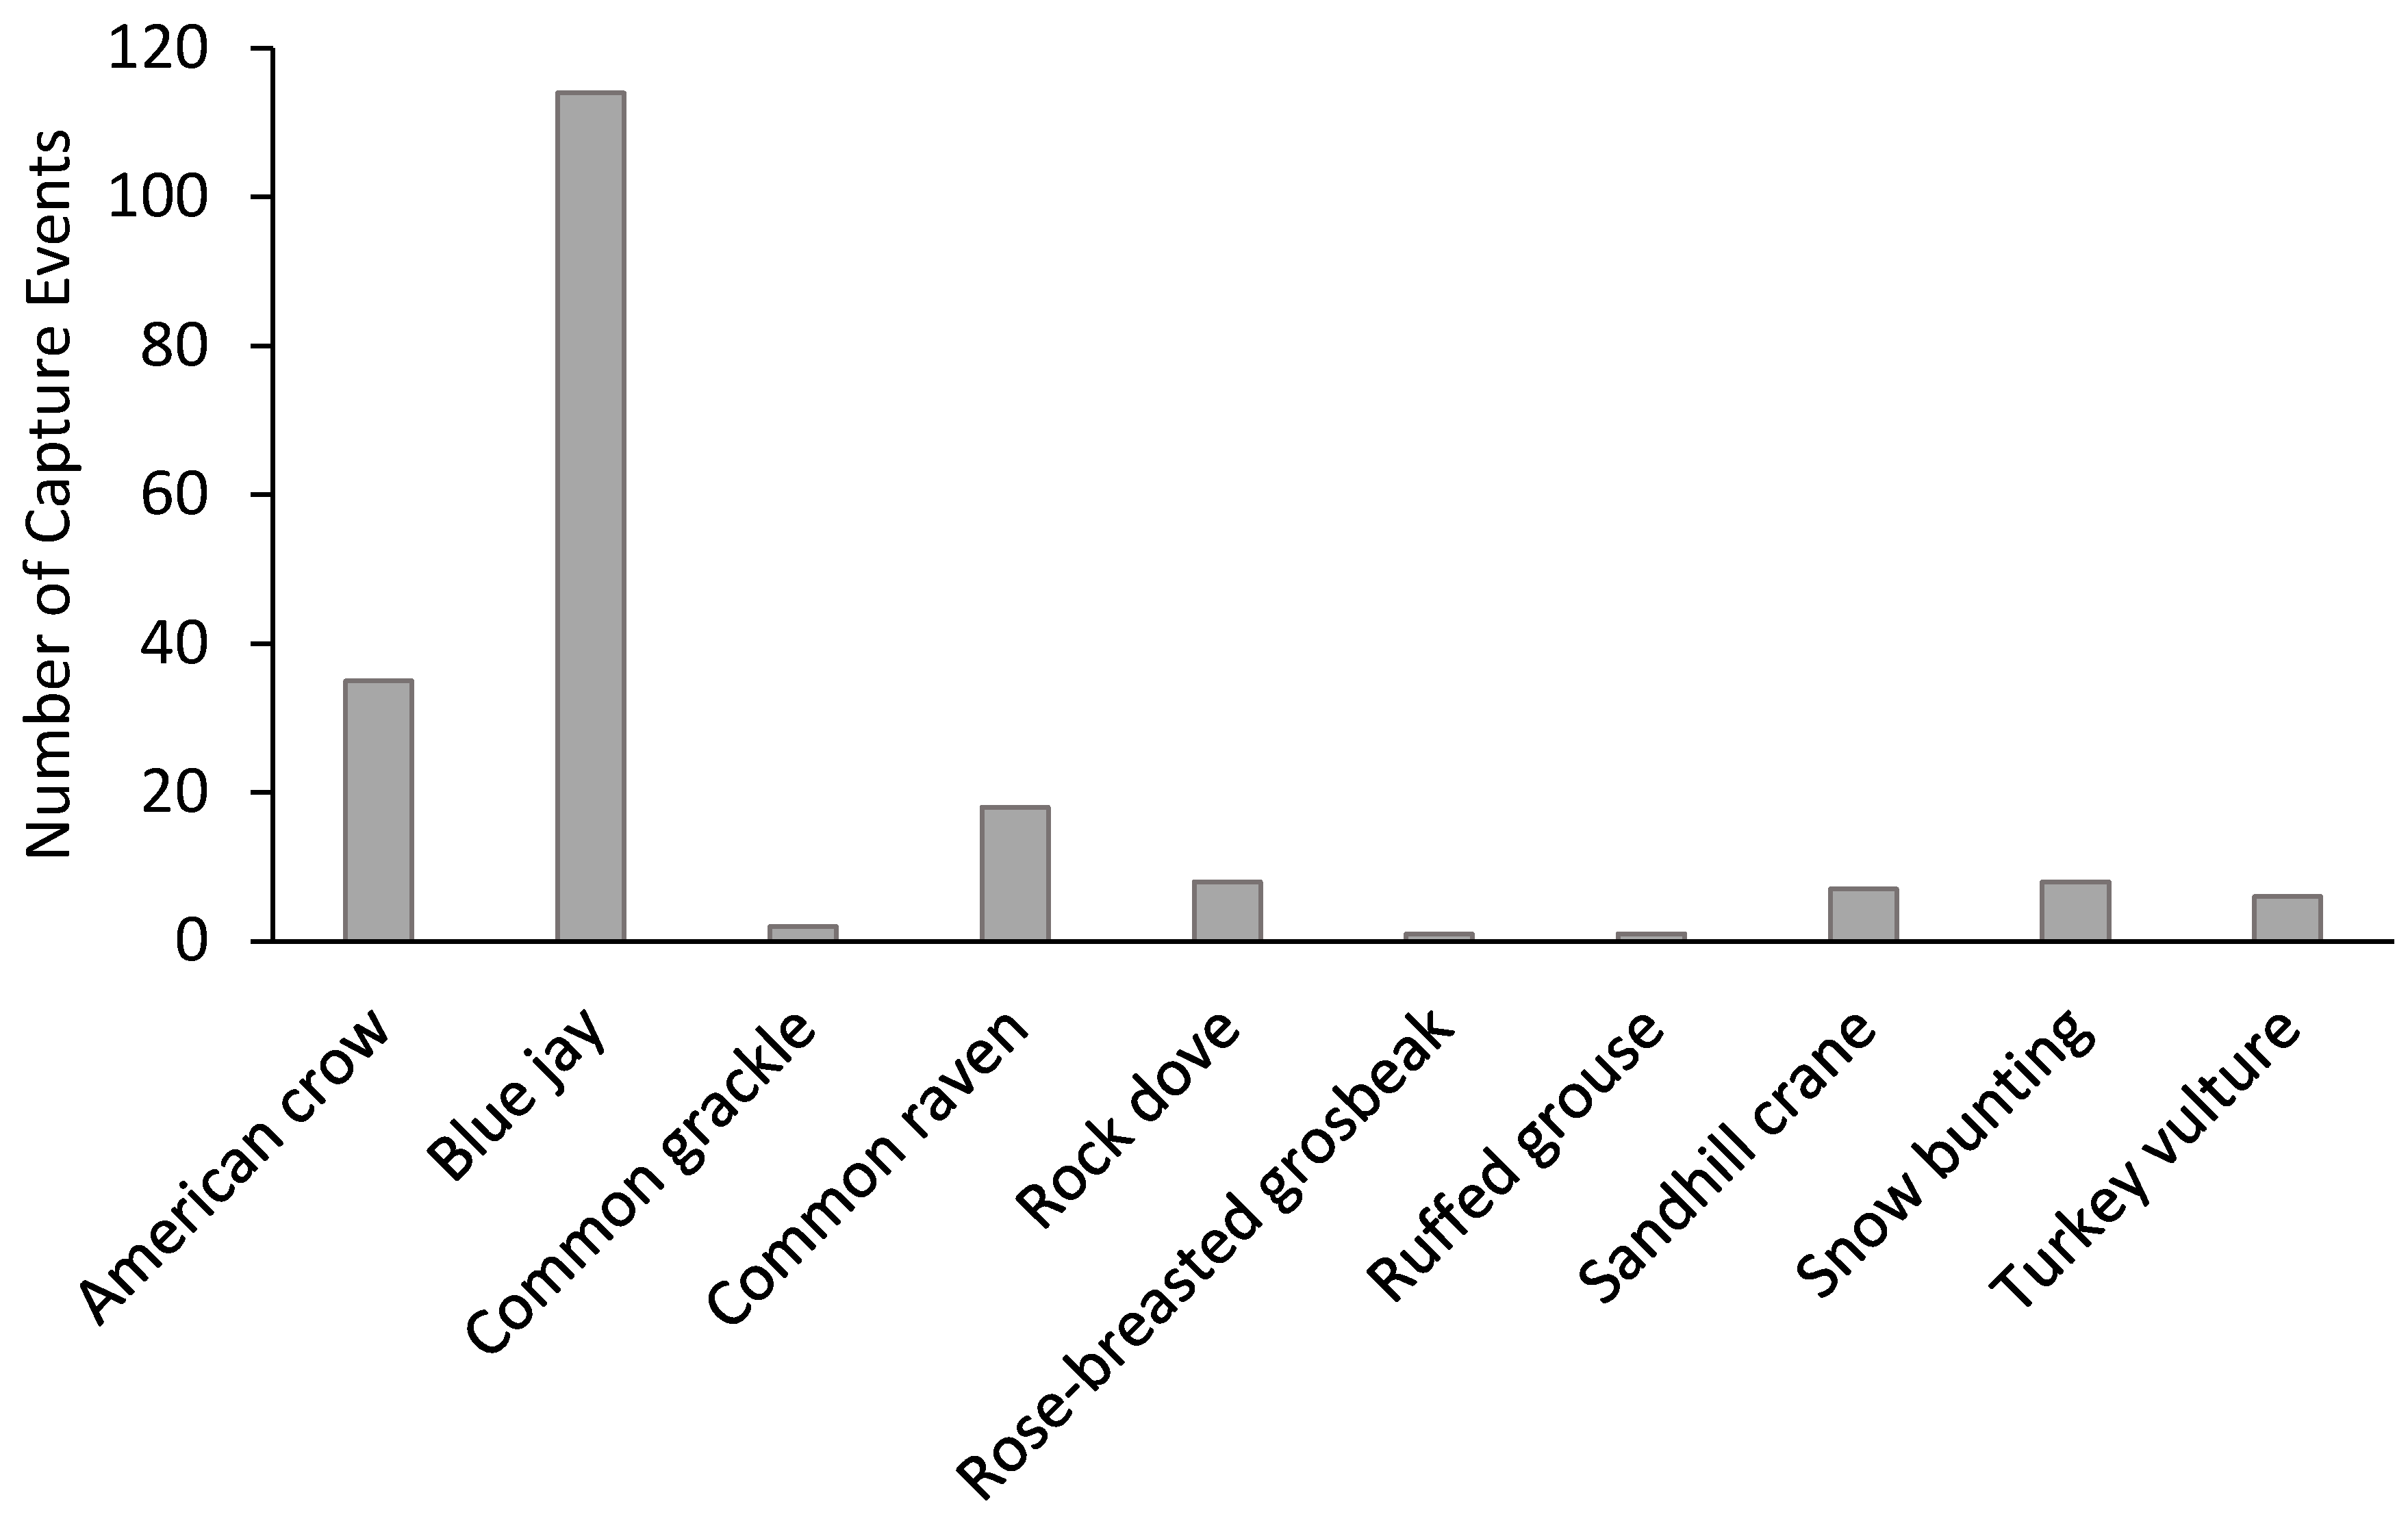
3. Results
4. Discussion
5. Conclusions
Author Contributions
Funding
Acknowledgments
Conflicts of Interest
References
- Popp, J.N.; Boyle, S.P. Railway ecology: Underrepresented in science? Basic Appl. Ecol. 2017, 19, 84–93. [Google Scholar] [CrossRef]
- Dorsey, B.P.; Olsson, M.; Rew, L.J. Ecological effects of railways on wildlife. In Handbook of Road Ecology; van der Ree, R., Grilo, C., Smith, D., Eds.; Wiley-Blackwell: West Sussex, UK, 2015; pp. 219–227. [Google Scholar]
- Dulac, J. Global Land Transport Infrastructure Requirements: Estimating Road and Railway Infrastructure Capacity and Costs to 2050; International Energy Aagency: Paris, France, 2013; pp. 1–54. [Google Scholar]
- Borda-de-Água, L.; Barrientos, R.; Beja, P.; Pereira, H.M. Railway Ecology; Springer: Cham, Switzerland, 2017. [Google Scholar]
- Popp, J.N. Railways offer grain on a silver platter to wildlife, but at what cost? Anim. Conserv. 2017, 20, 403–404. [Google Scholar] [CrossRef]
- Jackson, S.D. Overview of transportation impacts on wildlife movement and populations. In Wildlife and Highways: Seeking Solutions to an Ecological and Socio-Economic Dilemma; Messmer, T.A., West, B., Eds.; The Wildlife Society: Nashville, TN, USA, 2000; pp. 7–20. [Google Scholar]
- Barrientos, R.; Borda-de-Água, L. Railways as barriers for wildlife: Current knowledge. In Railway Ecology; Borda-de-Água, L., Barrientos, R., Beja, P., Pereira, H.M., Eds.; Springer Open: Cham, Switzerland, 2017; pp. 43–64. [Google Scholar]
- Bartoszek, J.; Greenwald, K.R. A population divided: Railroad tracks as barriers to gene flow in an isolated population of marbled salamanders (Ambystoma opacum). Herpetol. Conserv. Biol. 2009, 4, 191–197. [Google Scholar]
- Ito, T.Y.; Lhagvasuren, B.; Tsunekawa, A.; Shinoda, M.; Takatsuki, S.; Buuveibaatar, B.; Chimeddorj, B. Fragmentation of the habitat of wild ungulates by anthropogenic barriers in Mongolia. PLoS ONE 2013, 8, e56995. [Google Scholar] [CrossRef] [PubMed]
- Child, K. Railways and moose in the central interior of BC: A recurrent management problem. Alces 1983, 19, 118–135. [Google Scholar]
- Kolb, H.H. Factors affecting the movements of dog foxes in Edinburgh. J. Appl. Ecol. 1984, 21, 161–173. [Google Scholar] [CrossRef]
- Andreassan, H.P.; Gunderson, H.; Storaas, T. The effect of scent-marking, forest clearing, and supplemental feeding on moose–train collisions. J. Wildl. Manag. 2005, 69, 1125–1132. [Google Scholar] [CrossRef]
- Rea, R.V.; Child, K.N.; Aitken, D.A. YoutubeTM insights into moose-train interactions. Alces 2010, 46, 183–187. [Google Scholar]
- Popp, J.N.; Hamr, J.; Chan, C.; Mallory, F.F. Elk (Cervus elaphus) railway mortality in Ontario. Can. J. Zool. 2018, 96, 1066–1070. [Google Scholar] [CrossRef]
- Vandevelde, J.-C.; Penone, C. Ecological roles of railway verges in anthropogenic landscapes: A synthesis of five case studies in Northern France. In Railway Ecology; Borda-de-Água, L., Barrientos, R., Beja, P., Pereira, H.M., Eds.; Springer: Cham, Switzerland, 2017; pp. 261–276. [Google Scholar]
- van der Grift, E.A. Mammals and railroads: Impacts and management implications. Lutra 1999, 42, 77–98. [Google Scholar]
- Bertwistle, J. Description and analysis of vehicle and train collisions with wildlife in Jasper National Park, Alberta Canada, 1951–1999. In Proceedings of the 2001 International Conference on Ecology and Transportation, Keystone, CO, USA, 24–28 September 2001; Irwin, C.L., Garrett, P., McDermott, K.P., Eds.; Center for Transportation and the Environment, North Carolina State University: Raleigh, NC, USA, 2001; pp. 433–434. [Google Scholar]
- Dorsey, B.P. Factors Affecting Bear and Ungulate Mortalities along the Canadian Pacific Railroad through Banff and Yoho National Parks; Montana State University: Bozeman, MT, USA, 2011. [Google Scholar]
- Cserkesz, T.; Farkas, J. Annual trends in the number of wildlife-vehicle collisions on the main linear transport corridors (highway and railway) of Hungary. North-West J. Zool. 2015, 11, 41–50. [Google Scholar]
- Dasgupta, S.; Ghosh, A.K. Elephant–railway conflict in a biodiversity hotspot: Determinants and perceptions of the conflict in Northern West Bengal, India. Hum. Dimens. Wildl 2015, 20, 81–94. [Google Scholar] [CrossRef]
- Hamr, J.; Hall, M.; Popp, J.N. The impact of railway traffic on ungulates in Ontario, Canada. Alces. Submitted.
- Schwartz, C.; Bartley, C. Moose conference workshop, Anchorage, May 17 reducing incidental moose mortality: Considerations for management. Alces 1991, 27, 93–99. [Google Scholar]
- Waller, J.S.; Servheen, C. Effects of transportation infrastructure on grizzly bears in northwestern Montana. J. Wildl. Manag. 2005, 69, 985–1000. [Google Scholar] [CrossRef]
- Popp, J.N.; Toman, T.; Mallory, F.F.; Hamr, J. A century of elk restoration in eastern North America. Restor. Ecol. 2014, 22, 723–730. [Google Scholar] [CrossRef]
- Pollock, S.Z.; Nielsen, S.E.; St. Clair, C.C. A railway increases the abundance and accelerates the phenology of bear-attracting plants in a forested, mountain park. Ecosphere 2017, 8, e01985. [Google Scholar] [CrossRef]
- Chambers, B.K.; Legasy, K.; Bentley, C.V. Forest Plants of Central Ontario; Lone Pine Publishing: Vancouver, BC, Canada, 1996. [Google Scholar]
- Dobbyn, J.S. Atlas of the Mammals of Ontario; Federation of Ontario Naturalists: Toronto, ON, Canada, 1994. [Google Scholar]
- Wilson, P.J.; Grewal, S.K.; Mallory, F.F.; White, B.N. Genetic characterization of hybrid wolves across Ontario. J. Hered. 2009, 100, S80–S89. [Google Scholar] [CrossRef]
- Sudbury Ornithological Society. Bird Checklist, District of Sudbury, Ontario, Canada, 3rd ed.; Laurentian University Printing Press: Sudbury, ON, Canada, 2005. [Google Scholar]
- Donovan, V.M.; Popp, J.N. Linear corridors and predator movement dynamics in the Great Lakes Basin. In Biodiversity, Conservation and Environmental Management in the Great Lakes Basin; Freedman, E., Neuzil, M., Eds.; Routledge: New York, NY, USA, 2017. [Google Scholar]
- Dorsey, B.P.; Clevenger, A.; Rew, L.W. Relative risk and variables associated with bear and ungulate mortalities along a railroad in the Canadian Rocky Mountains. In Railway Ecology; Borda-de-Água, L., Barrientos, R., Beja, P., Pereira, H.M., Eds.; Springer: Cham, Switzerland, 2017; pp. 135–155. [Google Scholar]
- Barrientos, R.; Borda-de-Água, L.; Brum, P.; Beja, P.; Periera, H.M. What’s next? Railway ecology in the 21st century. In Railway Ecology; Borda-de-Água, L., Barrientos, R., Beja, P., Pereira, H.M., Eds.; Springer: Cham, Switzerland, 2017; pp. 313–318. [Google Scholar]
- Heerschap, A. Big Game Mortality by Trains: Cartier to White River, June 1981–June 1982; Unpublished Report of the Chapleau District; Ontario Conservation Officer Service: Chapleau, ON, Canada, 1982. [Google Scholar]
- Iosif, R. Railroad-associated mortality hot spots for a population of Romanian tortoise (Testudo hermanni boettgeri): A gravity model for railroad-segment analysis. Procedia Environ. Sci. 2012, 14, 123–131. [Google Scholar] [CrossRef]
- Wells, P.; Woods, J.G.; Bridgewater, G.; Morrison, H. Wildlife mortalities on railways: Monitoring methods and mitigation strategies. In Proceedings of the Third International Conference on Wildlife Ecology and Transportation, Missoula, MT, USA, 13–16 September 1999. [Google Scholar]
- Gangadharan, A.; Pollock, S.; Gilhooly, P.; Friesen, A.; Dorsey, B.; St. Clair, C.C. Grain spilled from moving trains create a substantial wildlife attractant in protected areas. Anim. Conserv. 2017, 20, 391–400. [Google Scholar] [CrossRef]


| Species | Spring | Summer | Fall | Winter |
|---|---|---|---|---|
| Black bear * | 6.5 | 14.3 | 3.0 | 0.0 |
| Bobcat | 0.5 | 0.0 | 0.0 | 0.0 |
| Deer | 1.5 | 6.8 | 0.0 | 0.0 |
| Elk | 3.5 | 1.1 | 4.2 | 0.5 |
| Groundhog | 1.0 | 0.0 | 0.0 | 0.0 |
| Snowshoe hare | 4.0 | 10.3 | 3.0 | 0.6 |
| Marten | 0.0 | 0.0 | 0.6 | 0.0 |
| Mink | 0.0 | 1.1 | 0.6 | 0.0 |
| Moose | 3.0 | 4.6 | 7.1 | 5.0 |
| Raccoon | 9.0 | 6.8 | 1.2 | 3.3 |
| Red fox | 10.0 | 5.7 | 5.9 | 5.0 |
| Wolf * | 13.5 | 41.1 | 43.3 | 27.8 |
| Total | 52.5 | 91.9 | 68.9 | 42.2 |
| Species | Spring | Summer | Fall | Winter |
|---|---|---|---|---|
| American crow | 9.0 | 6.3 | 0.0 | 3.0 |
| Blue jay | 5.0 | 4.0 | 16.0 | 35.0 |
| Common grackle | 0.5 | 0.6 | 0.0 | 0.0 |
| Common raven | 0.5 | 8.6 | 0.0 | 1.0 |
| Rock dove | 0.5 | 1.1 | 3.0 | 0.0 |
| Rose-breasted grosbeak | 0 | 0.6 | 0.0 | 0.0 |
| Ruffed grouse | 0.5 | 0.0 | 0.0 | 0.0 |
| Turkey vulture | 3.0 | 0.0 | 0.0 | 0.0 |
| Sandhill crane | 3.5 | 0.0 | 0.0 | 0.0 |
| Snow bunting | 1.5 | 0.0 | 0.0 | 2.5 |
| Total | 24.0 | 21.1 | 19.0 | 41.5 |
| Spring | Summer | Fall | Winter | |||||||||
|---|---|---|---|---|---|---|---|---|---|---|---|---|
| Species | Day | Night | n | Day | Night | n | Day | Night | n | Day | Night | n |
| Black bear | 85 | 15 | 13 | 62 | 38 | 26 | 20 | 80 | 5 | - | - | 0 |
| Bobcat | 0 | 100 | 1 | - | - | 0 | - | - | 0 | - | - | 0 |
| Deer | 100 | 0 | 3 | 0 | 100 | 12 | - | - | 0 | - | - | 0 |
| Elk | 86 | 14 | 7 | 0 | 100 | 2 | 86 | 14 | 7 | - | - | 0 |
| Groundhog | 100 | 0 | 2 | - | - | 0 | - | - | 0 | - | - | 0 |
| Snowshoe hare | 25 | 75 | 8 | 56 | 44 | 18 | 0 | 100 | 5 | 0 | 100 | 1 |
| Marten | - | - | 0 | - | - | 0 | 100 | 0 | 1 | - | - | 0 |
| Mink | - | - | 0 | 0 | 100 | 2 | 0 | 100 | 1 | - | - | 0 |
| Moose | 13 | 88 | 5 | 25 | 75 | 8 | 42 | 58 | 12 | 33 | 67 | 9 |
| Raccoon | 15 | 85 | 16 | 17 | 83 | 12 | 0 | 100 | 2 | 0 | 100 | 6 |
| Red fox | 15 | 85 | 20 | 13 | 88 | 8 | 20 | 80 | 10 | 0 | 100 | 9 |
| Wolf | 38 | 63 | 32 | 30 | 70 | 76 | 22 | 78 | 73 | 39 | 61 | 62 |
| Total n | 46 | 61 | 107 | 54 | 110 | 164 | 31 | 85 | 116 | 27 | 60 | 87 |
| Camera | Total Capture Events | Number of Species |
|---|---|---|
| 1 | 8 | 3 |
| 2 | 24 | 5 |
| 3 | 58 | 10 |
| 4 | 62 | 6 |
| 5 | 5 | 3 |
| 6 | 59 | 6 |
| 7 | 111 | 7 |
| 8 | 49 | 6 |
| 9 | 105 | 10 |
| 10 | 7 | 4 |
| Camera | Total Capture Events | Number of Species |
|---|---|---|
| 1 | 2 | 1 |
| 2 | 17 | 3 |
| 3 | 16 | 3 |
| 4 | 2 | 1 |
| 5 | 6 | 1 |
| 6 | 111 | 4 |
| 7 | 8 | 3 |
| 8 | 2 | 2 |
| 9 | 32 | 5 |
| 10 | 5 | 1 |
© 2018 by the authors. Licensee MDPI, Basel, Switzerland. This article is an open access article distributed under the terms and conditions of the Creative Commons Attribution (CC BY) license (http://creativecommons.org/licenses/by/4.0/).
Share and Cite
Popp, J.N.; Hamr, J. Seasonal Use of Railways by Wildlife. Diversity 2018, 10, 104. https://doi.org/10.3390/d10040104
Popp JN, Hamr J. Seasonal Use of Railways by Wildlife. Diversity. 2018; 10(4):104. https://doi.org/10.3390/d10040104
Chicago/Turabian StylePopp, Jesse N., and Josef Hamr. 2018. "Seasonal Use of Railways by Wildlife" Diversity 10, no. 4: 104. https://doi.org/10.3390/d10040104
APA StylePopp, J. N., & Hamr, J. (2018). Seasonal Use of Railways by Wildlife. Diversity, 10(4), 104. https://doi.org/10.3390/d10040104