Article

Predicting Extinction Risk for Data Deficient Bats

by
Jessica Nicole Welch
1,* and
Jeremy M. Beaulieu
2
1
Department of Ecology & Evolutionary Biology, University of Tennessee, Knoxville, TN 37996, USA
2
Department of Biological Sciences, University of Arkansas, Fayetteville, AR 72701, USA
*
Author to whom correspondence should be addressed.
Diversity 2018, 10(3), 63; https://doi.org/10.3390/d10030063
Submission received: 31 March 2018 / Revised: 11 July 2018 / Accepted: 11 July 2018 / Published: 13 July 2018
(This article belongs to the Special Issue Diversity and Conservation of Bats)

Abstract

:
Conservation biology aims to identify species most at risk of extinction and to understand factors that forecast species vulnerability. The International Union for Conservation of Nature (IUCN) Red List is a leading source for extinction risk data of species globally, however, many potentially at risk species are not assessed by the IUCN owing to inadequate data. Of the approximately 1150 bat species (Chiroptera) recognized by the IUCN, 17 percent are categorized as Data Deficient. Here, we show that large trait databases in combination with a comprehensive phylogeny can identify which traits are important for assessing extinction risk in bats. Using phylogenetic logistic regressions, we show that geographic range and island endemism are the strongest correlates of binary extinction risk. We also show that simulations using two models that trade-off between data complexity and data coverage provide similar estimates of extinction risk for species that have received a Red List assessment. We then use our model parameters to provide quantitative predictions of extinction risk for 60 species that have not received risk assessments by the IUCN. Our model suggests that at least 20 bat species should be treated as threatened by extinction. In combination with expert knowledge, our results can be used as a quick, first-pass prioritization for conservation action.

1. Introduction

Of 1150 species of bats recognized by the IUCN (International Union for Conservation of Nature) Red List of Threatened Species (hereafter, Red List), approximately 15 percent of bats (Chiroptera) are threatened by extinction [1]. The IUCN assigns species a category for extinction risk under prevailing circumstances according to population sizes, growth rates and fluctuations, number of mature individuals, and other quantitative measures that are often difficult to collect for bats [2]. Accordingly, 17 percent of bat species recognized by the IUCN have not received extinction risk assessments owing to insufficient knowledge of the relevant biology and threats, raising uncertainty regarding whether these species ought to be considered a priority for conservation [3].
This raises an important question: In the absence of data appropriate for IUCN extinction risk assessments, how can we identify species in need of conservation efforts? For bats, this seems critical given the need for rapid conservation decision-making, as they have a “slow” life history (e.g., low reproductive rates, long life spans, etc.) that limits population growth after perturbations [4]. A cautious approach would be to assume that all unassessed species are threatened with extinction, which would safeguard against species loss before data are available for formal assessments. It would also draw attention to the maximal extent to which bat biodiversity could be threatened with extinction in the future. For instance, if all unassessed bats were treated as threatened, over a quarter of bats recognized by the IUCN—more than 300 species—would be considered at risk of extinction. However, this approach offers no guidance for prioritizing conservation resources and could incur high costs, not just financially [5], but also politically [6], if many species are, in fact, not threatened.
One cost-effective procedure for prioritization is to apply a comparative approach that leverages existing data for species whose risk has been assessed [7]. There are clear correlations between species traits (such as morphology, diet, endemism, reproductive factors, etc.), and extinction risk in many major taxonomic groups [8,9,10,11], which indicates that if the same traits were measured for unassessed species, extinction risk could be estimated [12]. When viewed from an evolutionary perspective, extinction risk is non-randomly distributed across a phylogeny, which depicts genealogical relationships among sets of species [13]. Therefore, there is value in knowing the degree of relatedness of a species that lacks a formal assessment (i.e., the “data deficient” or “not evaluated” IUCN status categories) to any set of species with known extinction risk. This is due simply to the evolutionary process of inheritance—closely related species tend to have similar traits due to shared ancestry [14], and, therefore, morphological and ecological traits exhibited in one species are often expressed to a similar degree in their closest relatives. In our view, a predictive framework of extinction risk could benefit from encoding phylogenetic information so that not just traits, but also evolutionary history and relatedness, are capitalized.
Advances in phylogenetic methodology and access to large datasets of species traits have accelerated the use of comparative methods to address conservation questions. In fact, several studies have combined comprehensive phylogenies with trait databases for various taxonomic groups to predict extinction risk [15,16,17]. For example, Jones et al. (2003) assessed whether certain traits were correlated with Red List threat categories [18]. Just two traits, geographic range and aspect ratio (i.e., the relationship between wingspan and wing area), explained roughly 48 percent of the variation in bat extinction risk. Importantly, they found that extinction risk was distributed non-randomly among bat families, which underscores the utility of a phylogenetic-based approach, and they compared estimates of extinction risk to published Red List categories. These authors, however, did not apply their model for the purposes of estimating extinction risk in bats that lack formal assessment by the IUCN, leaving unclear the predictive value of their model for conservation applications.
Our research builds on the study of Jones et al. (2003) by reexamining correlates of bat extinction risk given a comprehensive, well-resolved phylogeny, and predicting the threat of extinction for unassessed species [18]. For our purposes, we develop two phylogenetically-based predictive models of extinction risk to illustrate trade-offs between model complexity and data availability. We use simulations to test the reliability of our models, and we then provide binary estimates of threat for species that are designated Data Deficient on the Red List or that have not been recognized by the IUCN (i.e., category Not Evaluated). Our results identify trait data that should be measured for all bats and demonstrate how data can be used to rapidly distinguish species that ought to be prioritized for immediate conservation actions.

2. Materials and Methods

2.1. Trait Data Collection

We began our study in 2014. GenBank [19] offers subspecies-level data irrespective to the presence of coupled species-level data and offers multiple data points for a species owing to more than one recognized taxonomic name. To ensure that only one species was represented in our analyses (i.e., to minimize repeated analyses of synonymous bats), we used Wilson & Reeder’s Mammal Species of the World v2005 (MSW05) [20], an update to MSW05 (Simmons & Cirranello 2014 unpublished dataset), and the Red List v3.1 (Table 1) [1] to match species names to data acquired through GenBank (detailed below). We refer to all bats using their MSW05 taxonomic names, and a list of our bat synonyms is provided in the Supplementary Materials (Supplementary Attachment).
We collected information for traits that are common correlates of extinction risk from the PanTHERIA database [21], the Jones et al. (2003) supplementary dataset [18], and the Red List v3.1 [1] (Table 1). We chose variables that were comparable to Jones et al. (2003) [18], or that provided coverage for at least 30 percent of the taxa on our tree. For example, we included diet breadth, which was not included in the study by Jones et al. (2003) [18]. All continuous variables were log-transformed prior to analyses described below.

2.2. Phylogenetic Tree Construction

We constructed our own phylogenetic tree, as opposed to relying on the popular supertree of bats [22], to ensure that our tree reflected the current state of knowledge in bat taxonomy as well as reflected the greatly improved species genetic sampling since 2003 that is currently represented in GenBank. We implemented the large phylogeny construction pipeline in the program phlawd [23]. The phlawd workflow first queries sequences from GenBank [19], compares the sequences to “known” gene segments of the taxa of interest and aligns the sequences based on the degree of relatedness depending on the degree of sequence saturation. We used five genes commonly sequenced for bats: One mitochondrial gene, CytB, two nuclear genes RAG2, Val, and two ribosomal genes, 12S, 16S [24,25,26]. The GenBank query returned 1024 taxonomic entries, and we removed entries with uncertain species identity or incomplete scientific names. We included Equus, Diceros, Rhinoceros, Manis, Canis, and Rusa as representative outgroups [27]. All five genes were concatenated into a single matrix, and a by-gene partitioned maximum likelihood analysis was conducted in RAxML, using the GTR + Γ model of nucleotide substitution [28]. Our maximum-likelihood tree included molecular branch lengths, which were subsequently smoothed to units of time in treePL [29] applying the same fossil calibration scheme as in Reference [30].
We eliminated synonymous species and subspecies to prune our tree to have only one representative “per species” for a total of 793 bats. However, 84 bats did not have trait data to use for analyses, though we retained them on illustrations of phylogeny to demonstrate missing data (Figure 1, Supplementary Attachment). There are 74 fewer bats than the analyses in Jones et al. (2003) because our phylogeny was limited to bats with data available through GenBank [18]. Following the convention of Reference [31], we maintain the division of Chiroptera into the major clades Yinpterochiroptera (Pteropodoidea + Rhinolophoidea) and Yangochiroptera (all other families) in our analyses, instead of Megabats and Microbats, respectively [22]. However, we note that our phylogenetic tree does show high support for this split.

2.3. Model Construction
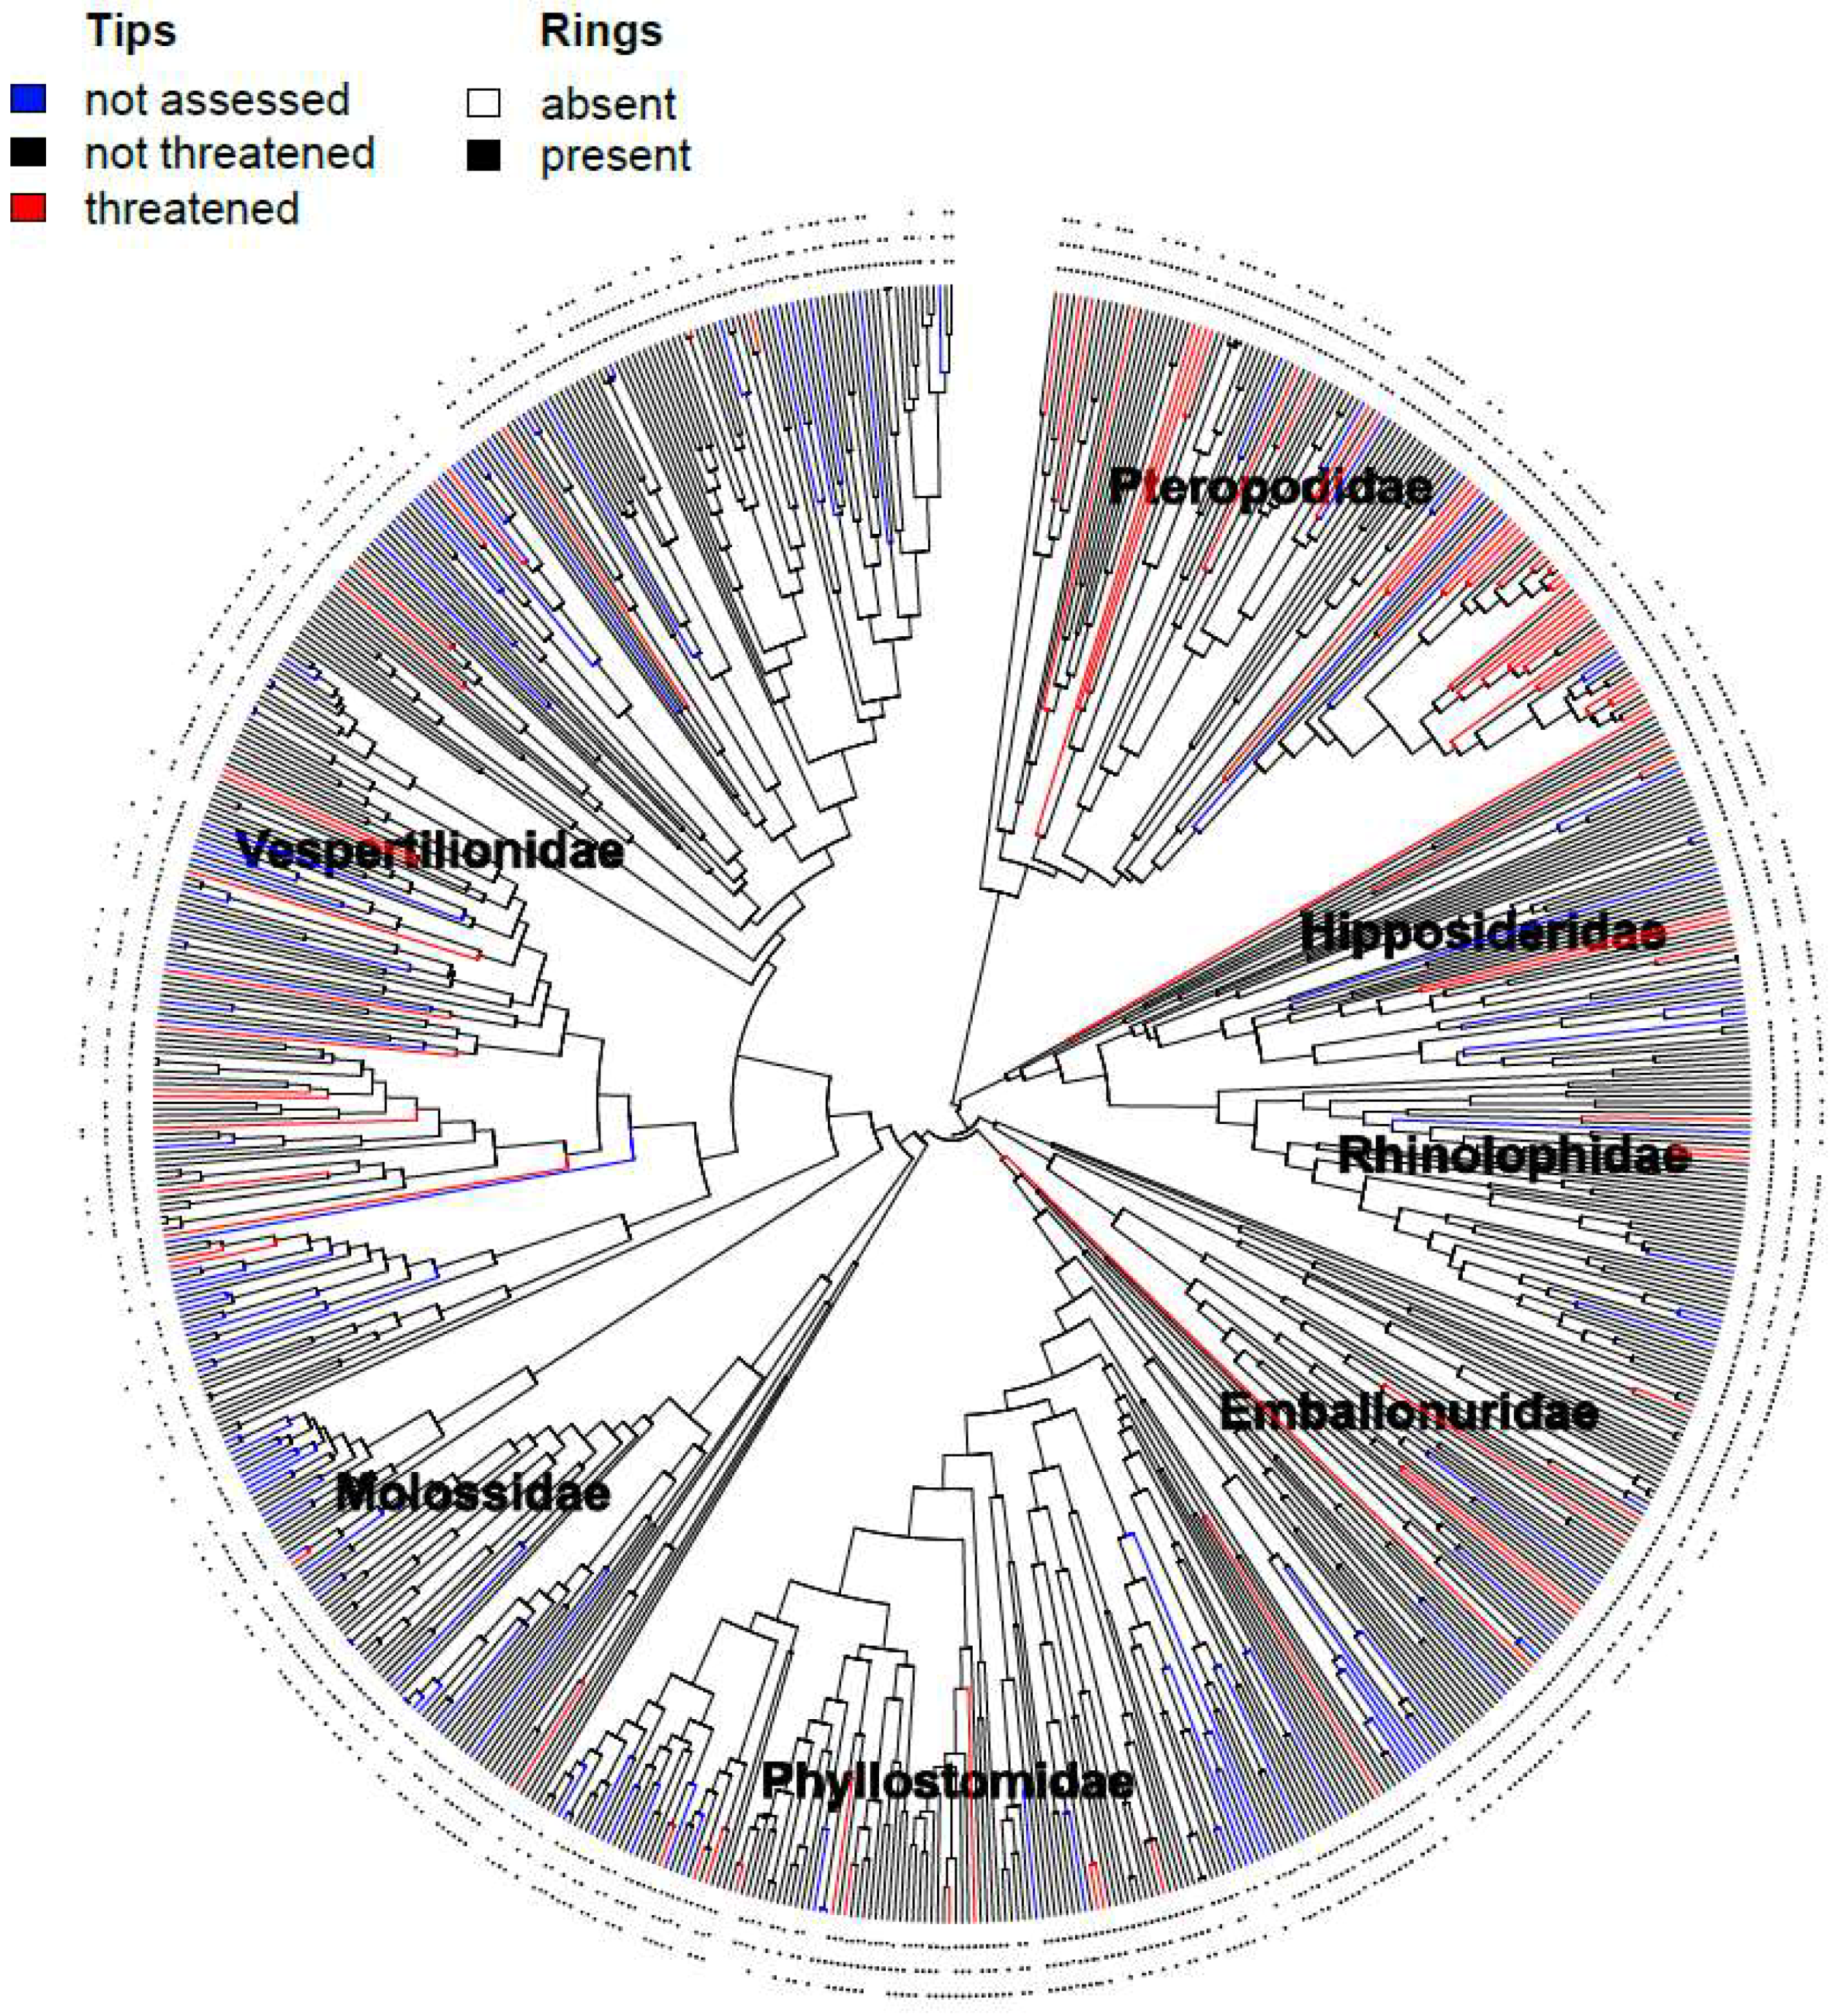
We treated extinction risk as binary, where 1 = threatened (i.e., Red List categories CR, EN, VU) and 0 = not threatened (i.e., NT, LC). Many authors, including Jones et al. 2003 [18], treat the Red List category as a continuous variable, but others contend that this is inappropriate because the threat level is not ranked evenly across Red List categories [32]. Species assigned either Red List category Data Deficient (DD) or Not Evaluated (NE) were considered as not having their extinction risk formally assessed by IUCN. For each trait, we performed regressions for bats as a whole, and separately for members of Yinpterochiroptera and Yangochiroptera.
Since our dependent variable was binary, we used a phylogenetic logistic regression [33] to first determine the individual correlates of extinction risk. These regression analyses were conducted using the “phyloglm” function in the R package phylolm to obtain estimates of phylogenetically-informed slope and intercept estimates, as well as estimates of the coefficient α, which is the overall transition rate between our two extinction risk designations [34]. The lower the transition rate the higher the degree of phylogenetic “signal” there is for extinction risk—that is, closely related species show greater trait similarity than more distantly related species. Given the total height of our tree, estimates of α that exceeded 0.98 indicated negligible phylogenetic signal for a variable [33], and species were treated as evolutionarily independent from one another for that variable. We note that the interpretation of signal is the exact opposite as other traditional measures of signal (e.g., References [35,36]), where 0 indicates no signal, with larger values denoting increasing signals. We report 1000 bootstrapped mean α and b estimates, p-value estimates using a Wald test, and R2 estimates using the Cox & Snell equation with the Nagelkerke correction. For the categorical variable trophic level, we also performed a chi-squared test to assess if extinction risk differed across trophic levels.
For geographic range, separate phylogenetic logistic regressions were conducted including and excluding 40 bat species that are categorized as threatened on the Red List based upon “Criteria B” alone (i.e., small geographic range size; Supplementary Attachment). This was to assess whether parameter estimates for geographic range are inflated given circularity of the predictor variable and a threatened status owing to Criteria B [15].
To determine a suitable, multivariate model to describe extinction risk in bats, we began by building models using only those variables identified as significant correlates of extinction risk. We refer to this model hereafter as the “predictor-rich” model, as it maximizes the number of predictor variables at the expense of species sampling. Note that we excluded adult forearm length from this particular model because it was strongly correlated with adult body mass (ρ = 0.87, p < 0.001). The Akaike Information Criterion (AIC) was used to determine the best predictor-rich model from a set of 12 models that included different combinations of predictors. However, nearly half of the bats on our tree have incomplete data for variables (Figure 1, Table S1), which excluded them from our models. Therefore, we built a second set of models using significant correlates of extinction risk that had wide coverage for the species included in our tree. We refer to the best fit model that maximizes species sampling at the expense of the number of predictor variables as the “taxon-rich” model hereafter because it has data coverage for the greatest number of bat species. Like with the predictor-rich model, AIC was used to select the best model from a set of 10 models.
To check the performance of our models in predicting extinction risk, we used the leave-one-out cross-validation procedure. This involved running our models on all but one species that have a Red List assessment, then using the parameter estimates of that model to estimate binary risk for the species that was excluded. We repeated this process 10,000 times for each species to account for the stochastic nature of the simulation. We then calculated the mean squared error (MSE) to establish how much our estimates of risk varied from risk provided by the IUCN.
We used the ML estimates of the slopes and intercepts to generate a prediction interval of extinction risk for species that have not received extinction risk assessments. Our procedure involved two main steps: (1) we used a jackknife approach, which re-estimated the model parameters after repeatedly removing 25% of the species chosen at random; (2) the re-estimated parameters were then used with the original trait data, to simulate extinction risk across the entire bat phylogeny, including species that are considered Data Deficient (DD) or Not Evaluated (NE) according to the Red List. This process was repeated 1000 times. The predicted average, median, and upper and lower quantile estimates of extinction risk were generated for each bat species and represented the proportion of times a particular species was simulated as having high risk. For both the predictor-rich and taxon-rich models, we ranked bats most at risk of extinction based upon the median estimate. Although the estimates are continuous, owing to summarizing a large set of simulated binary values, we considered a species to be threatened if its median estimate was greater than or equal to 0.50.

3. Results

3.1. Correlates of Extinction Risk

For Chiroptera as a whole, significant individual correlates of extinction risk were generally categorized according to the ecological and morphological size of the organism (e.g., larger body mass, larger diet breadth, and larger forearm length) and size of their range (e.g., small geographic range and island endemism) (Table 2). There was a significant difference in extinction risk across trophic levels (X2(2) = 7.483, p = 0.024), but it explained little variation (R2 = 3.9%). The strongest relationship, based on effect size, was with geographic range (R2 = 46.8%) followed by island endemism (R2 = 13.9%). It is worth noting that because island endemism and geographic range naturally covary (i.e., island endemics generally have small ranges), whether a species is an island endemic might not actually correlate well with extinction risk [18]. However, geographic range remains a significant correlate of extinction risk for both bats that are island endemic (b = −1.290, p < 0.001) and for those that are not (b = −2.289, p < 0.001). Overall, when examining the rate of transitions between the extinction risk categories across the phylogeny, indicated by α, all estimates are substantially smaller than 0.98, suggesting that risk is conserved across the phylogeny. This lends support for extinction risk exhibiting strong phylogenetic signal within bats.
When we examined the relationships within Yinpterochiroptera and Yangochiroptera separately, the two major clades recognized within Chiroptera, small geographic range and endemism were significant predictors of extinction risk for both clades (Table 2). For Yinpterochiroptera, variables associated with morphology (i.e., large mass and forearm length) and life history (i.e., wide diet breadth) were also important predictors of their extinction risk. Trophic level was not an important factor explaining extinction risk for either clade (Yin: (X2(2) = 3.475, p = 0.175), (α = 0.128, R2 = 1.5%); Yang: (X2(2) = 1.937, p = 0.474), (α = 0.577, R2 = 2.1%)). The strength of phylogenetic signal for extinction risk varies across traits and differs between clades, though largely follow the patterns observed across bats as a whole.
For Chiroptera as a whole, as well as within each major clade analyzed separately, geographic range is the strongest predictor of extinction risk even when “Criteria B species” are excluded (i.e., “range abbr.”, Table 2). The findings we report below are from analyses that included species categorized as threatened owing to Criteria B. Clade differences are probably accentuated when Criteria B species are excluded, as it removes about nine percent of Yinpterochiroptera bats from the dataset.

3.2. Models for Predicting Extinction Risk

The best fit predictor-rich model featured geographic range, body mass, diet breadth, trophic level, and island endemism as relevant variables (Table 3A, Table S2A). The second-best model according to AIC included an additional predictor (clade designation), but this did not substantially improve the fit to the data (ΔAIC < 2). The best fit model explained nearly half the variation in extinction risk with a sample size of 345 species (R2 = 49%). The very slow estimated rate of switching between high and low risk (α = 0.024) indicated that closely related species have very similar extinction risk designations, and thus risk exhibited strong phylogenetic signal. We report results from models that excluded species that are categorized as threatened on the Red List owing to Criteria B alone (i.e., small geographic range size) in the Supplementary Materials (Tables S3 and S4).
Owing to limited species trait data, extinction risk could not be estimated for most species in our phylogeny under the predictor-rich model, which led to us fitting a “taxon-rich” model. This resulted in a sample size of 649 species, 82 percent more bats than the predictor-rich model. The best-fit taxon-rich model indicated that geographic range, island endemism, clade (Yangochiroptera versus Yinpterochiroptera), and the interaction between geographic range and both island endemism and clade were the strongest predictors of extinction risk (Table 3B, Table S2B). The best fit taxon-rich model explained the same amount of variation as the best predictor-rich model (R2 = 48%) despite the taxon-rich model having fewer trait variables and exhibiting a strong phylogenetic signal in extinction risk (α = 0.018). We note that the second-best model, according to AIC, included a clade by endemic interaction, as opposed to a range by endemic interaction. However, for the remainder of the manuscript, we focus solely on the overall best taxon-rich model.

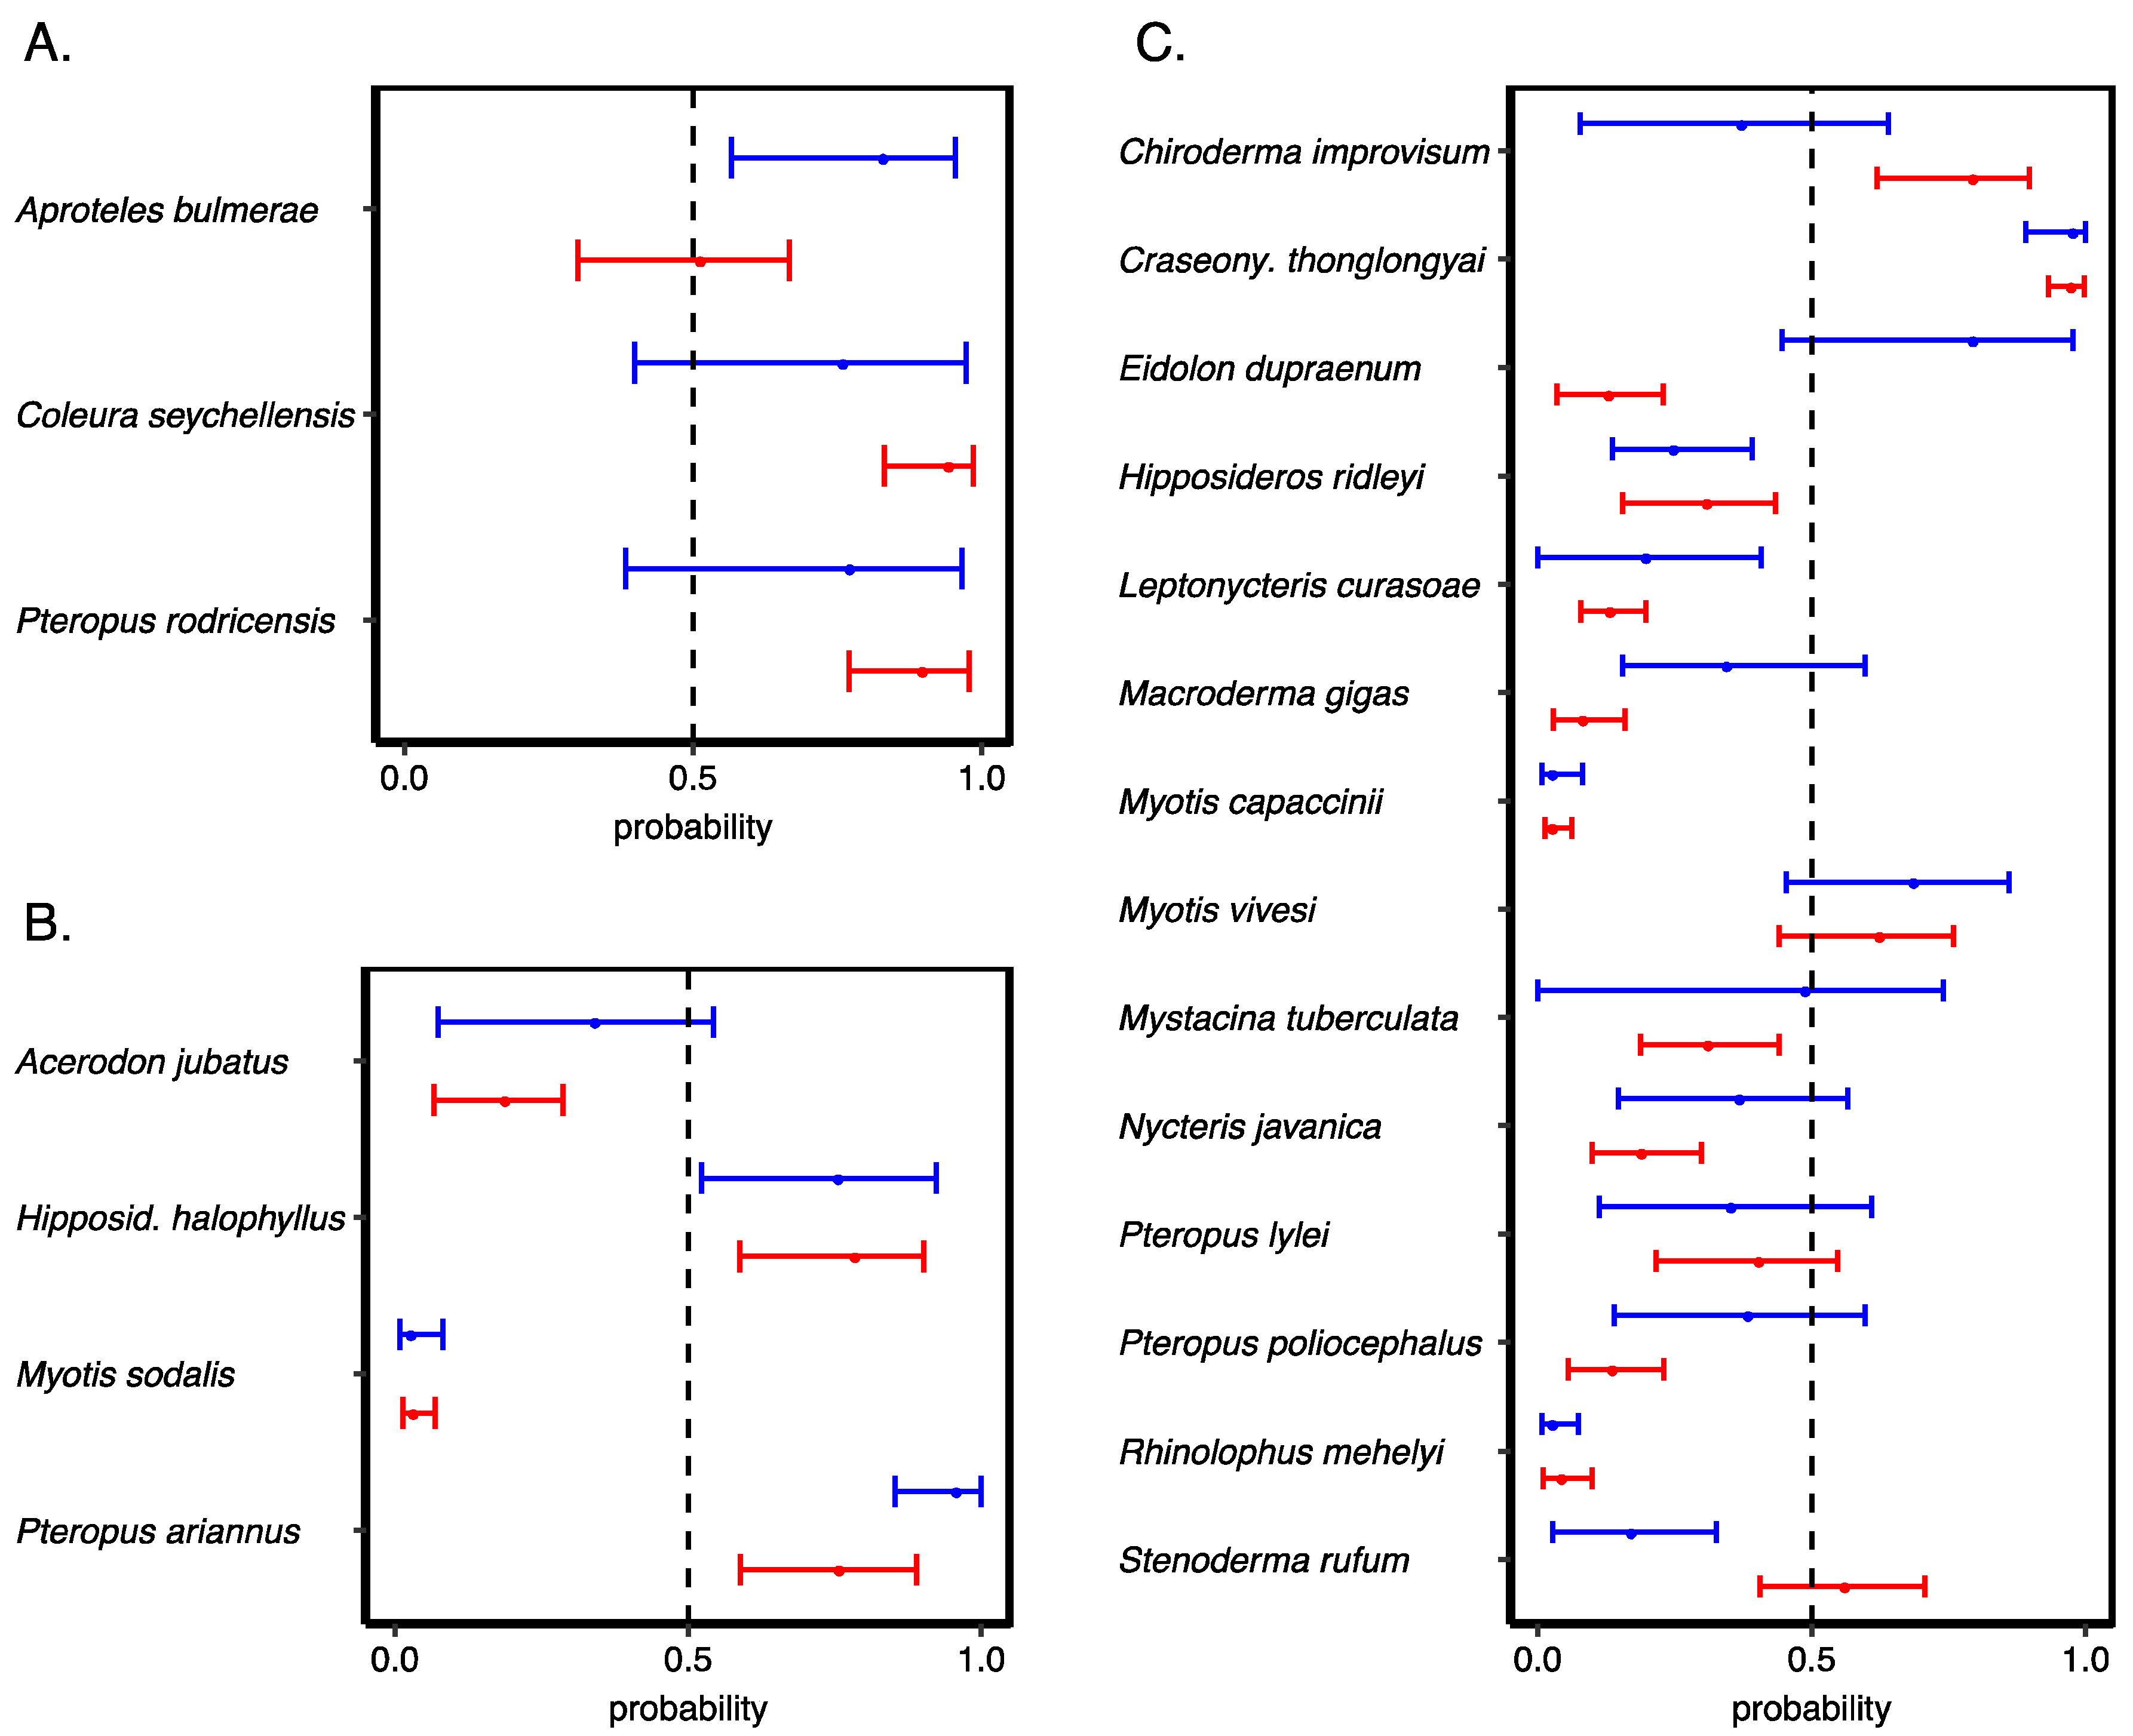
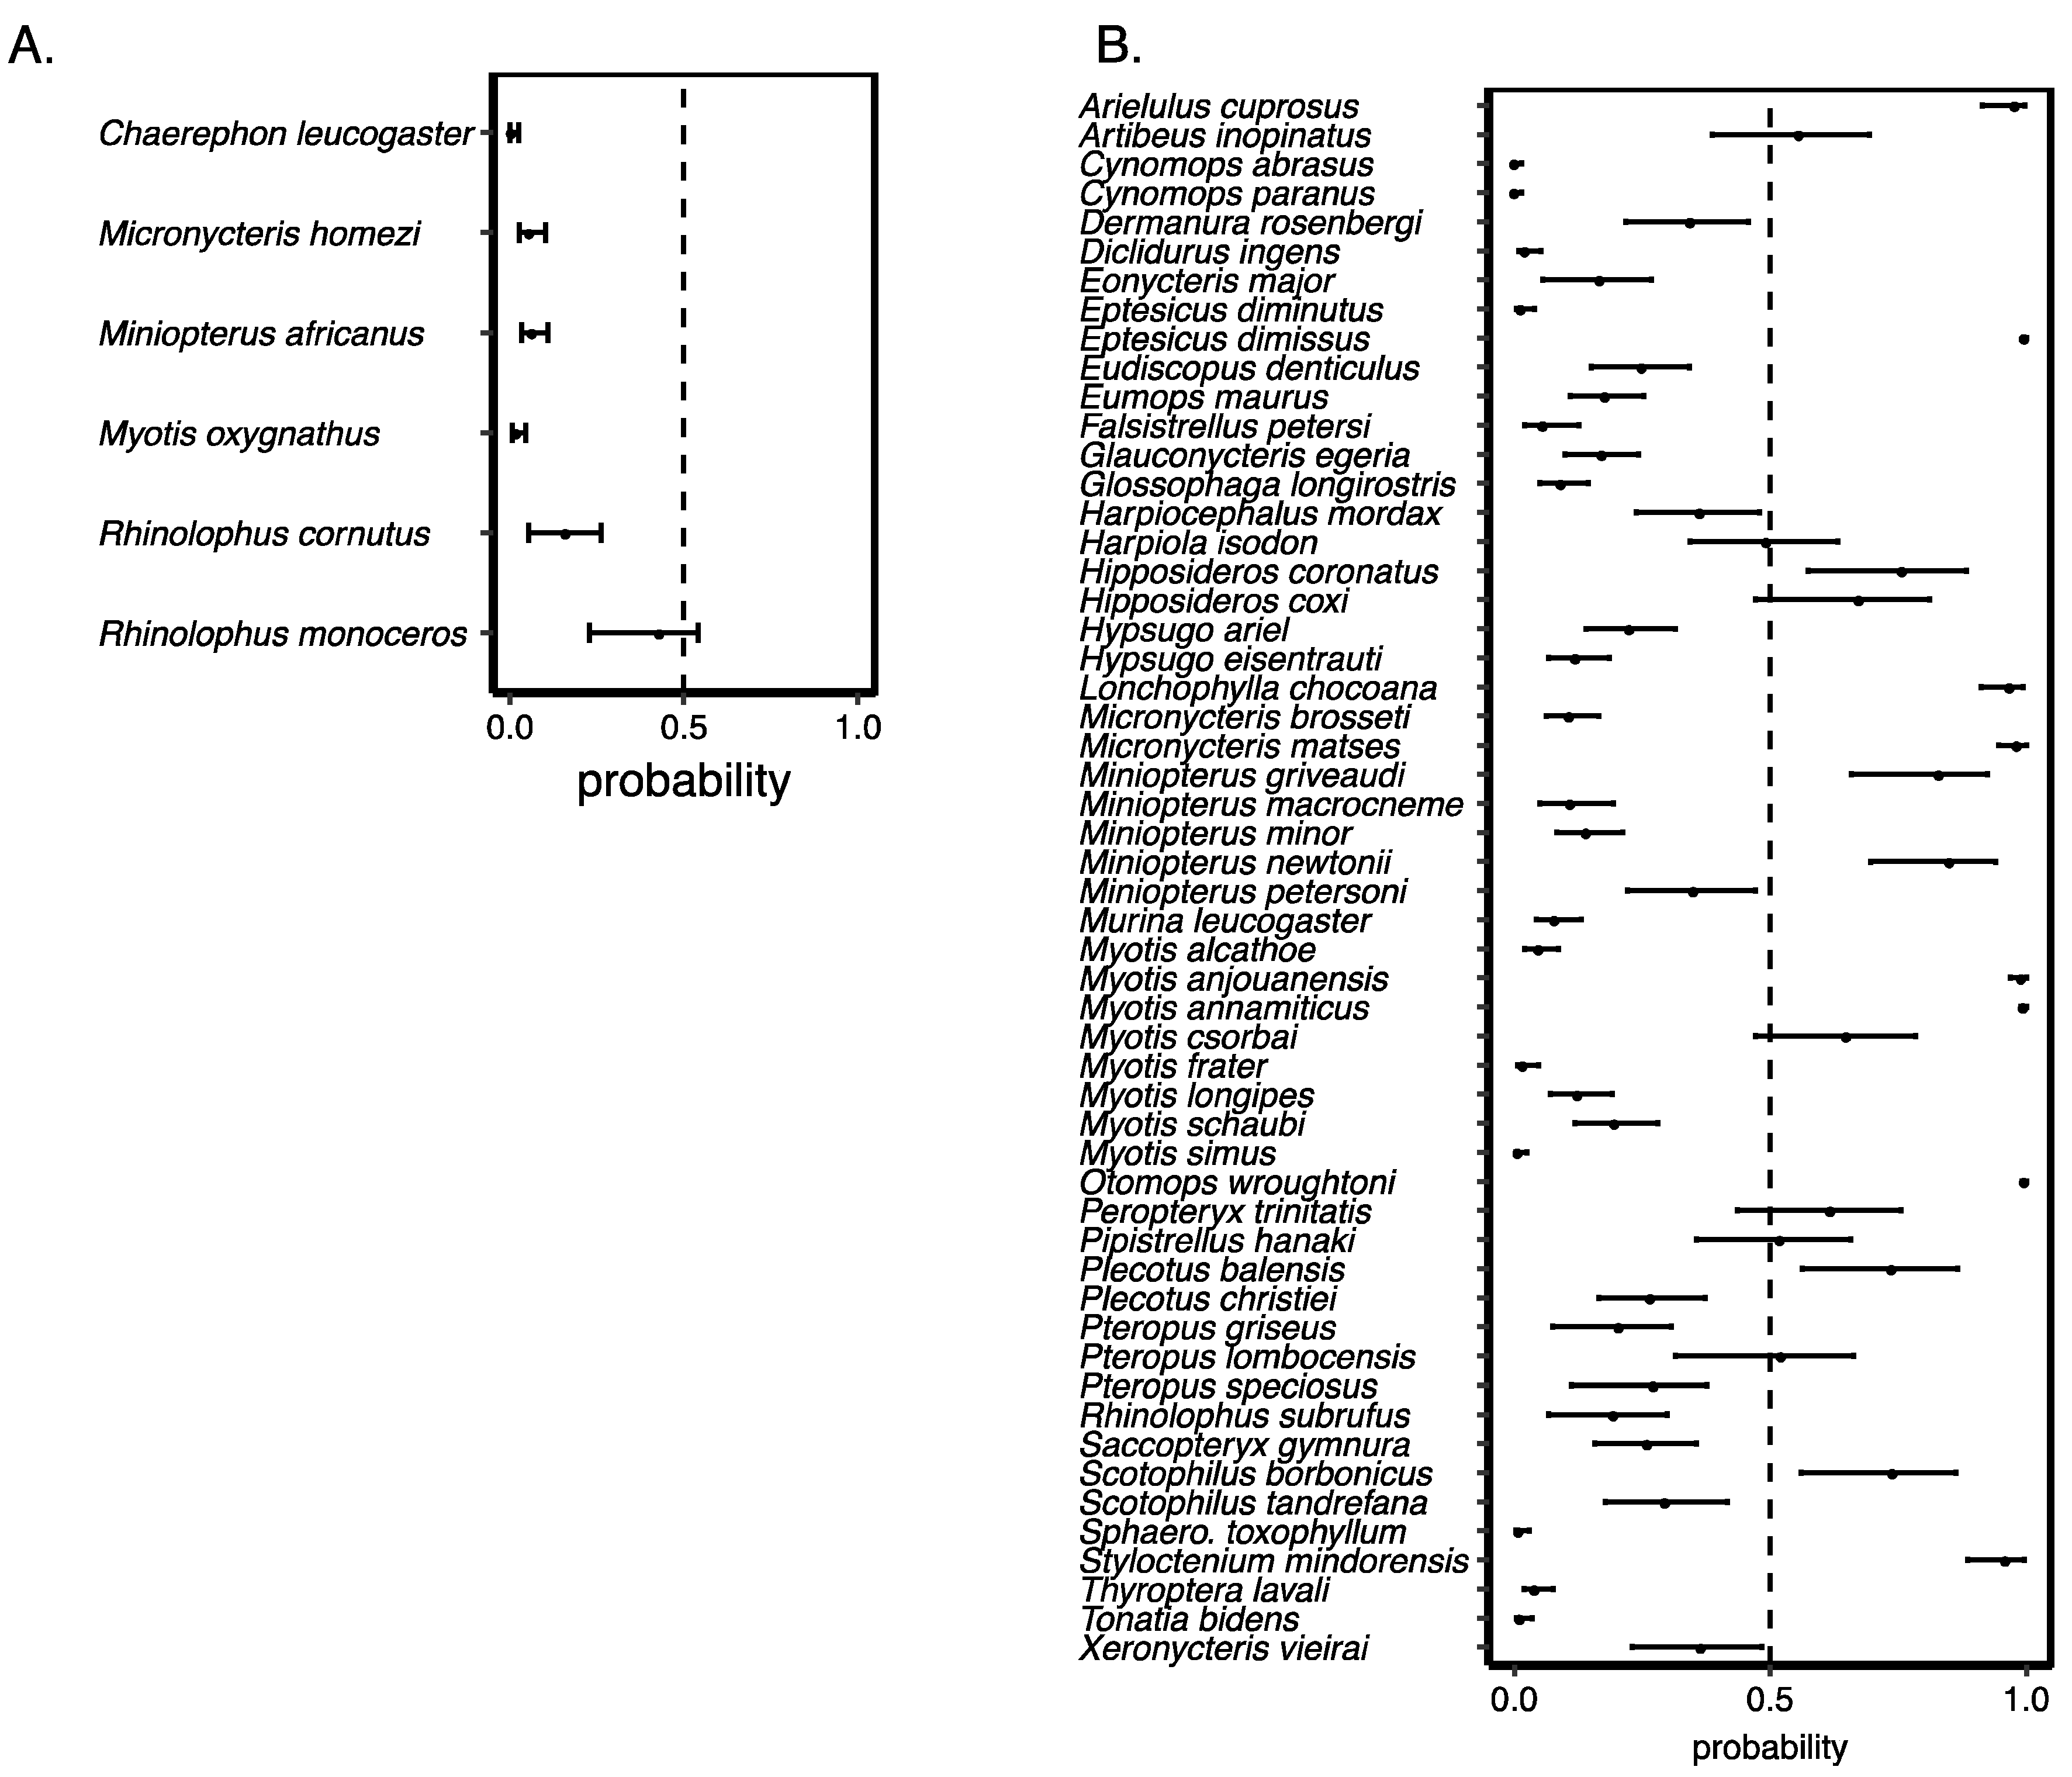
3.3. Validating Our Predictions of Extinction Risk

When estimating the extinction risk using the parameter estimates of the predictor-rich model, our measure strongly agreed with the threat statuses provided by the Red List (MSE = 0.061). Of the 345 species used in the simulation, two percent (eight bats) had overestimated extinction risk (i.e., species predicted to be threatened, but are not designated as threatened on the Red List) and four percent (13 bats) had underestimated extinction risk (i.e., species predicted not to be threatened, but are designated threatened on the Red List). The species that had underestimated risk were generally small bodied, had ranges greater than 20,000 km2, and were not considered island endemic.
The taxon-rich model prediction also strongly agreed with the threat statuses provided by the Red List (MSE = 0.092). Of the 649 species used for the taxon-rich model, four percent (29 bats) had overestimated extinction risk and five percent (31 bats) had underestimated extinction risk relative to the corresponding Red List designations. In the case of overestimated risk, three species had geographic ranges less than 20,000 km2, whereas all of the bats with underestimated risk had ranges greater than 20,000 km2 and most were not island endemics.

3.4. Species Most at Risk of Extinction

According to median estimates provided by our model simulation, the ten bat species most at risk of extinction, according to the predictor-rich model, included eight species already categorized as threatened on the Red List (Table 4A). Moreover, risk is especially high for Pteropodids, with six of the species belonging to this family. However, six prediction intervals overlap 0.5 (i.e., delineation of threatened versus not threatened), demonstrating the relatively high uncertainty of extinction risk.
Of the ten bat species most at risk of extinction, according to the predictions made by our taxon-rich model, four species are categorized as threatened on the Red List (in all cases, the prediction intervals excluded 0.5; Table 4B). The remaining six bat species are all Data Deficient. Four of these species are within the family Vespertilionidae, and another was the single representative of Craseonycteridae (Craseonycteris thonglongyai), which was also found in the top ten under the predictor-rich model.
Interestingly, the predicted extinction risk from the predictor-rich and taxon-rich models was highly congruent (Figure 2). Of the 351 species that had extinction risk simulated by both models, we identified only four percent (13 species) disagreement for estimated extinction risk. For eight of those species, the predictor-rich model concurred with the threat status given by the Red List, whereas the taxon-rich model did not. Conversely, the remaining five species had underestimated risk given the predictor-rich model, but the threat status given by the Red List concurred with the taxon-rich model.
For the 60 species without Red List assessments (i.e., either NE or DD), six bats had enough trait data to simulate extinction risk using the predictor-rich model, and, surprisingly all were predicted to be not threatened (Figure 3A). Sixty bats were analyzed using the taxon-rich model, for which roughly 33 percent (20 species) were predicted to be at risk of extinction (Figure 3B). Accordingly, at least 10 percent of all bats designated Data Deficient on the Red List (203 total DD) are estimated to be threatened by extinction.

4. Discussion

The precautionary principle compels conservation biologists to treat all species with unknown risk as if they were threatened by extinction [37]. However, limited conservation resources necessitate approaches that can estimate extinction risk with some certainty. Our results provide easily interpretable prediction intervals to assess extinction risk for 60 bat species not assessed by the IUCN. We suggest that species with prediction intervals above 0.5 (i.e., delineation of threatened versus not threatened) should be considered high priority for further study, and species with median values of risk above 0.5 but have overlapping prediction intervals should, at the very least, receive more research focus.
Our study demonstrates how phylogenetically-based, comparative methods can provide quick predictions of extinction risk. However, we caution that the estimates of extinction risk presented here should not be the sole source of information used to inform conservation decisions because the trait data available for DD and NE species is often incomplete. For example, the range of Eptesicus dimissus (ranked first on Table 4B) was reportedly very small at the time of data compilation [21], but new research suggests that the species occurs more widely [38], which might result in the species receiving a Least Concern category during future IUCN assessments. Moreover, we found that our models underestimated extinction risk more than they overestimated it, suggesting that some of these species are threatened owing to reasons not necessarily reflected in the traits we used. For instance, both models underestimated extinction risk for Myotis sodalis because the bat is small, eats only insects (i.e., narrow diet breadth), and has a wide range. The Red List, however, designated M. sodalis as threatened owing to reduced numbers of known populations [39].
We do note, however, that assessments of extinction risks for bats can be achieved with relatively few trait variables. Comparing simulations of risk between the predictor-rich (high complexity, but low species coverage) and taxon-rich (low complexity, but high species coverage) models, we identified only four percent (13 species) disagreement between estimates, indicating that the taxon-rich model serves as a surrogate model for predicting extinction risk in the case of limited data. Still, we were unable to consider about 30 percent of unassessed bats because we were not able to match them to a GenBank entry or they did not have geographic range data. Accordingly, we urge bat researchers to prioritize the collection of range data. It is important to emphasize that sequences currently deposited in GenBank reflect the collective effort of many different laboratory groups from around the world for use in a variety of purposes (e.g., genomics, systematics, barcoding, etc.). While these efforts have succeeded in providing a fairly well-sampled phylogeny of bats at random, future sequencing efforts should, perhaps, specifically target the remaining bat species missing sequence data entirely.
With respect to the strongest predictors of risk, similar to the study of Jones et al. (2003) [18], as well as others [40], geographic range size had the greatest effect size of all the variables we examined. After accounting for its interaction with island endemism, geographic range remained a significant predictor for bats overall and for Yinpterochiroptera specifically. Approximately 25 percent of bats are island endemics, and the family Pteropodidae (a member of Yinpterochiroptera) has a higher proportion of island endemic species than other bat families [41]. A small range size is already a consideration of the IUCN when assessing extinction risk, and our results reiterate the significance of range size by using it to estimate extinction risk of data deficient species. Contrary to Jones et al. [18] and Safi and Kerth [42], we did not find aspect ratio to be a significant predictor of extinction risk in bats overall or within clades, although the relationship showed a similar trend. Bats with low aspect ratio generally are considered habitat specialists and poor dispersers [43], making them susceptible to habitat loss. Our results might differ from previous studies because we had smaller sample sizes, or because previous studies have relied on the same, poorly resolved phylogenetic tree to conduct their analyses.
The central aim of conservation biology is to understand factors that forecast species vulnerability and identify species most at risk of extinction. Here, we combined contemporary data and an evolutionary approach to identify species of conservation concern. This method could be readily applied to other taxa that contain large proportions of data deficient species. While phylogenetic comparative methods provide important windows into the past, they can also provide insights into the future trajectories of species, which is paramount to conservation. Indeed, our modeling approach can be used as a quick, first-pass prioritization for conservation action, and can enhance Red List assessments when only expert knowledge is available, or, importantly, when funding resources are limited.

Supplementary Materials

The following are available online at https://www.mdpi.com/1424-2818/10/3/63/s1: Attachment. Extinction risk estimates spreadsheet; Table S1: Sample sizes, Table S2: Ranks for phylogenetic logistic regression models while including “Criteria B” bats, Table S3: Predictor-rich model results while excluding “Criteria B” bats; Table S4. Taxon-rich model results while excluding “Criteria B” bats

Author Contributions

All authors contributed equally to this manuscript.

Funding

Funding was provided by Bat Conservation International, the Department of Ecology and Evolutionary Biology, and the endowment of the Nancy Gore Hunger Professorship in Environmental Studies at the University of Tennessee.

Acknowledgments

The authors thank Nancy Simmons for an unpublished dataset and Sara Kuebbing and Dan Simberloff for comments on the manuscript. We also appreciate the constructive feedback from three anonymous reviewers, and to James Fordyce for general statistical advice during the revision stage.

Conflicts of Interest

The authors declare no conflict of interest.

References

  1. The IUCN Red List of Threatened Species, Version 2013. Available online: iucnredlist.org (accessed on 26 March 2013).
  2. Hutson, A.M.; Mickleburgh, S.P.; Racey, P.A. Microchiropteran Bats: Global Status Survey Conservation Action Plan; IUCN/SSC Chiroptera Specialist Group: Gland, Switzerland; Cambridge, UK, 2001; 258p. [Google Scholar]
  3. IUCN Standards Petitions Subcommittee. Guidelines for Using the IUCN Red List Categories and Criteria; Version 11; IUCN: Gland, Switzerland, 2014; 87p. [Google Scholar]
  4. Racey, P.A.; Entwistle, E.C. Conservation ecology of bats. In Bat Ecology; Kunz, T.H., Fenton, M.B., Eds.; University of Chicago Press: Chicago, IL, USA, 2005; pp. 680–743. [Google Scholar]
  5. Juffe-Bignoli, D.; Brooks, T.M.; Butchart, S.H.; Jenkins, R.B.; Boe, K.; Hoffmann, M.; Angulo, A.; Bachman, S.; Böhm, M.; Brummitt, N.; et al. Assessing the cost of global biodiversity and conservation knowledge. PLoS ONE 2016, 11, e0160640. [Google Scholar] [CrossRef] [PubMed]
  6. Campbell, L.M. Seeing red: Inside the science and politics of the IUCN Red List. Conserv. Soc. 2012, 10, 367. [Google Scholar] [CrossRef]
  7. Jetz, W.; Freckleton, R.P. Towards a general framework for predicting threat status of data-deficient species from phylogenetic, spatial and environmental information. Philos. Trans. R. Soc. B 2015, 370, 20140016. [Google Scholar] [CrossRef] [PubMed]
  8. Jeppsson, T.; Forslund, P. Species’ traits explain differences in Red list status and long-term population trends in longhorn beetles. Anim. Conserv. 2014, 17, 332–341. [Google Scholar] [CrossRef]
  9. Olah, G.; Butchart, S.H.; Symes, A.; Guzmán, I.M.; Cunningham, R.; Brightsmith, D.J.; Heinsohn, R. Ecological and socio-economic factors affecting extinction risk in parrots. Biodivers. Conserv. 2016, 25, 205–223. [Google Scholar] [CrossRef]
  10. Davidson, A.D.; Hamilton, M.J.; Boyer, A.G.; Brown, J.H.; Ceballos, G. Multiple ecological pathways to extinction in mammals. Proc. Natl. Acad. Sci. USA 2009, 106, 10702–10705. [Google Scholar] [CrossRef] [PubMed] [Green Version]
  11. Böhm, M.; Williams, R.; Bramhall, H.R.; McMillan, K.M.; Davidson, A.D.; Garcia, A.; Bland, L.M.; Bielby, J.; Collen, B. Correlates of extinction risk in squamate reptiles: The relative importance of biology, geography, threat and range size. Glob. Ecol. Biogeogr. 2016, 25, 391–405. [Google Scholar] [CrossRef]
  12. Garland, T.J.; Ives, A.R. Using the past to predict the present: Confidence intervals for regression equations in phylogenetic comparative methods. Am. Nat. 2000, 155, 346–364. [Google Scholar] [CrossRef] [PubMed]
  13. Purvis, A.; Agapow, P.M.; Gittleman, J.L.; Mace, G.M. Nonrandom extinction and the loss of evolutionary history. Science 2000, 288, 328–330. [Google Scholar] [CrossRef] [PubMed]
  14. Felsenstein, J. Phylogenies and the comparative method. Am. Nat. 1985, 125, 1–15. [Google Scholar] [CrossRef]
  15. Purvis, A.; Gittleman, J.L.; Cowlishaw, G.; Mace, G.M. Predicting extinction risk in declining species. Proc. R. Soc. B Biol. Sci. 2000, 267, 1947–1952. [Google Scholar] [CrossRef] [PubMed] [Green Version]
  16. Cardillo, M.; Purvis, A.; Sechrest, W.; Gittleman, J.L.; Bielby, J.; Mace, G.M. Human population density and extinction risk in the world’s carnivores. PLoS Biol. 2004, 2, e197. [Google Scholar] [CrossRef] [PubMed] [Green Version]
  17. Cardillo, M.; Mace, G.M.; Jones, K.E.; Bielby, J.; Bininda-Emonds, O.R.; Sechrest, W.; Orme, C.D.; Purvis, A. Multiple causes of high extinction risk in large mammal species. Science 2005, 309, 1239–1241. [Google Scholar] [CrossRef] [PubMed]
  18. Jones, K.E.; Purvis, A.; Gittleman, J.L. Biological correlates of extinction risk in bats. Am. Nat. 2003, 161, 601–614. [Google Scholar] [CrossRef] [PubMed]
  19. Simmons, N.B. Order Chiroptera. In Mammal Species of the World, 3rd ed.; Wilson, D.E., Reeder, D.M., Eds.; The John Hopkins University Press: Baltimore, MD, USA, 2005; Volume 1, pp. 312–529. [Google Scholar]
  20. Benson, D.A.; Clark, K.; Karsch-Mizrachi, I.; Lipman, D.J.; Ostell, J.; Sayers, E.W. GenBank. Nucleic Acids Res. 2015, 43, D30–D35. [Google Scholar] [CrossRef] [PubMed]
  21. Jones, K.E.; Bielby, J.; Cardillo, M.; Fritz, S.A.; O’Dell, J.; Orme, C.D.L.; Safi, K.; Sechrest, W.; Boakes, E.H.; Carbone, C.; et al. PanTHERIA: A species-level database of life history, ecology, and geography of extant and recently extinct mammals. Ecology 2009, 90, 2648. [Google Scholar] [CrossRef]
  22. Jones, K.E.; Purvis, A.; Maclarnon, A.N.N.; Bininda-Emonds, O.R.; Simmons, N.B. A phylogenetic supertree of the bats (Mammalia: Chiroptera). Biol. Rev. 2002, 77, 223–259. [Google Scholar] [CrossRef] [PubMed]
  23. Smith, S.A.; Beaulieu, J.M.; Donoghue, M.J. Mega-phylogeny approach for comparative biology: An alternative to supertree and supermatrix approaches. BMC Evolut. Biol. 2009, 9, 37. [Google Scholar] [CrossRef] [PubMed]
  24. Teeling, E.C.; Springer, M.S.; Madsen, O.; Bates, P.; O’Brien, S.J.; Murphy, W.J. A molecular phylogeny for bats illuminates biogeography and the fossil record. Science 2005, 307, 580–584. [Google Scholar] [CrossRef] [PubMed]
  25. Almeida, F.C.; Giannini, N.P.; DeSalle, R.; Simmons, N.B. Evolutionary relationships of the old world fruit bats (Chiroptera, Pteropodidae): Another star phylogeny? BMC Evolut. Biol. 2011, 11, 281. [Google Scholar] [CrossRef] [PubMed]
  26. Ruedi, M.; Stadelmann, B.; Gager, Y.; Douzery, E.J.; Francis, C.M.; Lin, L.K.; Guillén-Servent, A.; Cibois, A. Molecular phylogenetic reconstructions identify East Asia as the cradle for the evolution of the cosmopolitan genus Myotis (Mammalia, Chiroptera). Mol. Phylogenet. Evol. 2013, 69, 437–449. [Google Scholar] [CrossRef] [PubMed]
  27. Agnarsson, I.; Zambrana-Torrelio, C.M.; Flores-Saldana, N.P.; May-Collado, L.J. A time-calibrated species-level phylogeny of bats (Chiroptera, Mammalia). PLoS Curr. 2011, 3. [Google Scholar] [CrossRef] [PubMed]
  28. Stamatakis, A. RAxML-VI-HPC: Maximum likelihood-based phylogenetic analyses with thousands of taxa and mixed models. Bioinformatics 2006, 22, 2688–2690. [Google Scholar] [CrossRef] [PubMed]
  29. Smith, S.A.; O’Meara, B.C. treePL: Divergence time estimation using penalized likelihood for large phylogenies. Bioinformatics 2012, 28, 2689–2690. [Google Scholar] [CrossRef] [PubMed]
  30. Shi, J.J.; Rabosky, D.L. Speciation dynamics during the global radiation of extant bats. Evolution 2015, 69, 1528–1545. [Google Scholar] [CrossRef] [PubMed]
  31. Springer, M.S.; Teeling, E.C.; Madsen, O.; Stanhope, M.J.; de Jong, W.W. Integrated fossil and molecular data reconstruct bat echolocation. Proc. Natl. Acad. Sci. USA 2001, 98, 6241–6246. [Google Scholar] [CrossRef] [PubMed] [Green Version]
  32. Boyles, J.G.; Storm, J.J. The perils of picky eating: Dietary breadth is related to extinction risk in insectivorous bats. PLoS ONE 2007, 2, e672. [Google Scholar] [CrossRef] [PubMed]
  33. Ives, A.R.; Garland, T.J. Phylogenetic logistic regression for binary dependent variables. Syst. Biol. 2009, 59, 9–26. [Google Scholar] [CrossRef] [PubMed]
  34. Tung Ho, L.S.; Ané, C. A linear-time algorithm for Gaussian and non-Gaussian trait evolution models. Syst. Biol. 2014, 63, 397–408. [Google Scholar] [CrossRef] [PubMed]
  35. Freckleton, R.P.; Harvey, P.H.; Pagel, M. Phylogenetic analysis and comparative data: A test and review of evidence. Am. Nat. 2002, 160, 712–726. [Google Scholar] [CrossRef] [PubMed]
  36. Blomberg, S.P.; Garland, T.J.; Ives, A.R. Testing for phylogenetic signal in comparative data: Behavioral traits are more labile. Evolution 2003, 57, 717–745. [Google Scholar] [CrossRef] [PubMed]
  37. Cooney, R. The Precautionary Principle in Biodiversity Conservation and Natural Resource Management: An Issues Paper for Policy-Makers, Researchers and Practitioners; IUCN Policy and Global Change Series No. 2; IUCN: Gland, Switzerland; Cambridge, UK, 2004; 51p. [Google Scholar]
  38. Ruedi, M.; Eger, J.L.; Lim, B.K.; Csorba, G. A new genus and species of vespertilionid bat from the Indomalayan Region. J. Mammal. 2017, 99, 209–222. [Google Scholar] [CrossRef] [PubMed] [Green Version]
  39. Arroyo-Cabrales, J.; Álvarez-Castañeda, S.T.; Myotis, S. The IUCN Red List of Threatened Species; IUCN: Gland, Switzerland, 2008. [Google Scholar] [CrossRef]
  40. Fisher, D.O.; Owens, I.P. The comparative method in conservation biology. TREE 2004, 19, 391–398. [Google Scholar] [PubMed]
  41. Jones, K.E.; Mickleburgh, S.P.; Sechrest, W.; Walsh, A.L. Global overview of the conservation of island bats: Importance, challenges and opportunities. In Island Bats: Evolution, Ecology, and Conservation; Fleming, T.H., Racey, P.A., Eds.; University of Chicago Press: Chicago, IL, USA, 2009; pp. 496–530. [Google Scholar]
  42. Safi, K.; Kerth, G. A comparative analysis of specialization and extinction risk in temperate-zone bats. Conserv. Biol. 2004, 18, 1293–1303. [Google Scholar] [CrossRef] [Green Version]
  43. Norberg, U.M.; Rayner, J.M. Ecological morphology and flight in bats (Mammalia; Chiroptera): Wing adaptations, flight performance, foraging strategy and echolocation. Philos. Trans. R. Soc. B 1987, 316, 335–427. [Google Scholar] [CrossRef]
Figure 1. The dated phylogenetic tree of bats (excluding the outgroup) based on five genes available through GenBank (see main text). Several bat families are highlighted. The color of the tree tips represents a species’ IUCN binary risk assessment. Data availability is shown by the rings surrounding the tips, which represent individual species, and refer to the following variables (starting at the inner-most ring): 1 = range and endemism, 2 = body mass, 3 = diet breadth and trophic level.
Diversity 10 00063 g001
Figure 2. Comparison of 95% prediction intervals given extinction risk estimates of the predictor-rich (blue) and taxon-rich (red) model simulations. The prediction interval is based on summarizing 1000 simulations of extinction risk using our phylogenetic logistic regression model. A species was considered threatened if its median proportion of times it simulated to have high risk was greater than or equal to 0.50. Prediction intervals that overlap 0.5, demonstrate uncertainty of threat status given the model. IUCN Red List designations as follows: (A) Critically Endangered (CR), (B) Endangered (EN), (C). Vulnerable (VU).
Diversity 10 00063 g002
Figure 3. Estimated species threat given extinction risk estimates of the taxon-rich model simulations. 95% prediction intervals are shown. A species was considered threatened if its median estimate was greater than or equal to 0.50. Prediction intervals that overlap 0.5, demonstrate uncertainty of threat status given the model. (A) Species designate Not Evaluated (NE), and (B) species designated Data Deficient (DD) on the Red List.
Diversity 10 00063 g003
Table 1. Summary of data sources used in a global phylogenetic assessment of extinction risk for bat species (Chiroptera).
VariableDefinitionSource
aspect ratiocontinuous: wingspan squared divided by wing areaJones et al., 2003
endemismbinary: observed (endemic) only on islands, excluding AustraliaIUCN Red List 3
forearm length (mm)continuous: adults, total length from elbow to wrist; measures of central tendencyPanTHERIA 1
diet breadthdiscrete: number of dietary categories eaten; measures of central tendency; categories defined as vertebrate, invertebrate, fruit, flowers/nectar/pollen, leaves/branches/bark, seeds, grass, and roots/tubers; maximum observed = 4PanTHERIA 1
litter sizecontinuous: number of offspring born per littler per female; measures of central tendencyPanTHERIA 1
litters per yearcontinuous: number of litters; central tendencyPanTHERIA 1
mass (g)continuous: adult body mass, excluding pregnant females; measures of central tendencyPanTHERIA 1
nucleotide sequencesCytB, Rag2, Val, 12S, 16SGenBank
range (km2)continuous: total extent of a species geographic range area from Sechrest 2003 2PanTHERIA 1
threat categorybinary: 1 = Critically Endangered (CR), Endangered (EN), Vulnerable (VU), 0 = Near Threatened (NT), Least Concern (LC); NA = Data Deficient (DD), Not Evaluated (NE)IUCN Red List 3
trophic levelcategorical: measures of central tendency; categories defined as 0 = herbivore, 1 = omnivore, 2 = carnivorePanTHERIA 1
wing loadingcontinuous: body mass times gravity acceleration divided by wing areaJones et al., 2003
1 Using the “MSW05” dataset of [21]. 2 Sechrest, W. 2003. Global diversity, endemism and conservation of mammals. University of Virginia, Charlottesville, Virginia, USA. 3 Categories and Criteria 3.1.
Table 2. Results of phylogenetic logistic regressions on single predictors and interactions to identify important correlates of extinction risk in bats. Results for the categorical variable trophic level is reported in the main text. The variable “geo range abbr.” excludes bats listed at threaten owing to Criteria B alone. The parameter α represents the phylogenetic correlation parameter, where values near 0 indicate strong phylogenetic signal and values approaching 0.98 indicates very weak phylogenetic signal based on the root age of our tree. Regression coefficients (b) are bolded for variables significant at p ≤ 0.05 according to a Wald test. P(1) represents the probability of odds of increasing threat with a unit increase in the variable. R2 values are estimated by the Cox & Snell equation with the Nagelkerke correction.
VariablesAll BatsYinpterochiropteraYangochiroptera
αbP(1)R2αbP(1)R2αbP(1)R2
aspect ratio0.084−8.0890.0000.0580.281−7.3790.0010.0170.148−7.7930.0000.051
diet breadth0.5470.6000.6460.0370.5090.8810.7070.1040.5570.4010.5990.010
endemism0.0991.6430.8380.1390.1331.0350.7380.0670.2431.9420.8750.138
forearm length0.1603.9020.9800.0540.2464.6950.9910.0950.678−2.3530.0870.005
litter size0.082−23.6570.0000.0500.592−10.6640.0000.0100.404−4.7550.0090.052
litters per year0.240−9.7020.0000.0620.502−10.5110.0000.1410.448−2.5910.0700.050
mass0.2661.5740.8280.0740.5171.4610.8120.1530.345−0.0110.4970.000
range0.020−1.4620.1880.4680.138−1.2840.2170.4050.028−1.7740.1450.527
range abbr.0.021−1.1090.2480.2640.032−0.9030.2880.2210.039−1.2700.2190.261
wing loading0.336−0.5840.3580.0010.293−0.3940.403−0.0030.413−0.8810.2930.002
range × endemism0.0190.9640.7240.4930.0521.0170.7340.4690.0290.5500.6340.537
range × mass0.0200.1290.5320.3730.0310.0850.5210.3960.033−0.7590.3190.340
mass × endemism0.056−0.0660.4840.1230.5390.9020.7110.1880.3541.3190.7890.120
Table 3. Details of the best-fit models. Regression coefficients (b) are bolded for variables significant at p ≤ 0.05 according to a Wald test. A. The predictor-rich model (n = 345). B. The taxon-rich model (n = 649).
A. 
A. 
Variableb
range−2.292
mass0.546
diet breadth1.499
trophic level (omnivore)−2.131
trophic level (carnivore)0.817
endemism−7.516
range × endemism1.196
B. 
B. 
Variableb
range−1.875
endemism−5.463
clade1.346
range × endemism0.956
range × clade−0.345
Table 4. Information for the top ten species at risk of extinction according to simulations. 95% prediction intervals are shown. The median estimate is bold if it is above 0.5 (i.e., a threatened prediction), and bold and italic if the lower estimate is above 0.5. A. Predictor-rich model. B. Taxon-rich model.
A. 
A. 
RankFamilySpeciesIUCN StatusLower
Estimate
Median EstimateUpper Estimate
1CraseonycteridaeCraseonycteris thonglongyaiVU0.8910.9811.000
2PteropodidaePteropus mariannusEN0.8530.9611.000
3PteropodidaeAproteles bulmeraeCR0.5660.8330.953
4PteropodidaeEidolon dupreanumVU0.4450.7980.977
5PteropodidaePteropus conspicillatusLC0.5390.7950.950
6PteropodidaePteropus rodricensisCR0.3830.7750.965
7EmballonuridaeColeura seychellensisCR0.3990.7640.973
8HipposideridaeHipposideros halophyllusEN0.5230.7600.922
9VespertilionidaeMyotis vivesiVU0.4530.6900.860
10PteropodidaePteropus dasymallusNT0.0000.6550.934
B. 
B. 
RankFamilySpeciesIUCN StatusLower
Estimate
Median EstimateUpper Estimate
1VespertilionidaeEptesicus dimissusDD0.9961.0001.000
2MolossidaeOtomops wroughtoniDD0.9921.0001.000
3VespertilionidaeMyotis annamiticusDD0.9900.9981.000
4PhyllostomidaeArtibeus incomitatusCR0.9630.9961.000
5VespertilionidaeMyotis anjouanensisDD0.9690.9941.000
6PteropodidaeLatidens salimaliiEN0.9490.9861.000
7PhyllostomidaeMicronycteris matsesDD0.9460.9861.000
8VespertilionidaeArielulus cuprosusDD0.9140.9810.998
9CraseonycteridaeCraseonycteris thonglongyaiVU0.9320.9770.998
10PteropodidaePteropus voeltzkowiVU0.9320.9770.998

