Abstract
The kelp, Undaria pinnatifida, is a popular traditional food in the Republic of Korea. Here, we examine the quantitative traits in three cultivars of this kelp, namely ‘Kamaishi’, ‘Kijang’, and ‘Myeongecheon’. These cultivars are adapted for growth in the Goheung area, Jeollanamdo, Republic of Korea. Growth parameters are assessed monthly at the Myeongcheon and Gyedo aquafarms between January and May 2003. Five environmental conditions and two traits are analyzed in terms of growth patterns, relationships among traits, genotype (cultivar) × environment (aquafarm) interactions, and the principal components of these interactions. Descriptive (scatter plots) and inferential (correlation and regression) analyses reveal that the genotype × environment interaction is quantitative. Principal component analysis (PCA) reveals that the first principal component explains around 83% and 77% of total sample variance in the Myeongcheon and Gyedo aquafarms, respectively. When economically valuable traits are considered, cultivar growth rates are highest at the Gyedo aquafarm and the performance of ‘Kamaishi’ is superior to the other cultivars.
1. Introduction
In the northwestern Pacific Ocean, three species of the brown algal genus Undaria are endemic to China, Japan, and Republic of Korea [1,2]. Four species of Undaria grow in the Republic of Korea: U. peterseniana (the southern coastal area around Jeju island), U. pinnatifida, U. pinnatifida f. distans, and U. pinnatifida f. typica (all in the southwestern coastal area around Wando island) [3,4]. Members of Undaria are consumed by both abalones and humans. Indeed, they represent one of the largest phyco-cultivation industries in China, Japan, and the Republic of Korea. Studies conducted on Undaria in the Republic of Korea have focused on cultivation [5,6,7,8], morphological variations [9,10,11], and the growth of juvenile sporophytes in culture [12], amongst other issues. However, the breeding of Undaria species in the Republic of Korea has not hitherto been investigated in detail. From the perspective of ecological breeding, which focuses on the adaptation of a particular cultivar to a specific region, it is important to consider morphological, ecological, physiological, biochemical, and genetic characteristics of local cultivars or ecotypes. When defining breeding objectives, it is necessary to emphasize breeding strategies and tactics, as well as advance a plan for rational breeding management. By doing so, growers will have access to basic information enabling them to select the best cultivar for their region or production objective, including the specific conditions appropriate for cultivation. Ecological morphology, or ‘ecomorphology’, is the study of the relationships between the morphology of an organism and its environment [13]. One of the central paradigms in this field is a focus on organismal performance as a crucial link between phenotype and ecology [14]. The size and shape of morphological characters are rarely constant within a species; although some characteristics typically exhibit low levels of phenotypic variation, others vary extensively among individuals from different populations or among individuals from different generations [15]. Phenotypic differences between groups sampled from contrasting habitats might be due to genetic differences or purely environmental effects on individuals. For a given genotype, a phenotypic alteration, caused by a change in the environment arises as a result of phenotypic plasticity, which can involve a response that is both adaptive, i.e., norm of reaction [16], and nonadaptive, i.e., noisy plasticity [17].
The aim of this study was to investigate variability in the main morphological traits of three Korean U. pinnatifida cultivars and the environmental factors that determine this variability in two representative aquafarms with high productivity of kelp as a food in Jeollanamdo, Republic of Korea.
2. Materials and Methods
Two aquafarms were the study sites for this research: Myeongcheon and Gyedo in the Goheung area of Jellanamdo, Republic of Korea (Figure 1). Samples (‘Kamaishi’, ‘Kijang’, and ‘Myeongcheon’) were taken from the Myeongcheon aquafarm and cultivated at the Myeongcheon and Gyedo aquafarms. In the late spring of 2002, mature sporophylls were collected from three cultivars of Undaria pinnatifida: ‘Kamaishi’, ‘Kijang’, and ‘Myeongcheon’. Samples were taken from their corresponding cultivation ropes at the Myeongchon and Gyedo aquafarm. On 4 June 2002, in vitro, seeding was performed for 20–30 min (water temperature = 17 °C, specific gravity of water = l.0261, and light intensity ≈ 500 lux). Controlled culture conditions were then maintained at the Myeongcheon aquafarm (water temperature between 17.6 and 26.0 °C, specific gravity of water between 1.0227 and 1.0261, and light intensity between 300 and 500 lux) In vivo, provisional outplanting began on 5 October 2002, when the water temperature was 21.5 °C and the specific gravity of water was 1.0220. Seed collectors were cultivated in the open sea, where sporelings were allowed to grow to about 2–3 cm long. The 3–4-cm seeded strings were inserted at 30-cm intervals into intermediate slender ropes and the ropes were wound around the main cultivation ropes at a depth of 1 m. Regular cultivation was initiated in January 2003, when the water temperature was 11.0 °C and the specific gravity of water was 1.0240.
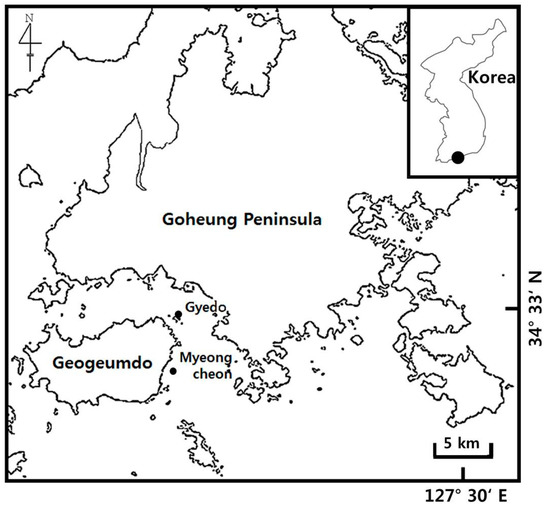
Figure 1.
Map showing cultivation sites at Gyedo and Myeongcheon.
From 3 January to 13 May 2003, monthly measurements were made of the blade length (BL) and blade weight (BW) of these three cultivars. The water was sampled using a 1.8-L portable midlayer water sampler incorporating a thermometer (Model 1920-H60-0896; Wildlife Supply Company, Yulee, FL, USA). These samples were then analyzed in the laboratory to determine the ratios of nitrite to nitrogen (NO2-N) using the N-(1-Naphthyl)-ethylenediamine dihydrochloride method [18]; nitrate to nitrogen (NO3-N) via cadmium-copper reduction [19]; ammonia-nitrogen (NH4-N) using phenolhypochlorite [20]; and phosphate to phosphorus (PO4-P) using the ascorbic acid method [21]. Seawater temperature (Temp), salinity (Sal), speed of current, total nitrogen (TN), total phosphorus (TP), and the level of suspended particulate matter (SPM) at each aquafarm were all recorded in each month of kelp cultivation (Table 1). These measurements facilitated examination of growth patterns, relationships between quantitative traits (BL and BW), and genotype (cultivar) × environment (aquafarm) (G × E) interactions. They also yielded data for a principal component analysis (PCA) carried out using the vegan package version 1.6.9 in R (Free Software Foundation, Boston, MA, USA) to explore the effects of monthly character changes in U. pinnatifida. Finally, the Multivariate Statistical Package (MVSP, Kouvach Computing Service, Anglesey, Wales, UK) was used to conduct group-level PCA.

Table 1.
Measurements of seawater temperature (Temp), salinity (Sal), total nitrogen (TN), total phosphorus (TP), and suspended particulate matter (SPM) at Myeongcheon (M) and Gyedo (G) aquafarms between January and May 2003.
3. Results and Discussion
With the exception of January, Temp and Sal at the two aquafarms were nearly identical every month (Table 1). Monthly TN, TP, and SPM values were almost identical between the two aquafarms. Figure 2 shows the BL and BW for the three cultivars at both aquafarms between January and May 2003. The lowest median BL, as well as the lowest variability in BL (defined as the interquartile range), was observed in the ‘Myeongcheon’ cultivar sampled from the Myeongcheon aquafarm in January. The distribution of BL at this location for this cultivar in January was unimodal, slightly right-skewed, but nearly symmetrical for the middle 50% of values.
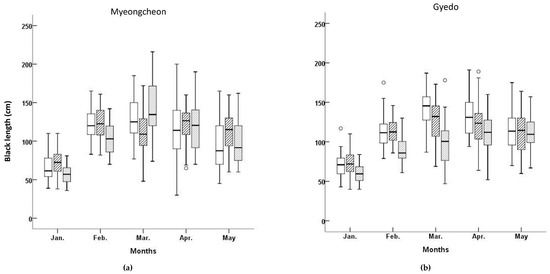
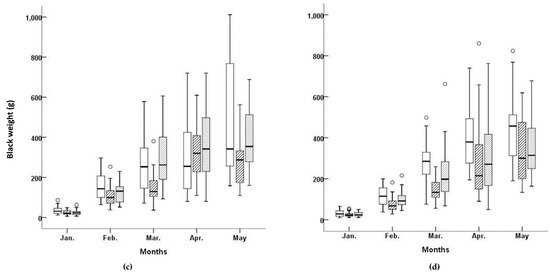
Figure 2.
Box plots of blade lengths and blade weights for three Undaria pinnatifida cultivars at Myeongcheon and Gyedo aquafarms between January and May 2003. □, ‘Kamaishi’ cultivar; ▨, ‘Kijang’ cultivar; ▓, ‘Myeongcheon’ cultivar.
The lowest BW value at Myeongcheon was observed for ‘Kijang’, although one outlier was present (Figure 2). The variability in BW was lower in this cultivar compared to the others, and the median was skewed to under the interquartile range. The BW distribution in March was therefore unimodal for this cultivar, slightly skewed to the right, and exhibited low variability. The means, medians, standard deviations, standard errors, coefficients of variation, and maximum and minimum values for each cultivar in each aquafarm are listed in Table 2. ‘Kijang’ had the longest mean BL at 107.75 cm in the Myeongcheon aquafarm, whereas ‘Kamaishi’ exhibited the longest mean BL at 113.67 cm in Gyedo. ‘Myeongcheon’ had the highest mean BW at 224.09 g in the Myeongcheon aquafarm, whereas ‘Kamaishi’ exhibited the highest mean BW at 224.49 g in Gyedo. Comparing across the cultivars and aquafarms revealed that ‘Kamaishi’ grown at Gyedo performed best for both traits.
Table 2.
Mean, median, standard deviation (SD), standard error (SE), coefficient of variation (CV), maximum (Max), and minimum (Min) values of blade lengths (BL), and blade widths (BW) for three cultivars of U. pinnatifida at Myeongcheon (M) and Gyedo (G) aquafarms between January and May 2003.
Daily relative growth rates in terms of BL and BW are reported in Table 3. At the Myeongcheon aquafarm between May and June, the daily relative growth rates of BL were 0.0028 for ‘Kamaishi’, 0.0020 for ‘Kijang’, and 0.0039 for ‘Myeongcheon’. For BW these values were 0.0192 for ‘Kamaishi’, 0.0201 for ‘Kijang’, and 0.0039 for ‘Myeongcheon’. At the Gyedo aquafarm between May and June, the daily relative growth rates of BL were 0.0022 for ‘Kamaishi’, 0.0019 for ‘Kijang’, and 0.0035 for ‘Myeongcheon’. For BW these values were 0.0215 for ‘Kamaishi’, 0.0216 for ‘Kijang’, and 0.0218 for ‘Myeongcheon’. At both aquafarms, ‘Myeongcheon’ exhibited the fastest increases in BL, while ‘Kijang’ exhibited the slowest. Daily relative BW growth rate was also highest for ‘Myeongcheon’ at both aquafarms, while ‘Kamaishi’ exhibited the slowest rate. Negative BL and BW values indicate tissue erosion, causing blades to lose length and mass over time; such erosion, which occurred early for ‘Kijang’ at Myeongcheon.
Table 3.
Daily relative growth rates of blade lengths (BL) and blade weights (BW) for three cultivars of U. pinnatifida at Myeongcheon (M) and Gyedo (G) aquafarms between January and May 2003.
The relationship between BL and BW is presented in Figure 3 and Table 4. A high and moderate correlation was found between these two traits for ‘Myeongcheon’ and ‘Kamaishi’, respectively, at Gyedo (r = 0.752 and r = 0.639, respectively). The greater the increase in BL for a given increase in BW, the greater the adaptation and appropriateness of a particular cultivar to a particular site. Across all cultivars at both aquafarms, the slope of the regression line (i.e., the response of blade length to changes in blade width) was steepest for ‘Myeongcheon’ at Gyedo with a 1 unit increase in blade weight (i.e., x) being associated with a 0.126 unit increase in blade length (i.e., y).
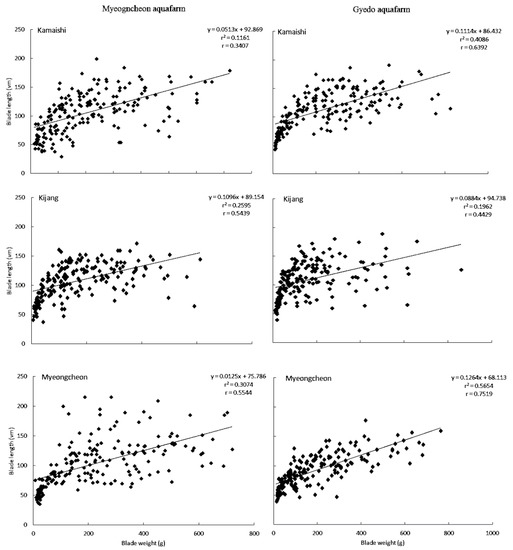
Figure 3.
Relationships between blade weights and blade lengths of three U. pinnatifida cultivars at Myeongcheon and Gyedo aquafarms between January and May 2003.
Table 4.
Analysis of variance between blade lengths and blade weights of three U. pinnatifida cultivars at Myeongcheon (M) and Gyedo (G) aquafarms between January and May 2003.
G × E interactions represent phenotypic differences caused by different genotypes responding to the same environmental parameters in different ways, or by the same genotype producing variable phenotypes in different environments [22,23]. These interactions can be used to estimate the influence of genetic variation on phenotypic plasticity. Where a G × E interaction is demonstrated using two different environments, this relationship can also suggest that the values for a given trait (or character) expressed in the different environments (henceforth, “character states”, or rG) are genetically independent. That is, if there is no significant G × E, then there is complete genetic dependence between the rG values obtained from each environment. Furthermore, if there is not at least a partial genetic independence for rG in the different environments, it would be evident as a non-significant interaction effect [17]. Figure 4 illustrates the genetic variation in plasticity for traits in two ways: (1) G × E (cultivar × aquafarm) interaction plots; and (2) scatter plots which illustrate the data from which cross-environment genetic correlations between rG can be estimated. In the left-hand panels, each line corresponds to the mean phenotype exhibited by the three cultivars at each aquafarm; that is, a graphically-simple reaction norm. The slopes of these lines therefore indicate the extent of phenotypic plasticity for each genotype. The performance of the three cultivars in the two environments suggested that G × E interaction was due entirely to a change in scale, and lacked a reversal of genotype ranks, or quantitative G × E. Likewise, the data in Table 5 did not reveal any significant G × E. In the right-hand panels of Figure 4, the magnitude of the cross-environment genetic correlation for a given value of the G × E interaction was presented i.e., the values for the interactions between the three cultivars and the two environments. For these analyses, when rG = ±1, the genetic variation required for a change in the current level of phenotypic plasticity is 0; when 0 < rG < 1, the required variation is intermediate, and when rG = 0, the required variation is high. Compared with Gyedo, the Myeongcheon aquafarm exhibited a better fit for increases in BL and BW in ‘Mycheongcheon’, whereas these traits did not differ greatly between the two aquafarms for the other two cultivars. The rG values for ‘Myeongcheon’ were >0 and <1, meaning that the magnitude of the G × E interaction varied between the aquafarms. The Mycheongcheon aquafarm appeared to be associated with a more optimal level of phenotypic plasticity compared to the Gyedo aquafarm.
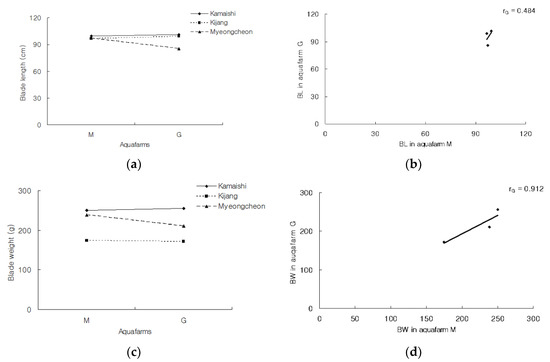
Figure 4.
Genetic variation in the plasticity of blade lengths and blade weights plotted in two ways for three cultivars of U. pinnatifida at Myeongcheon (M) and Gyedo (G) aquafarms between January and May 2003. Left: Genotype × Environment interaction plots. Right: Scatter plots from which cross–environment genetic correlations between character states (rG) can be estimated.
Table 5.
Analysis of variance in phenotypic plasticity measurements—blade length (BL) and blade width (BW)—from three U. pinnatifida cultivars at Myeongcheon and Gyedo aquafarms between January and May 2003.
PCA-generated eigenvalues and loading factors for the data collected in 2003 are shown in Table 6. The eigenvalues of the first principal components at Myeongcheon and Gyedo were 9.120 and 8.456, respectively, which explained 82.9% and 76.9% of the total sample variance. Thus, sample variation was captured very well by the first principal component, and a reduction in data from 11 variables to one principal component was considered reasonable.
Table 6.
Eigenvalues and loading factors from a PCA based on three U. pinnatifida cultivars at Myeongcheon and Gyedo aquafarms between January and May 2003.
The principal component scores for the morphological and habitat characteristics of U. pinnatifida are plotted in Figure 5. For both Myeongcheon and Gyedo, BL was located in the second quadrant, while BW, Temp, and SPM were situated in the third quadrant. For Myeongcheon, Sal and TP were located in the first quadrant, while TN was found in the fourth quadrant. By contrast, for Gyedo, Sal remained in the first quadrant, but both TP and TN were situated in the fourth quadrant.
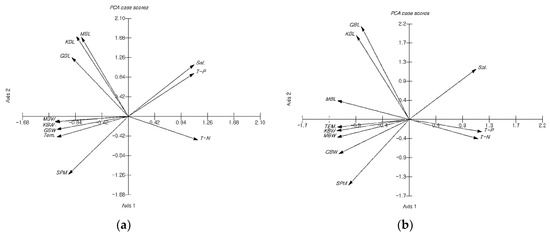
Figure 5.
Plots of principal component scores for morphological and habitat characteristics of U. pinnatifida between January and May 2003. (A) Myeongcheon aquafarm; (B) Gyedo aquafarm. Abbreviations: KBL, Blade length of ‘Kamaishi’; KBW, Blade weight of ‘Kamaishi’; GBL, Blade length of ‘Kijang’; GBW, Blade weight of ‘Kijang’; MBL, Blade length of ‘Myeongcheon’; MBW, Blade weight of ‘Myeongcheon’.
For both aquafarms, two groups can be identified along Axis 1: BL-relevant and BW-relevant. Two additional groups were present along Axis 2: morphological trait-relevant and morphological trait-free. For Myeongcheon, Axis 1 revealed that BL tended to correlate with Sal and TP, whereas Axis 2 indicated that BW tended to be associated with Temp and SPM. For Gyedo, Axis 1 showed that BL tended to be associated with Sal, while Axis 2 indicated that BW tended to be associated with Temp and SPM. It has hitherto been reported that the northern and southern genotypes of U. pinnatipida have maintained the genetic characteristics of their origin fronds, despite generations of cultivation in the Naruto Strait [24]. In contrast, most other studies have reported that the different morphs of these species result from phenotypic plasticity to environmental conditions, such as a plastic physiology to a range of environments, ontogenetic adaption to the local environment, and pre-adaption to the culture environment [25,26,27,28,29]. In a study off the Japanese coast, no correlation was found between genetic markers (the mitochondrial cox3 gene and the nuclear marker ITS1) and the morphological characteristics of this species [30]. These phenotypic differences have therefore arisen as a result of interactions between individual genotypes and environmental conditions at each aquafarm.
In conclusion, the variability in morphometric parameters of three U. pinnatifida cultivars aquacultured in the coastal areas of Gyedo and Myeongcheon suggests relatively high growth rates in the former aquafarm with moderate to high correlations between blade length and blade weight. Among the three cultivars, ‘Kamaishi’ grown at Gyedo was revealed to be highly adapted to growth in this area. Further, multivariate analysis of various environmental factors suggested that the blade length and blade weight of all cultivars across both aquafarms are substantively affected by seawater temperature. Overall, these findings could be applied to facilitate optimization of Kelp production systems in Korea.
Author Contributions
The aims and scope of this manuscript were defined by all the authors. S.-J.C. performed the experiments; S.-J.C. and Y.-S.Y. collected the U. pinnatifida cultivar samples; J.-A.S. analyzed the data; S.-J.C. wrote the manuscript. All authors read and approved the manuscript.
Funding
This research received no external funding.
Conflicts of Interest
The authors declare no conflicts of interest.
References
- Lockwood, J.L.; Hoopes, M.F.; Marchetti, M.P. Invasion Ecology, 2nd ed.; Wiley-Blackwell: Oxford, UK, 2013; 446p. [Google Scholar]
- Lowe, S.; Browne, M.; Boudjelas, S.; Poorte, M. 100 of World’s Worst Invasive Alien Species; The Invasive Species Specialist Group (ISSG) a Specialist Group of the Species Survival Commission (SSC) of the World Conservation Union (IUCN); IUCN: Gland, Switzerland, 2000; 12p. [Google Scholar]
- Kang, J.W. Illustrated Encyclopedia of Fauna and Flora of Korea; Marine Algae: Seoul, Korea, 1968; 465p. (In Korean) [Google Scholar]
- Sohn, C.H. The seaweed resources of Korea. In Seaweed Resources of the World; Critchely, A.T., Ohno, M., Eds.; JICA Yokosuka: Tokyo, Japan, 1998; pp. 15–33. [Google Scholar]
- Chung, Y.K.; Chung, D.Y. Studies on the artificial seedling production and growth of Undaria pinnatifida (Har.). Sur. Bull. Fish. Res. Dev. Agency 1967, 1, 143–152. (In Korean) [Google Scholar]
- Chang, J.W.; Chung, Y.K. Studies on the culture of sea-mustard, Undaria pinnatifida (Har.) Suringar—II. On the productivity of cultivated sea-mustard. Bull. Fish. Res. Dev. Agency 1970, 5, 77–83. (In Korean) [Google Scholar]
- Kim, C.R. A study on the culture of Undaria pinnatifida in the Ko Gun San islands. Bull. Kunsan Fish. Tech. Junior Coll. 1975, 9, 1–8. (In Korean) [Google Scholar]
- Hwang, E.K.; Gong, Y.G.; Park, C.S. Cultivation of a hybrid of free-living gametophytes between Undariopsis peterseniana and Undaria pinnatifida: Morphological aspects and cultivation period. J. Appl. Phycol. 2012, 24, 401–408. [Google Scholar] [CrossRef]
- Sohn, C.H. On the morphological variation of Undaria pinnatifida (Har.) Sur. grown in the culture grounds at Onsan Bay, Korea. Bull. Nat. Fish. Univ. Pusan 1984, 24, 5–12. (In Korean) [Google Scholar]
- Lee, K.Y.; Sohn, H.C. Morphological characteristics and growth of two forms of sea mustard, Undaria pinnnatifida f. distans and U. pinnatifida f. typica. J. Aquac. 1993, 6, 71–87. [Google Scholar]
- Choi, C.G.; Oh, S.J.; Kang, I.J. Growth and Morphological characteristics of Undaria pinnatifida in the cultivation ground at Busan, Korea. J. Fac. Agric. Kyushu Univ. 2009, 54, 47–51. [Google Scholar]
- Park, S.K.; Heo, J.S.; Kim, B.Y.; Song, J.N.; Lim, G.Y.; Kim, H.N.; Choi, H.G. Comparison on the growth of Costaria costata and Undaria pinnatifida sporophytes in culture and their field populations. Korean J. Fish. Aquat. Sci. 2011, 44, 71–77, (In Korean with English Abstract). [Google Scholar] [CrossRef]
- Van der Klaauw, C.J. Ecological Studies and Reviews. IV. Ecological Morphology; Bibliotheca Biotheoretica; Brill: Leiden, The Netherlands, 1948; pp. 27–111. [Google Scholar]
- Wainwright, P. Functional morphology as a tool in ecological research. In Ecological Morphology: Integrative Organismal Biology; Wainwright, P.C., Reilly, S.M., Eds.; University Chicago Press: Chicago, IL, USA, 1994; pp. 42–59. [Google Scholar]
- Travis, J. Evaluating the adaptive role of morphological plasticity. In Ecological Morphology: Integrative Organismal Biology; Wainwright, P.C., Reilly, S.M., Eds.; University of Chicago Press: Chicago, IL, USA, 1994; pp. 99–122. [Google Scholar]
- Schmalhausen, I.I. Factors of Evolution: The Theory of Stabilizing Selection; University of Chicago Press: Chicago, IL, USA, 1986; 327p. [Google Scholar]
- Via, S. The evolution of phenotypic plasticity: What do we really Know? In Ecological Genetics; Real, L.A., Ed.; Princeton University Press: Princeton, NJ, USA, 1994; pp. 35–57. [Google Scholar]
- Bendschneider, K.; Robinson, R.J. A new spectrophotometric method for the determination of nitrite in sea water. J. Mar. Res. 1952, 11, 87–96. [Google Scholar]
- Wood, E.D.; Armstrong, F.A.J.; Richards, F.A. Determination of nitrate in sea water by cadmium-copper reduction to nitrite. J. Mar. Biol. Assoc. 1967, 47, 23–31. [Google Scholar] [CrossRef]
- Solorzano, L. Determination of ammonia in natural waters by phenolhypochlorite method. Limnol. Oceanogr. 1969, 14, 799–801. [Google Scholar]
- Murphy, J.; Riley, J.P. A modified single solution method for the determination of phosphate in natural waters. Anal. Chim. Acta 1962, 27, 31–36. [Google Scholar] [CrossRef]
- Kito, H.; Taniguchi, K.; Akiyama, K. Morphological variation of Undaria pinnatifida (Harvey) Suringar—II. Comparison of the thallus morphology of cultured F1 plants originated from parental types of two different morphologies. Bull. Tohoku Reg. Fish. Res. Lab. 1981, 42, 11–18. [Google Scholar]
- Hohenboken, W.D. Genotype × environment interaction. In General and Quantitative Genetics; Chapman, A.B., Ed.; Elsevier Science, B.V.: Amsterdam, The Netherlands, 1985; pp. 151–165. [Google Scholar]
- Dan, A.; Kato, S. Differences of Morphology and Growth between the Two Culture Varieties Originating from Undaria pinnatifida f. distans and Undaria pinnatifida f. Typica in Naruto Strait; The Agriculture, Forestry and Fisheries Research Information Technology Center: Ibaraki, Japan, 2008; pp. 79–83. [Google Scholar]
- Voisin, M.; Engel, C.; Viard, F. Unravelling the mechanisms behind introduction through genetic approaches: Undaria pinnatifida (Alariaceae) as a model species. Phycologia 2005, 44, 106–107. [Google Scholar]
- Dean, P.R.; Hurd, C.L. Seasonal growth, erosion rates, and nitrogen and photosynthetic ecophysiology of Undaria pinnatifida (Heterokontophyta) in southern New Zealand. J. Phycol. 2007, 43, 1138–1148. [Google Scholar] [CrossRef]
- Nanba, N.; Fujiwara, T.; Kuwano, K.; Ishikawa, Y.; Ogawa, H.; Kado, R. Effect of water flow velocity on growth and morphology of cultured Undaria pinnatifida sporophytes (Laminariales, Phaeophyceae) in Okirai Bay on the Sanriku coast, Northeast Japan. J. Appl. Phycol. 2011, 23, 1023–1030. [Google Scholar] [CrossRef]
- Shibneva, S.Y.; Skriptsova, A.V.; Shan, T.F.; Pang, S.J. The different morphs of Undaria pinnatifida (Phaeophyceae, Laminariales) in peter the great bay (sea of Japan) are phenotypic variants: Direct evidence. J. Appl. Phycol. 2013, 25, 1909–1916. [Google Scholar] [CrossRef]
- Peteiro, C.; Freire, Ó. Morphological traits of wild and selected strains of cultured Undaria pinnatifida from Galicia (NW Spain). J. World Aquac. Soc. 2014, 45, 469–474. [Google Scholar] [CrossRef]
- Uwai, S.; Yotsukura, N.; Serisawa, Y.; Muraoka, D.; Hiraoka, M.; Kogame, K. Intraspecific genetic diversity of Undaria pinnatifida in Japan, based on the mitochondrial cox3 gene and the ITS1 of nrDNA. Hydrobiologia 2006, 553, 345–356. [Google Scholar] [CrossRef]
© 2018 by the authors. Licensee MDPI, Basel, Switzerland. This article is an open access article distributed under the terms and conditions of the Creative Commons Attribution (CC BY) license (http://creativecommons.org/licenses/by/4.0/).