2.1. Study Sites
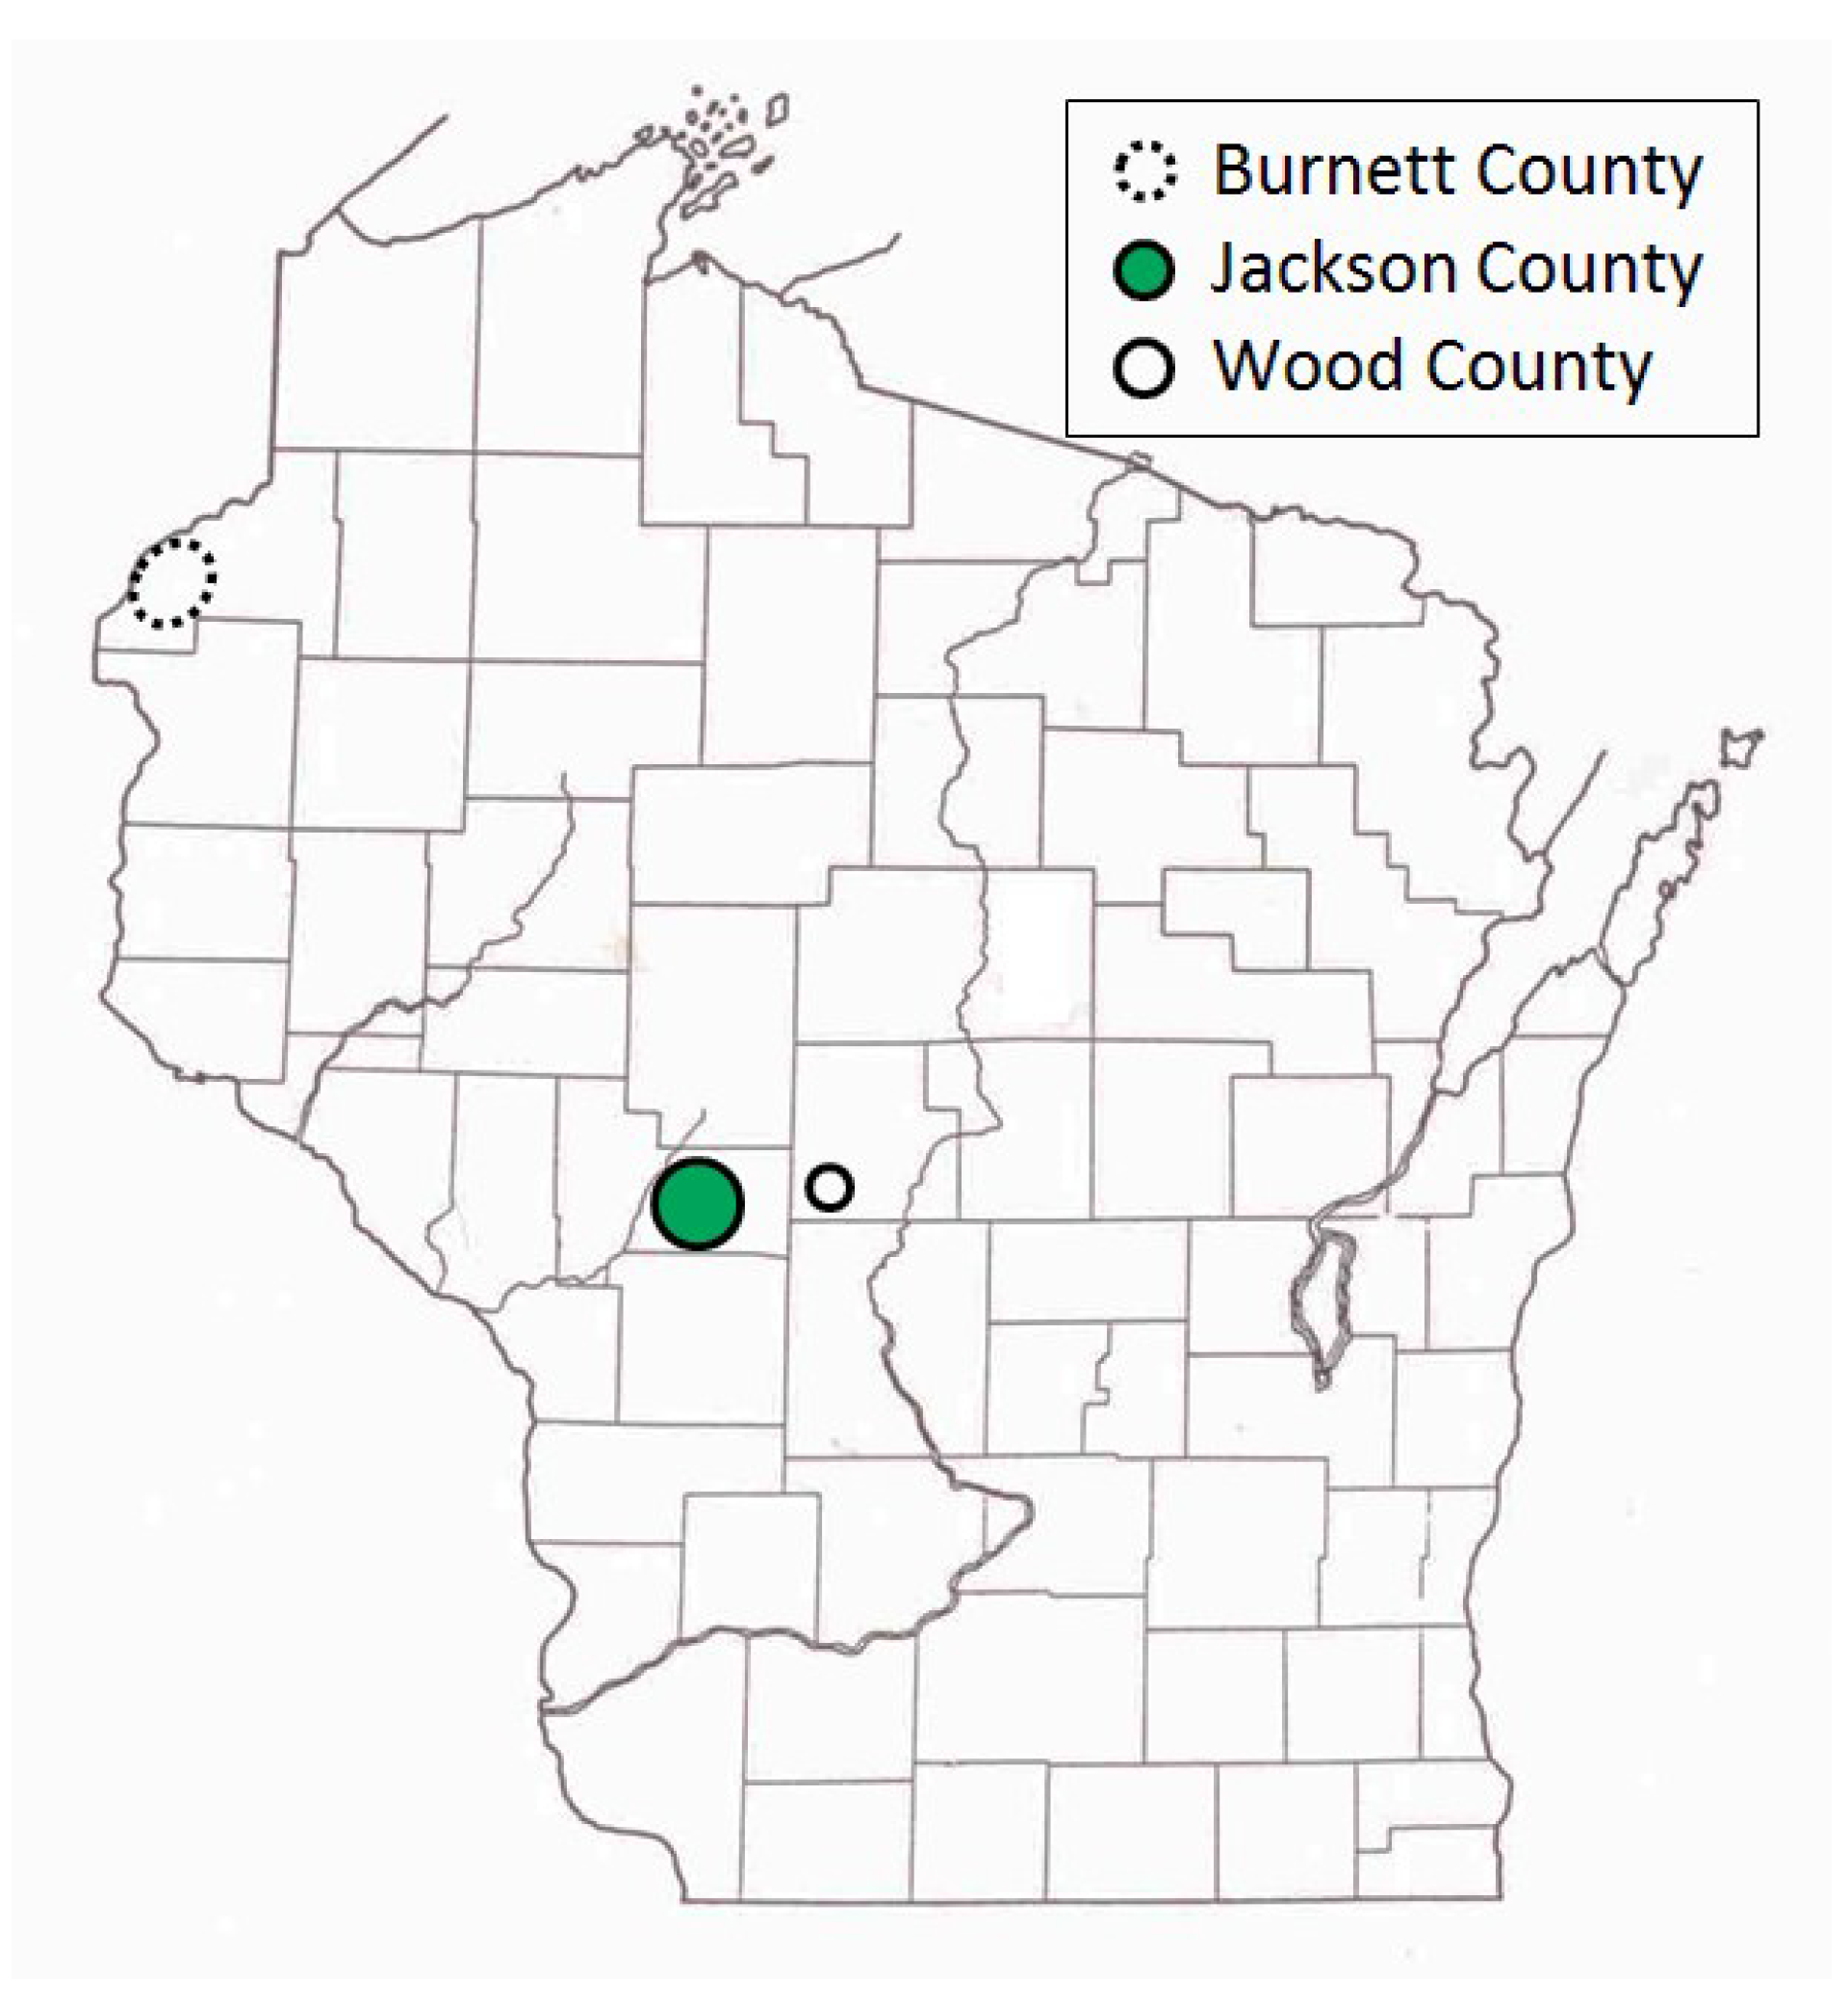
Our study sites included more than 125 pine-oak barrens in central and northwestern Wisconsin (43.93–45.98° N, 89.10–92.74° W) (
Figure 1), which have both trees and herbaceous flora similar to sand prairies (“sand barrens” in [
43]). Wild lupine is the only member of its genus native to Wisconsin, making it easy to identify here. It grows on sandy soil primarily in barrens in central and northern Wisconsin [
43]. It also grows near some rivers in southern Wisconsin, apparently outside the geographic range of our three lupine-feeding study species [
1,
2,
3,
5,
43]. The study sites were selected for their conservation interest, i.e., those known or thought to have specialist butterflies [
22,
34,
40,
41,
44]. They included conservation lands, forest reserves (some burned by wildfire prior to the study period), and rights-of-way for highways and powerlines. These study sites occurred in an extensive landscape context of forest cover, primarily in timber reserves as well as conserved land. As a result, the habitat patches are not discretely delineated. It was beyond our scope to try to define and measure habitat patch sizes. It was not possible to visit all sites each year, but we surveyed most sites multiple times both within a year and among years, and surveyed many sites in both subregions each year.
We did not bias toward large populations in site selection; some sites had few or no individuals detected of these three butterfly species when added to this study. Our criteria for inclusion were that the site was known to us and open to public visitation, efficient to travel to relative to sites already in the study (due to clustering of some sites and due to efficient routing among sites), appeared suitable for Frosted Elfins and/or Karner Blues, or added vegetative and management range to our sample. From this broad-scale exploration, we selected a subset of sites practical for long-term monitoring. We did not specifically target Persius Duskywing because we did not know how to do that beyond what we were already doing, but it was effectively included by our focus on the other two species.
In central Wisconsin, we started “constant-site” population monitoring (consecutive-generation surveying of a site) in two contiguous counties (Jackson, Wood) in summer 1990, and added additional monitoring sites in subsequent years (
Appendix A) [
40]. We had surveyed some sites in several non-consecutive generations before consecutive-generation surveying began. In northwestern Wisconsin, we consistently surveyed only in summer for Karner Blue. We started there with 11 constant sites in summer 1991 (
Appendix A), with a few added in subsequent years for a total of 15 sites.
Shifting mosaic sites would be expected to afforest and decline as habitat for lupine-feeding butterflies until the next timber cutting. We attempted to recruit “new shifting mosaic” sites, starting in 2003 with one site for Frosted Elfin and Persius Duskywing monitoring (both species found). In 2006, we surveyed this site for Karner Blue too. We also added two other sites surveyed for all three species, but at only one of these two sites did we find any lupine-feeding butterflies (Karner Blue and Persius Duskywing only). Thus, our analysis here contains one new shifting mosaic site for Frosted Elfin (2003 on) and two sites from 2006 on for the other two species.
In addition, the “Hunter Haven complex” is a large block of 13 square kilometers in Jackson County Forest accessible only by forestry roads and containing extensive pine-oak barrens with lupine. We have surveyed it for Frosted Elfin and Persius Duskywing in 1995–1997, 2001, 2002 (Persius Duskywing only), and 2003 on. Due to time constraints and changeable weather, circuit length varied among survey dates, as did the number of the 22 contiguous units that we could survey within this shifting mosaic area. Since a complete survey of Hunter Haven took at least four hours and many sections of it had high forest cover, areas that we covered also varied because the weather did not remain continuously favorable for surveying cooler, shaded areas for the entire circuit. We averaged 9 km (range 3–13 km) of surveying on the peak date per year for a species, and recorded both species in all parts of this circuit. In all years in each species' time series, at least one circuit for that species had 7 km of surveying.
All long-term sites analyzed in this study have supported Karner Blue, whether we consistently monitored that butterfly there or not. Thus, all these sites were covered by federal regulation for this butterfly in some manner.
2.2. Butterfly Surveys
Frosted Elfin and Persius Duskywing have a single life cycle per year, with the adult life stage (“flight period”) in spring (primarily May to early June) in Wisconsin [
1,
2,
3,
4,
9,
22,
23,
34]. The Karner Blue has two complete life cycles per year, which consist of spring and summer “broods” or adult generations [
1,
2,
3,
4,
9,
45]. Frosted Elfin has the earliest flight period, followed by Persius Duskywing and then the spring Karner Blue generation, but all three species overlap in the spring flight period. The summer Karner Blue generation occurs well after the end of the spring flight periods [
45]. Frosted Elfin overwinters as a pupa, Persius Duskywing as a fully mature larva, and Karner Blue as an egg [
2,
4].
We made repeated visits to the central Wisconsin study region each year during 1991–2014 that fully covered the spring flight periods of Frosted Elfin and Persius Duskywing [
34]. We also fully covered the onset and main flight period of the spring generation of Karner Blue, and the main flight period (but not necessarily start and end) of the summer generation. For Karner Blue surveying, from spring 1991 on, we did two surveys per generation during the main flight period at most if not all constant sites in central Wisconsin, plus at least one more survey date at some of these sites [
40]. For Frosted Elfin and Persius Duskywing, we attempted similar amounts of repeat visits but cooler weather precluded coverage as thorough as that for Karner Blue. The goal of multiple surveys per generation was to obtain one survey as near to “peak” numbers as possible. Our surveys at other sites aided in timing surveys at monitoring sites [
23,
34,
45]. In northwestern Wisconsin, we usually surveyed on only one date per summer for Karner Blue. Our surveying and phenological observations in central Wisconsin and elsewhere in northern Wisconsin aided in this date selection [
23,
34,
45,
46].
Frosted Elfin and Karner Blue are readily identifiable by observation without netting or handling [
1,
3]. However, without dissection, Persius Duskywing may only be definitively identifiable to species complex, which includes Columbine Duskywing (
Erynnis lucilius) and Wild Indigo Duskywing (
E. baptisiae) [
3,
4]. The latter two species have multiple generations per year that coincide with both the spring and summer surveys for the three lupine-feeding species. We infrequently encountered individuals phenotypically attributable to these other two duskywing species, but we did find such individuals in spring (20 and 77 individuals respectively) and summer (0 and 35 individuals, respectively). As a result, for this species complex, our identifications may not be as accurate as for Frosted Elfin and Karner Blue. However, the rarity with which we encountered duskywings in summer lends supports that Persius Duskywing is the dominant member of this species complex in our study sites. Persius Duskywing has been extensively documented with dissection in both central and northwestern Wisconsin by others [
4,
47].
We conducted butterfly transect surveys similar to Pollard [
48] along like routes on each visit to each site [
22,
23,
40,
42,
44,
49]. Walking at a slow pace (about 2 km/h) on parallel routes 5–10 m apart, we counted all adult butterflies observed ahead and to the sides, to the limit an individual could be identified, with the aid of binoculars when needed, and tracked. We recorded temperature, wind speed, percent cloud cover, percent time sun was shining, route distance, and time spent surveying. Surveys occurred during a wide range of times of day and weather, occasionally in intermittent light drizzle, so long as butterfly activity was apparent, but not in continuous rain. Most peak surveys occurred within the weather parameters of the British Butterfly Monitoring Scheme [
31], but in a much wider range of times of day than in the British program.
For each species, our population abundance index is the peak survey count per monitoring site per generation. We standardized this to survey distance to create an observation rate (relative abundance) per km per site. By using one peak survey during the main flight period of each generation, we avoided pseudoreplication (counting the same individual in more than one value in the dependent variable). This approach has been adequate for producing representative indices for comparisons of relative abundance within and among sites [
40,
42,
50,
51]. In instances when we had more than one count per brood, the peak count was highly correlated with the second highest count [
40], indicating that our method produced robust abundance indices.
Relative abundance indices derived from transect counts (single or multiple counts per site per generation) covary strongly with estimates of absolute numbers (line-transect or mark-release-recapture), both in studies of Karner Blues [
52,
53] and other butterflies [
48,
50,
54]. Relative abundance indices have the advantage of allowing more sites to be sampled in the same amount of time compared to methods for estimating absolute numbers [
53]. Surveying more sites, with less effort allocated per site, generates more statistical power for detecting patterns than spending more effort in fewer sites [
55]. Thus, we have maintained consistency of survey methodology and obtained the most statistical power within the limits of how much field work we could do by using the transect count method throughout our study.
Our flight period spans for Frosted Elfin are relatively rigorously documented since we found this species on our first survey of the year in known sites in only three years of the study (1997, 2004, 2006, with only one individual found on those dates) [
34]. In all other years analyzed here, we surveyed known Frosted Elfin sites prior to the observed start of the flight period. The strong negative correlation of our first observed date for Frosted Elfin with spring temperature provides support for the effectiveness of our determination of the species’ phenology [
34]. In all years, we surveyed known Frosted Elfin sites shortly after that species’ flight period ended due to our multiple survey dates during the spring Karner Blue flight period. Our observed Persius Duskywing flight period nested within those two species’ flight periods, starting after Frosted Elfin and ending before we finished our spring Karner Blue surveying. We used our observations of spring Karner Blue larvae as an additional aid in predicting the start and peak of its spring flight period [
45]. In addition to the two survey dates during the main flight period of each Karner Blue generation, we also surveyed on dates before and after those dates to verify the robustness of the monitoring surveys. Prior publications provided detailed itemizations of these dates [
23,
45]. We analyzed these observations to calculate the interval between spring and summer peak dates, including range of variation in this interval [
45]. We also analyzed sex ratio so that this could also aid us in determining progress of the flight period [
39]. Throughout this study, the Wisconsin Karner Blue HCP development and implementation teams maintained a network of timely sharing of Karner Blue observations in Wisconsin (absence, presence, and numbers seen). Throughout the study, we both contributed observations and benefitted from others’. The strongly significant positive correlation of our Karner Blue time series of abundance with those from Fort McCoy (in Monroe County, adjacent to our central Wisconsin study area), provides evidence for the effectiveness of our surveying to represent the relative variation in Karner Blue abundance in our study sites [
40,
42]. For each generation of each study species, we surveyed on more dates in order to determine the main flight period and obtain the one survey value per site per generation analyzed here.
2.3. Statistical Analyses
All analyses were done with ABstat 7.20 software (Anderson-Bell Corp., Parker, CO, USA) [
56]. Statistical significance was set at two-tailed
p < 0.05. Since significant results occurred at a frequency well above that expected due to spurious Type I statistical error, the critical
p value was not lowered further, as more Type II errors (biologically meaningful patterns lacking statistical significance) would be created than Type I errors eliminated.
We used non-parametric statistical tests because these require no assumptions about whether the data are distributed normally. We used the Spearman rank correlation for correlations and the Mann–Whitney U test to test for significant differences in relative butterfly abundance among groups. We calculated trends (correlation of a species’ abundance with year) by site type: reserve, shifting mosaic, permanency of habitat, new shifting mosaic sites, Hunter Haven (also shifting mosaic), and individual reserve sites.
We controlled for annual variation in weather by limiting the sample in each statistical test to sites surveyed in the same years and minimizing missing values. We analyzed different sets of shifting mosaic sites separately because of the different number of years those sites were surveyed: shifting mosaic (1994–2014, no missing values), new shifting mosaic (2003–2014 for Frosted Elfin, 2006–2014 for the other two species, no missing values), and Hunter Haven (1995–2014 but with some years missing and with variation among years in how many and which units were surveyed). The sample for reserve sites at Crex Meadows in northwest Wisconsin spans 1991–2014 with only three missing values in 1996. We chose relatively simple, widely used statistical analysis because of the relatively large number of sites and years in our samples, no missing values in most samples, and negligible missing values in the few remaining samples. Our goal was the greatest transparency and accessibility in sharing our results with other surveyors and managers, who would certainly be familiar with long-standing methods of analyzing correlations but not necessarily with more specialized or newer models specific to analyzing butterfly trends.


