2.1. Optimization of Extraction Solvent and Evaluation of Protein- and DNA-Based Normalization for GC × GC-MS Metabolomic Profiling of HepG2 Cells
The first stage of the study addressed a key methodological question: whether metabolomic data can be reliably normalized to protein or DNA content under extraction conditions compatible with gas chromatography. Specifically, we assessed whether quantification of protein and DNA content could be accurately quantified in the solid residue remaining after metabolite extraction. Implementation of such an approach would enable simultaneous acquisition of biomass estimates and metabolomic profiles within a single experiment, eliminating the need for additional sample processing steps.
To this end, the HepG2 cells were cultured under standardized conditions, with the sole variable being the serum source, supplied by three different manufacturers. Within the same experimental framework, three solvent systems widely used in GC-MS-based metabolomics were evaluated: methanol/chloroform/water (7:2:1,
v:
v:
v) [
3], methanol/water (8:2,
v:
v:
v) [
13], and acetonitrile/isopropanol/water (3:3:2,
v:
v:
v) [
14]. Solvent composition was considered a critical variable, as it directly influences both the efficiency and selectivity of metabolite extraction and the co-precipitation of proteins and DNA. The primary objective of this stage was to identify the extraction mixture most compatible with protein- and DNA-based normalization from cell precipitates. Metabolites were extracted from samples cultured under three serum conditions (n = 9 per solvent), yielding 27 samples in total.
As described in
Section 2.3 and
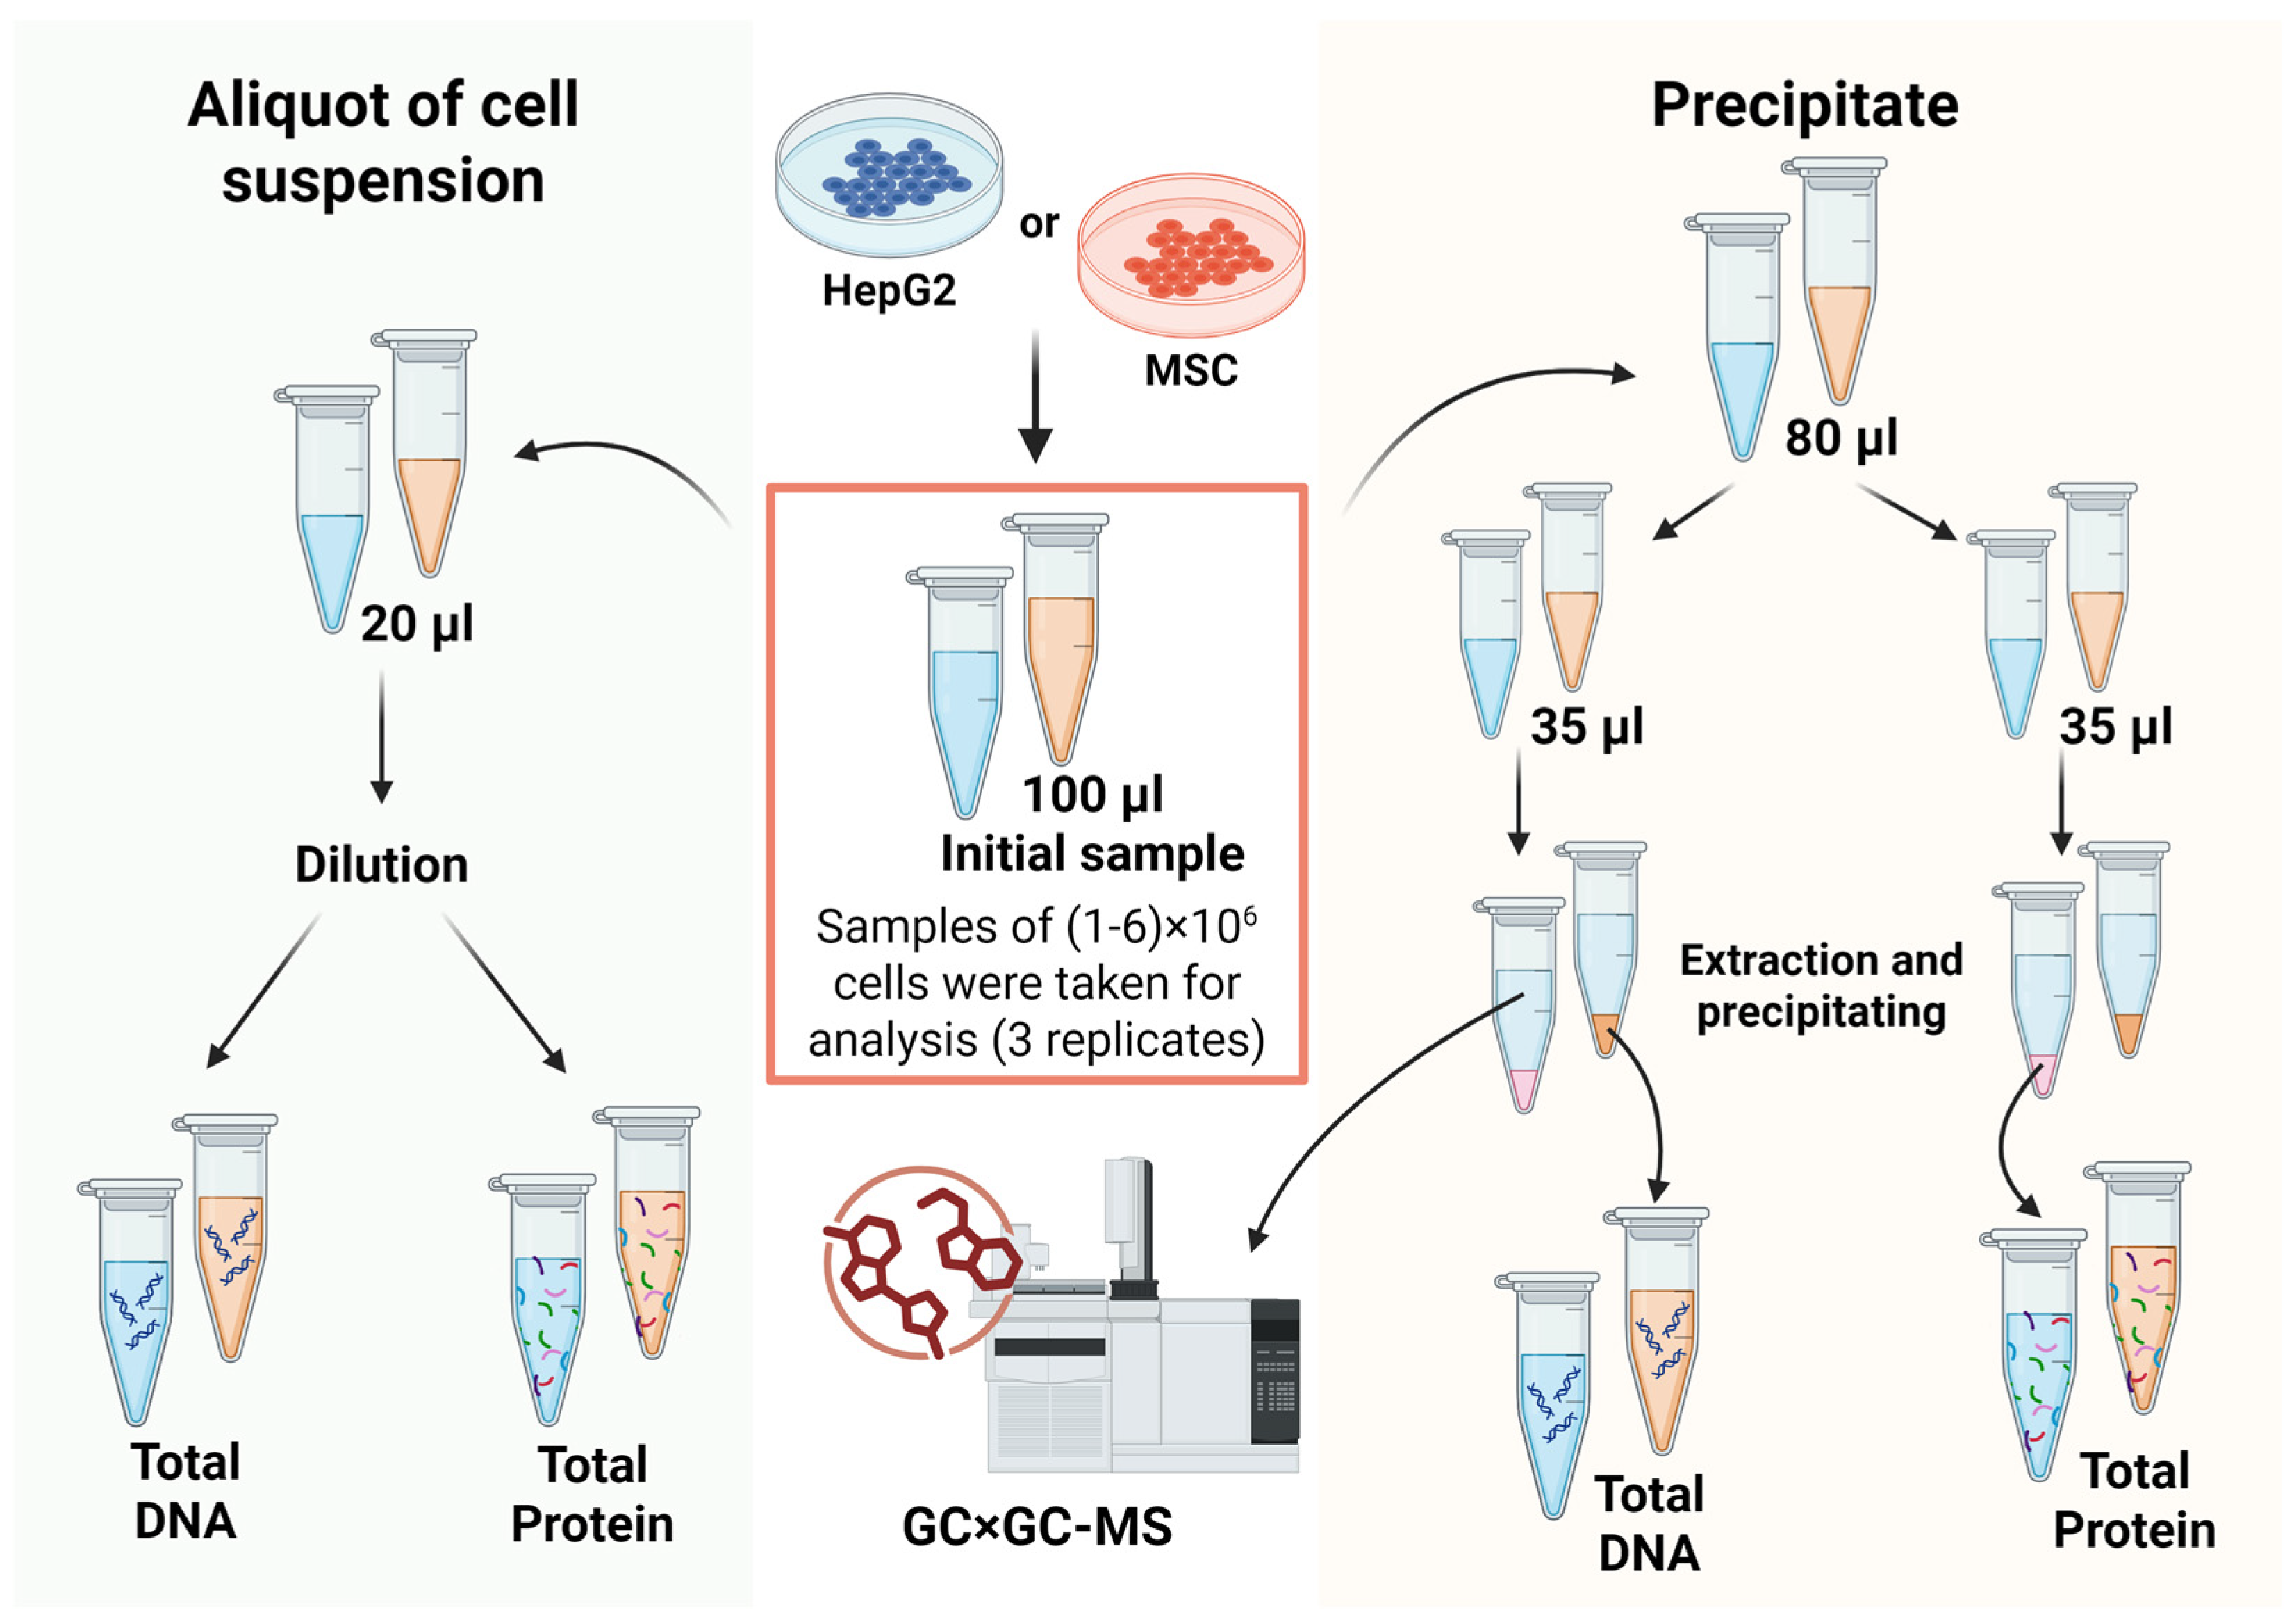
Section 2.4, each initial sample was divided into three aliquots of cell suspension: one 20 μL aliquot for direct protein and DNA quantification, and two 35 μL aliquots for metabolite extraction and recovery of the cellular precipitate (
Figure 1). This experimental design yielded two independent estimates of biological polymer content from the same sample, alongside two parallel metabolomic profiles—enabling internal consistency checks and improving the robustness of the normalization assessment.
Comparison of the three extraction systems revealed a pronounced effect on metabolite coverage. Among the tested mixtures, the methanol/chloroform/water system yielded the highest number of consistently detected metabolites (97), outperforming methanol/water (90) and acetonitrile/isopropanol/water (88), making it the preferred choice when broad metabolomic coverage is the primary objective.
Among the three extraction systems, methanol/chloroform/water also yielded the most favorable normalization performance. This mixture produced the highest mean coefficients of determination (R
2) between metabolite signal intensities and biological material content—whether quantified as protein or DNA—along with the greatest proportion of metabolites with R
2 > 0.75 (
Table 1).
The methanol/water solvent system also yielded high coefficients of determination, indicating good extraction reproducibility across a substantial fraction of metabolites; however, overall metabolome coverage was moderately reduced under these conditions. Methanol/chloroform/water mixture was therefore selected as the primary extraction solvent for all subsequent experiments, as it provided both maximal metabolite coverage and the strongest correlation between metabolite signal intensity and protein/DNA concentration in the post-extraction precipitate.
Correlation analysis between metabolite peak areas and different normalization factors—including protein or DNA concentrations determined under various conditions, as well as the summed XIC of detected metabolites—revealed substantial differences in the performance of the applied normalization strategies. Compared with protein-based normalization, DNA-based normalization of direct lysate aliquots was associated with substantially lower mean R
2 values and a reduced proportion of metabolites with R
2 > 0.75 (
Table 1). We attribute this primarily to the low DNA amounts present in lysate aliquots (on the order of ng/μL), which increases susceptibility to pipetting errors and nonspecific adsorption. Additionally, DNA determinations were performed in standard polypropylene tubes rather than low DNA-binding consumables, which may have further contributed to nonspecific DNA loss. Together, these factors likely amplified technical variability in lysate-based DNA measurements, while both DNA- and protein-based metrics from the post-extraction cell pellet remained markedly more robust.
The data suggest that the effectiveness of a given normalization factor depends on the chemical nature of the metabolite. To enable consistent comparisons across this and subsequent experiments, eleven metabolites representing distinct chemical classes were selected for detailed analysis. Selection was guided by two complementary considerations: (i) GC × GC-MS method characteristics—specifically, thermostability and compatibility with silylation derivatization, which targets polar functional groups to render otherwise non-volatile compounds amenable to analysis—and (ii) the typical metabolome composition of adherent cell lines, with particular reference to HepG2 cells [
15]. All selected metabolites met the detection and quantification thresholds defined in the Methods, and were verified to be consistently detected across all cell loading levels within each experiment. Together, they represent the major chemical classes detectable under our GC × GC-MS conditions, including fatty acids and conjugates, carbohydrates, amino acids and related derivatives, beta-hydroxy acids, cholestane steroids, and pyrimidine nucleosides.
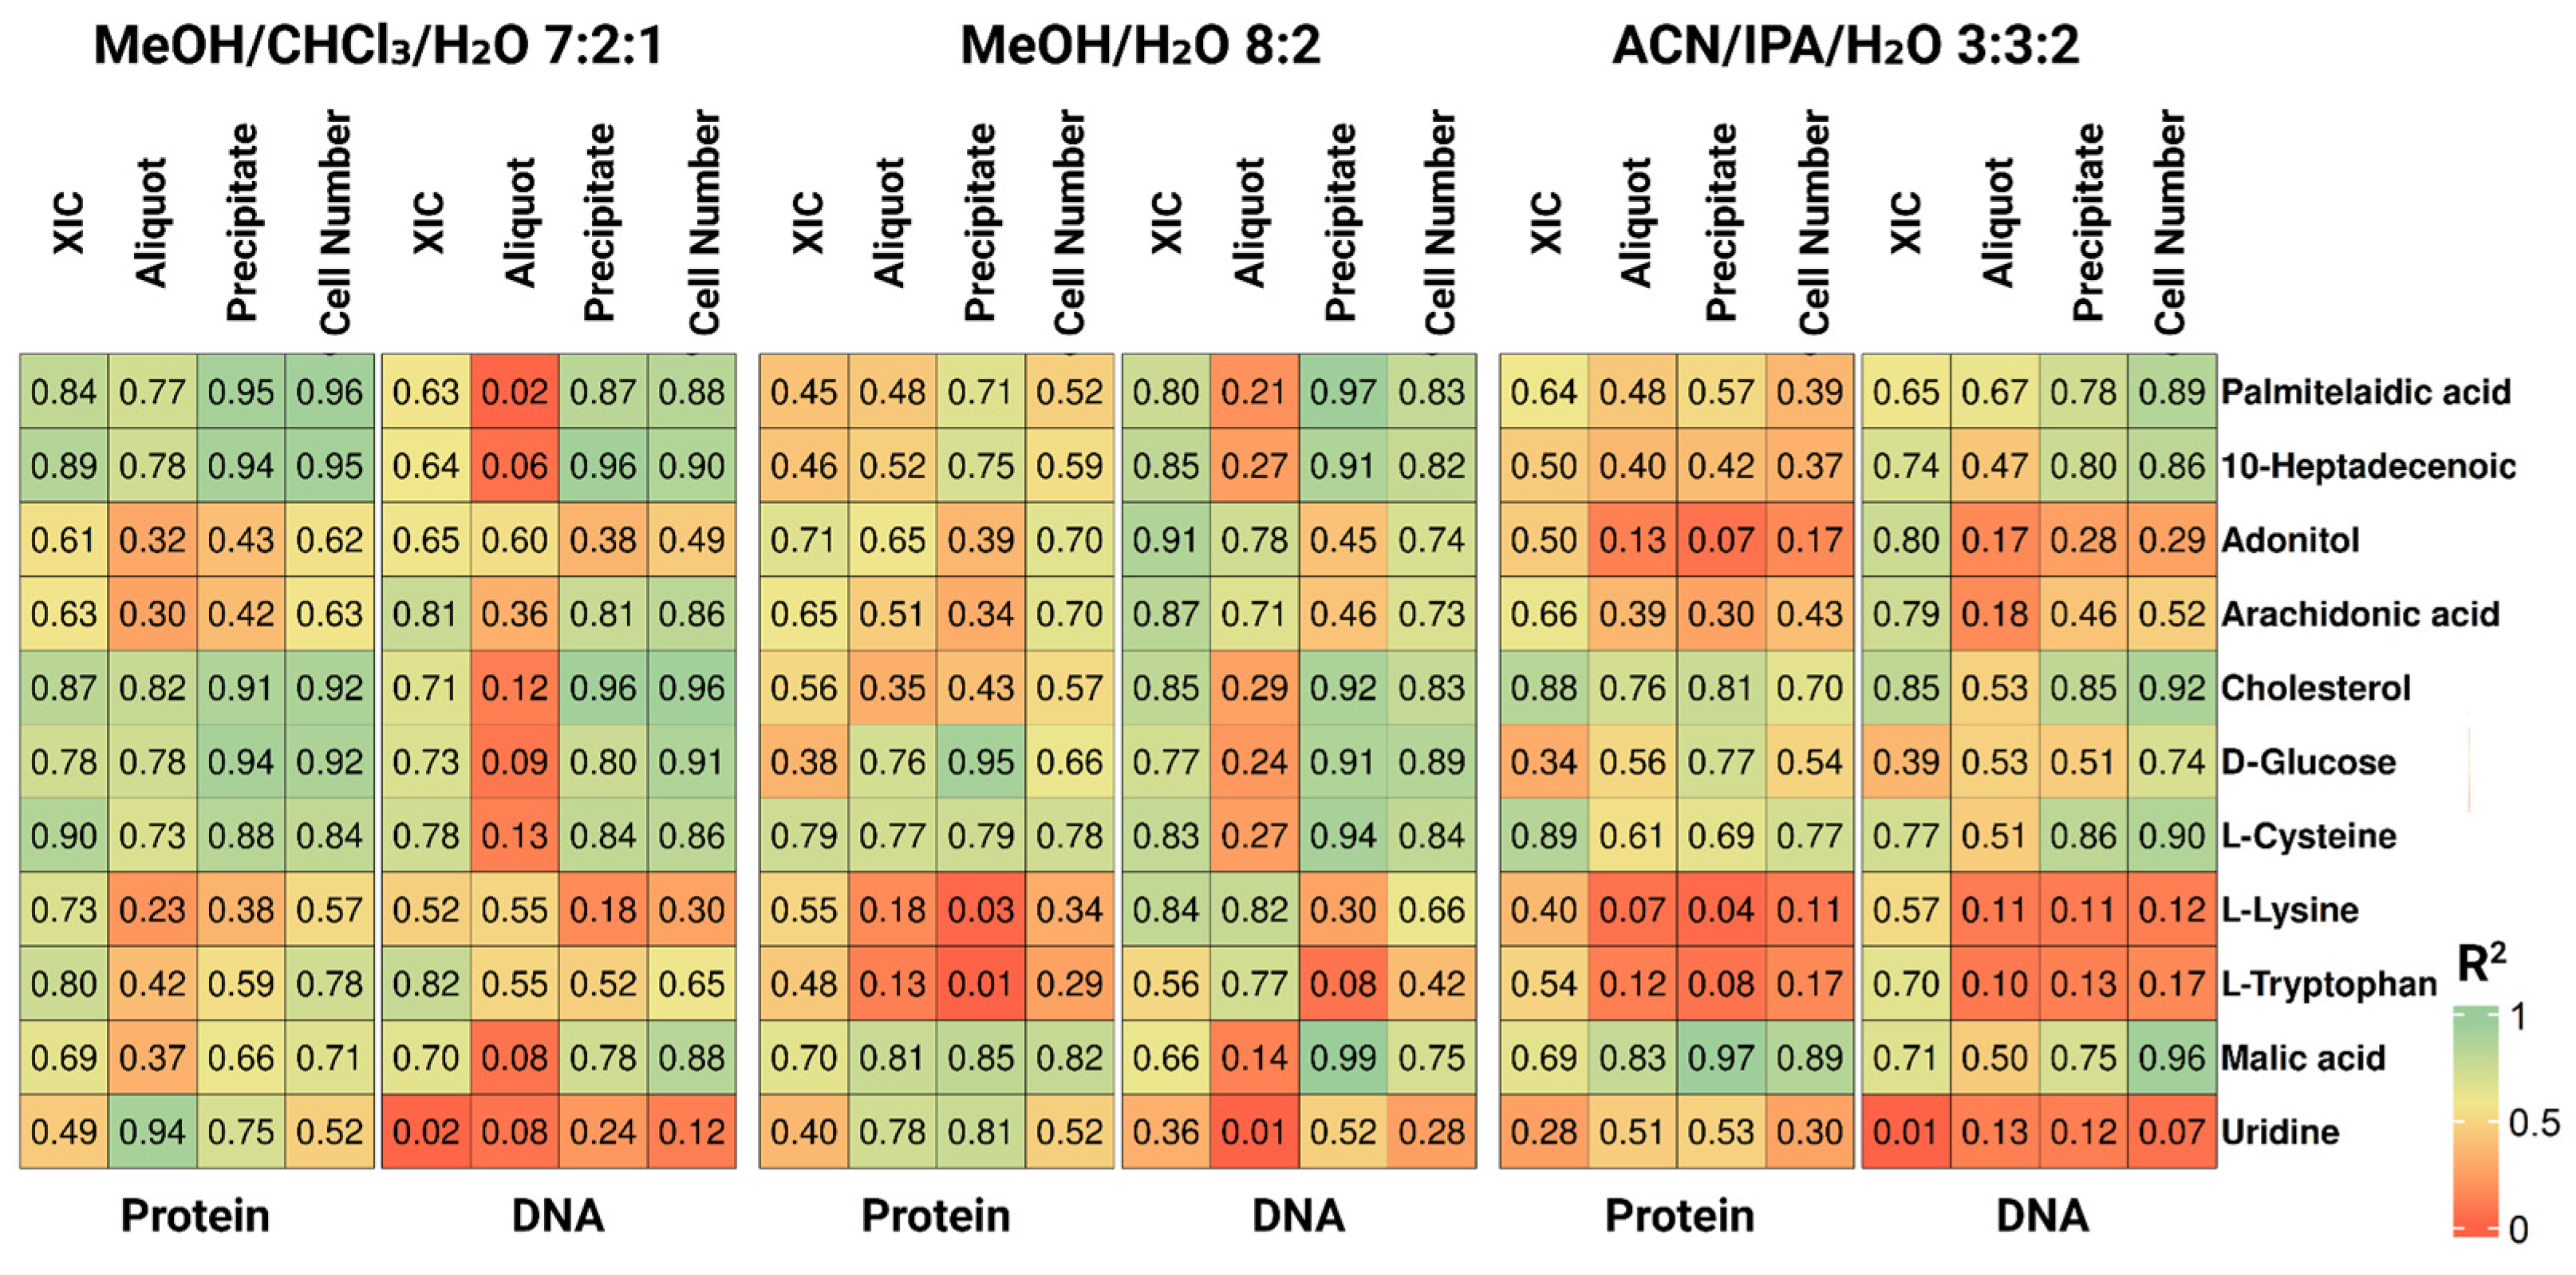
Figure 2 presents the coefficients of determination between each normalization factor and the metabolite signal for these representative compounds across the full dynamic range of biomass loads tested. Among the evaluated parameters, protein content measured in cell precipitates after metabolite extraction yielded the strongest and most reproducible correlations (mean R
2 = 0.66 ± 0.24, mean ± SD) in the methanol/chloroform/water system. In contrast, DNA quantified from the precipitate showed the greatest variability (mean R
2 = 0.64 ± 0.30) in two solvents, indicating lower reliability as a normalization factor for the metabolite set under study.
Analysis of individual compounds revealed a clear pattern: metabolites exhibiting strong correlations with precipitate protein content generally showed high correlations with precipitate DNA. For example, cysteine displayed an R2 of 0.88 and 0.84 with precipitate protein and precipitate DNA, respectively, whereas its correlation with DNA quantified from the cell suspension aliquot was markedly lower (R2 = 0.13). This disparity suggests that the post-extraction precipitate may better preserve the quantitative relationship between metabolites and cellular biomass than the lysate.
Notably, correlations between metabolite peak areas and the evaluated normalization factors remained moderate even for the most favorable extraction solvent system (0.64–0.66 on average for precipitate-based normalization). Several complementary factors likely contribute to this. First, the efficiency and reproducibility of DNA and protein precipitation may vary across extraction solvents depending on their physicochemical properties, introducing heterogeneity in the amount of material recovered for quantification even when the initial cell number is held constant. Second, manual aliquoting—performed both for protein/DNA determination and metabolite extraction—may introduce variability in volume and sample representativeness, particularly given the potential inhomogeneity or partial sedimentation of the cell suspension between preparation and aliquoting. Third, despite the use of a standardized cell line, metabolic activity may vary during culture, introducing intra-experimental heterogeneity whose magnitude remains to be systematically assessed.
These observations highlight that while the methanol/chloroform/water (7:2:1) system offers optimal compatibility with pellet-based normalization under realistic culture conditions, the moderate R
2 values suggest contributions from both technical factors—such as precipitation efficiency and aliquoting variability—and uncontrolled biological heterogeneity. To decouple these effects, we systematically evaluated normalization performance across a series of progressively more complex experimental settings: first, by assessing the reproducibility of biopolymer precipitation across solvents in the complete absence of biological variation (
Section 2.2); then, by metabolomic profiling under strictly controlled cell loading (
Section 2.3); and finally, under conditions of minimal but controlled biological variability (
Section 2.4). This stepwise experimental design allows the relative contributions of technical and biological factors to normalization performance to be clearly resolved.
2.3. Technical Performance of Normalization Metrics in Pooled MSCs in the Absence of Biological Variation
Building on the findings of the first experiment, a follow-up metabolomic study was conducted to assess whether the normalization factors identified are generalizable across cell types. Mesenchymal stromal cells (MSCs) were selected as an alternative adherent cell model, allowing us to verify that the performance of DNA- and protein-based normalization is not restricted to HepG2 cells but reflects a broader applicability. Unlike the initial HepG2 experiment, which was potentially confounded by variability in culture conditions between individual dishes, the present experiment employed a strict unification strategy. MSCs were cultured under fully identical conditions, including the same culture medium and reagent suppliers, identical seeding density, and synchronized cultivation timelines.
Upon reaching the target cell number (ca. 35 million cells), all biological material was pooled into a single suspension, eliminating inter-dish variability in metabolic state, differentiation status, and other cellular characteristics. Cycloserine was added to the pool as an internal standard to monitor the homogeneity and reproducibility of the subsequent aliquoting process. Equal-volume aliquots containing ca. 2, 3, and 6 million cells in 100 μL of phosphate-buffered saline were manually collected. Subsequent sample preparation followed the same workflow as in the first experiment, with the sole exception that only a single extraction solvent—methanol/chloroform/water (7:2:1), previously identified as optimal—was used.
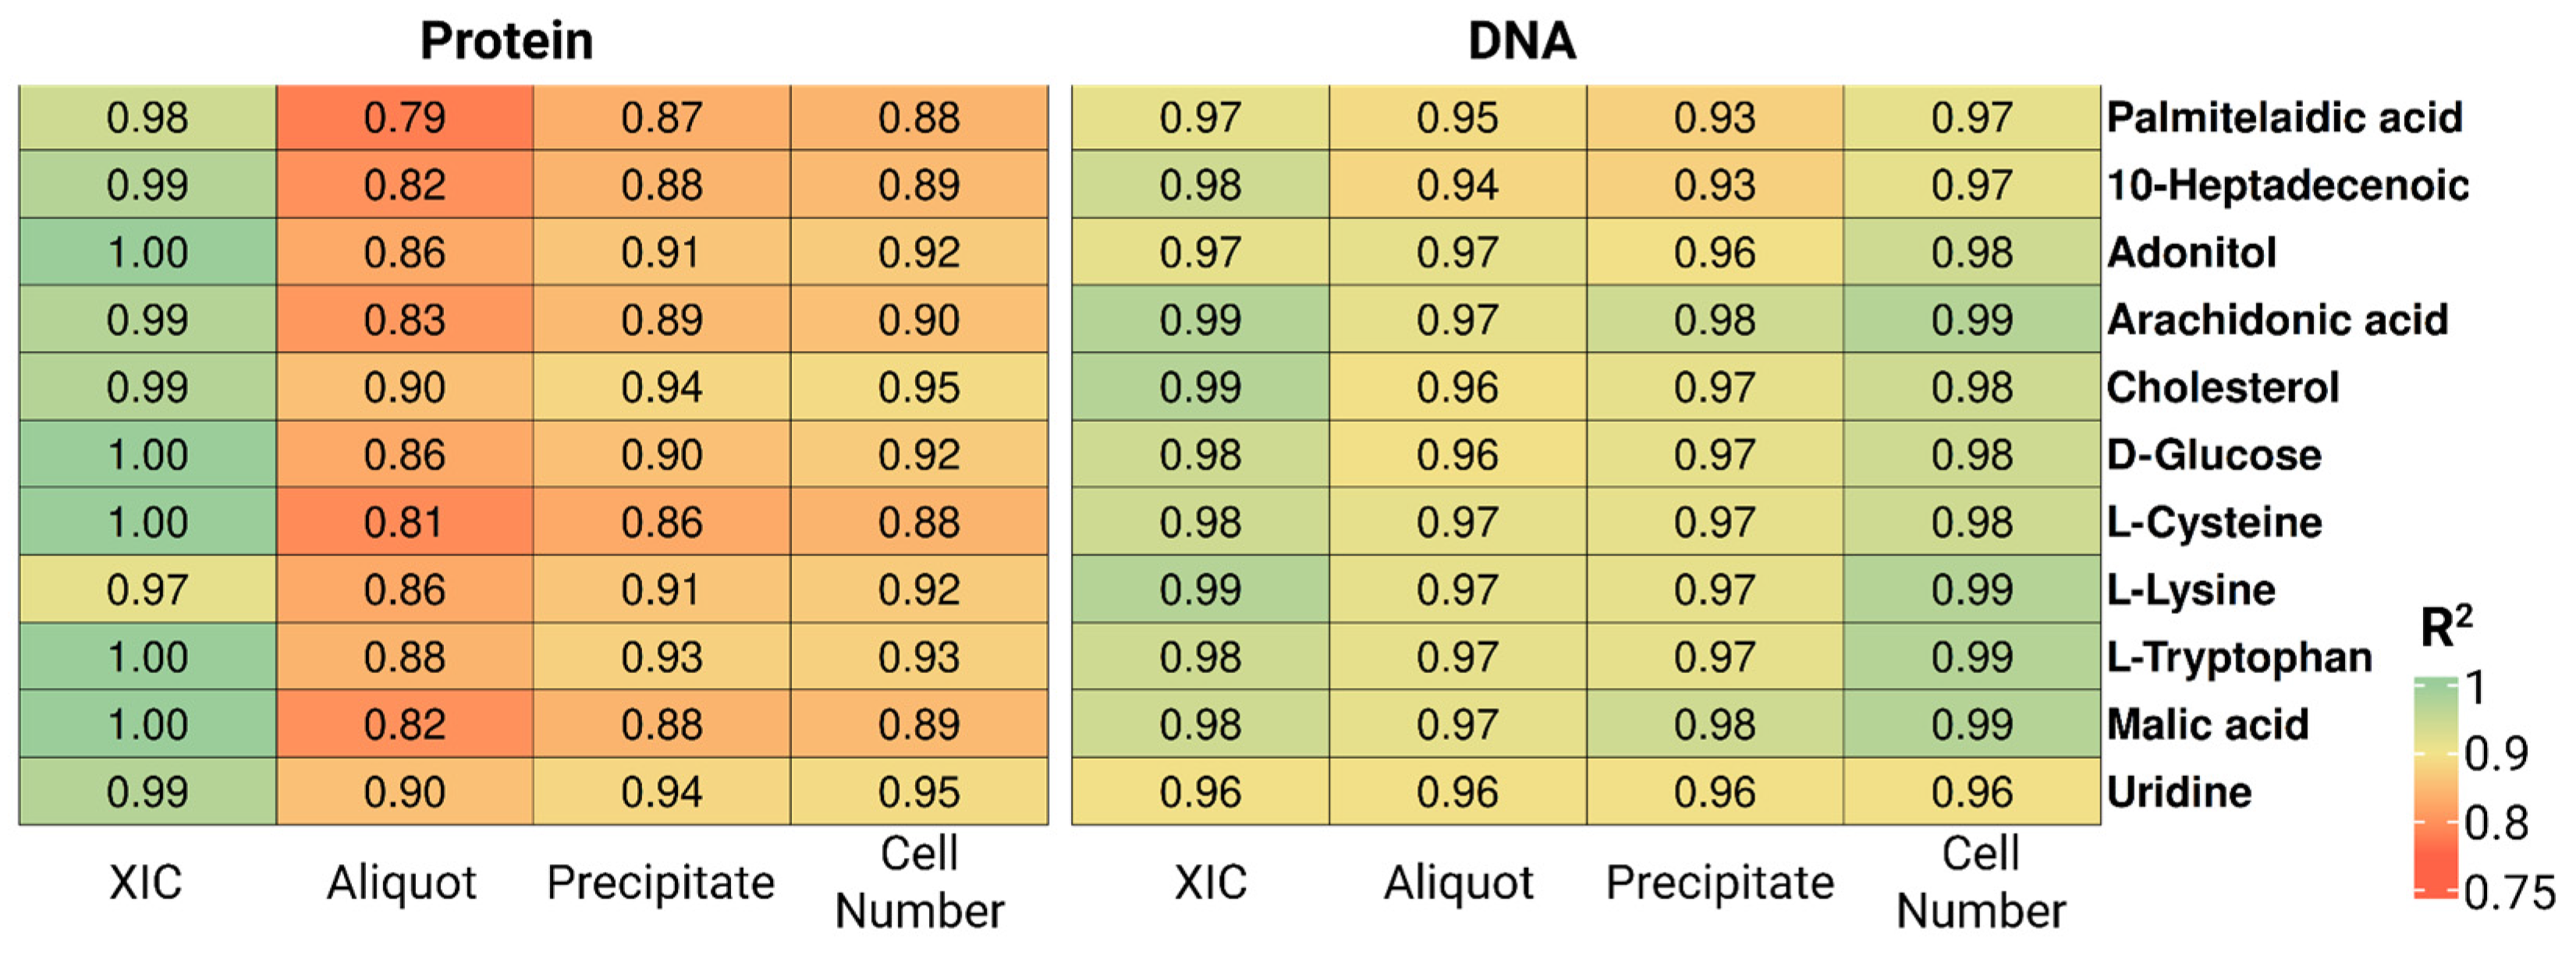
First, we assessed the concordance between measured quantitative parameters and nominal cell numbers across samples. For all evaluated parameters, a strong positive correlation with cellular load was observed (R2 ≈ 0.91–0.99). The highest concordance was detected for protein concentration measured in the post-extraction precipitate (R2 = 0.99), while slightly lower R2 values were observed for summed XIC (R2 ≈ 0.91–0.98). Pairwise correlations between all replicate-averaged quantitative parameters exceeded 0.99, indicating exceptionally high internal consistency across measurements.
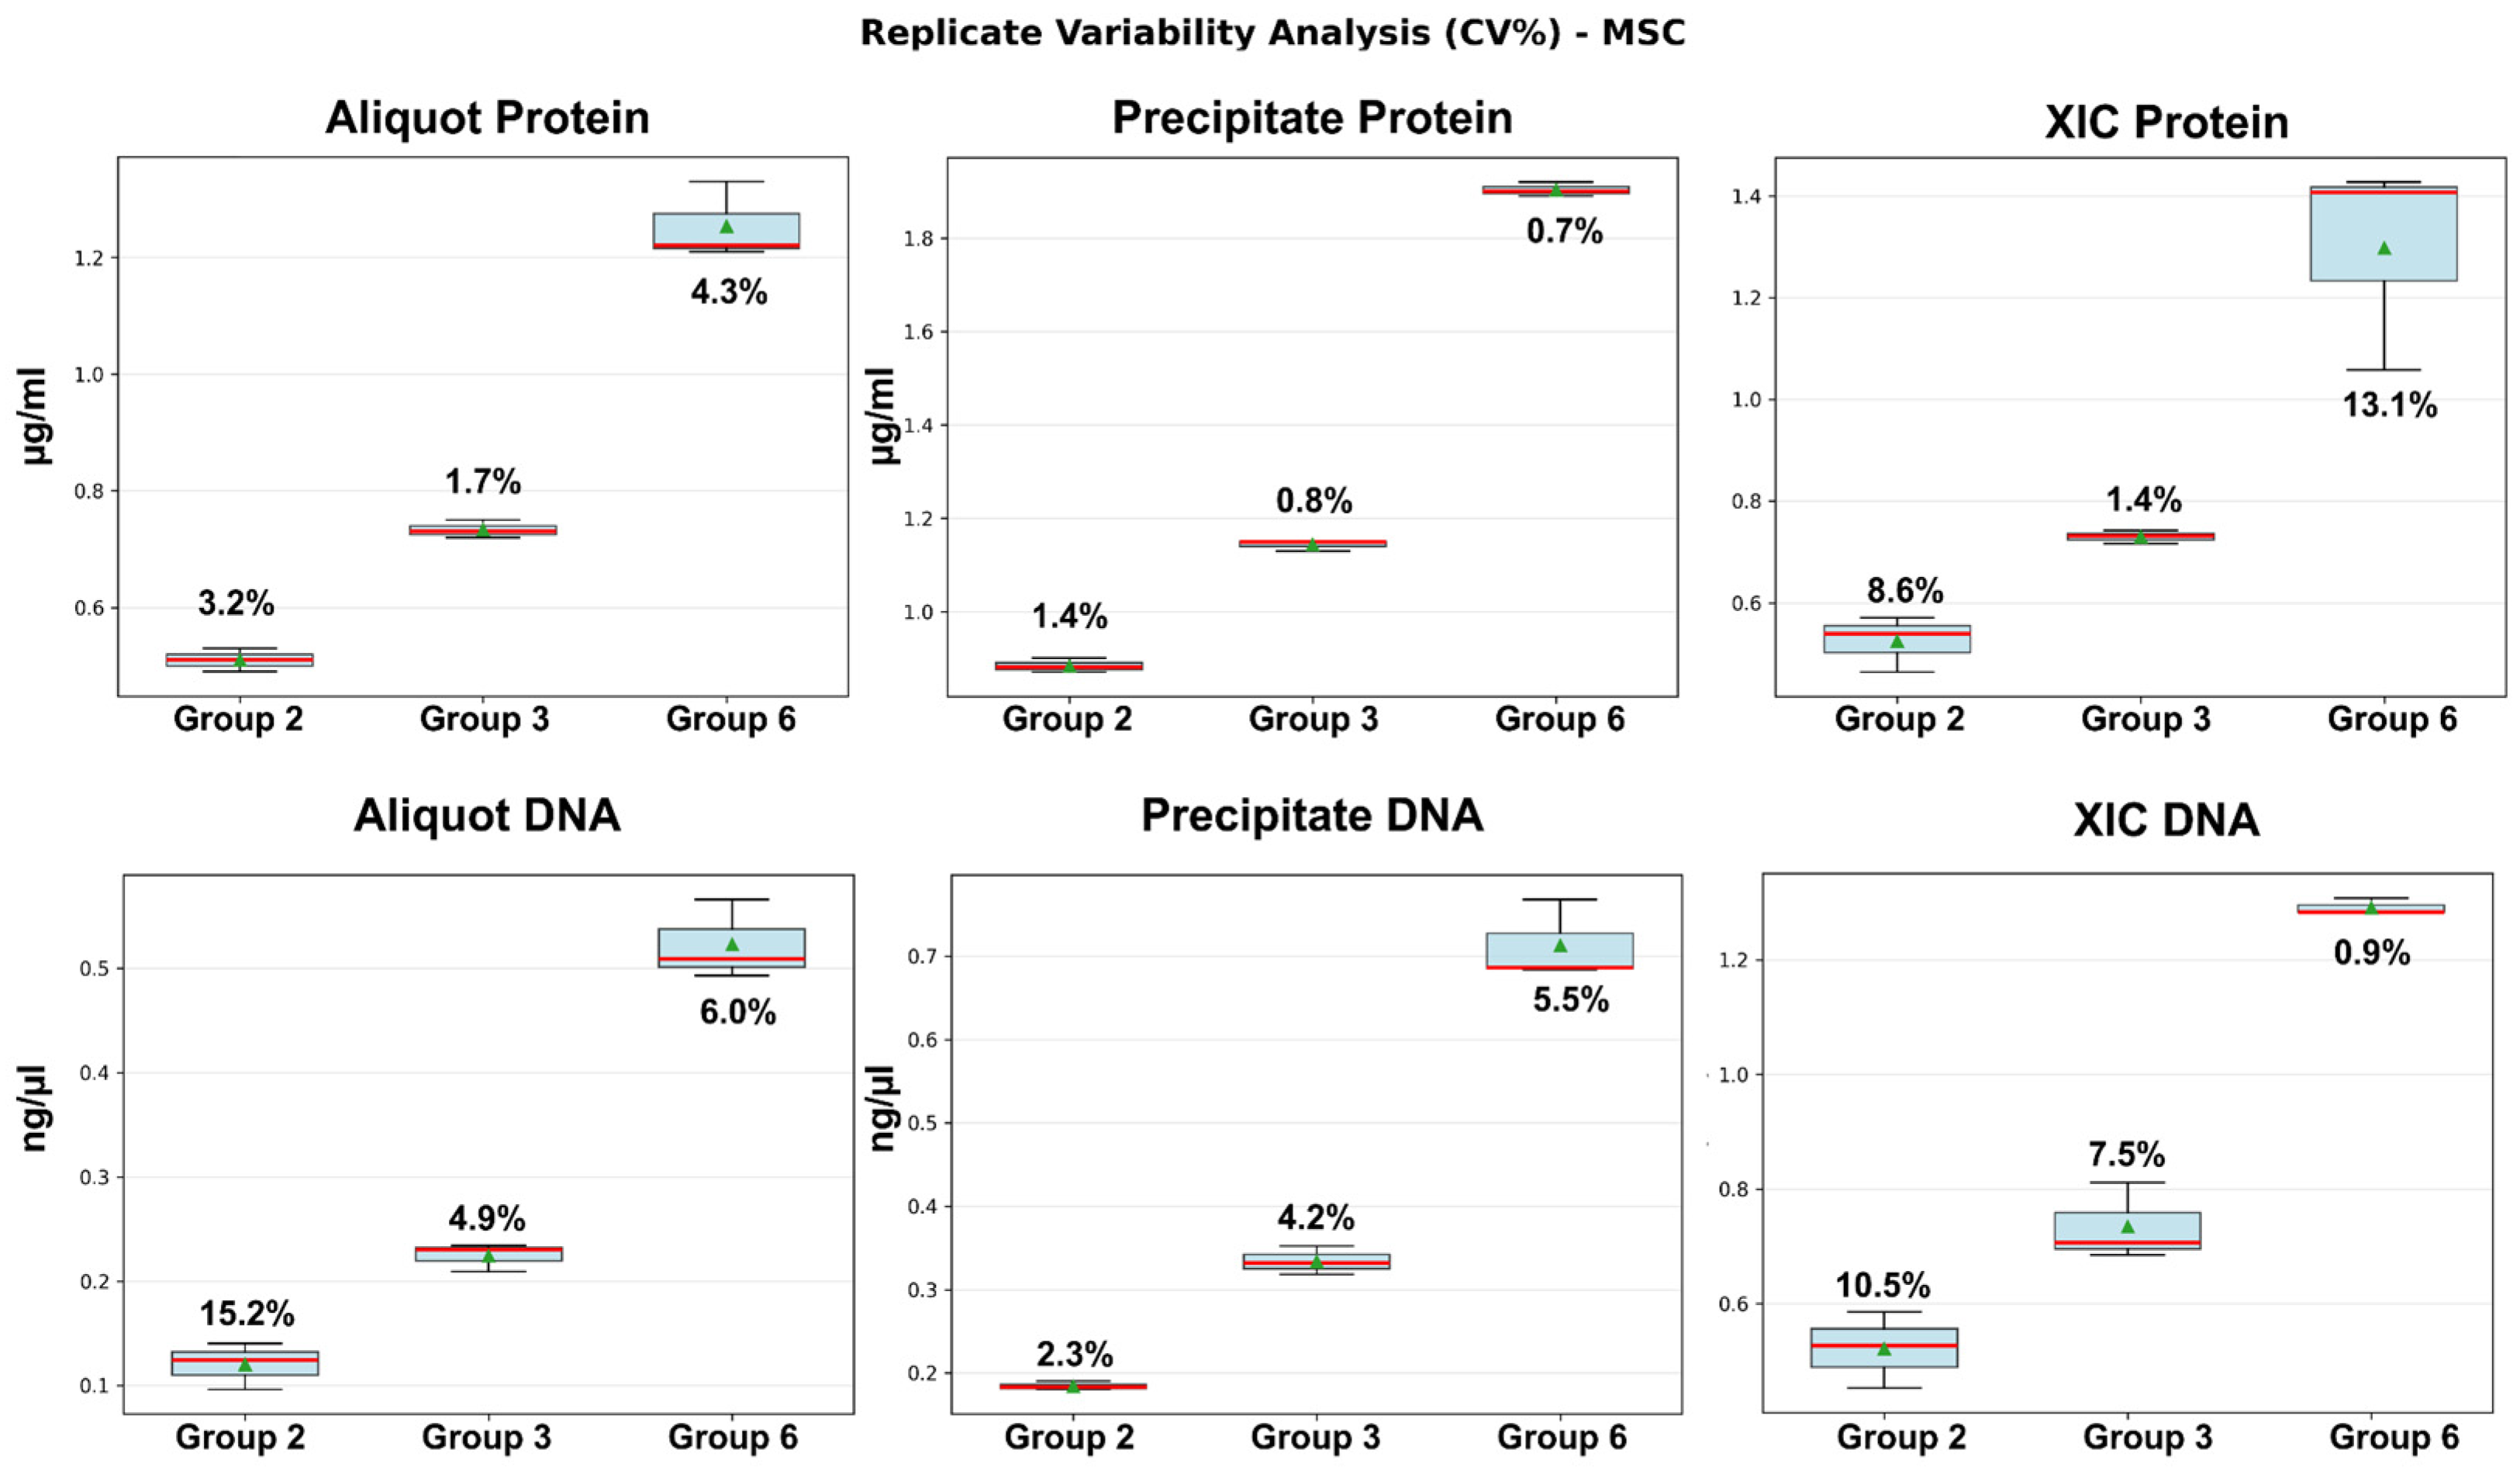
Reproducibility within each cellular load group (2, 3, and 6 million cells per sample) was assessed from technical replicates (
Figure 3). For the majority of parameters, variability was low, with coefficients of variation ranging from 0.7% to 6.0% for protein (whether measured from suspension aliquots or precipitates) and precipitate-derived DNA, and from 0.9% to 13.1% for XIC, depending on the cell loading level.
Subsequently, we evaluated correlations between chromatographic peak areas and the corresponding normalization parameters.
Table 3 summarizes the mean R2 values calculated across all detected metabolites, together with the percentage distribution of metabolites falling within each correlation ranges. In terms of mean R
2, all normalization methods demonstrated satisfactory performance (>0.80), reflecting a strong overall association between metabolite responses and the corresponding normalization factors. However, examining the distribution of R
2 values by metabolite class reveals that protein-based approaches tend to yield somewhat lower correlations than DNA-based normalization, with metabolites more frequently falling in the 0.75–0.90 range rather than the >0.95 group characteristic of DNA. Interestingly, a similar pattern was observed for cell count normalization, which may point to inaccuracies introduced during sample pooling at the preparation stage. For protein-based normalization specifically, the reduced correlations may reflect greater susceptibility to technical variability, despite the higher robustness to biological variability demonstrated in the previous experiment. XIC-based normalization, in contrast, consistently yielded high correlations under controlled conditions, which is expected given that this metric effectively functions as an internal normalization factor.
Figure 4 shows R
2 values for a representative set of ten metabolites spanning distinct chemical classes, evaluated across six normalization factors. DNA quantified directly from cell suspension aliquots—without prior precipitation—yielded the highest correlations, with R
2 values of 0.95–0.99 for the majority of metabolites, indicating a near-linear relationship between DNA concentration and metabolite signal intensity. Comparable performance was observed for protein quantified from the aliquot (R
2 = 0.8–0.9). Across all biological normalization markers, performance was markedly improved relative to the first experiment.
To assess whether the observed correlation patterns were influenced by any specific metabolite class, R
2 values were further stratified by chemical class (amino acids, peptides and analogs; carbohydrates and carbohydrate conjugates; fatty acids and conjugates;
Supplementary Table S1). Class-averaged R
2 values for the most populated groups deviated from the global means by less than ~5%, indicating that the trends reported in
Table 3 reflect a consistent behavior across chemically diverse metabolites rather than a class-specific effect.
The coefficients of determination for the 11 representative metabolites spanning different chemical classes (
Figure 4) broadly confirm the overall trends reported in
Table 3. Protein-based approaches showed markedly lower correlations than DNA-based normalization, whereas XIC-based normalization consistently maintained strong correlation patterns across all metabolite classes examined.
Normalization based on summed XIC yielded exceptionally high correlations, with R2 values of 0.97–0.99 for most metabolites. However, these results should be interpreted with caution in the context of pooled starting material. Unlike biomass-derived metrics (DNA or protein content), which reflect genuine differences in biological material between aliquots, XIC represents an integral property of the entire chromatographic profile. In this experimental setting, the high XIC correlations primarily reflect the quality and homogeneity of the aliquoting process rather than the independent suitability of these parameters for normalization factor under conditions of uncontrolled biological variability.
Protein and DNA quantified from the post-extraction precipitate also demonstrated high R2 values (0.95–0.99 for DNA and 0.75–0.95 for protein). The modest reduction in performance relative to aliquot-based measurements likely reflects partial protein and DNA losses incurred during precipitation and centrifugation steps.
To complement the correlation analysis, coefficients of variation were calculated for the 11 selected metabolites after applying each normalization strategy (
Table 4). Across these compounds, normalization generally reduced between-sample dispersion, with normalized peak areas clustering more tightly around their respective means. Normalization to biomass-derived parameters shows a clear advantage of DNA-based metrics over protein-based ones in this dataset. This is broadly consistent with the findings from a previous study [
9], in which DNA was identified as the preferred normalization target. Normalization to DNA in the precipitate yielded the lowest dispersion of normalized peak areas (mean CV ≈ 17%), closely followed by DNA in the aliquot of cell suspension (≈19%), whereas normalization to protein in the aliquot and in the precipitate results in noticeably higher mean CVs (≈25% and ≈28%, respectively). For 9 of the 11 metabolites, one of the two DNA-based measures (aliquot of cell suspension or precipitate) provided the lowest CV among all biological normalization options, with precipitate DNA marginally outperforming aliquot DNA. Protein-based normalization was optimal only for a limited subset of compounds, notably hydrophobic metabolites such as cholesterol and 9-octadecenoic acid, and protein from the precipitate did not emerge as the best variant for any metabolite in this particular comparison. XIC-based normalization also produced comparatively low CVs across many metabolites, which is consistent with the design of this experiment: all samples originated from the same pooled biological material and were processed using identical extraction and analytical workflows. Under such controlled conditions, XIC functions as an effective technical scaling factor that efficiently equalizes signal intensities, even though, as discussed above, its utility as a primary normalization metric is more limited in biologically heterogeneous settings. Cell count normalization yielded the lowest mean CV among the 11 selected metabolites; however, like XIC-based normalization, its universal applicability remains a matter of debate.
The substantial improvement in correlation strength—from moderate values in the first experiment (R2 ≈ 0.50–0.70) to near-linear relationships in the second experiment (R2 ≈ 0.80–0.90)—indicates that the dominant source of variability in the initial experiment was intrinsic biological heterogeneity of the HepG2 samples. This heterogeneity is likely aroused from the use of reagents from different manufacturers during cell culture, compounded by unavoidable physiological variation accumulated during extended passaging.
It is important to note that, in the context of normalization protocol development, this experiment represents an intermediate validation step. The primary objective of normalization is to compensate for variability arising from differences in the amount of biological material grown under realistic, partially uncontrolled conditions. In the present experiment, such variability was intentionally eliminated through pooling. Nevertheless, these results provide critical insight into the technical capabilities and analytical limits of the normalization approach. Specifically, they demonstrate that in the absence of biological variability, quantitative performance can approach R2 ≈ 1.00, confirming that the methodology itself imposes no fundamental analytical constraints. Conversely, the presence of biological variability does not preclude effective normalization in the studied system. As demonstrated below, a subset of metabolites consistently recurring across experiments exhibits strong correlations between signal intensity and normalization factors. These metabolites often have clear biological origins and may serve as reference markers for assessing normalization quality.
2.4. Robustness of Normalization Strategies Under Controlled Biological Variability in HepG2 Metabolomics
Having demonstrated that protein content, DNA content, and total extracted ion current can serve as effective normalization factors under conditions of limited or fully suppressed biological variability, we next examined how these metrics perform when modest, experimentally controlled heterogeneity is introduced between independent cultures—conditions that more closely reflect realistic in vitro settings. To this end, three parallel HepG2 cultures were grown under identical conditions in separate dishes, and samples spanning a broad range of cell amounts were collected from each culture. This design simultaneously expanded the number of data points for assessing analytical linearity and allowed for an explicit evaluation of whether the proposed biomass metrics can compensate for between-culture differences in metabolic state and growth history.
From each of the three cell suspensions, a series of five samples was generated by aliquoting, yielding approximate cell numbers of 1, 2, 3, 4, and 5 million cells per replicate. This experimental design served two complementary objectives: to increase the resolution of the biomass–signal relationship by providing more data points than in previous experiments, and to assess the extent to which inter-culture variability could be mitigated by the proposed normalization strategies.
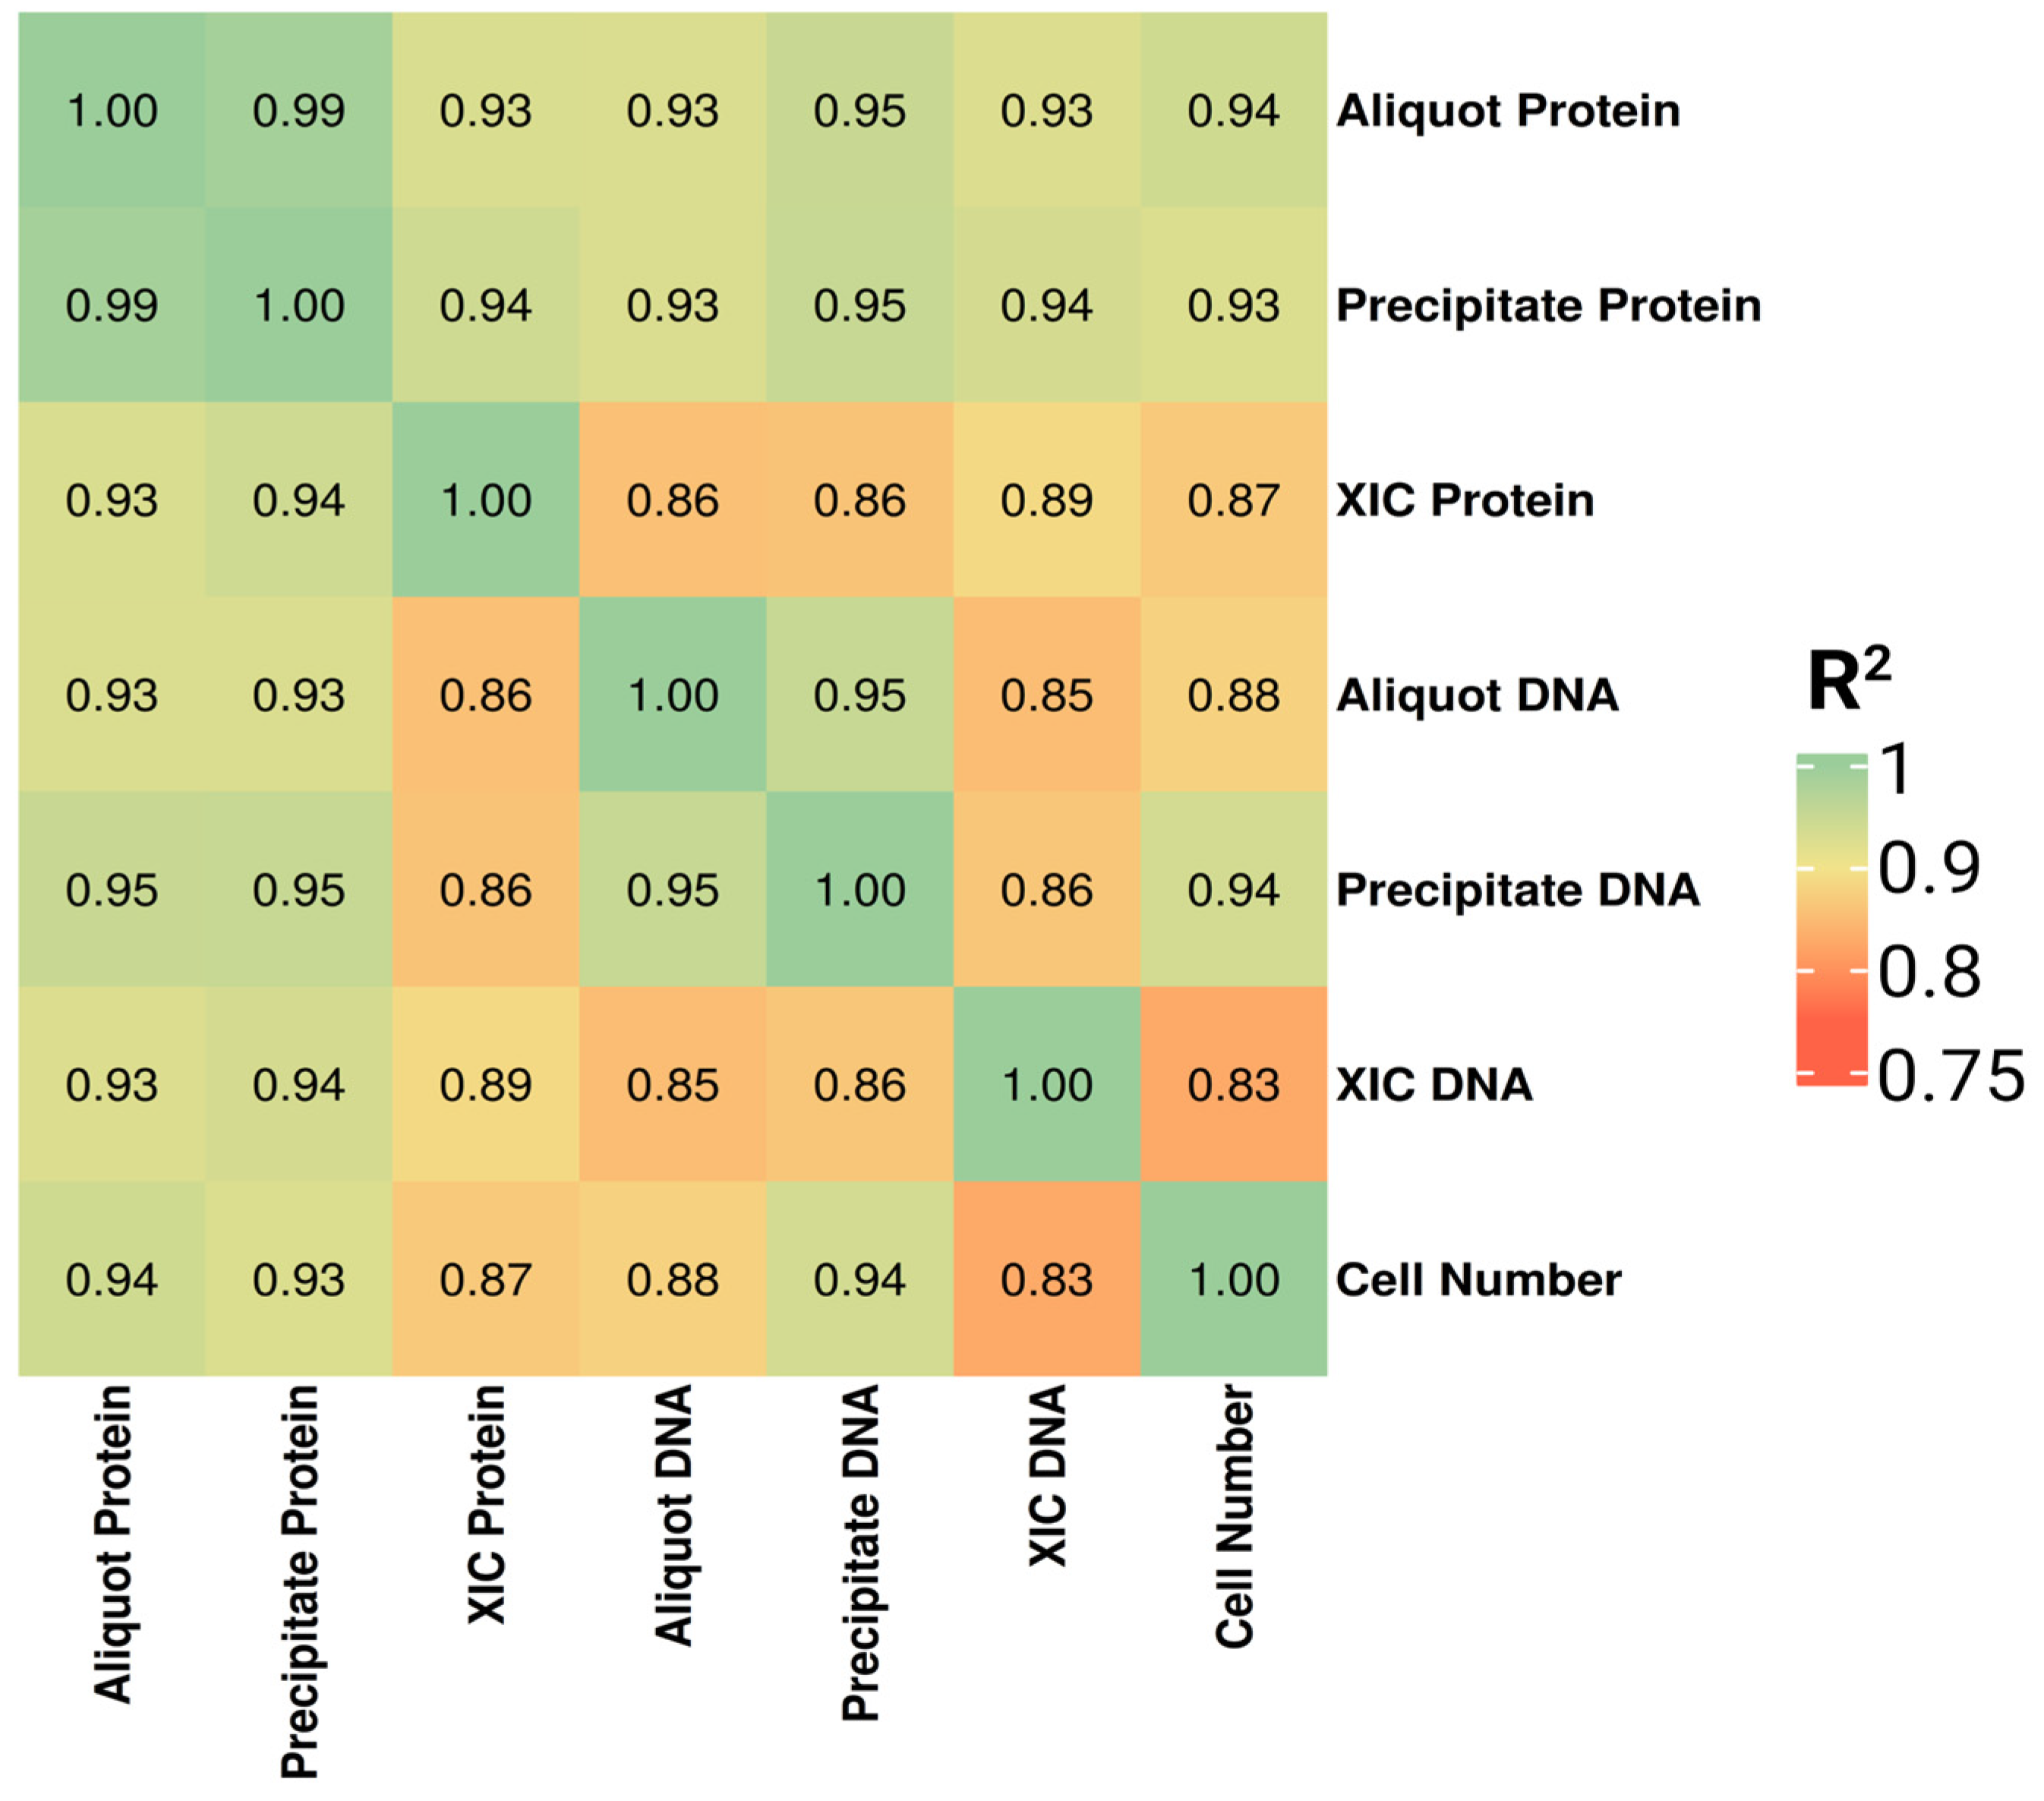
Overall, all approaches for estimating biological material content retained strong correlations between the normalization factor and the calculated cell number (R
2 ≥ 0.98,
Figure 5). High concordance was preserved among all normalization metrics, as reflected by strong coefficients of determination between the respective parameters. Nevertheless, overall agreement was modestly reduced relative to the previous experiment, likely reflecting the introduction of controlled biological variability across independent cultures.
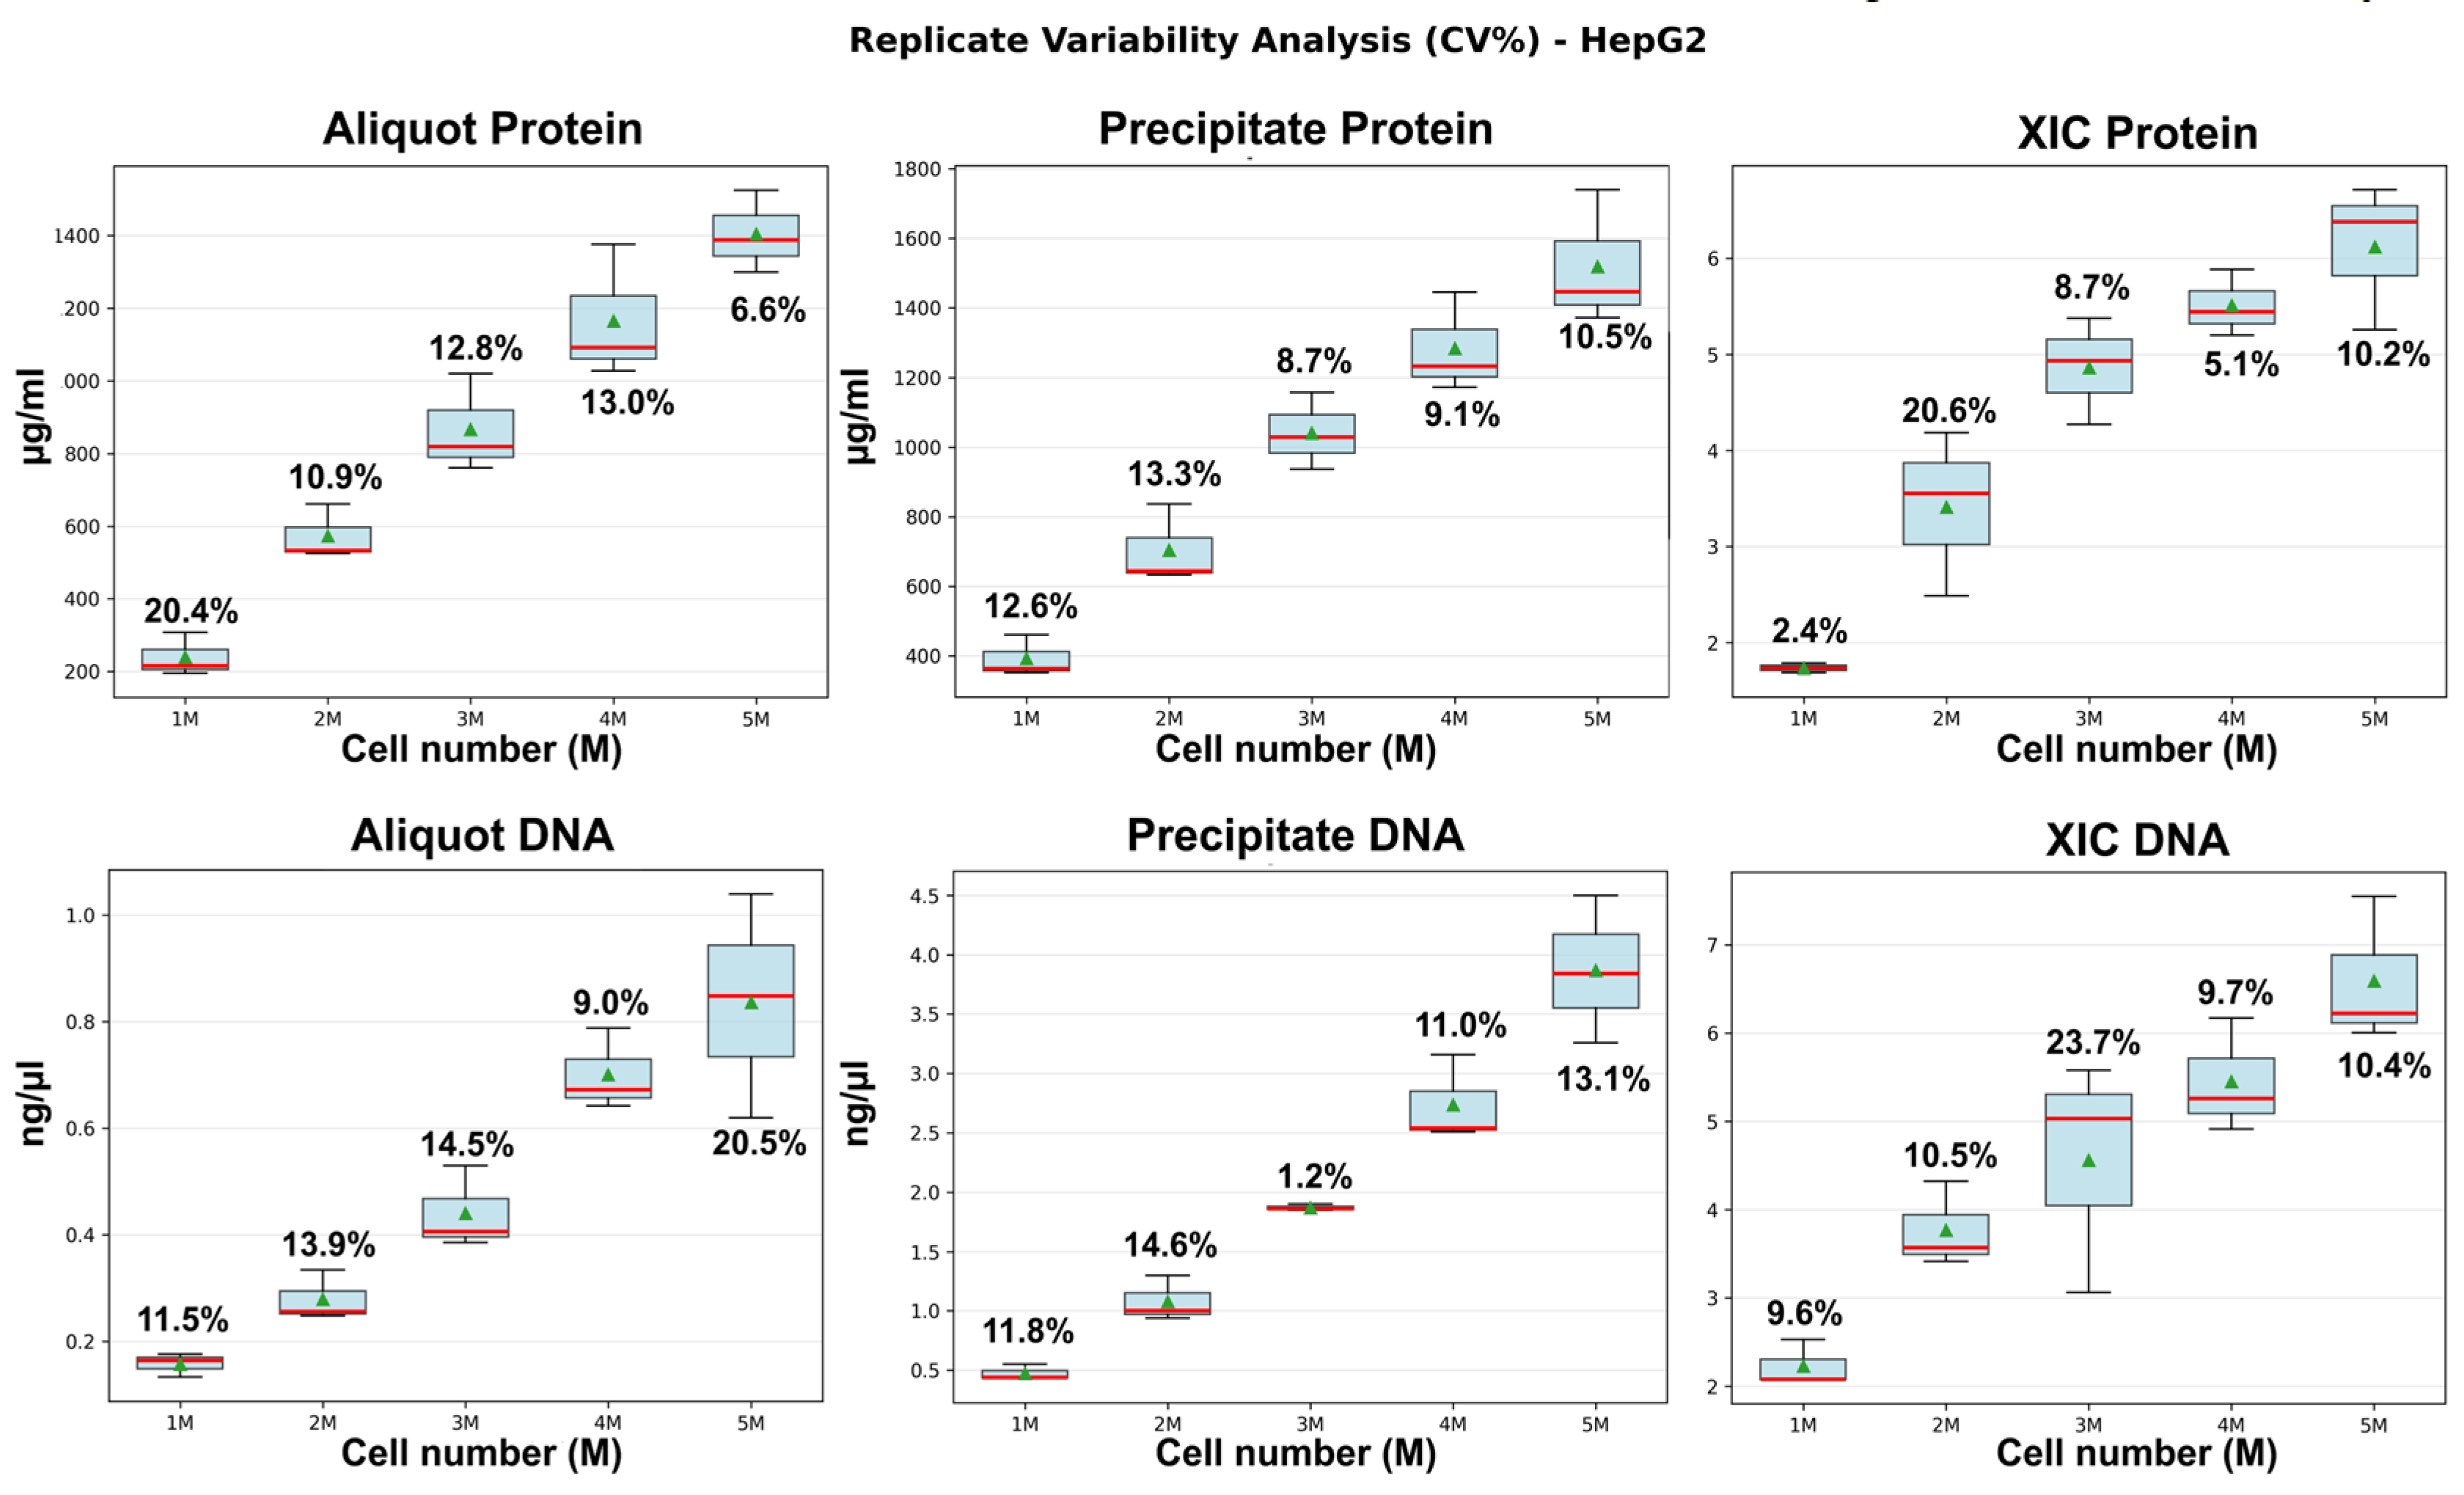
As shown in
Figure 6, coefficients of variation were markedly lower when protein and DNA levels were quantified from the post-extraction cellular precipitate, remaining within 15% for both protein and DNA. XIC, in contrast, exhibited the highest variability, exceeding 20% at certain biomass levels—likely because this metric captures not only differences in biological material quantity but also sample-to-sample variation in metabolomic composition introduced by the deliberate biological heterogeneity in this experimental design.
These findings further support the superior robustness of precipitate-based normalization over XIC under conditions of biological variability.
Across the full metabolite set, the same leading trends were maintained: precipitate-based normalization yielded high correlations for a greater fraction of metabolites compared with the alternative strategies.
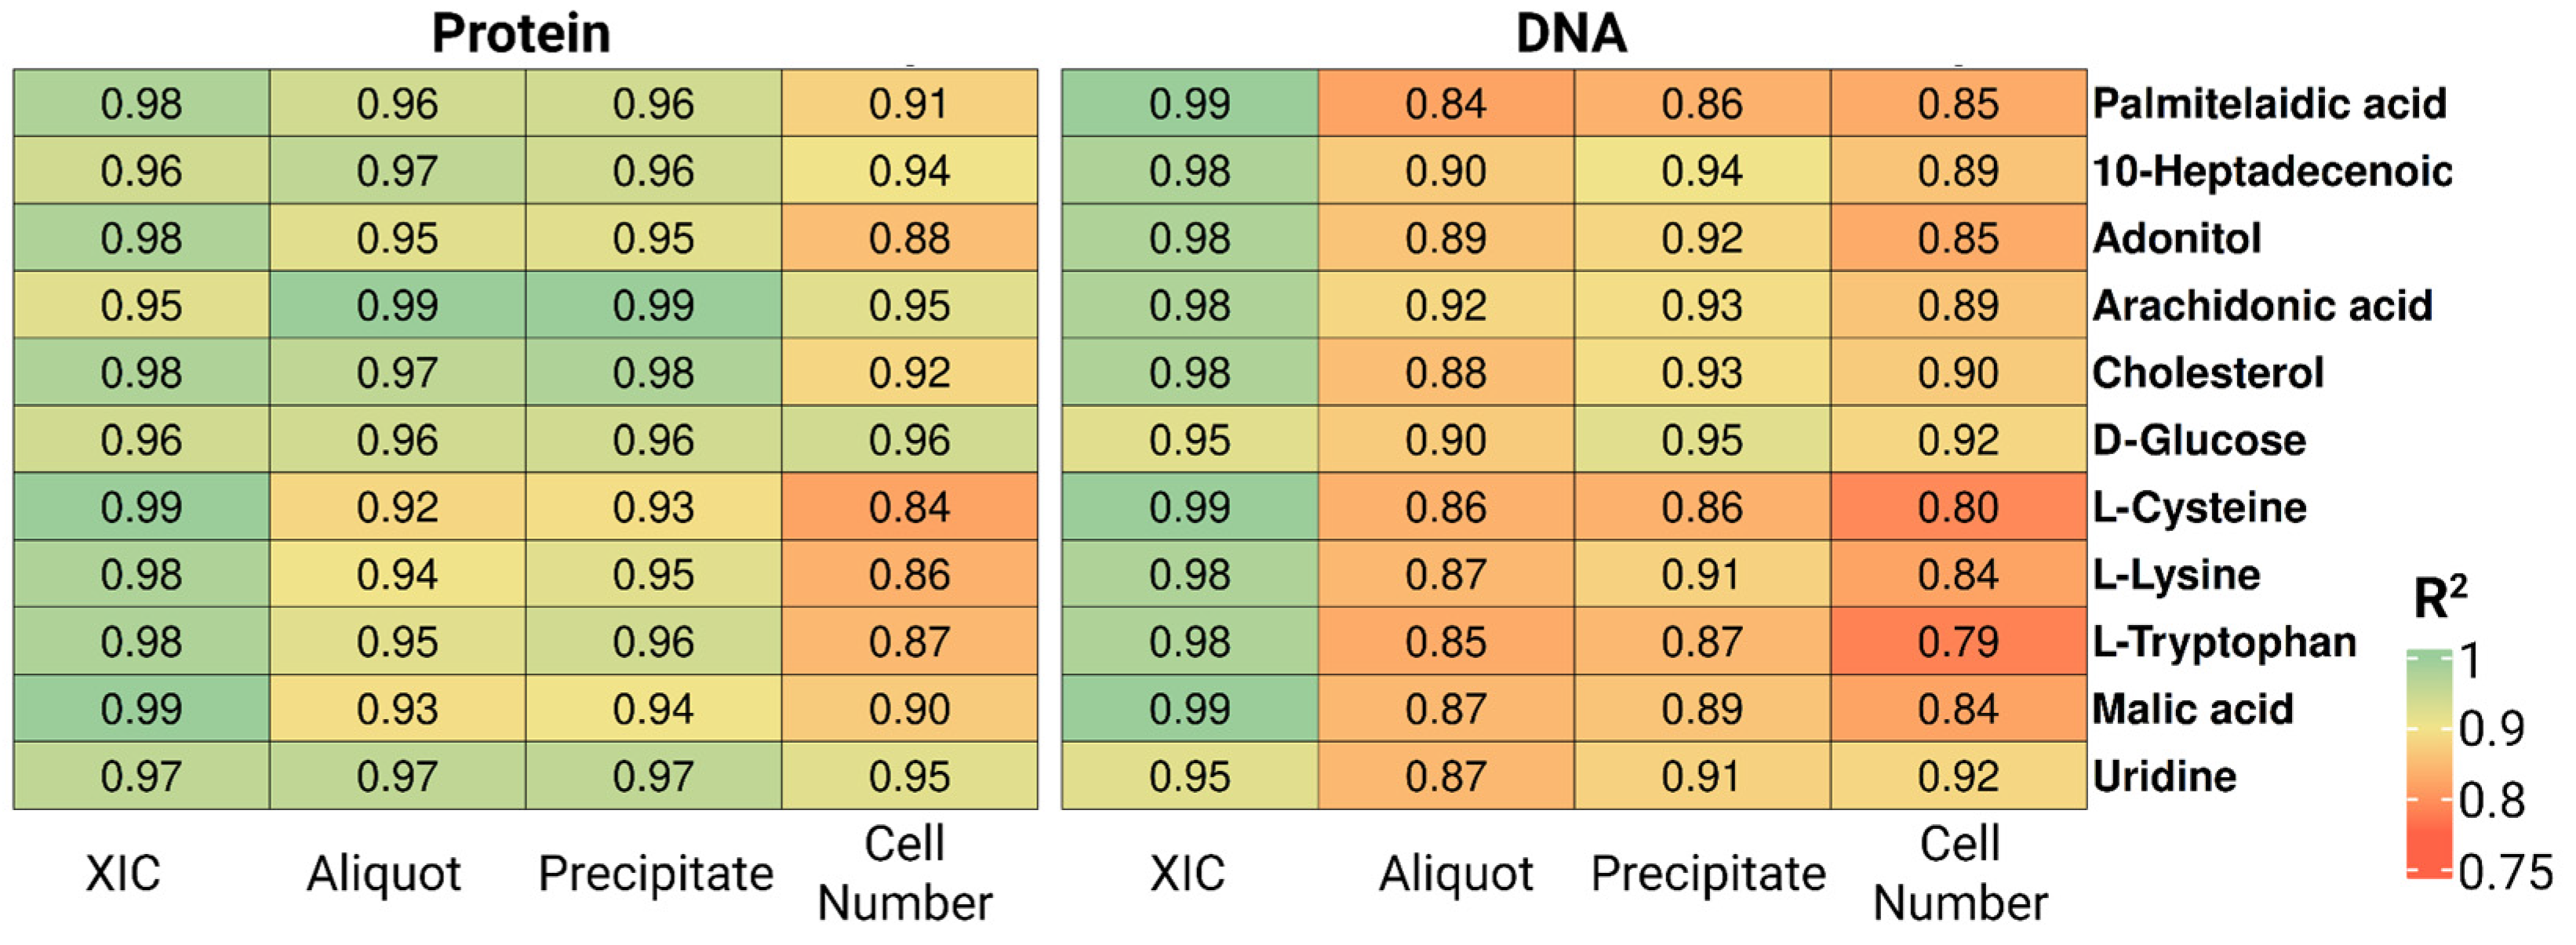
From a correlation perspective, all protein-based normalization approaches in this experiment yielded strong associations between the normalization factor and metabolite signal intensity, with R
2 values of 0.90–0.99 for the majority of metabolites (
Table 5,
Figure 7). At the same time, DNA-based normalization showed a marked decline in correlation performance relative to the experiment conducted without biological variability, suggesting greater susceptibility to confounding effects and raising questions about its reliability in real biological samples. Notably, DNA-based normalization yielded higher average coefficients of variation for normalized metabolite signals than protein-based approaches (26% vs. 20%). For both protein and DNA, aliquot-based quantification produced lower CVs than precipitate-based quantification (protein: 19.5% vs. 21.2%; DNA: 22.7% vs. 29.8%), a pattern that held consistently across the selected metabolites (
Table 6). Protein-based methods additionally maintained superior overall reproducibility. In the experiment incorporating biological variability, cell count-based normalization consistently underperformed relative to protein-based approaches, yielding both higher CVs and lower R
2 values. We attribute this to inaccuracies in cell quantification, which are likely amplified under less controlled experimental conditions.
Variability was predominantly driven by samples containing low amounts of biological material. Specifically, for samples comprising 3–5 million cells normalized to total precipitate protein, the mean CV was 8%, which is 13 percentage points lower than that calculated across all five loading groups. A similar trend was observed across all other normalization strategies. Together, these findings indicate that normalization performance deteriorates at low cell concentrations in suspension, regardless of the method applied.
When controlled but non-zero biological variability was introduced across independently cultured HepG2 populations, all biomass-derived metrics—protein, DNA, XIC, and cell count—remained strongly linear with nominal cell number, confirming the stability of the analytical workflow over a broad dynamic range. Quantitative performance nevertheless differed between normalization strategies: biopolymer-based metrics derived from the post-extraction pellet yielded lower CVs and a greater proportion of metabolites with R2 > 0.9, whereas XIC and cell count proved more sensitive to metabolic heterogeneity and counting inaccuracies. Among individual approaches, aliquot-based protein and DNA measurements generally minimized dispersion, while pellet-derived protein offered a favorable balance between robustness at higher biomass loads and resilience to biological variability. All methods showed reduced performance at low cell numbers. Taken together, under realistic conditions with moderate biological heterogeneity, protein-based normalization—whether from aliquots or pellets—represents the most reproducible and broadly applicable scaling basis for GC × GC-MS metabolomic data from adherent HepG2 cells, while DNA- and cell count-based metrics demand stricter control of assay precision and counting accuracy.




 ,
,