Review

NMR Studies on Protein–Ligand Interactions

1
School of Life Sciences, Tsinghua University, Beijing 100084, China
2
Technology Center for Protein Sciences, Tsinghua University, Beijing 100084, China
*
Author to whom correspondence should be addressed.
Int. J. Mol. Sci. 2026, 27(17), 7561; https://doi.org/10.3390/ijms27177561
Submission received: 25 June 2026 / Revised: 27 July 2026 / Accepted: 28 July 2026 / Published: 24 August 2026
(This article belongs to the Special Issue Biochemistry and Biophysics Tools for Peptide and Protein Research)

Abstract

Protein–ligand interactions are fundamental to physiological processes and drug discovery. Based on the types of information on protein–ligand interactions provided by nuclear magnetic resonance (NMR) experiments, these NMR experiments can be categorized into three distinct classes: (i) molecular-level qualitative binding detection, (ii) residue-level mapping of binding interfaces, and (iii) atomic-level structure determination and conformational dynamics of protein–ligand complexes. This hierarchy enables a workflow that accelerates the progression from initial binding identification to structural and dynamic characterization. In this review, we discuss how these experiments characterize molecular recognition. Notably, the term “ligand” in this article refers exclusively to small molecules.

1. Introduction

Advances in metabolomics continue to identify new metabolites that are involved in physiological regulation [1]. Concurrently, artificial intelligence (AI)-driven virtual screening enables the exploration of chemical compound libraries that far exceed the size of traditional high-throughput screening collections [2]. These advances have provided new insights into protein–ligand interactions, bringing both opportunities and challenges: numerous small molecules ranging from metabolites to drug candidates require experimental characterization to validate their binding to proteins of interest. Determining whether and how these small molecules interact with target proteins is therefore critical. Many techniques have been developed to address this need, including isothermal titration calorimetry (ITC), surface plasmon resonance (SPR), and others [3,4]. Over the past few decades, driven by cryogenic NMR probe technology, NMR has emerged as a powerful tool for investigating protein–ligand interactions. It is capable of detecting and characterizing binding events across a wide affinity range, extending from millimolar to nanomolar dissociation constants (Kd) [5,6,7].
According to the types of information on protein–ligand interactions derived from NMR experiments, NMR provides a continuous view of molecular recognition that bridges qualitative screening and atomic-resolution structural and dynamic descriptions of protein–ligand interactions. This multi-scale capability is manifested across three levels:
First, at the molecular level, NMR serves as a rapid and sensitive filter to address the most fundamental question: do two specific molecules (protein and ligand) interact? This capability is primarily realized through three types of ligand-observed NMR experiments, including saturation transfer difference (STD), water–ligand observed via gradient spectroscopy (WaterLOGSY), and relaxation-based approaches such as spin–lattice relaxation in the rotating frame (T) and Carr–Purcell–Meiboom–Gill (CPMG) experiments [8,9,10]. Ideally suited for screening compound mixtures with minimal protein consumption, these techniques collectively offer a rapid and reliable strategy to discriminate binders from non-binders.
Second, at the residue level, NMR not only addresses the fundamental question of whether a specific protein–ligand interaction exists but also identifies which residues are involved in the binding interfaces. NMR maps binding interfaces by monitoring changes in the protein itself. A commonly used experiment is the 1H-15N heteronuclear single quantum coherence (HSQC), which detects binding-induced chemical shift perturbation (CSP) to characterize interaction sites [11]. For challenging systems such as large macromolecular complexes or membrane proteins that exceed the limits of conventional 1H-15N HSQC, site-specific labeling strategies are essential [12,13]. 13C-methyl labeling serves as a protein-observed approach for intractable protein–ligand interactions [14]. Due to its exceptional sensitivity and lack of background signals, 19F NMR enables application in both protein-observed and ligand-observed modes [15]. Together, these two site-specific labeling strategies play important roles in studies on protein–ligand interactions, particularly in research related to G protein-coupled receptors (GPCRs) [16,17].
Finally, at the atomic level, NMR not only confirms the existence of specific interactions and maps their interfaces but also elucidates the precise molecular recognition mechanisms. To achieve this, NMR facilitates the determination of three dimensional solution structures of protein–ligand complexes [18]. This step provides a detailed structural model of the recognition interface, while NMR simultaneously captures conformational dynamics, collectively converting qualitative binding data into mechanistic insights.
Herein, by integrating these hierarchical and progressive experiments, we elucidate how these methodologies work to confirm and characterize protein–ligand interactions. These approaches constitute an indispensable toolkit for fully mapping the landscape of protein–ligand interactions. We note that this review focuses on the interactions between proteins and small-molecule ligands; interactions of proteins with other biomolecules, such as other proteins or nucleic acids, are equally important but involve distinct experimental considerations and are beyond the scope of this article.

2. Ligand-Observed NMR: Tools for Rapid Binding Detection

2.1. Saturation Transfer Difference (STD)

As a ligand-observed NMR experiment, STD is used to detect protein–ligand interactions with dissociation constants (Kd) ranging from millimolar to micromolar [8,19]. In the STD experiment, protein protons are selectively saturated by irradiating a spectral region that excludes ligand signals. This saturation spreads throughout the entire protein via dipole–dipole interactions, a process known as spin diffusion [20]. If the ligand binds to the protein, the saturation is transferred from the protein to the ligand protons. The bound ligand then dissociates into solution, carrying the saturated protons with it. The cycle of binding and dissociation between protein and ligand repeats during the STD experiment, leading to an accumulation of saturation on the ligand. Thus, a critical requirement for the STD experiment is that the 1H NMR signals of the ligand and the protein do not overlap in the spectral region where selective saturation is applied [19].
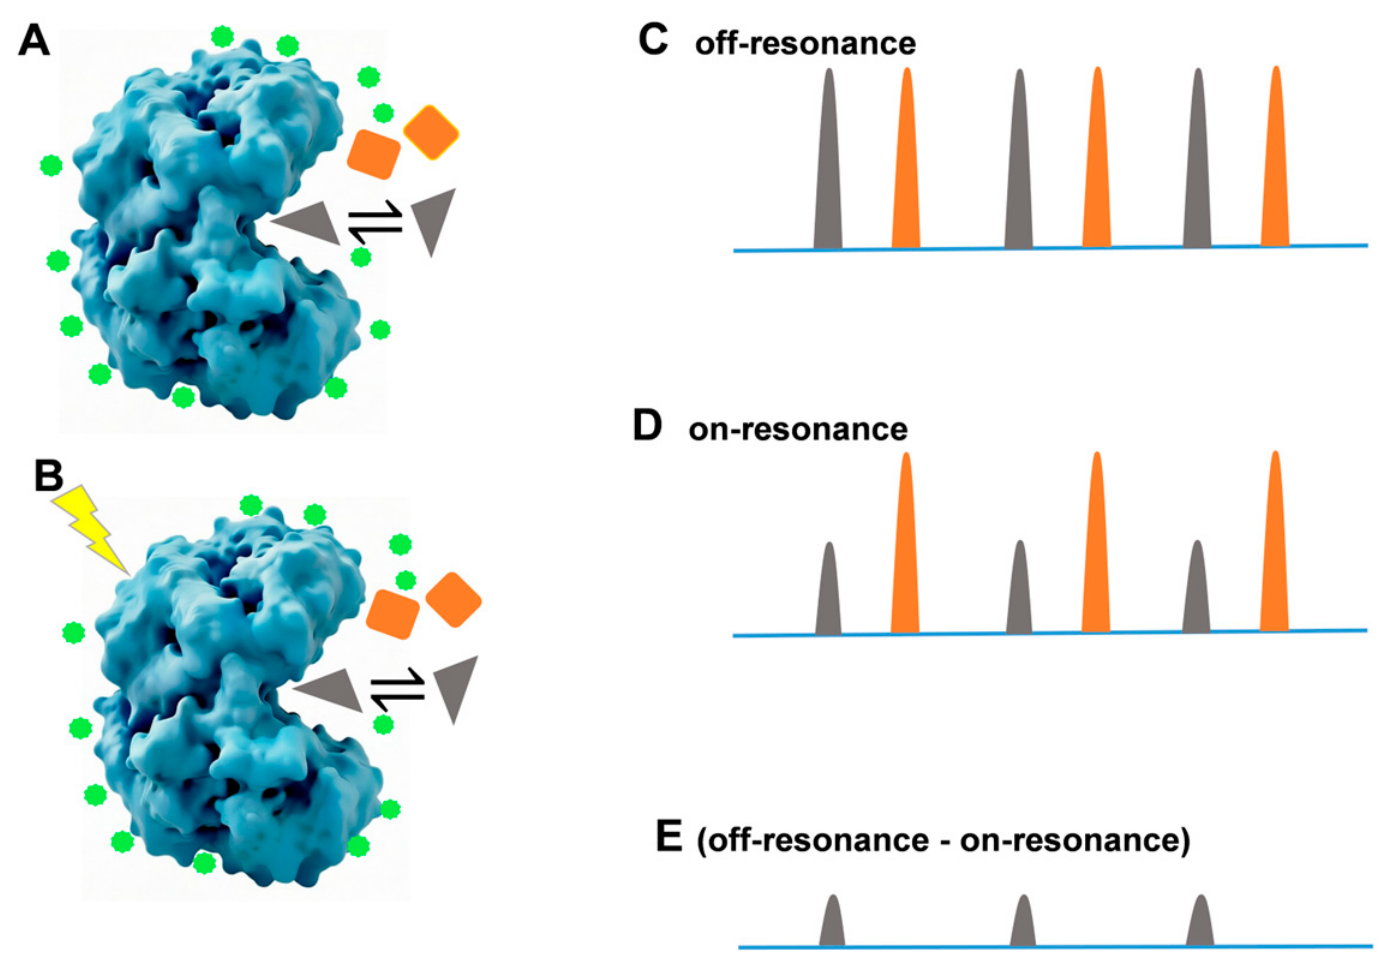
The STD experiment consists of two interleaved scans. One is the on-resonance scan. The protein protons are irradiated, resulting in signal attenuation for the bound ligand in the STD experiment. The other is the off-resonance scan. The saturation pulse is applied far from any resonances, providing a reference spectrum with full signal intensity for all compounds. The difference spectrum (off-resonance spectrum minus on-resonance spectrum) reveals signals only from molecules that bind to the target protein, whose protons are in close contact with the protein. These bound compounds receive more saturation and thus show stronger signals in the STD difference spectrum (Figure 1).
The STD experiment has been demonstrated to be highly sensitive, requiring as little as 1 nmol of protein and remaining effective for targets with molecular weights greater than 10 kDa [20]. In practice, protein concentrations are generally in the range from 20 to 50 μM, and the molar ratio of the ligand to the target protein is typically maintained between 10:1 and 100:1 [8,21]. Depending on the specific system and observed signal intensity, both the protein concentration and the ligand-to-protein ratio can be adjusted. Regarding sample conditions, either 100% D2O or 90% H2O/10% D2O buffers are acceptable. Using a 100% D2O sample requires lyophilization of the protein to exchange the solvent, which adds an extra preparation step compared to using a 90% H2O/10% D2O sample. Conversely, samples in 90% H2O/10% D2O require effective water suppression techniques during NMR data acquisition to eliminate the strong solvent signal.
In the STD pulse sequence, two critical parameters—the saturation time and the saturation power—must be carefully considered. On Bruker NMR spectrometers, saturation times are typically set between 2 and 5 s, while saturation power is typically set in the range from 40 to 60 dB. Theoretically, increasing the saturation time and applying higher saturation power should maximize the transfer of magnetization from the protein to the ligand, thereby enhancing the STD signals. However, careful optimization of saturation time and power is crucial. As demonstrated by Meyer and Mayer, utilizing low irradiation power and specific saturation times ensures selective protein saturation to avoid direct ligand excitation [20]. Furthermore, Xia et al. highlighted that power spillover from RF irradiation is a significant source of artifacts in STD experiments, particularly for smaller proteins [22]. Therefore, establishing optimal experimental conditions requires a balance between maximizing sensitivity and minimizing artifacts. In practice, the optimal saturation time and saturation power can be determined using control samples containing the ligand in the absence of proteins. In the STD experiment, intramolecular spin diffusion within the bound ligand can propagate magnetization from the binding interface to distant protons. Consequently, protons in non-binding regions of the ligand may also become saturated, which can make it difficult to precisely identify the binding site on the ligand, especially at long saturation times.

2.2. Water-Ligand Observed via Gradient Spectroscopy (WaterLOGSY)

The WaterLOGSY experiment is particularly well suited for detecting moderately to weakly binding ligands, typically with dissociation constants in the micromolar (μM) to low millimolar (mM) range [9]. WaterLOGSY is built upon the principle of the nuclear Overhauser effect (NOE). The sign of NOE signals is related to the molecular weight and tumbling rate of molecules. Generally, small molecules tumble rapidly in solution with short correlation times, whereas large biomolecules tumble slowly with long correlation times. Consequently, these two regimes exhibit opposite NOE behaviors. This fundamental dependence of NOE sign on molecular size forms the basis for applying WaterLOGSY to protein–ligand interactions [23].
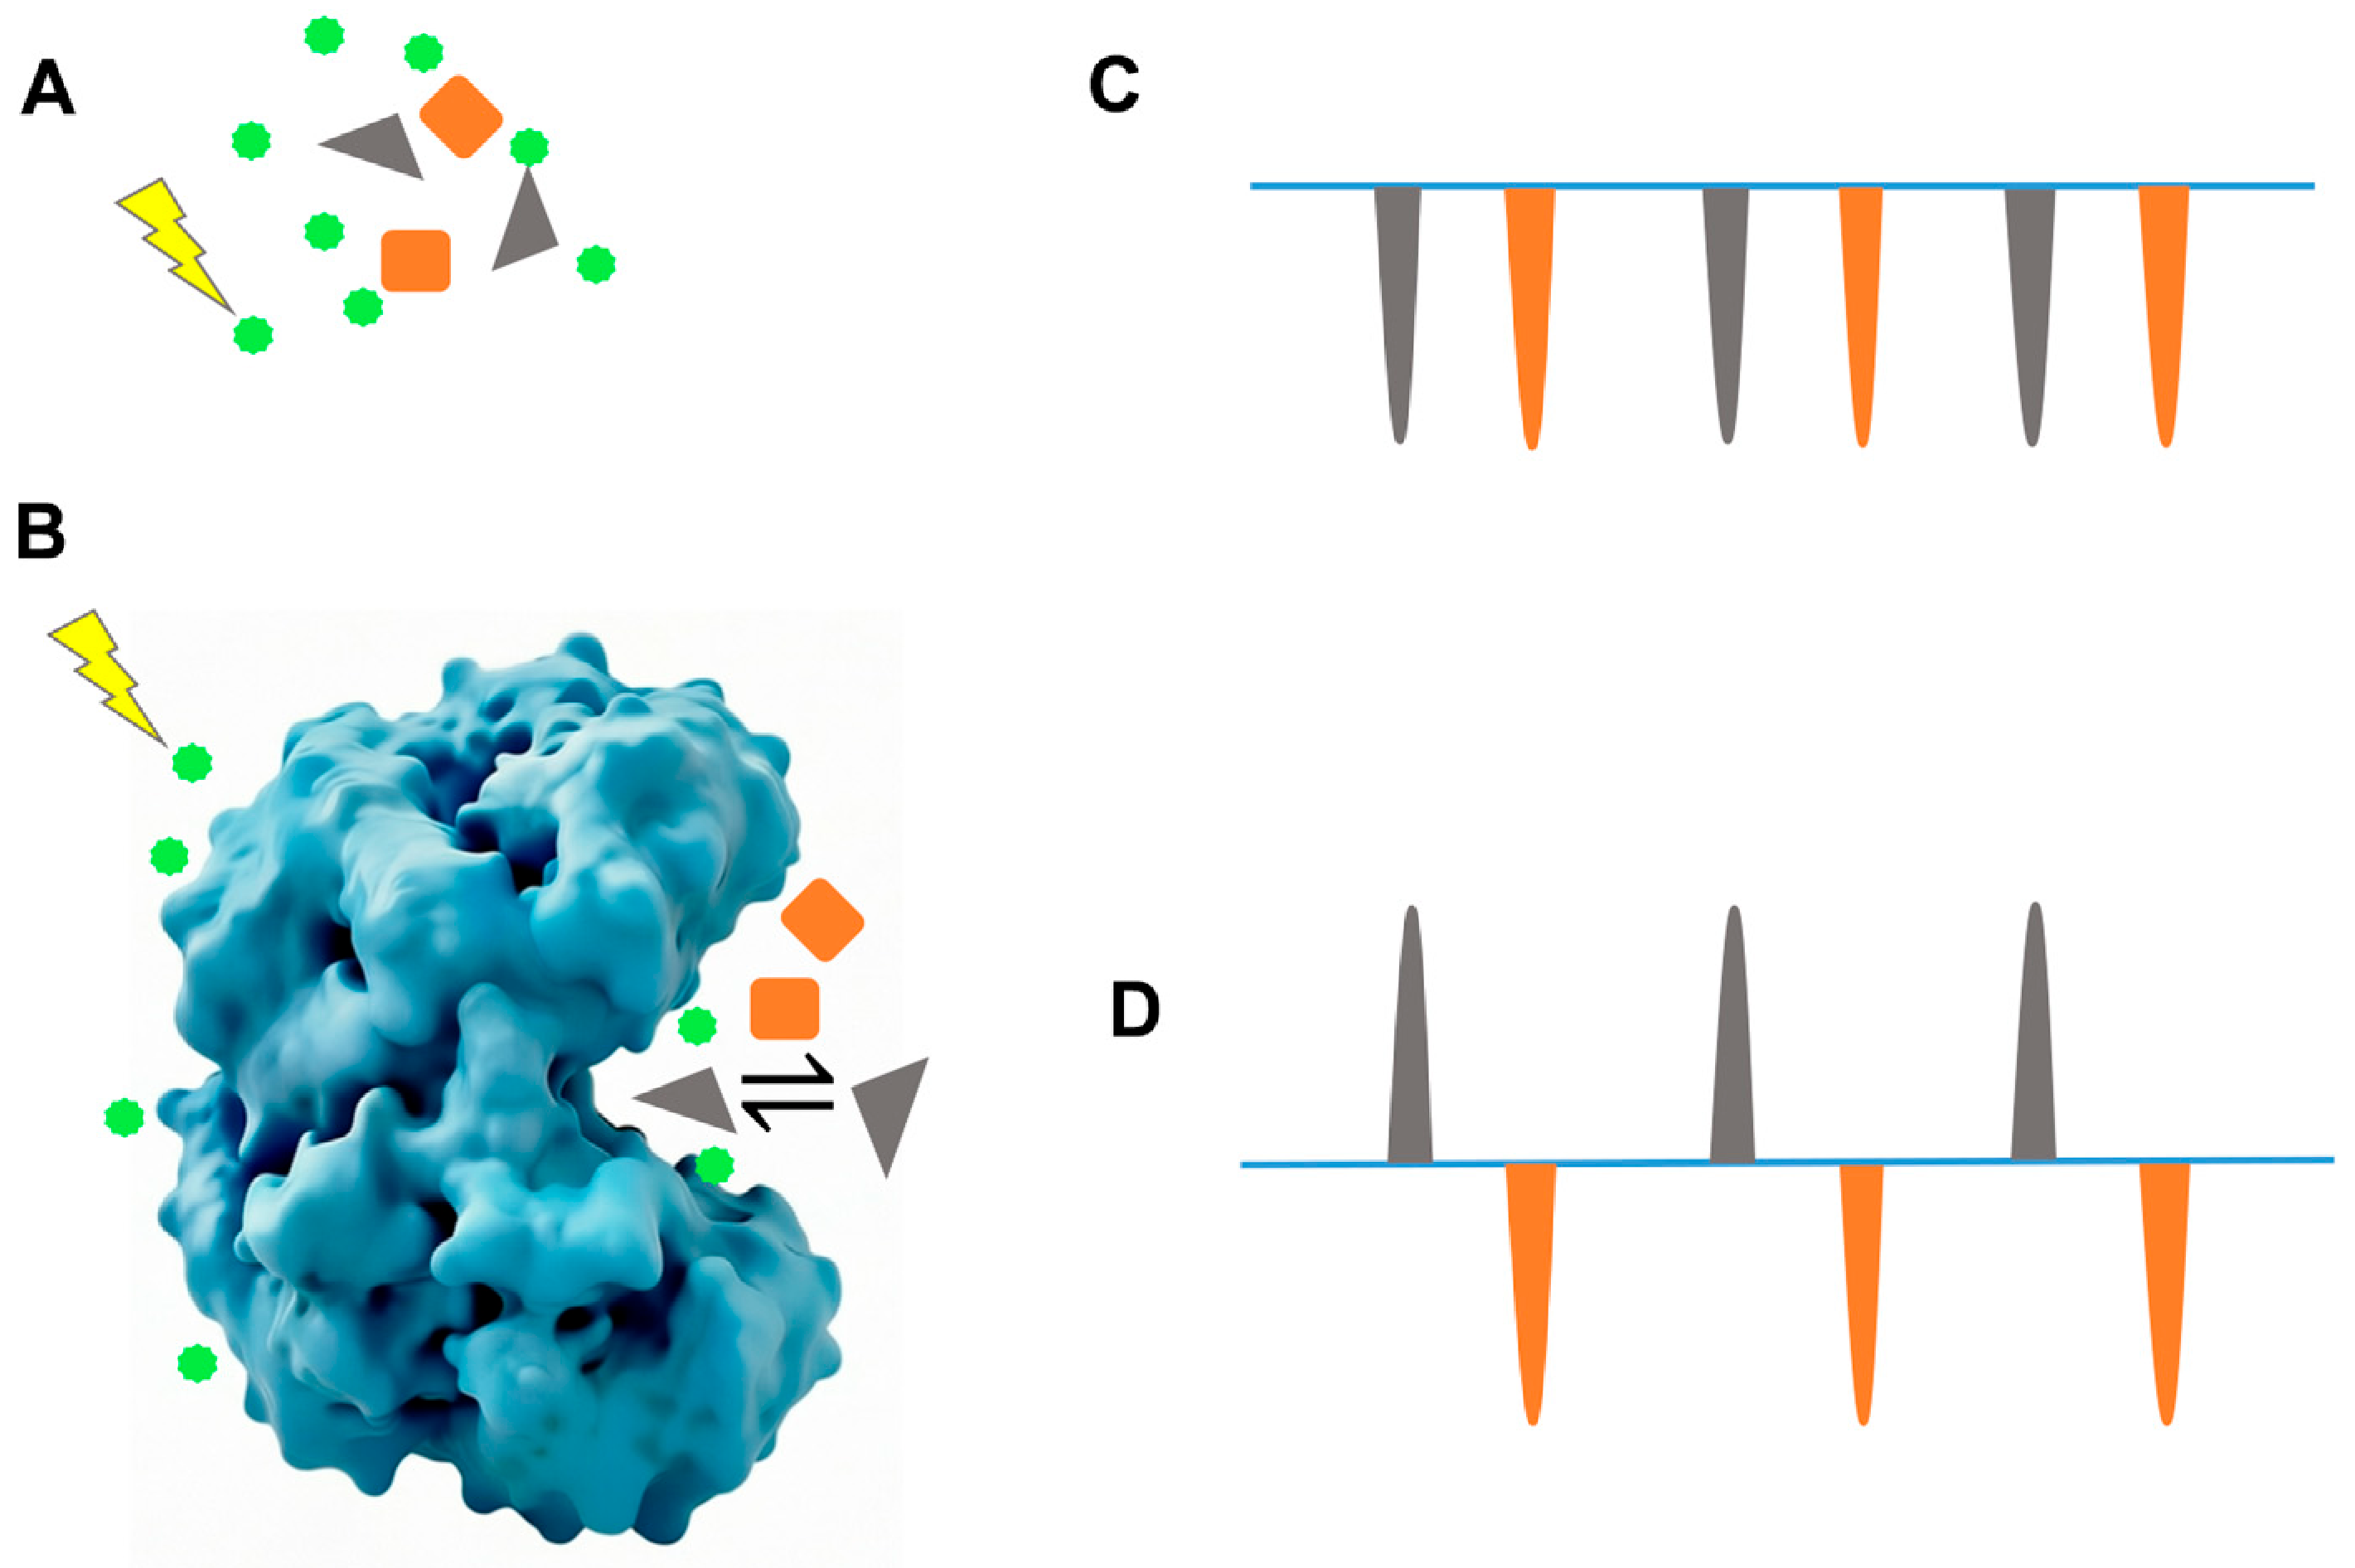
In the WaterLOGSY experiment, the magnetization of bulk water protons in the sample is selectively excited. This magnetization is subsequently transferred to small molecule ligand via two distinct pathways that show signals with opposite signs in the NMR spectrum [24]. If the ligand does not interact with the target protein in solution, it can interact directly with water molecules, and the excited magnetization is transferred directly from water to the free ligand via the NOE. Due to the fast tumbling of the free small molecule in solution, this direct NOE transfer is typically displayed as a negative signal in WaterLOGSY spectra. When a ligand binds to a protein, the excited magnetization is first transferred from water to the protein. Subsequently, it is transferred from the protein to the ligand occupying the binding site. In addition, water molecules that are bound to the protein surface (ordered water) can also participate in magnetization transfer. These bound water molecules tumble at a rate similar to the protein and can relay magnetization from the protein to the ligand or directly to the ligand via the NOE and may also exchange magnetization through chemical exchange with exchangeable protons on the protein or ligand [9]. Upon binding to the protein, the ligand’s tumbling rate becomes comparable to that of the slowly tumbling macromolecule. Under these slow tumbling conditions, the resulting NOE signal is conventionally displayed as a positive signal (Figure 2).
In practice, two sets of measurements are typically performed: a reference experiment containing only the ligand (without protein) and a screening experiment containing both the protein and the ligand. If a ligand’s signal undergoes a clear inversion from negative to positive upon the addition of the protein, it indicates that the ligand interacts with the protein. If the signal remains negative, it suggests that the ligand does not bind. It should be noted that in WaterLOGSY experiments, the observed signal of a bound ligand represents an average of the opposing NOE arising from the free and bound states [25]. This averaging means that when the free and bound contributions are similar in magnitude, the net signal can become very weak. In practice, if a ligand shows little or no signal in the screening experiment (compared to the reference), it may be due to this averaging effect rather than to poor solubility or weak binding. To test this, additional experiments with varying ligand-to-protein ratios are recommended. Changing the ligand concentration perturbs the equilibrium, altering the weighted average and allowing for the expected positive (binding) or negative (non-binding) signals to appear.
To facilitate selective excitation of the water protons, samples are generally prepared in solvent mixtures containing 90% H2O/10% D2O (or with an even lower D2O content). The protein concentration employed in WaterLOGSY measurements is generally in the low micromolar range (10 to 100 μM) and the ligand is typically in 25- to 100-fold excess relative to the protein concentration [9]. The mixing time for NOE buildup is usually set to 0.8 s.

2.3. Relaxation-Based Methods

In contrast to magnetization transfer techniques such as WaterLOGSY and STD, relaxation-based NMR methods including spin–lattice relaxation time in the rotating frame (T) and Carr–Purcell–Meiboom–Gill (CPMG) experiments, rely on changes in the intrinsic relaxation properties of the ligand upon binding [26]. Despite their different mechanisms, these strategies share a common physical foundation: the profound influence of molecular tumbling on NMR relaxation parameters.
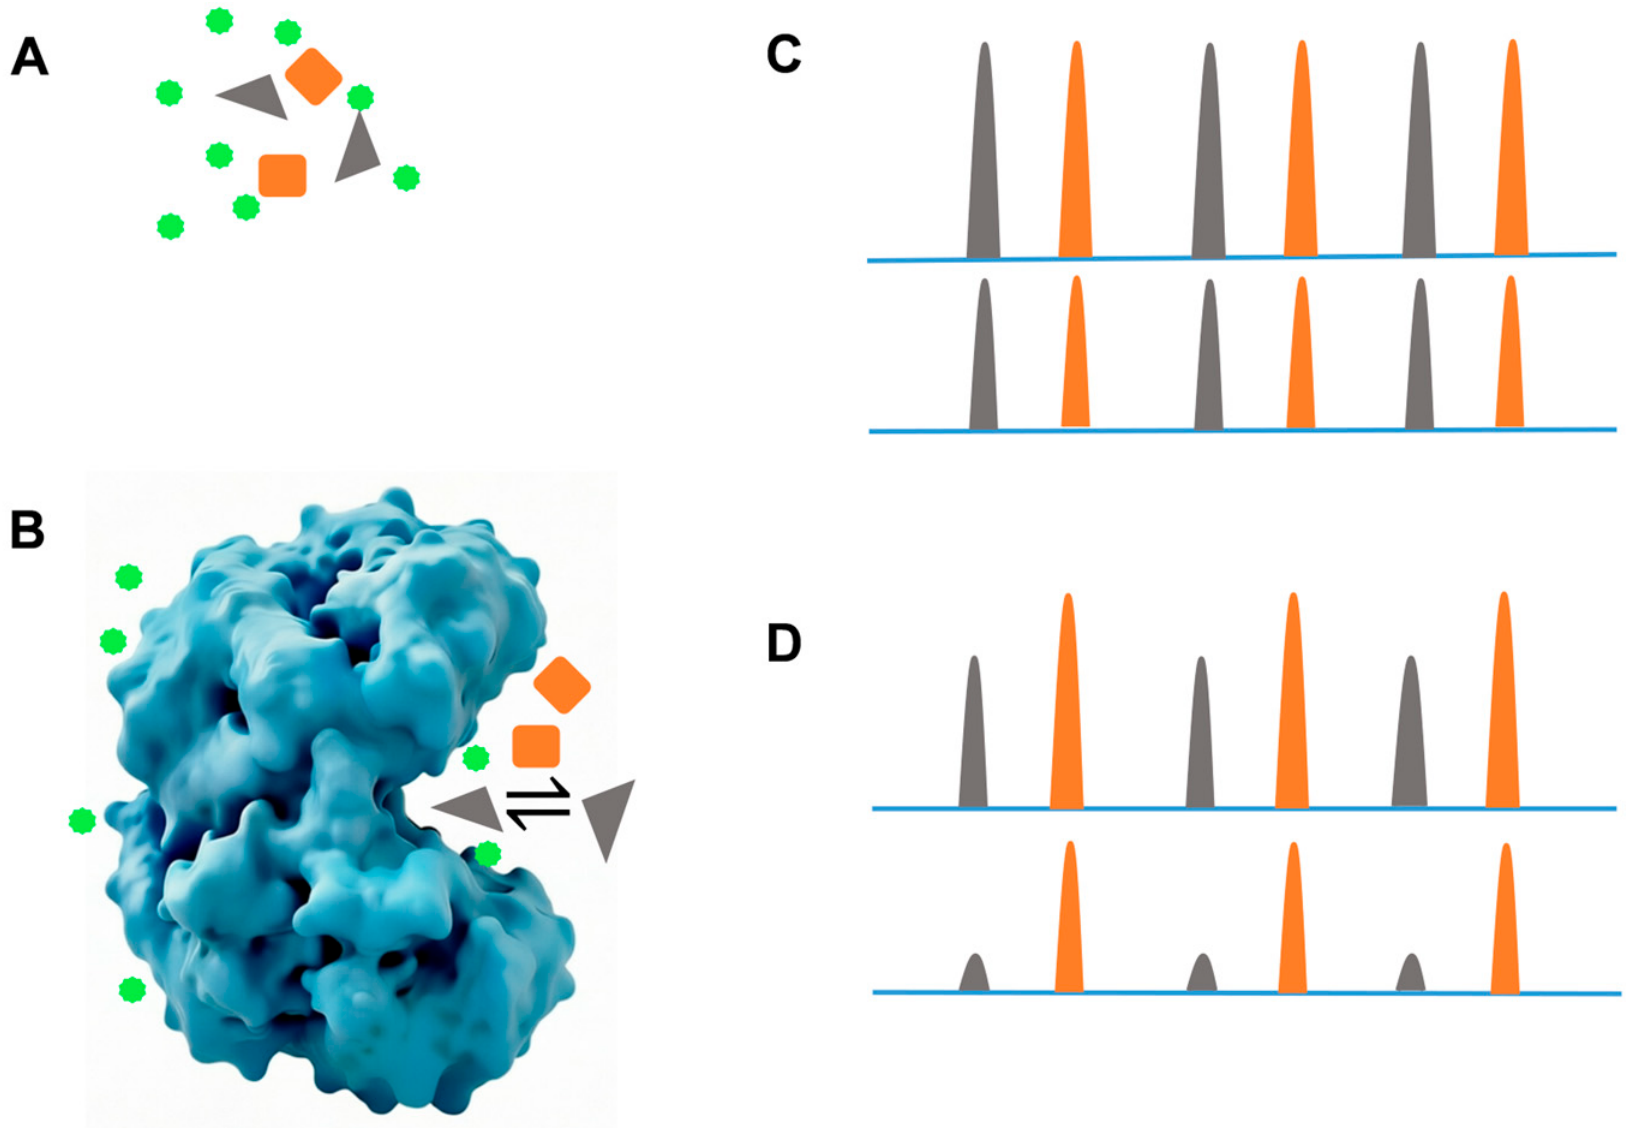
The T experiment exploits the dependence of spin–lattice relaxation in the rotating frame on molecular tumbling. In solution, small organic molecules tumble rapidly, characterized by a short rotational correlation time. Conversely, when a small molecule ligand binds to a large protein, the effective molecular weight of the complex increases dramatically. This slows the overall tumbling rate of the ligand nuclei, leading to a significantly longer rotational correlation time. In this slow tumbling regime, the efficiency of T relaxation is greatly enhanced, causing the ligand’s NMR signals to decay rapidly, and resulting in significant line broadening. This binding-induced acceleration of relaxation forms the fundamental basis for T-based binding assays (Figure 3) [27].
The CPMG experiment measures the transverse relaxation rate (R2), a parameter highly sensitive to molecular tumbling. In the free state, rapidly tumbling small molecules experience inefficient transverse relaxation, characterized by long transverse relaxation times (T2). Conversely, upon binding to a macromolecular target, the ligand’s effective rotational correlation time increases significantly. This retardation of molecular motion markedly enhances transverse relaxation efficiency, thereby shortening the T2. The CPMG pulse sequence employs a train of refocusing pulses to attenuate signals based on their T2 characteristics, effectively acting as a filter that suppresses signals from slowly tumbling complexes with short T2 values. Consequently, ligands that interact with the protein exhibit marked signal attenuation in CPMG spectra compared to their free state, providing a robust method for identifying binders [26,28].
Both T and CPMG experiments rely on the modulation of a ligand’s relaxation rates by molecular dynamics upon binding to a target macromolecule. While T utilizes a continuous spin-lock field in the rotating frame to probe these dynamics, CPMG achieves a similar filtering effect in the laboratory frame through discrete refocusing pulses. Although distinct in their implementation and sensitivity profiles regarding chemical exchange, both methods serve as powerful tools for detecting ligand–protein interactions.
In practice, NMR spectra of the ligand are first recorded in the absence of the target protein at two representative spin-lock durations, for example, 10 ms and 200 ms. Then, spectra of the same ligand in the presence of the target protein under identical spin-lock conditions are collected. In both cases, signal attenuation is observed at longer spin-lock durations due to intrinsic relaxation. However, if the ligand interacts with the protein, its T is significantly shortened, resulting in a greater reduction in NMR signal intensity compared to the control ligand without interaction. By comparing the signal intensity decay under these two conditions, whether a ligand binds to the target protein can be readily distinguished. An analogous workflow applies to CPMG experiments. Spectra for the ligand in the absence and presence of protein are acquired with a T2 filter of approximately 400 ms. The ligand binding-induced signal attenuation can then be identified.
Sample conditions for T and CPMG experiments are similar to those for STD and WaterLOGSY. T and CPMG experiments can adopt either 90% H2O/10% D2O or 100% D2O buffers. Compared with STD and WaterLOGSY, a critical distinction arises when detecting tightly binding ligands, such as those with nanomolar dissociation constants. Under conditions with a large molar excess of ligand, the limited protein binding sites become rapidly saturated. The majority of the ligand remains in the free state, causing the observed NMR signal to be dominated by unbound ligands. This phenomenon can lead to false negative results. To overcome this limitation, the ligand-to-protein ratio must be reduced, for example, to approximately 1:1. Under this condition, the observed tight binding ligand signals adopt the characteristics of the slow-tumbling protein–ligand complex and become significantly broader and attenuated. In T and CPMG experiments, this distinct transition from sharp to broad signals serves as direct and robust evidence of high affinity binding.
STD, WaterLOGSY, and relaxation-based methods (T or CPMG) are not subject to protein molecular weight restrictions, and their performance improves with increasing molecular weight. In practice, these methods are routinely used in combination to provide robust validation of protein–ligand interactions, significantly reducing the risk of both false positive and false negative conclusions. This combined strategy is therefore highly effective for drug screening, typically achieving a throughput of 5–10 compounds per protein sample.

3. Protein-Observed NMR: Strategies for Residue-Level Interface Mapping

3.1. 1H-15N Heteronuclear Single Quantum Coherence (HSQC)

As a protein-observed experiment, the 1H-15N HSQC experiment fundamentally utilizes heteronuclear scalar couplings to facilitate magnetization transfer, enabling the detection of low-sensitivity nuclei such as 15N via the high-sensitivity proton (1H). In the 1H-15N HSQC spectrum, one dimension corresponds to the 1H chemical shift, while the other dimension represents the 15N chemical shift. The basic pulse sequence comprises three critical components: an INEPT (Insensitive Nuclei Enhanced by Polarization Transfer) module that transfers magnetization from 1H to 15N; an evolution period during which the 15N chemical shift evolves; and a reverse INEPT module that transfers magnetization back from 15N to 1H for detection [29].
For well-folded proteins, the 1H-15N HSQC spectrum exhibits a highly dispersed distribution of peaks, reflecting the diverse local environments experienced by amino acid residues. In the 1H-15N HSQC spectrum, each cross peak corresponds to an amide group on the protein backbone with the exception of proline, alongside contributions from the side-chain amide groups of asparagine and glutamine, and the indole NH of tryptophan. Every amino acid in the protein sequence serves as a distinct probe capable of reporting changes in its local environment. Upon ligand binding, alterations in chemical shifts or signal intensities occur for residues near the binding interface, making this method applicable for characterizing protein–ligand complexes across a broad range of binding affinities (μM-nM) [11].
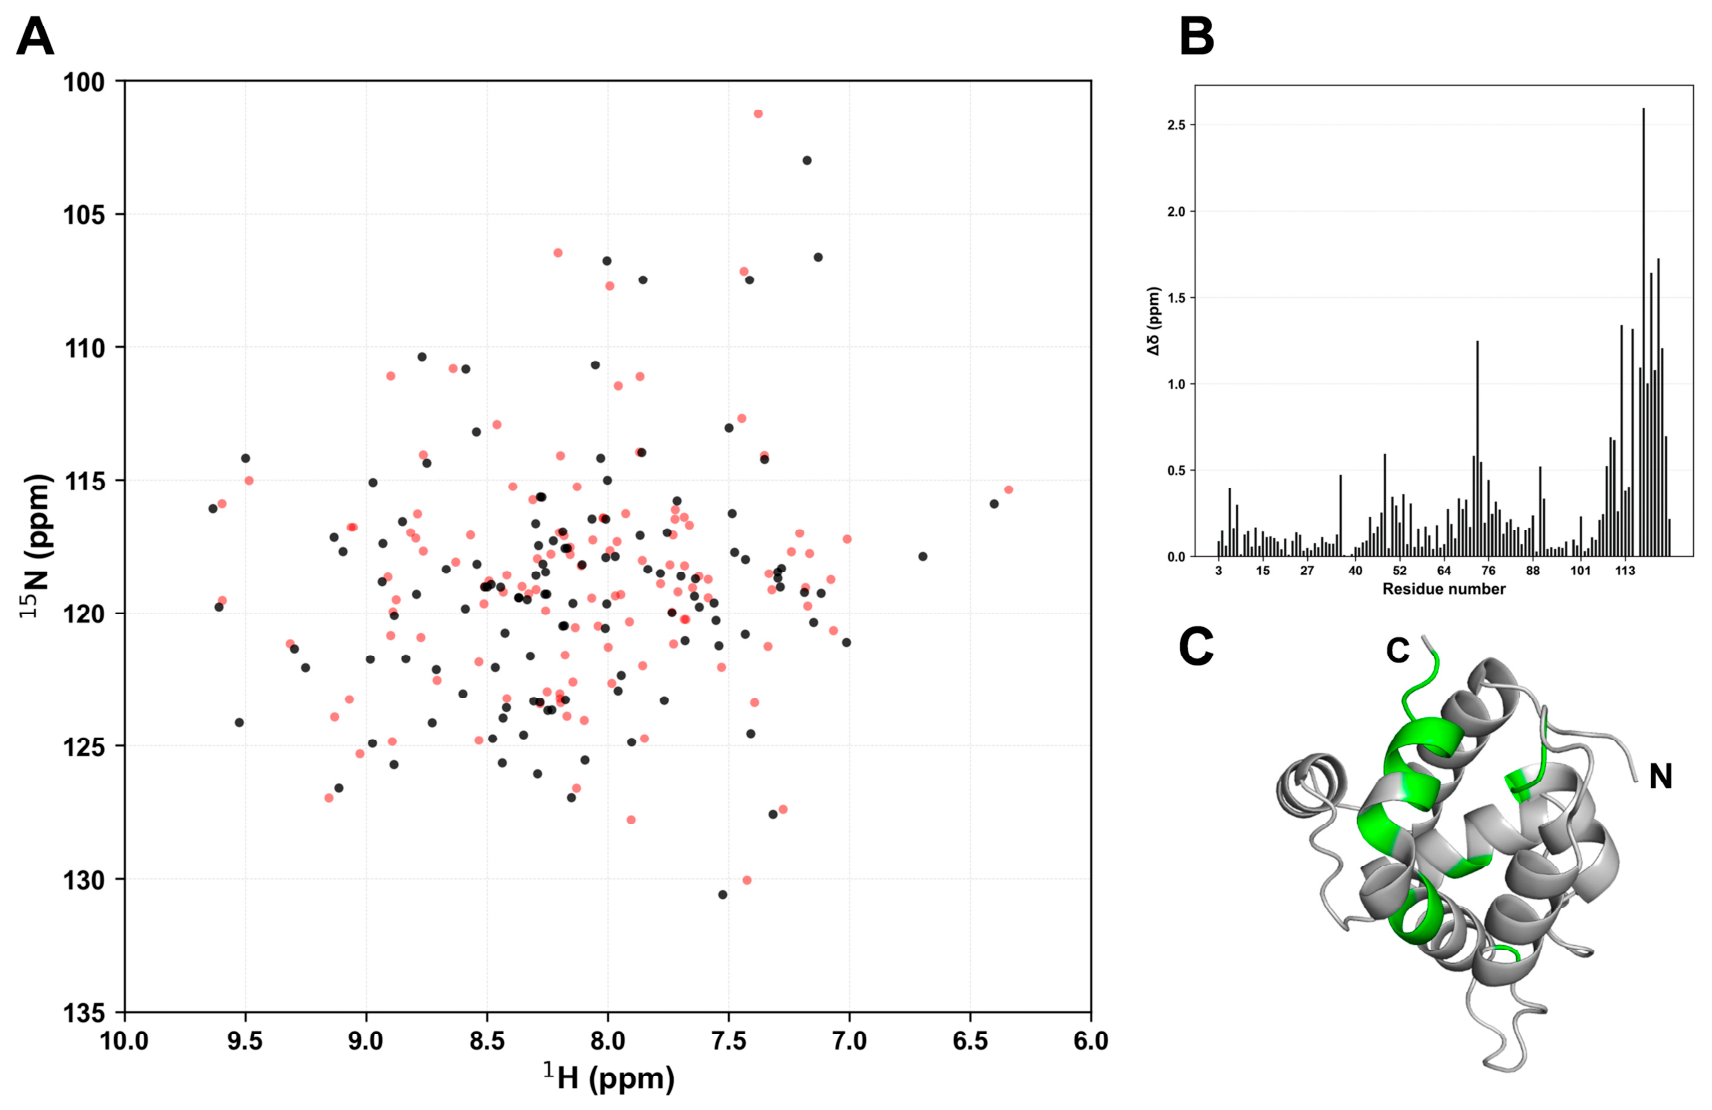
Chemical shift perturbation (CSP) is widely used in biological research. A series of 1H-15N HSQC spectra are acquired throughout the titration using a 15N-labeled protein concentration as low as 20 μM. For each titration point, following backbone assignment, peak positions are precisely quantified, and the combined chemical shift perturbation (Δδ) is calculated (Figure 4) [30,31]. By mapping the residues with chemical shift changes onto the three-dimensional structure of the protein, identifying which residues are affected by protein–ligand interaction is straightforward. Moreover, when the exchange between free and bound states is fast on the NMR chemical shift timescale, the concentration-dependent changes in chemical shift can be analyzed in two steps. Initially, individual fitting of the titration data for each affected residue provides a set of residue-specific apparent Kd values; mutual consistency among these values within experimental error suggests a single-site binding model, whereas significant deviations may indicate multiple binding sites or allosteric effects. Subsequently, global fitting of all residues simultaneously to a single binding isotherm yields a highly accurate global dissociation constant, while the CSP magnitude of each individual residue reflects its local environmental response to ligand binding [11,32].
In addition to NMR chemical shift perturbation analysis, we should also focus on signal intensity changes in 1H-15N HSQC spectra upon titration. In HSQC titration experiments, the intensity of a cross peak is not merely a reflection of concentration but is modulated by the apparent relaxation properties of the nucleus, which are sensitive to molecular dynamics and binding kinetics. The most fundamental information derived from intensity changes concerns the exchange regime on the NMR chemical shift timescale. The behavior of peak intensity during titration directly reports on the relationship between the kinetic rate constants and the chemical shift difference between the free and bound states [10,33].
Unlike ligand-observed methods, although CSP and intensity analyses are informative, the protein-observed 1H-15N HSQC is limited by protein size. For proteins larger than 30 kDa, spectral overlap and relaxation-induced line broadening severely attenuate signals [34,35]. Transverse relaxation-optimized spectroscopy (TROSY) reduces relaxation induced line broadening to improve spectral quality for these larger proteins [36]. However, TROSY is typically employed in conjunction with deuterated sample preparation, which increases the cost and sample preparation demands.

3.2. Site-Specific Labeling Strategies

For conventional 1H-15N HSQC, the upper limit is approximately 30 kDa for uniformly labeled proteins [34]. This barrier excludes a vast array of biologically important systems from routine analysis, including multi-domain proteins exceeding 30 kDa, and membrane proteins requiring detergent environments. Site-specific labeling strategies effectively overcome these molecular weight limitations, thereby enabling NMR characterization of large multi-domain proteins and membrane proteins [14,16,35]. Furthermore, this approach is applicable for characterizing protein–ligand interactions across a wide range of binding affinities, from weak (mM) to tight (nM) complexes [37,38].
In site-specific labeling strategies, 19F NMR offers distinct advantages that complement and extend beyond conventional approaches. The 100% natural abundance and high gyromagnetic ratio of 19F provide sensitivity approaching that of protons, enabling rapid data acquisition with simple pulse sequences [39]. While conventional heteronuclear NMR experiments on large proteins often require millimolar concentrations, 19F NMR can generate high-quality 1D spectra with protein concentrations as low as mid-micromolar [40]. The zero-background property means that spectra of fluorinated proteins exhibit no interfering signals from the surrounding environment. 19F can be applied to probe protein folding within the 2.5 MDa ribosome complex, facilitating the detection of transient folding intermediates [41].
In protein–ligand interaction studies, 19F NMR can be implemented through two complementary strategies: protein-observed approaches, where fluorinated reporters are incorporated into the target protein, and ligand-observed approaches, where fluorinated fragments or compounds are screened against unlabeled target proteins [40].
In the protein-observed 19F NMR approach, the successful application of 19F NMR to large protein systems critically depends on the method used to introduce fluorine reporters at defined positions. Two principal strategies have been developed for site-specific fluorine incorporation, each with distinct advantages and experimental considerations: (1) cysteine-based conjugation with fluorine-containing small molecule probes, and (2) biosynthetic incorporation of fluorinated amino acids during protein expression. Both approaches enable the introduction of fluorine probes at predetermined locations, yielding simplified 1D 19F spectra with resonances that report directly from sites of biological interest [42]. The utility of protein-observed 19F NMR has been demonstrated in membrane protein research; for example, Liu et al. utilized this approach on the β2-adrenergic receptor to reveal conformational ensembles underlying biased signaling [43]. Yuan et al. used 19F NMR to monitor the phosphoantigen (HMBPP)-induced conformational changes in BTN3A1 upon its association with BTN2A1, demonstrating the high sensitivity of this technique in detecting dynamic protein and small molecule interactions [44].
In the ligand-observed 19F NMR approach, fluorinated compounds are screened against unlabeled protein targets. The fundamental premise is simple: upon protein binding, the 19F NMR signal of a small molecule ligand undergoes changes in its chemical shift, linewidth, or intensity. This strategy has been successfully applied to GPCR ligand discovery; for instance, Zhang and colleagues developed a ligand-observed 19F NMR competition assay for the adenosine A2A receptor using a fluorinated probe molecule, FPPA, enabling the identification of diverse ligands without protein labeling [45].
Another widely used site-specific labeling strategy is 13C-methyl labeling, which is a protein-observed method. This approach introduces 13C-labeled methyl groups into selected amino acids including methionine, alanine, isoleucine, leucine, threonine, and valine, which enables NMR studies of large proteins such as GPCRs [46,47]. This technique is commonly achieved by expressing the target protein using isotopically labeled amino acid precursors in D2O-based medium. By recording 1H-13C HSQC spectra, researchers can observe chemical shift perturbations or signal intensity changes induced by ligand binding. This strategy has been effectively demonstrated on the atypical chemokine receptor 3 (ACKR3), where site-specific 13C-methyl methionine labeling combined with mutagenesis enabled the probing of individual residues to monitor ligand-induced conformational changes and signaling biases [17].

4. From Constraints to Coordinates: Determining Atomic-Resolution Structures

4.1. Conventional NMR Structures of Protein–Ligand Complexes

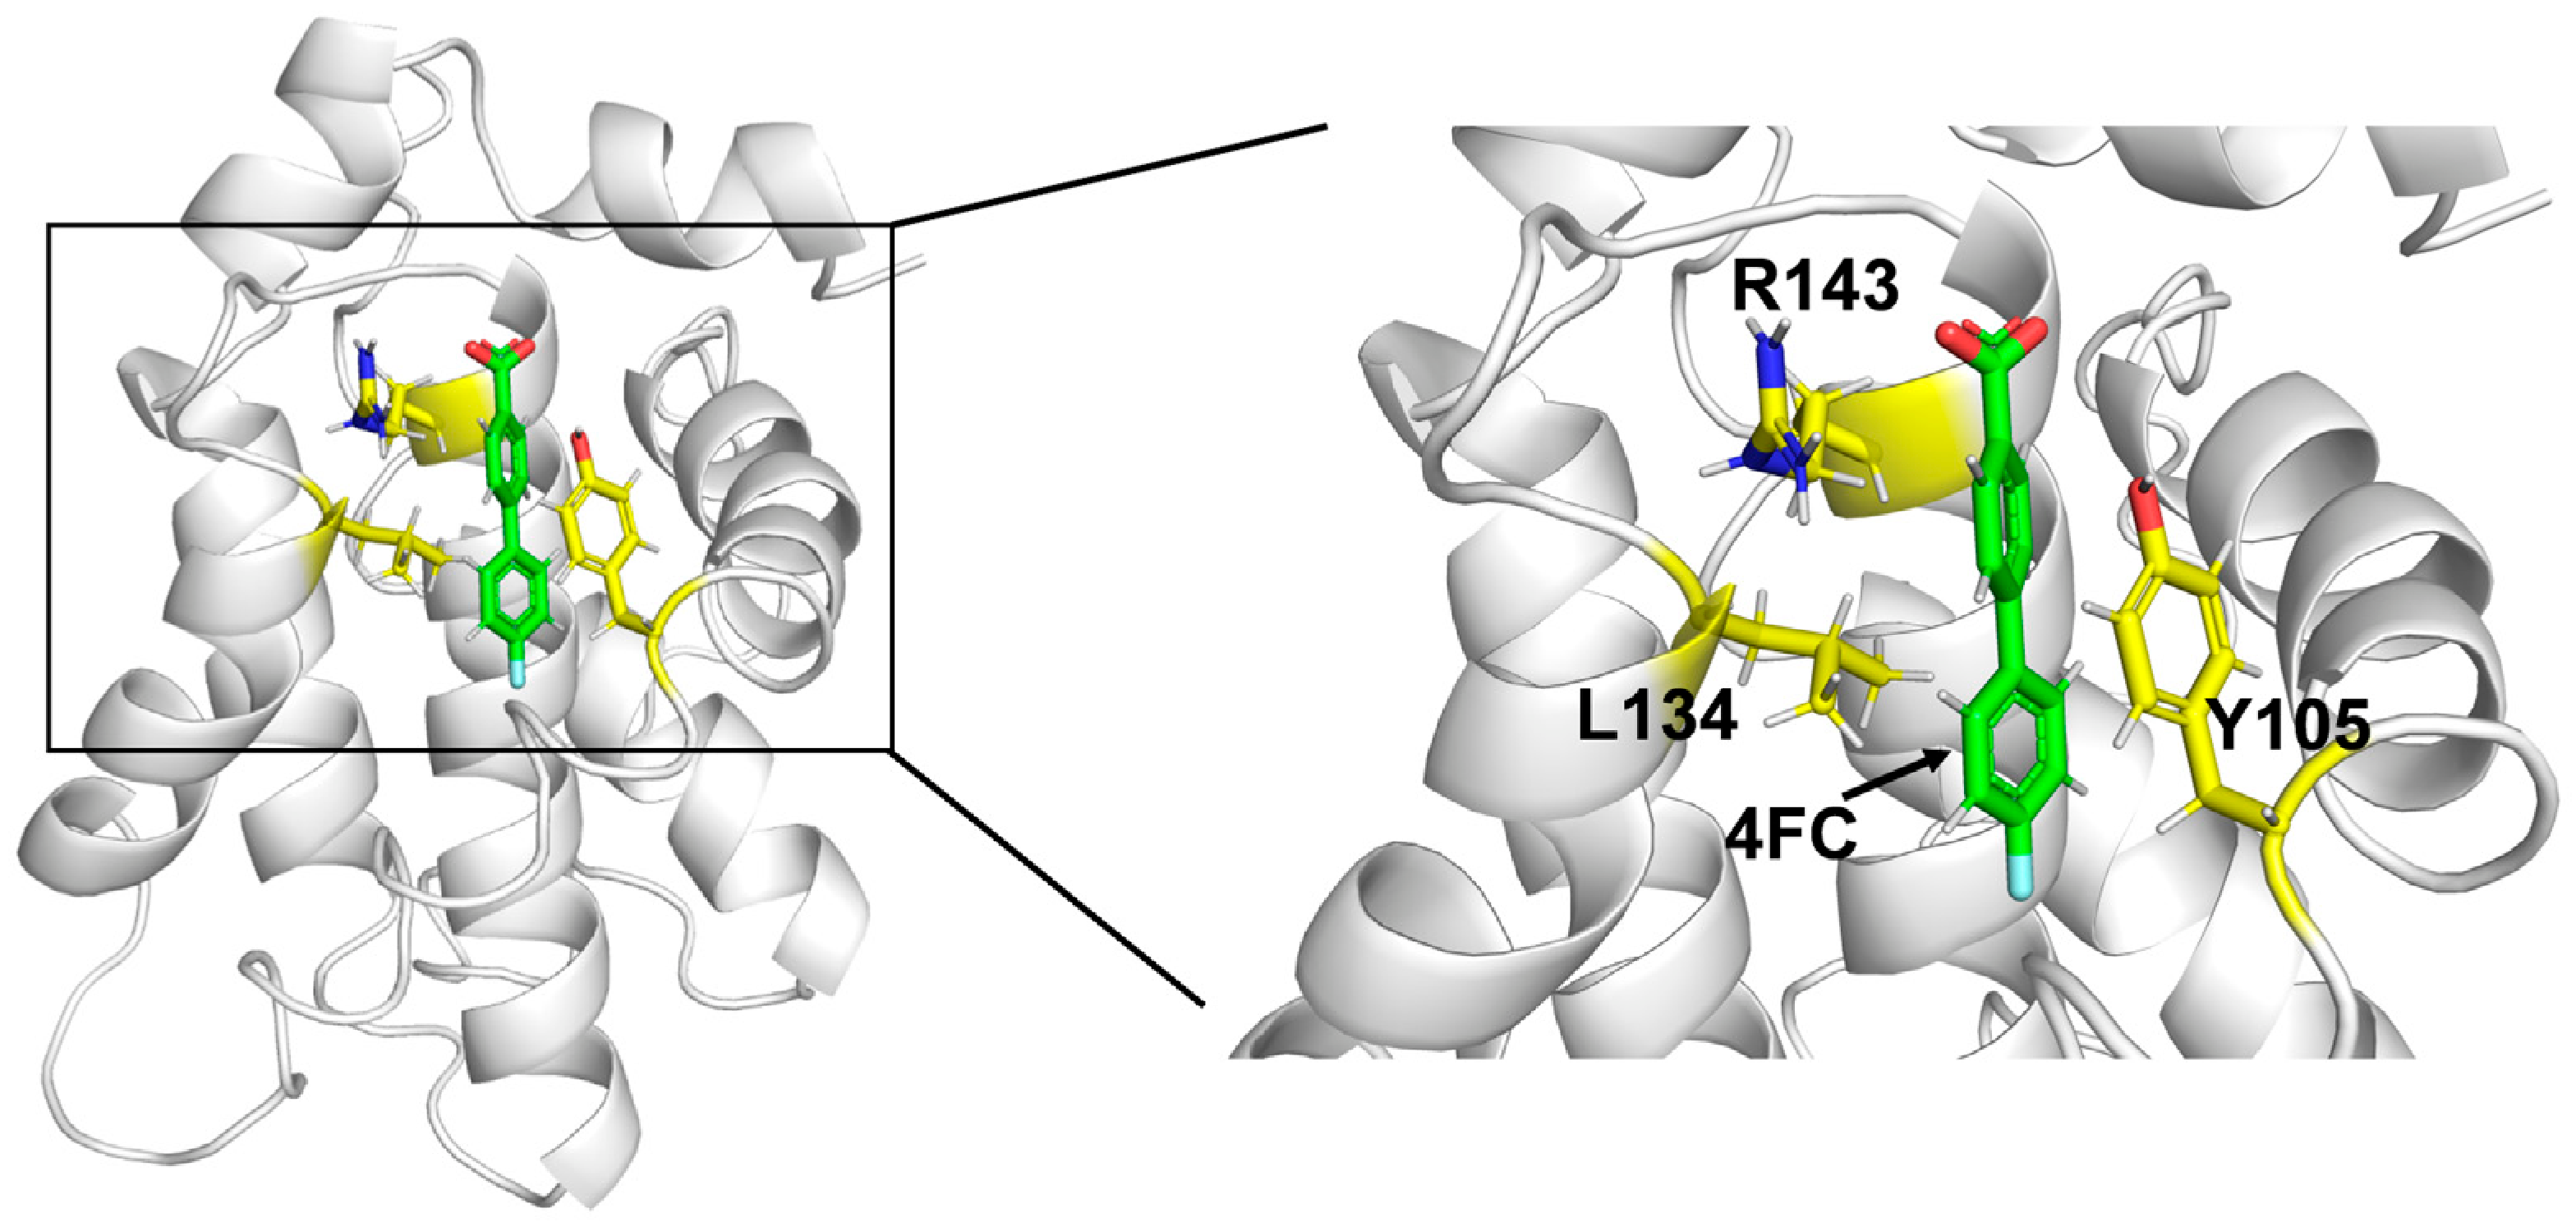
NMR is one of the three biophysical techniques for determining biomolecular structures at atomic resolution, and it is unique in its ability to determine three-dimensional structures under near-physiological solution conditions. The foundation of NMR structure determination is based on the nuclear Overhauser effect (NOE), which arises from dipole–dipole cross-relaxation between spatially close nuclei. The intensity of an NOE cross-peak is related to the inverse sixth power of the internuclear distance, making it sensitive for measuring 1H-1H distances up to approximately 5–6 Å [48,49]. For complexes with molecular weights below approximately 30 kDa, conventional multi-dimensional NMR experiments can be employed to generate distance restraints for structure calculation (Figure 5).
Intermolecular NOEs between protein and ligand protons are critical for structure determination of protein–ligand complexes, because these intermolecular NOEs provide direct restraints for defining the binding interface and orienting the ligand within the protein binding pocket. Intermolecular NOEs are typically obtained using isotope-filtered NOESY experiments that selectively detect correlations between protons attached to different isotopes, thereby suppressing intramolecular signals and revealing only the intermolecular contacts [50].
The disadvantage of structure calculation by NMR is that it is very time-consuming since all atoms in the complex need to be assigned to their respective chemical shifts. To address this, Orts et al. developed NMR2 (NMR Molecular Replacement), a method applicable to weak (dissociation constant, Kd ~ mM) and strong (dissociation constant, Kd ~ nM) binders across fast or slow exchange regimes, except in the cases of severe exchange broadening [51]. This innovative approach circumvents the need for protein resonance assignment by using a known protein structure combined with a set of intermolecular NOE restraints, thereby enabling the rapid and accurate elucidation of complex structures. NMR2 drastically reduces the determination time from several months to merely a few days. The method requires a minimum of approximately 12–15 intermolecular NOEs and relies on the availability of an input structure [51]. Accurate chemical shift assignment of the ligand in the bound state is needed before structure calculation. By integrating selective methyl protonation with the NMR2 methodology, Scanlon et al. rapidly determined the binding mode of the weak-affinity ligand phenylthiazole 1 (Kd ≈ 0.9 mM) to the 21 kDa enzyme EcDsbA without full protein resonance assignment [52].

4.2. NMR Structure Determination of Protein–Ligand Complexes by Specialized Strategies

Otting et al. successfully resolved the high-resolution structure of the 30 kDa thymidine–E. coli ϵ186/θ complex (Kd ≈ 7.6 mM) via transferred pseudocontact shifts (PCSs) [53]. This method relies on the presence of a lanthanide ion in the protein target and on fast exchange between bound and free ligand. By converting PCS data into long-range spatial restraints relative to a lanthanide probe, this strategy circumvents the need for extensive resonance assignment or ligand isotopic labeling. Although the method demands a pre-existing high-resolution protein structure as a template, it provides a rapid solution for characterizing weak affinity complexes with dissociation constants in the low millimolar range.
Chemical shift perturbation (CSP) data can serve as constraints for structure calculations to determine the three-dimensional structure of protein–ligand complexes. The HADDOCK (High Ambiguity Driven DOCKing) approach is based precisely on this principle: residues exhibiting significant chemical shift perturbations are defined as “active residues,” and their surface-adjacent residues are defined as “passive residues.” These are then employed as ambiguous interaction restraints to drive the docking of the ligand into the protein’s binding pocket [54].
Conventional NOE methods and specialized strategies are employed complementarily to complete the structure determination of protein–ligand complexes. Depending on the protein system under investigation, this methodological integration has significantly broadened the applicability of NMR in protein–ligand interaction studies.

5. Ligand-Induced Protein Dynamics by NMR

Beyond detecting binding, mapping interfaces and complex structure determination, one of the distinctive strengths of NMR is its ability to characterize protein conformational dynamics in solution under near-physiological conditions. While X-ray crystallography and cryo-EM provide largely static snapshots, NMR can directly probe motions across a wide range of timescales, from picosecond backbone fluctuations to millisecond conformational rearrangements. This capability makes NMR uniquely suited to study phenomena such as induced fit, conformational selection, allosteric modulation, and ligand-induced loop immobilization.
The most widely used NMR techniques for this purpose are spin relaxation experiments. Heteronuclear 15N relaxation measurements (R1, R2, and steady-state heteronuclear NOE) report on fast internal motions on the ps-ns timescale, allowing for researchers to identify flexible loops, inter-domain hinges, and disordered termini. Changes in these parameters upon ligand binding can reveal the rigidification of dynamic regions. For example, Gryk et al. used 15N relaxation measurements to compare the backbone dynamics of free and Ins(1,4,5)P3-bound β-spectrin PH domain [55]. Their data showed that the ligand-binding loops (β1–β2 and β5–β6) exhibit significant internal mobility on the ps-ns timescale in the free state, whereas ligand binding restricts these motions, as reflected by increased NOE values.
For slower motions (µs-ms) that are often linked to biological function, relaxation-dispersion experiments such as CPMG or T relaxation dispersion are the methods of choice. These experiments can detect and quantify weakly populated excited conformational states, providing kinetic and thermodynamic information on conformational exchange processes. A seminal example is the work of Ishima et al., which systematically compared the backbone dynamics of free and DMP323-bound HIV-1 protease using combined 1H and 15N transverse relaxation experiments [56]. Their data revealed that the flap tips (residues 48–55) undergo a distinct conformational exchange on the ~80 µs timescale in the free enzyme, whereas this slow motion is largely suppressed upon inhibitor binding, directly demonstrating ligand-induced flap immobilization. In another classic study, Boehr et al. applied CPMG relaxation dispersion to each intermediate of the E. coli DHFR catalytic cycle and demonstrated that each intermediate samples low-lying excited states whose conformations resemble adjacent intermediates [57]. The hydride transfer and turnover rates are governed by transitions between these states, showing that ligand binding modulates the energy landscape to channel the enzyme along a preferred kinetic path.
Additional complementary tools include chemical exchange saturation transfer (CEST) for slow-exchange processes and ZZ-exchange spectroscopy for characterizing interconversion between distinct conformers. When the protein of interest is large or otherwise challenging for conventional 1H/15N methods, 19F NMR, which requires only a fluorine label and suffers no background signal, provides a sensitive alternative for monitoring conformational equilibria and ligand-induced changes in large proteins or complexes. For example, Overbeck et al. developed a consistent suite of 19F-based CPMG, on-resonance R and off-resonance R1ρ relaxation dispersion experiments and successfully applied them to quantify µs-ms dynamics in the 360 kDa half-proteasome, demonstrating the feasibility of 19F NMR for studying large macromolecular assemblies [58].
The primary limitations of these dynamics-oriented NMR experiments typically involve the need for isotope labelling (15N and often 13C), the sensitivity constraints imposed by the protein’s molecular weight, and the complexity of data analysis for quantitative modelling. For proteins above approximately 30 kDa, deuteration and TROSY are generally necessary to achieve adequate resolution and sensitivity in conventional 1H/15N experiments (with the notable exception of 19F-based approaches, which bypass these requirements). Furthermore, relaxation dispersion experiments rely on exchange occurring in a suitable timescale window, and extremely slow or extremely fast motions may escape detection. Nevertheless, when applicable, these methods deliver mechanistic information on protein flexibility and conformational changes that cannot be obtained from static structural methods. Integrating these dynamic insights with binding data and high-resolution structures produces a richer, more complete picture of protein–ligand recognition, and this synergy underlies the growing role of NMR in drug discovery.

6. Discussion

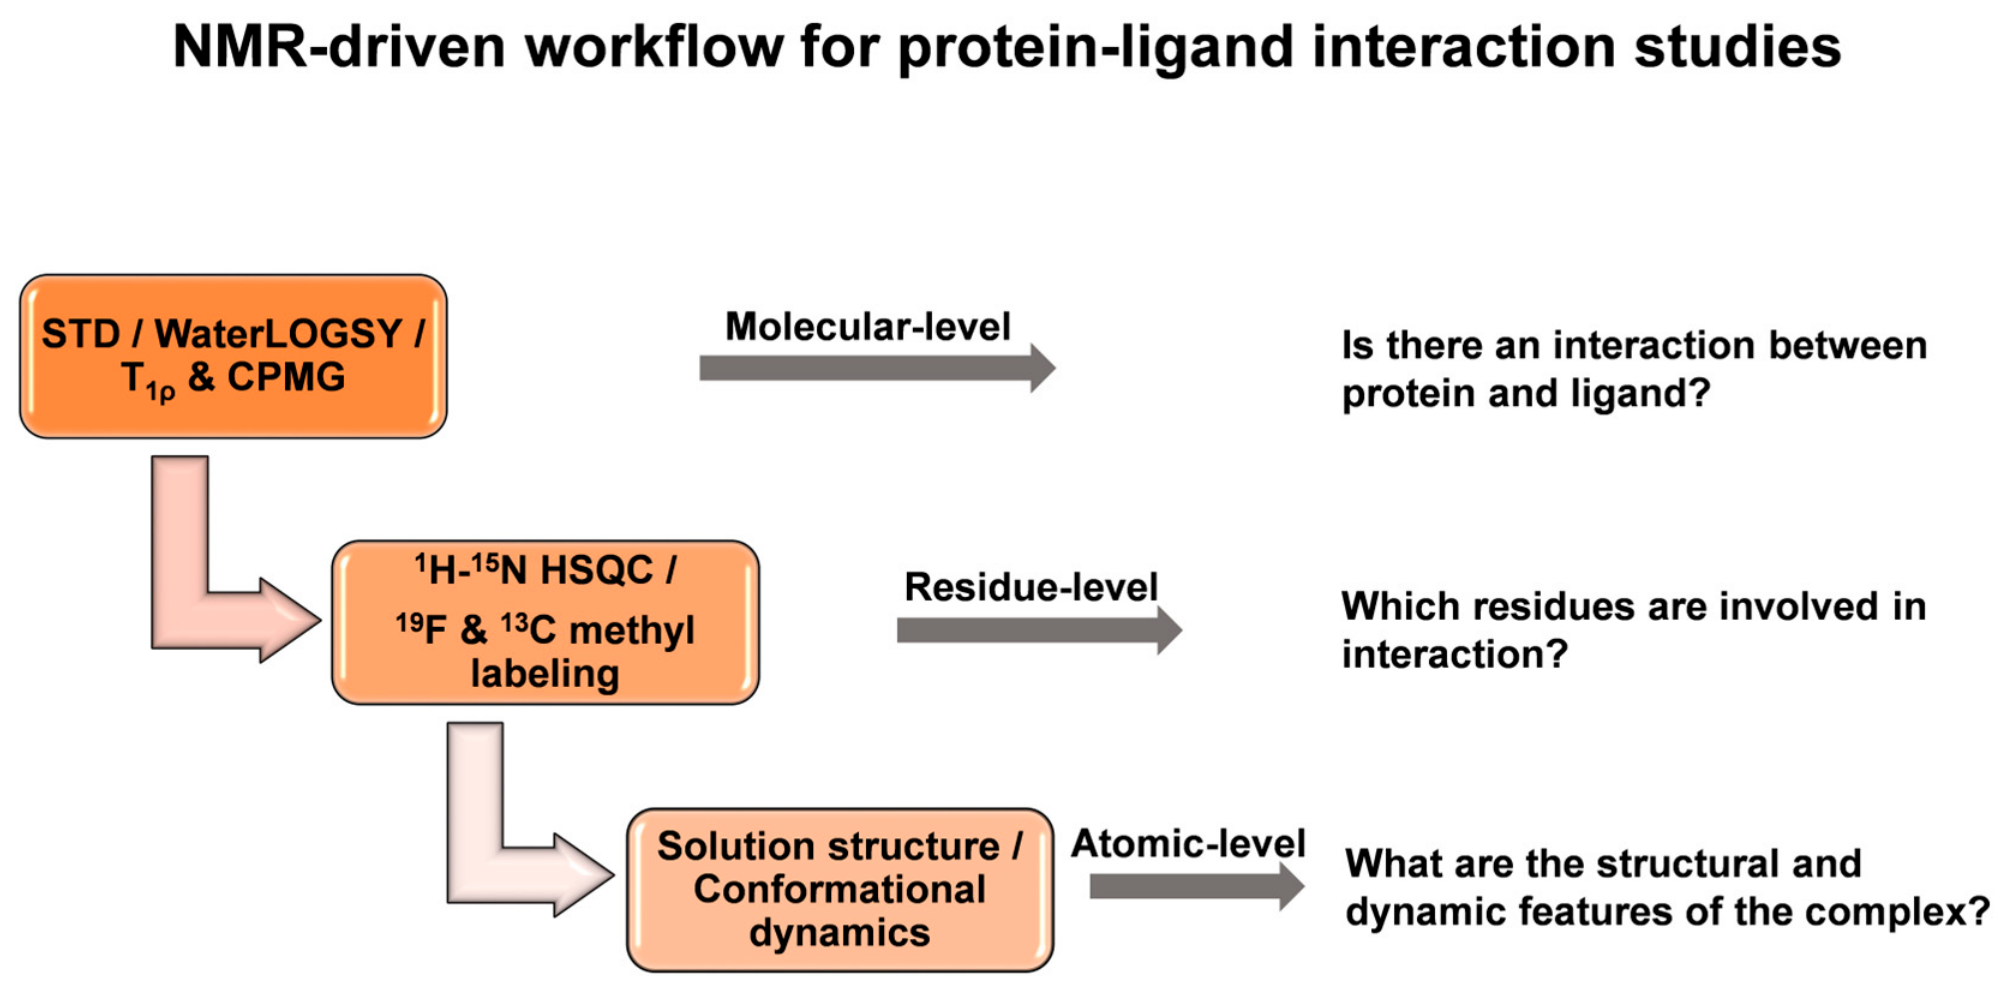
NMR provides a multi-scale platform for elucidating protein–ligand interactions, naturally organized into a progressive three-level workflow: rapid molecular-level binding detection, residue-level interface mapping, and atomic-level structure and dynamics characterization (Figure 6). This hierarchy enables an efficient transition from initial hit identification to mechanistic understanding of molecular recognition.
At the molecular level, ligand-observed experiments (STD, WaterLOGSY, relaxation-based methods) offer a rapid and sensitive filter for discriminating binders from non-binders with minimal protein consumption, establishing the essential starting point for any interaction study. Once binding is confirmed, protein-observed strategies including 1H-15N HSQC and site-specific labeling approaches can map the binding interface at residue resolution. Under favorable exchange conditions, they may also provide quantitative affinity estimates. These two stages together define whether and where an interaction occurs, providing the foundation for subsequent high-resolution investigation.
The third level exploits NMR’s unique ability to determine solution structures of protein–ligand complexes and to characterize conformational dynamics across multiple timescales. By integrating NOE-derived distance restraints, CSP-driven docking, and specialized approaches such as transferred PCS, atomic-resolution models of the binding interface can be obtained under near-physiological conditions, complementing static structures from X-ray crystallography and cryo-EM. Simultaneously, spin relaxation and relaxation dispersion experiments resolve motions ranging from picosecond backbone fluctuations to millisecond conformational exchanges, revealing functionally critical phenomena such as induced fit and allosteric modulation.
Each experimental level has intrinsic strengths and limitations that dictate its applicability to a given system (Table 1). Ligand-observed methods are effective in high-throughput screening but are largely restricted to weak-to-moderate affinity ranges; protein-observed and structural approaches are applicable across a wide affinity range, from weak to tight binding, but generally face molecular weight and sample preparation constraints. A notable exception is 19F NMR, which effectively circumvents the molecular weight limitation. A rigorous workflow therefore demands an integrated, hierarchical strategy in which the findings at each level guide the next steps, with complementary biophysical techniques (e.g., ITC, HDX-MS) called upon where necessary to validate or extend the NMR findings [59,60].
In summary, the hierarchical NMR framework described here converts a set of disparate experiments into a coherent, efficient pipeline for mapping protein–ligand interactions. By systematically advancing through detection, localization, and structural/dynamic characterization, this workflow not only provides a comprehensive view of molecular recognition but also offers a practical framework for both fundamental biological studies and drug discovery programs.
Looking forward, ongoing advances in computational and instrumental methods are expected to further strengthen this hierarchical framework. For example, deep learning algorithms have shown promise in predicting protein chemical shifts, which can reduce the manual effort required for spectral analysis [61]. The advent of 1.2 GHz NMR spectrometers offers substantially improved resolution and sensitivity, enabling atomic-resolution studies of more challenging systems, including large protein–ligand complexes. Continued progress in these areas is likely to broaden the scope of tractable targets and accelerate the transition from binding detection to atomic-level characterization.

Author Contributions

Writing—original draft preparation, H.Y. and N.X.; writing—review and editing, N.X.; supervision, N.X. All authors have read and agreed to the published version of the manuscript.

Funding

This research received no external funding.

Data Availability Statement

No new data were created or analyzed in this study. Data sharing is not applicable to this article.

Acknowledgments

We thank Yi Xue for advice on paper writing and figure preparation.

Conflicts of Interest

The authors declare no conflicts of interest.

Abbreviations

The following abbreviations are used in this manuscript:
NMRNuclear Magnetic Resonance spectroscopy. A technique that exploits the magnetic properties of certain atomic nuclei to determine the structure, dynamics, and interactions of molecules in solution.
STDSaturation Transfer Difference spectroscopy. A ligand-observed NMR experiment in which saturation is transferred from the protein to the bound ligand; comparison of spectra with and without saturation reveals which ligand protons are in close contact with the protein.
WaterLOGSYWater–Ligand Observed via Gradient Spectroscopy. A ligand-observed NMR experiment that detects binding through magnetization transfer from bulk water to the ligand, mediated by the protein. Useful for primary screening and competition experiments.
TSpin-lattice relaxation in the rotating frame. A relaxation-based NMR experiment sensitive to exchange processes on the microsecond-to-millisecond timescale. Used to study dynamics and binding events.
CPMGCarr–Purcell–Meiboom–Gill pulse sequence. A relaxation-based NMR experiment that measures transverse relaxation (T2) in both ligand- and protein-observed formats; used to study dynamics and binding events.
HSQC (1H-15N HSQC)Heteronuclear Single Quantum Coherence spectroscopy. A two-dimensional protein-observed NMR experiment that correlates proton and nitrogen chemical shifts, producing a characteristic “fingerprint” of the protein backbone. It is widely used to detect ligand binding and map interaction interfaces.
CSPChemical Shift Perturbation. The change in NMR resonance frequencies of protein nuclei (typically amide groups) upon ligand binding. Used to map interaction sites on the protein and to measure binding affinity through titration experiments.
TROSYTransverse Relaxation-Optimized Spectroscopy. An NMR technique that selects the slowly relaxing component of coupled spin systems, dramatically improving spectral resolution for high molecular weight proteins.
ITCIsothermal Titration Calorimetry. A biophysical method that directly measures the heat released or absorbed upon binding, providing the dissociation constant (Kd), stoichiometry, enthalpy, and entropy of a protein–ligand interaction.
HDX-MSHydrogen–Deuterium Exchange Mass Spectrometry. A technique that monitors the exchange of backbone amide protons with deuterium in solution; ligand binding protects certain regions from exchange, revealing binding sites and conformational changes.

References

  1. Leggett, A.; Wang, C.; Li, D.W.; Somogyi, A.; Bruschweiler-Li, L.; Brüschweiler, R. Identification of Unknown Metabolomics Mixture Compounds by Combining NMR, MS, and Cheminformatics. Methods Enzymol. 2019, 615, 407–422. [Google Scholar] [CrossRef] [Scilit]
  2. Jia, Y.; Gao, B.; Tan, J.; Zheng, J.; Hong, X.; Zhu, W.; Tan, H.; Xiao, Y.; Tan, L.; Cai, H.; et al. Deep contrastive learning enables genome-wide virtual screening. Science 2026, 391, eads9530. [Google Scholar] [CrossRef] [Scilit] [PubMed]
  3. Bastos, M.; Abian, O.; Johnson, C.M.; Ferreira-da-Silva, F.; Vega, S.; Jimenez-Alesanco, A.; Ortega-Alarcon, D.; Velazquez-Campoy, A. Isothermal titration calorimetry. Nat. Rev. Methods Primers 2023, 3, 17. [Google Scholar] [CrossRef] [Scilit]
  4. De Crescenzo, G.; Boucher, C.; Durocher, Y.; Jolicoeur, M. Kinetic Characterization by Surface Plasmon Resonance-Based Biosensors: Principle and Emerging Trends. Cell. Mol. Bioeng. 2008, 1, 204–215. [Google Scholar] [CrossRef] [Scilit]
  5. Nepravishta, R.; Munoz-Garcia, J.C.; Cameron, K.; Angulo, J.; Uhrín, D. Fast and Reliable NMR-Based Fragment Scoring for Drug Discovery. J. Am. Chem. Soc. 2025, 147, 40296–40304. [Google Scholar] [CrossRef] [Scilit] [PubMed]
  6. Du, X.; Li, Y.; Xia, Y.L.; Ai, S.M.; Liang, J.; Sang, P.; Ji, X.L.; Liu, S.Q. Insights into Protein-Ligand Interactions: Mechanisms, Models, and Methods. Int. J. Mol. Sci. 2016, 17, 144. [Google Scholar] [CrossRef] [Scilit] [PubMed]
  7. Dalvit, C.; Gmür, I.; Rößler, P.; Gossert, A.D. Affinity measurement of strong ligands with NMR spectroscopy: Limitations and ways to overcome them. Prog. Nucl. Magn. Reson. Spectrosc. 2023, 138–139, 52–69. [Google Scholar] [CrossRef] [Scilit] [PubMed]
  8. Walpole, S.; Monaco, S.; Nepravishta, R.; Angulo, J. STD NMR as a Technique for Ligand Screening and Structural Studies. Methods Enzymol. 2019, 615, 423–451. [Google Scholar] [CrossRef] [Scilit] [PubMed]
  9. Huang, R.; Leung, I.K.H. Protein-Small Molecule Interactions by WaterLOGSY. Methods Enzymol. 2019, 615, 477–500. [Google Scholar] [CrossRef] [Scilit]
  10. Farber, P.J.; Mittermaier, A. Relaxation dispersion NMR spectroscopy for the study of protein allostery. Biophys. Rev. 2015, 7, 191–200. [Google Scholar] [CrossRef] [Scilit] [PubMed]
  11. Williamson, M.P. Using chemical shift perturbation to characterise ligand binding. Prog. Nucl. Magn. Reson. Spectrosc. 2013, 73, 1–16. [Google Scholar] [CrossRef] [Scilit] [PubMed]
  12. Dalvit, C.; Ardini, E.; Flocco, M.; Fogliatto, G.P.; Mongelli, N.; Veronesi, M. A General NMR Method for Rapid, Efficient, and Reliable Biochemical Screening. J. Am. Chem. Soc. 2003, 125, 14620–14625. [Google Scholar] [CrossRef] [Scilit] [PubMed]
  13. Schütz, S.; Sprangers, R. Methyl TROSY spectroscopy: A versatile NMR approach to study challenging biological systems. Prog. Nucl. Magn. Reson. Spectrosc. 2020, 116, 56–84. [Google Scholar] [CrossRef] [Scilit] [PubMed]
  14. Religa, T.L.; Ruschak, A.M.; Rosenzweig, R.; Kay, L.E. Site-Directed Methyl Group Labeling as an NMR Probe of Structure and Dynamics in Supramolecular Protein Systems: Applications to the Proteasome and to the ClpP Protease. J. Am. Chem. Soc. 2011, 133, 9063–9068. [Google Scholar] [CrossRef] [Scilit] [PubMed]
  15. Kitevski-LeBlanc, J.L.; Prosser, R.S. Current applications of 19F NMR to studies of protein structure and dynamics. Prog. Nucl. Magn. Reson. Spectrosc. 2012, 62, 1–33. [Google Scholar] [CrossRef] [Scilit] [PubMed]
  16. Ye, L.; Wang, X.; McFarland, A.; Madsen, J.J. 19F NMR: A promising tool for dynamic conformational studies of G protein-coupled receptors. Structure 2022, 30, 1372–1384. [Google Scholar] [CrossRef] [Scilit] [PubMed]
  17. Kleist, A.B.; Peterson, F.; Tyler, R.C.; Gustavsson, M.; Handel, T.M.; Volkman, B.F. Solution NMR spectroscopy of GPCRs: Residue-specific labeling strategies with a focus on 13C-methyl methionine labeling of the atypical chemokine receptor ACKR3. Methods Cell Biol. 2019, 149, 259–288. [Google Scholar] [CrossRef] [Scilit] [PubMed]
  18. Oltersdorf, T.; Elmore, S.W.; Shoemaker, A.R.; Armstrong, R.C.; Augeri, D.J.; Belli, B.A.; Bruncko, M.; Deckwerth, T.L.; Dinges, J.; Hajduk, P.J.; et al. An inhibitor of Bcl-2 family proteins induces regression of solid tumours. Nature 2005, 435, 677–681. [Google Scholar] [CrossRef] [Scilit] [PubMed]
  19. Mayer, M.; Meyer, B. Characterization of Ligand Binding by Saturation Transfer Difference NMR Spectroscopy. Angew. Chem. Int. Ed. Engl. 1999, 38, 1784–1788. [Google Scholar] [CrossRef]
  20. Meyer, B.; Mayer, M. Group Epitope Mapping by Saturation Transfer Difference NMR To Identify Segments of a Ligand in Direct Contact with a Protein Receptor. J. Am. Chem. Soc. 2001, 123, 6108–6117. [Google Scholar] [CrossRef] [Scilit] [PubMed]
  21. Hafez-Ghoran, S.; Salar, U. Saturation transfer difference (STD)-NMR spectroscopy in drug discovery: A comprehensive review on identified potential hits based on natural and synthetic scaffolds against therapeutic drug targets. Bioorg. Med. Chem. 2025, 125, 118212. [Google Scholar] [CrossRef] [Scilit] [PubMed]
  22. Xia, Y.; Zhu, Q.; Jun, K.Y.; Wang, J.; Gao, X. Clean STD-NMR spectrum for improved detection of ligand-protein interactions at low concentration of protein. Magn. Reson. Chem. 2010, 48, 918–924. [Google Scholar] [CrossRef] [Scilit] [PubMed]
  23. Macura, S.; Ernst, R.R. Elucidation of cross relaxation in liquids by two-dimensional N.M.R. spectroscopy. Mol. Phys. 1980, 41, 95–117. [Google Scholar] [CrossRef] [Scilit]
  24. Dalvit, C.; Pevarello, P.; Tatò, M.; Veronesi, M.; Vulpetti, A.; Sundström, M. Identification of compounds with binding affinity to proteins via magnetization transfer from bulk water. J. Biomol. NMR 2000, 18, 65–68. [Google Scholar] [CrossRef] [Scilit] [PubMed]
  25. Huang, R.; Bonnichon, A.; Claridge, T.D.W.; Leung, I.K.H. Protein-ligand binding affinity determination by the waterLOGSY method: An optimised approach considering ligand rebinding. Sci. Rep. 2017, 7, 43727. [Google Scholar] [CrossRef] [Scilit] [PubMed]
  26. Lorz, N.; Czarniecki, B.; Loss, S.; Meier, B.; Gossert, A.D. Higher Contrast in 1H-Observed NMR Ligand Screening with the PEARLScreen Experiment. Angew. Chem. Int. Ed. Engl. 2025, 64, e202423879. [Google Scholar] [CrossRef] [Scilit] [PubMed]
  27. Hajduk, P.J.; Olejniczak, E.T.; Fesik, S.W. One-Dimensional Relaxation- and Diffusion-Edited NMR Methods for Screening Compounds That Bind to Macromolecules. J. Am. Chem. Soc. 1997, 119, 12257–12261. [Google Scholar] [CrossRef] [Scilit]
  28. Moretti, L.; Molteni, L.; Palmioli, A.; Airoldi, C. Advanced NMR Screening: Unveiling Bioactive Compounds in Complex Molecular Mixtures. ACS Omega 2025, 10, 40680–40693. [Google Scholar] [CrossRef] [Scilit] [PubMed]
  29. Kay, L.E.; Keifer, P.; Saarinen, T. Pure Absorption Gradient Enhanced Heteronuclear Single Quantum Correlation Spectroscopy with Improved Sensitivity. J. Am. Chem. Soc. 1992, 114, 10663–10665. [Google Scholar] [CrossRef] [Scilit]
  30. Tian, W.; Yan, P.; Xu, N.; Chakravorty, A.; Liefke, R.; Xi, Q.; Wang, Z. The HRP3 PWWP domain recognizes the minor groove of double-stranded DNA and recruits HRP3 to chromatin. Nucleic Acids Res. 2019, 47, 5436–5448. [Google Scholar] [CrossRef] [Scilit] [PubMed]
  31. Cotten, M.L.; Starich, M.R.; He, Y.; Yin, J.; Yuan, Q.; Tjandra, N. NMR chemical shift assignment of Drosophila odorant binding protein 44a in complex with 8(Z)-eicosenoic acid. Biomol. NMR Assign. 2024, 18, 129–134. [Google Scholar] [CrossRef] [Scilit] [PubMed]
  32. Arai, M.; Ferreon, J.C.; Wright, P.E. Quantitative Analysis of Multisite Protein–Ligand Interactions by NMR: Binding of Intrinsically Disordered p53 Transactivation Subdomains with the TAZ2 Domain of CBP. J. Am. Chem. Soc. 2012, 134, 3792–3803. [Google Scholar] [CrossRef] [Scilit] [PubMed]
  33. Jin, S.; Ding, P.; Chu, P.; Li, H.; Sun, J.; Liang, D.; Song, F.; Xia, B. Zn(II) can mediate self-association of the extracellular C-terminal domain of CD147. Protein Cell 2017, 9, 310–315. [Google Scholar] [CrossRef] [Scilit] [PubMed]
  34. Skinner, A.L.; Laurence, J.S. High-field Solution NMR Spectroscopy as a Tool for Assessing Protein Interactions with Small Molecule Ligands. J. Pharm. Sci. 2008, 97, 4670–4695. [Google Scholar] [CrossRef] [Scilit] [PubMed]
  35. Danielson, M.A.; Falke, J.J. Use of 19F NMR to Probe Protein Structure and Conformational Changes. Annu. Rev. Biophys. Biomol. Struct. 1996, 25, 163–195. [Google Scholar] [CrossRef] [Scilit]
  36. Salzmann, M.; Pervushin, K.; Wider, G.; Senn, H.; Wüthrich, K. TROSY in triple-resonance experiments: New perspectives for sequential NMR assignment of large proteins. Proc. Natl. Acad. Sci. USA 1998, 95, 13585–13590. [Google Scholar] [CrossRef] [Scilit] [PubMed]
  37. Gee, C.T.; Arntson, K.E.; Urick, A.K.; Mishra, N.K.; Hawk, L.M.L.; Wisniewski, A.J.; Pomerantz, W.C.K. Protein-observed 19F-NMR for fragment screening, affinity quantification and druggability assessment. Nat. Protoc. 2016, 11, 1414–1427. [Google Scholar] [CrossRef] [Scilit] [PubMed]
  38. Beier, A.; Platzer, G.; Höfurthner, T.; Ptaszek, A.L.; Lichtenecker, R.J.; Geist, L.; Fuchs, J.E.; McConnell, D.B.; Mayer, M.; Konrat, R. Probing Protein-Ligand Methyl-π Interaction Geometries through Chemical Shift Measurements of Selectively Labeled Methyl Groups. J. Med. Chem. 2024, 67, 13187–13196. [Google Scholar] [CrossRef] [Scilit] [PubMed]
  39. Klein-Seetharaman, J.; Getmanova, E.V.; Loewen, M.C.; Reeves, P.J.; Khorana, H.G. NMR spectroscopy in studies of light-induced structural changes in mammalian rhodopsin: Applicability of solution 19F NMR. Proc. Natl. Acad. Sci. USA 1999, 96, 13744–13749. [Google Scholar] [CrossRef] [Scilit] [PubMed]
  40. Li, Q.; Kang, C. Perspectives on Applications of 19F-NMR in Fragment-Based Drug Discovery. Molecules 2024, 29, 5748. [Google Scholar] [CrossRef] [Scilit] [PubMed]
  41. Streit, J.O.; Chan, S.H.S.; Daya, S.; Christodoulou, J. Rational design of 19F NMR labelling sites to probe protein structure and interactions. Nat. Commun. 2025, 16, 4300. [Google Scholar] [CrossRef] [Scilit] [PubMed]
  42. Sengupta, I. Insights into the Structure and Dynamics of Proteins from 19F Solution NMR Spectroscopy. Biochemistry 2024, 63, 2958–2968. [Google Scholar] [CrossRef] [Scilit] [PubMed]
  43. Liu, J.J.; Horst, R.; Katritch, V.; Stevens, R.C.; Wüthrich, K. Biased Signaling Pathways in β2-Adrenergic Receptor Characterized by 19F-NMR. Science 2012, 335, 1106–1110. [Google Scholar] [CrossRef] [Scilit] [PubMed]
  44. Yuan, L.; Ma, X.; Yang, Y.; Qu, Y.; Li, X.; Zhu, X.; Ma, W.; Duan, J.; Xue, J.; Yang, H.; et al. Phosphoantigens glue butyrophilin 3A1 and 2A1 to activate Vγ9Vδ2 T cells. Nature 2023, 621, 840–848. [Google Scholar] [CrossRef] [Scilit] [PubMed]
  45. Zhang, J.; Feng, D.; Cheng, J.; Wüthrich, K. Adenosine A2A Receptor (A2AAR) Ligand Screening Using the 19F-NMR Probe FPPA. J. Am. Chem. Soc. 2023, 145, 15061–15064. [Google Scholar] [CrossRef] [Scilit] [PubMed]
  46. Kerfah, R.; Plevin, M.J.; Sounier, R.; Gans, P.; Boisbouvier, J. Methyl-specific isotopic labeling: A molecular tool box for solution NMR studies of large proteins. Curr. Opin. Struct. Biol. 2015, 32, 113–122. [Google Scholar] [CrossRef] [Scilit] [PubMed]
  47. Kofuku, Y.; Ueda, T.; Okude, J.; Shiraishi, Y.; Kondo, K.; Mizumura, T.; Suzuki, S.; Shimada, I. Functional Dynamics of Deuterated β2-Adrenergic Receptor in Lipid Bilayers Revealed by NMR Spectroscopy. Angew. Chem. Int. Ed. Engl. 2014, 53, 13376–13379. [Google Scholar] [CrossRef] [Scilit] [PubMed]
  48. Wüthrich, K. NMR Studies of Structure and Function of Biological Macromolecules (Nobel Lecture). Angew. Chem. Int. Ed. Engl. 2003, 42, 3340–3363. [Google Scholar] [CrossRef] [Scilit] [PubMed]
  49. LeMaster, D.M. NOE-Assessment of protein solution versus crystal structure determination. J. Biomol. NMR 1997, 9, 79–93. [Google Scholar] [CrossRef] [Scilit] [PubMed]
  50. Breeze, A.L. Isotope-filtered NMR methods for the study of biomolecular structure and interactions. Prog. Nucl. Magn. Reson. Spectrosc. 2000, 36, 323–372. [Google Scholar] [CrossRef] [Scilit]
  51. Wälti, M.; Orts, J. The NMR2 Method to Determine Rapidly the Structure of the Binding Pocket of a Protein-Ligand Complex with High Accuracy. Magnetochemistry 2018, 4, 12. [Google Scholar] [CrossRef] [Scilit]
  52. Mohanty, B.; Orts, J.; Wang, G.; Nebl, S.; Alwan, W.S.; Doak, B.C.; Williams, M.L.; Heras, B.; Mobli, M.; Scanlon, M.J. Methyl probes in proteins for determining ligand binding mode in weak protein-ligand complexes. Sci. Rep. 2022, 12, 11231. [Google Scholar] [CrossRef] [Scilit] [PubMed]
  53. John, M.; Pintacuda, G.; Park, A.Y.; Dixon, N.E.; Otting, G. Structure Determination of Protein-Ligand Complexes by Transferred Paramagnetic Shifts. J. Am. Chem. Soc. 2006, 128, 12910–12916. [Google Scholar] [CrossRef] [Scilit] [PubMed]
  54. Honorato, R.V.; Trellet, M.E.; Jiménez-García, B.; Schaarschmidt, J.J.; Giulini, M.; Reys, V.; Koukos, P.I.; Rodrigues, J.P.G.L.M.; Karaca, E.; van Zundert, G.C.P.; et al. The HADDOCK2.4 web server for integrative modeling of biomolecular complexes. Nat. Protoc. 2024, 19, 3219–3241. [Google Scholar] [CrossRef] [Scilit] [PubMed]
  55. Gryk, M.R.; Abseher, R.; Simon, B.; Nilges, M.; Oschkinat, H. Heteronuclear relaxation study of the PH domain of beta-spectrin: Restriction of loop motions upon binding inositol trisphosphate. J. Mol. Biol. 1998, 280, 879–896. [Google Scholar] [CrossRef] [Scilit] [PubMed]
  56. Ishima, R.; Freedberg, D.I.; Wang, Y.X.; Louis, J.M.; Torchia, D.A. Flap opening and dimer-interface flexibility in the free and inhibitor-bound HIV protease, and their implications for function. Structure 1999, 7, 1047–1055. [Google Scholar] [CrossRef] [Scilit] [PubMed]
  57. Boehr, D.D.; McElheny, D.; Dyson, H.J.; Wright, P.E. The dynamic energy landscape of dihydrofolate reductase catalysis. Science 2006, 313, 1638–1642. [Google Scholar] [CrossRef] [Scilit] [PubMed]
  58. Overbeck, J.H.; Kremer, W.; Sprangers, R. A suite of 19F based relaxation dispersion experiments to assess biomolecular motions. J. Biomol. NMR 2020, 74, 753–766. [Google Scholar] [CrossRef] [Scilit] [PubMed]
  59. Trosset, J.Y.; Dalvit, C.; Knapp, S.; Fasolini, M.; Veronesi, M.; Mantegani, S.; Gianellini, L.M.; Catana, C.; Sundström, M.; Stouten, P.F.W.; et al. Inhibition of protein-protein interactions: The discovery of druglike beta-catenin inhibitors by combining virtual and biophysical screening. Proteins 2006, 64, 60–67. [Google Scholar] [CrossRef] [Scilit] [PubMed]
  60. Hughes, T.S.; Giri, P.K.; de Vera, I.M.S.; Marciano, D.P.; Kuruvilla, D.S.; Shin, Y.; Blayo, A.L.; Kamenecka, T.M.; Burris, T.P.; Griffin, P.R.; et al. An alternate binding site for PPARγ ligands. Nat. Commun. 2014, 5, 3571. [Google Scholar] [CrossRef] [Scilit] [PubMed]
  61. Klukowski, P.; Riek, R.; Güntert, P. Rapid protein assignments and structures from raw NMR spectra with the deep learning technique ARTINA. Nat. Commun. 2022, 13, 6151. [Google Scholar] [CrossRef] [Scilit] [PubMed]
Figure 1. STD analysis confirms the grey ligand interacts with the protein. (A) Schematic of the protein–ligand complex without selective saturation (blue: protein, grey/orange: ligands, green: water). (B) Schematic of the protein–ligand complex under selective saturation (blue: protein; grey/orange: ligands; green: water, yellow: selective saturation irradiation at proper frequency). (C) Off-resonance spectrum under condition A. (D) On-resonance spectrum under condition B. (E) The STD difference spectrum (off-resonance—on-resonance) shows signals only for the grey ligand, confirming its direct interaction with the protein, while the orange ligand shows no binding.
Ijms 27 07561 g001
Figure 2. WaterLOGSY analysis confirms the grey ligand interacts with the protein. (A) Schematic of free ligands in solution (grey/orange: ligands; green: water, yellow: excitation of the bulk water resonance). (B) Schematic of ligands in the presence of the protein (blue: protein; grey/orange: ligands; green: water, yellow: excitation of the bulk water resonance). (C) WaterLOGSY spectrum under condition A (free ligands), showing negative signals. (D) WaterLOGSY spectrum under condition B (with protein); the grey ligand displays positive signals, confirming its binding, while the orange ligand remains unbound (negative peaks).
Ijms 27 07561 g002
Figure 3. T relaxation experiments confirm the grey ligand interacts with the protein. (A) Schematic of free ligands in solution (grey/orange: ligands; green: water). (B) Schematic of ligands in the presence of the protein (blue: protein; grey/orange: ligands; green: water). (C) T spectra for free ligands (Condition A) at spin-lock times of 10 ms (top) and 200 ms (below), signals show moderate attenuation, typical of small molecules in free solution. (D) T spectra in the presence of protein (Condition B) at spin-lock times of 10 ms (top) and 200 ms (below), signals exhibit significant reduction at 200 ms, demonstrating that the grey ligand interacts with the protein, while the orange ligand remains unbound.
Ijms 27 07561 g003
Figure 4. Ligand binding induces conformational changes in Drosophila OBP44a. (A) Superimposed 1H-15N HSQC spectra of free (black) and 8(Z)-eicosenoic acid-bound (red) OBP44a, showing significant chemical shift perturbations (CSPs) upon binding. (B) CSP values (Δδ = [(Δδ1H)2 + (Δδ15N/5)2]1/2) plotted against residue number, identifying the binding interface primarily in the C-terminal region. Data from BMRB entries 52374 and 52377 [31]. (C) Mapping of residues with Δδ > 0.5 ppm (green) onto the alphafold-predicted structure of OBP44a (via Swiss-Prot: AF-Q7K084-F1), highlighting the ligand binding site.
Ijms 27 07561 g004
Figure 5. Structural characterization of the Bcl-xL ternary complex (PDB: 1YSG). Left panel: Overall structure of the complex. Right panel: Magnified view of the local region (indicated by the box in the left panel), showing the residues R143, L134, Y105 (yellow) close to small-molecule ligand 4′-Fluorobiphenyl-4-carboxylic acid (green). The structural model is restrained by 48 intermolecular protein–ligand NOEs. This structure shows the important role of NMR spectroscopy in elucidating the atomic details of protein–ligand interactions.
Ijms 27 07561 g005
Figure 6. NMR-driven workflow for protein–ligand interaction studies. NMR offers a versatile toolkit for characterizing molecular recognition events. Based on the hierarchical information they provide, NMR experiments can be categorized into three distinct classes: (i) qualitative binding detection at the molecular level, (ii) mapping of binding interfaces at the residue level, and (iii) atomic-resolution structure determination and conformational dynamics characterization of protein–ligand complexes.
Ijms 27 07561 g006
Table 1. NMR techniques for screening and characterizing protein–ligand interactions.
LevelTechniquePrincipleAdvantagesLimitations
Molecular levelSTD
(Saturation Transfer Difference)
Ligand-observed.
Saturation is transferred from the protein to the bound ligand via spin diffusion. The difference spectrum reveals binding epitopes.
1. Effective for weak to moderate affinity (Kd in µM-mM range).
2. Works with low protein concentrations (µM range).
3. No isotopic labeling required.
1. Not suitable for tight binding (slow exchange regime).
2. Prone to false positives from non-specific binding or ligand aggregation.
3. Spin diffusion may overestimate binding epitope.
WaterLOGSY
(Water–Ligand Observed via Gradient Spectroscopy)
Ligand-observed.
Magnetization is transferred from bulk water to the ligand via the protein. Bound ligands typically exhibit signal sign opposite to non-binders.
1. Highly sensitive for detecting weak binders (Kd in µM-mM range).
2. Works with low protein concentrations (µM range).
3. No isotopic labeling required.
1. Requires ligand protons for detection; signals may be weak or absent for certain ligand classes.
2. Susceptible to artifacts from non-specific binding or ligand aggregation.
CPMG/TLigand-observed.
Bound ligand tumbles more slowly, enhancing transverse relaxation and attenuating signal in CPMG/T spectra; comparison of spectra with and without protein identifies binders. In the slow-exchange limit (tight binding), signal attenuation can become complete, which itself confirms binding.
1. Applicable to a wide affinity range (weak to tight) with optimized ratios.
2. Works with low protein concentrations (µM range).
3. No isotopic labeling required.
1. Optimization of ligand/protein ratios is critical: for weak binders, excess ligand is needed for detectable attenuation; for tight binders, 1:1 ratio may be used, where signal loss (rather than attenuation) reports binding.
2. False positives may arise from non-specific binding or ligand aggregation.
Residue level19F NMRLigand- or Protein-observed.
Monitoring chemical shift perturbations or line-broadening of fluorine nuclei. High sensitivity due to 100% natural abundance and lack of background.
1. Broad Kd range (nM-mM); applicable to both weak and tight binding.
2. Applicable to large proteins.
1. Requires incorporation of fluorine (synthesis of fluorinated ligands or biosynthetic labeling).
2. Limited to fluorine-containing systems.
1H-15N HSQCProtein-observed.
Monitoring chemical shift perturbations (CSPs) of backbone amide resonances upon ligand titration.
1. Directly reveals the binding interface; suitable for both weak and tight binding.
2. With TROSY/deuteration, applicable well above 30 kDa.
1. Requires 15N labeling.
2. Protein size typically <30 kDa without TROSY.
3. Needs relatively high protein concentration and stability (typically tens to hundreds of µM).
Atomic levelStructure and Dynamics
(NOE, Relaxation)
Protein/ligand-observed.
NOE-based distance restraints, structure calculation;
relaxation parameters (R1, R2, steady-state NOE) for ps-ns dynamics; CPMG/R dispersion and ZZ-exchange for µs-ms to slower exchange processes
1. Provides atomic-resolution binding mode and conformational ensembles.
2. Characterizes dynamics from ps-ns to ms timescales.
3. Near-physiological solution conditions.
1. Demands high protein stability, solubility, and concentration (~1 mM);
2. Size limited to <30 kDa
3. Time-consuming for data acquisition and analysis;
Disclaimer/Publisher’s Note: The statements, opinions and data contained in all publications are solely those of the individual author(s) and contributor(s) and not of MDPI and/or the editor(s). MDPI and/or the editor(s) disclaim responsibility for any injury to people or property resulting from any ideas, methods, instructions or products referred to in the content.