1. Introduction
Long COVID, also termed post-acute sequelae of SARS-CoV-2 infection (PASC), remains a substantial global health problem. The cumulative global burden was estimated to have reached approximately 400 million individuals worldwide by the end of 2023, with an annual detrimental economic impact approaching
$1 trillion [
1]. PASC can affect multiple organ systems, and neurologic manifestations are among the most debilitating and include ‘brain fog’, cognitive dysfunction, headache, dizziness, sleep disturbance, and intense fatigue [
2]. Neuro-PASC (NP) can occur after mild acute infection, and symptoms may persist for years. Age is known to influence the clinical presentation of NP, where younger and middle-aged adults are more severely affected, with few studies dedicated to older adults [
3]. Characterizing the physiologic and immune processes associated with cognitive symptoms in this population is therefore necessary to identify potential mechanisms and targets for intervention.
Sleep disturbance is common in NP, but objective evaluations of sleep physiology remain relatively sparse. Polysomnography in adults with chronic insomnia after COVID-19 has demonstrated reduced sleep efficiency and prolonged wake after sleep onset [
4]. More recently, adults with long COVID were found to have significantly lower average average peripheral oxygen saturation (SpO
2) after sleep onset and during rapid eye movement (REM) than sleep-matched controls [
5]. These measurements describe distinct components of sleep physiology, with mean and minimum SpO
2 quantifying different features of oxygenation, while the apnea-hypopnea index and oxygen desaturation index measure respiratory events rather than oxygenation itself. Direct evidence linking objective nocturnal oxygenation to objective cognitive performance in PASC remains limited. A pilot study of supplemental oxygen found no overall improvement in cognitive performance, though cerebral perfusion and oxygenation have been associated with attention and daytime sleepiness after COVID-19 [
6]. The relationship among objective sleep physiology, cognition, and systemic immune abnormalities which have been observed in NP is therefore poorly understood.
Mitochondrial and persistent immune abnormalities may contribute to neurologic symptoms following SARS-CoV-2 infection. During acute infection, SARS-CoV-2 exposure can promote mitochondrial reactive oxygen species (mtROS)-dependent glycolytic reprogramming in monocytes, while circulating monocytes from patients with COVID-19 pneumonia have shown impaired oxygen usage, altered mitochondrial membrane potential, and abnormal morphology [
7,
8]. Evidence of metabolic alteration following the acute phase is inconsistent. Bulk peripheral blood mononuclear cells (PBMCs) from individuals with PASC have demonstrated increased basal, adenosine triphosphate (ATP)-linked, maximal, and spare respiratory capacity, whereas other studies have identified increased oxygen consumption accompanied by abnormal membrane potential or impaired monocyte adaptation to oxidative stress and mitochondrial DNA depletion [
9,
10,
11]. Our group previously found that COX7A1 in plasma, an oxidative phosphorylation (OXPHOS)-associated protein, was elevated in NP and associated with worse recovery, fatigue, subjective cognition, processing speed, and attention [
12]. COX7A1 also showed an inverse relationship with other OXPHOS-associated plasma proteins in NP but a positive relationship in COVID convalescent controls (CCs). These findings support mitochondrial involvement in NP but do not identify the cellular source of the plasma proteins, establish whether this is associated with increased or decreased mitochondrial activity, or define how mitochondrial programs relate across immune cell compartments.
Studies in acute COVID-19 have identified metabolic abnormalities in myeloid and lymphoid populations measured within the same cohorts, including mitochondrial dysfunction and apoptotic susceptibility in T cells together with metabolically altered myeloid populations [
13,
14]. Given that mitochondrial and metabolic abnormalities have been identified in both myeloid and lymphoid populations following SARS-CoV-2 infection, it is important to consider how these compartments function in relation to one another. Myeloid and lymphoid lineages contribute complementary roles in immune activation, regulation, and resolution, yet little is known about how their metabolic programs vary together in chronic NP. We therefore combined flow cytometry (FC), objective sleep profiling, standardized cognitive testing, and single-cell RNA sequencing (scRNA-seq) to examine mitochondrial immune phenotypes in older adults with and without NP. We evaluated whether objective sleep parameters and cognitive performance were associated with cellular transcription patterns and whether the cellular phenotypes showed different relationships across groups, and finally whether these were associated with SARS-CoV-2-responsive or expanded T-cell populations.
3. Discussion
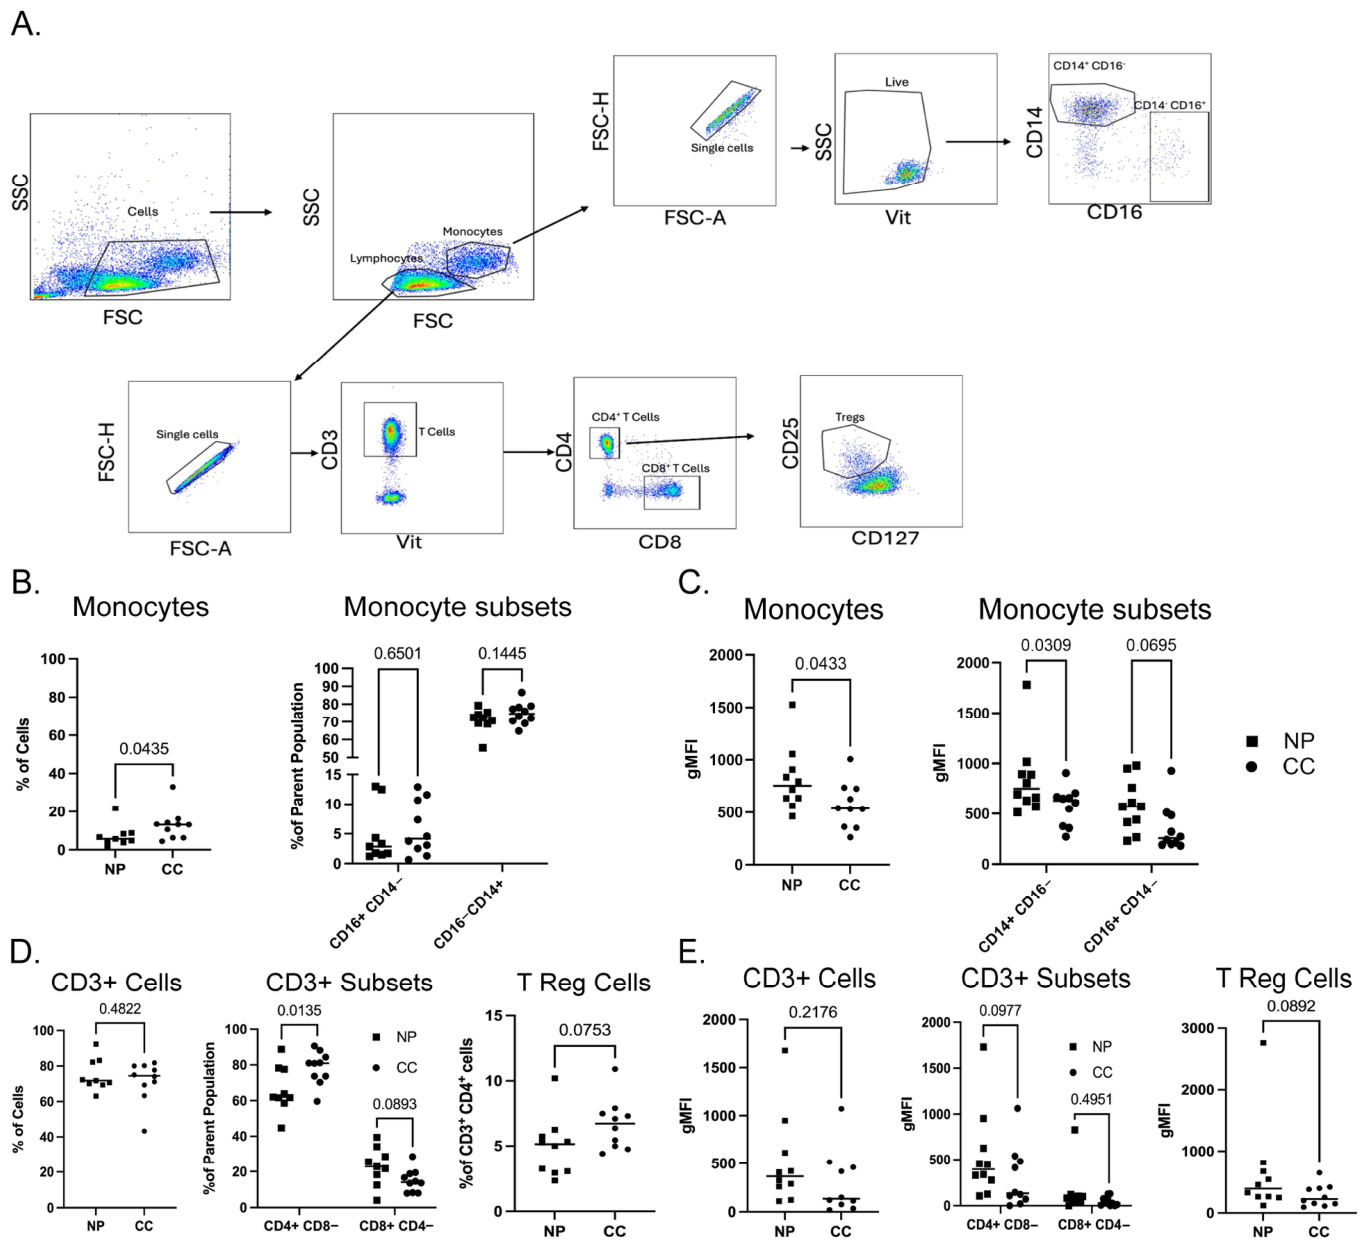
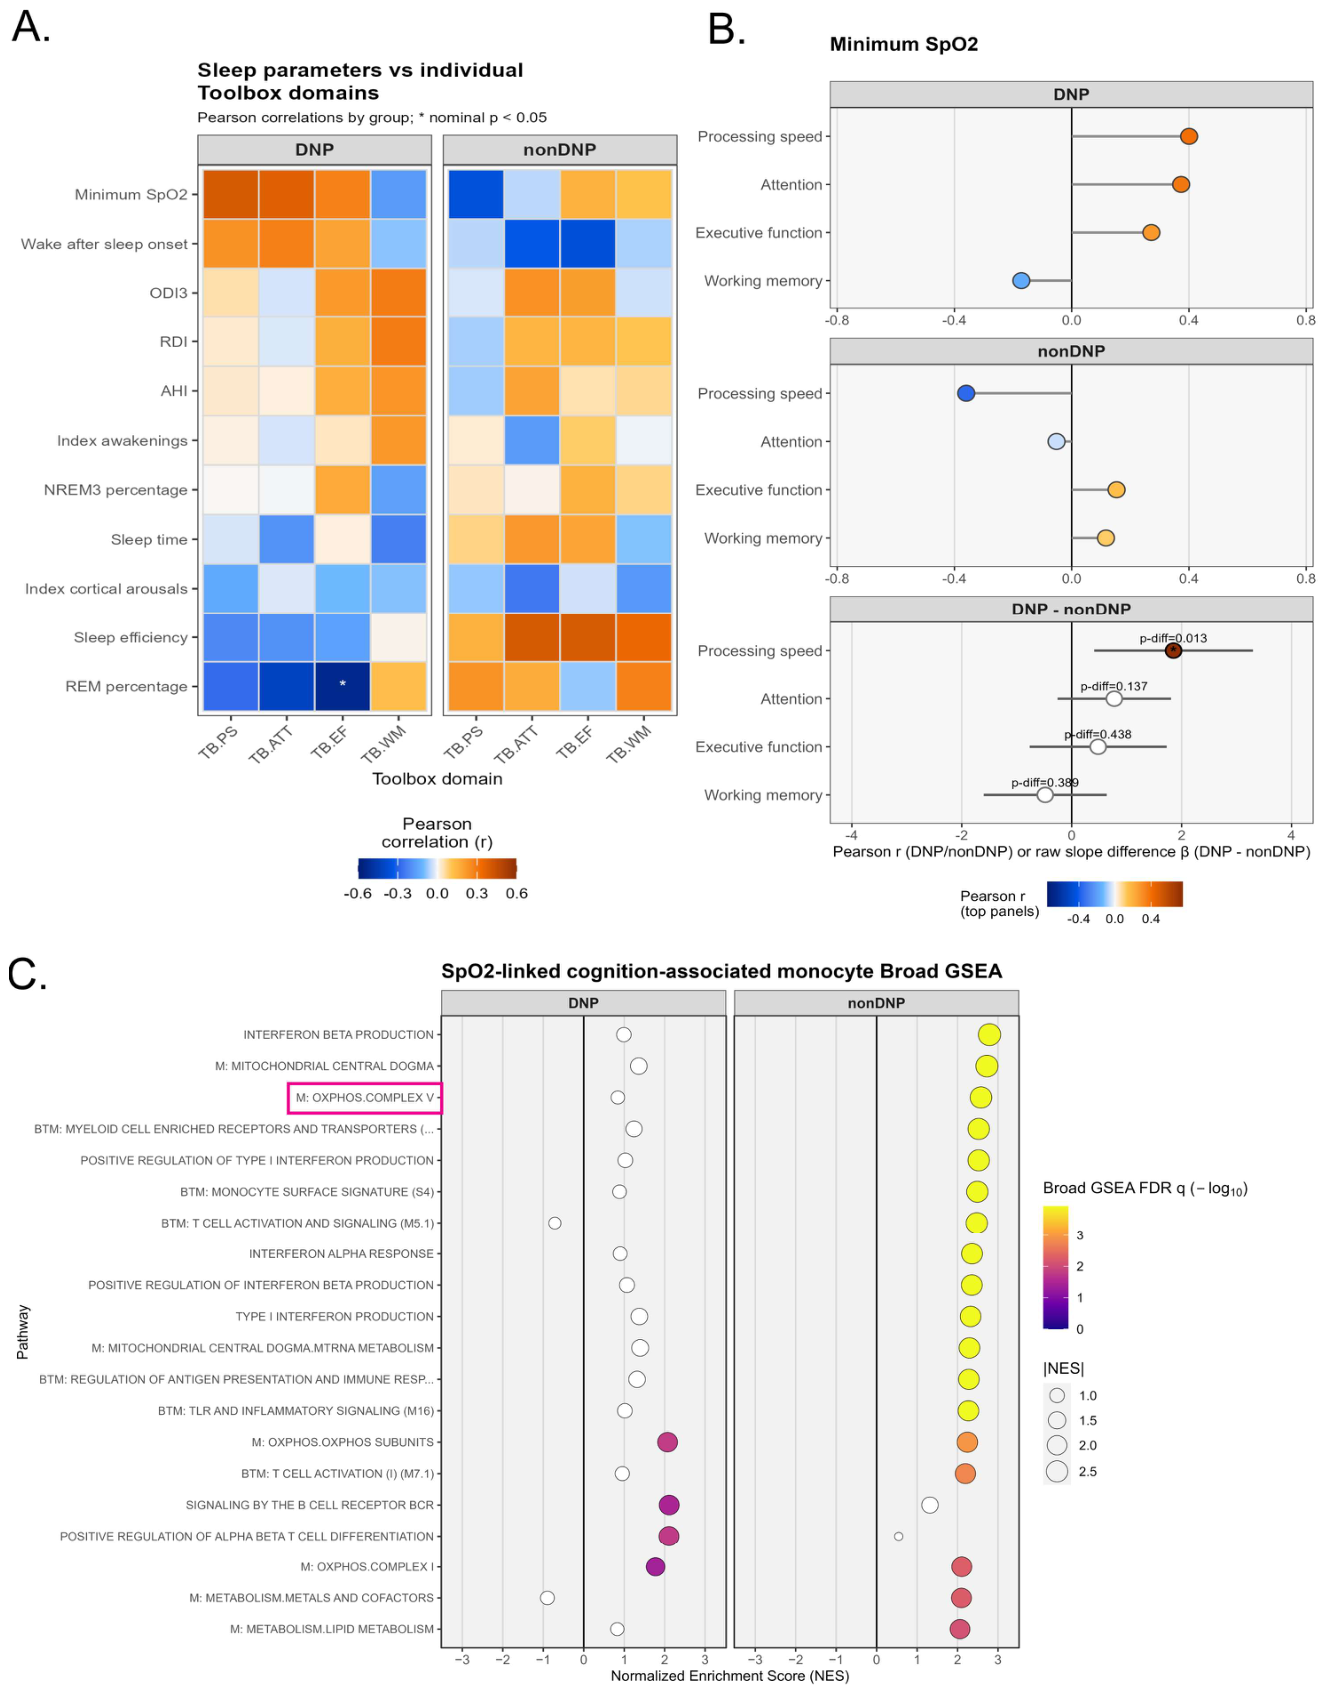
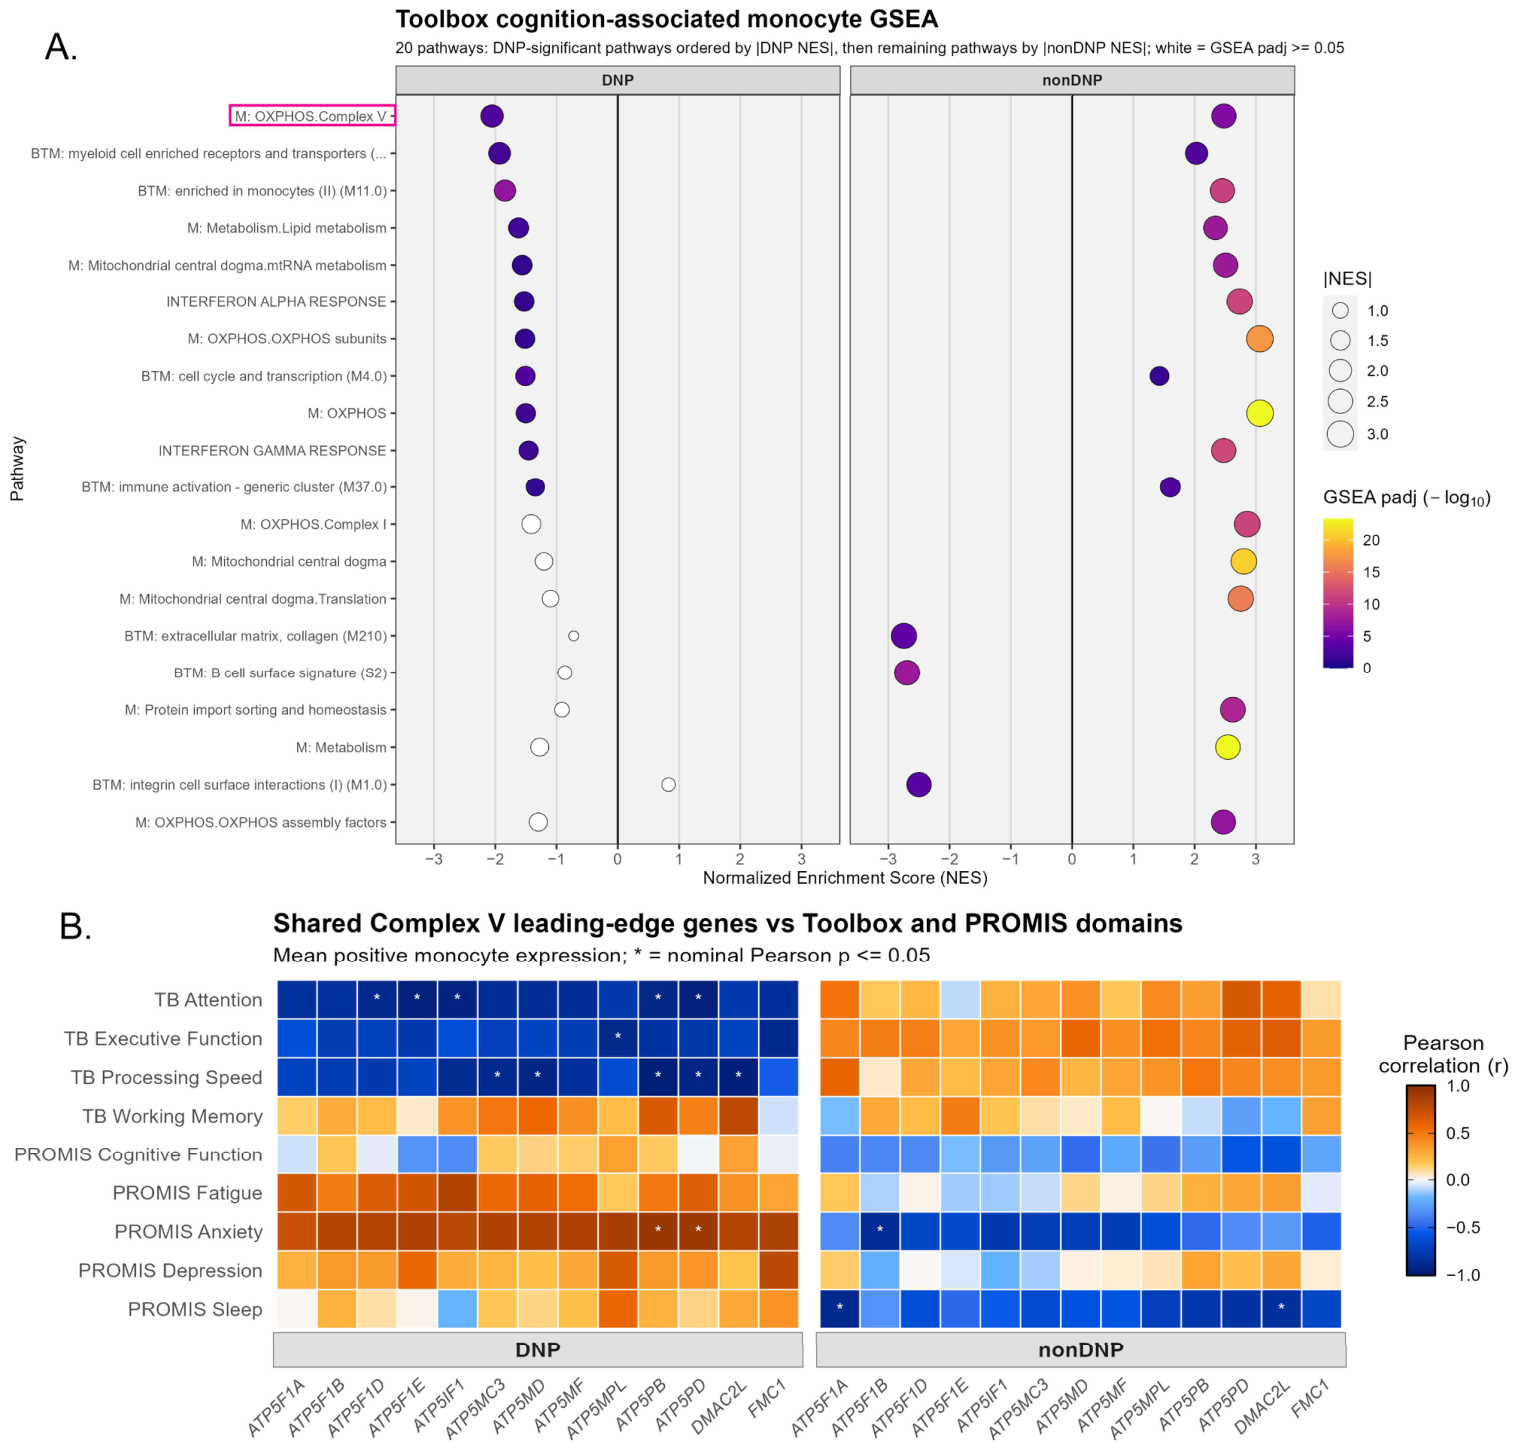
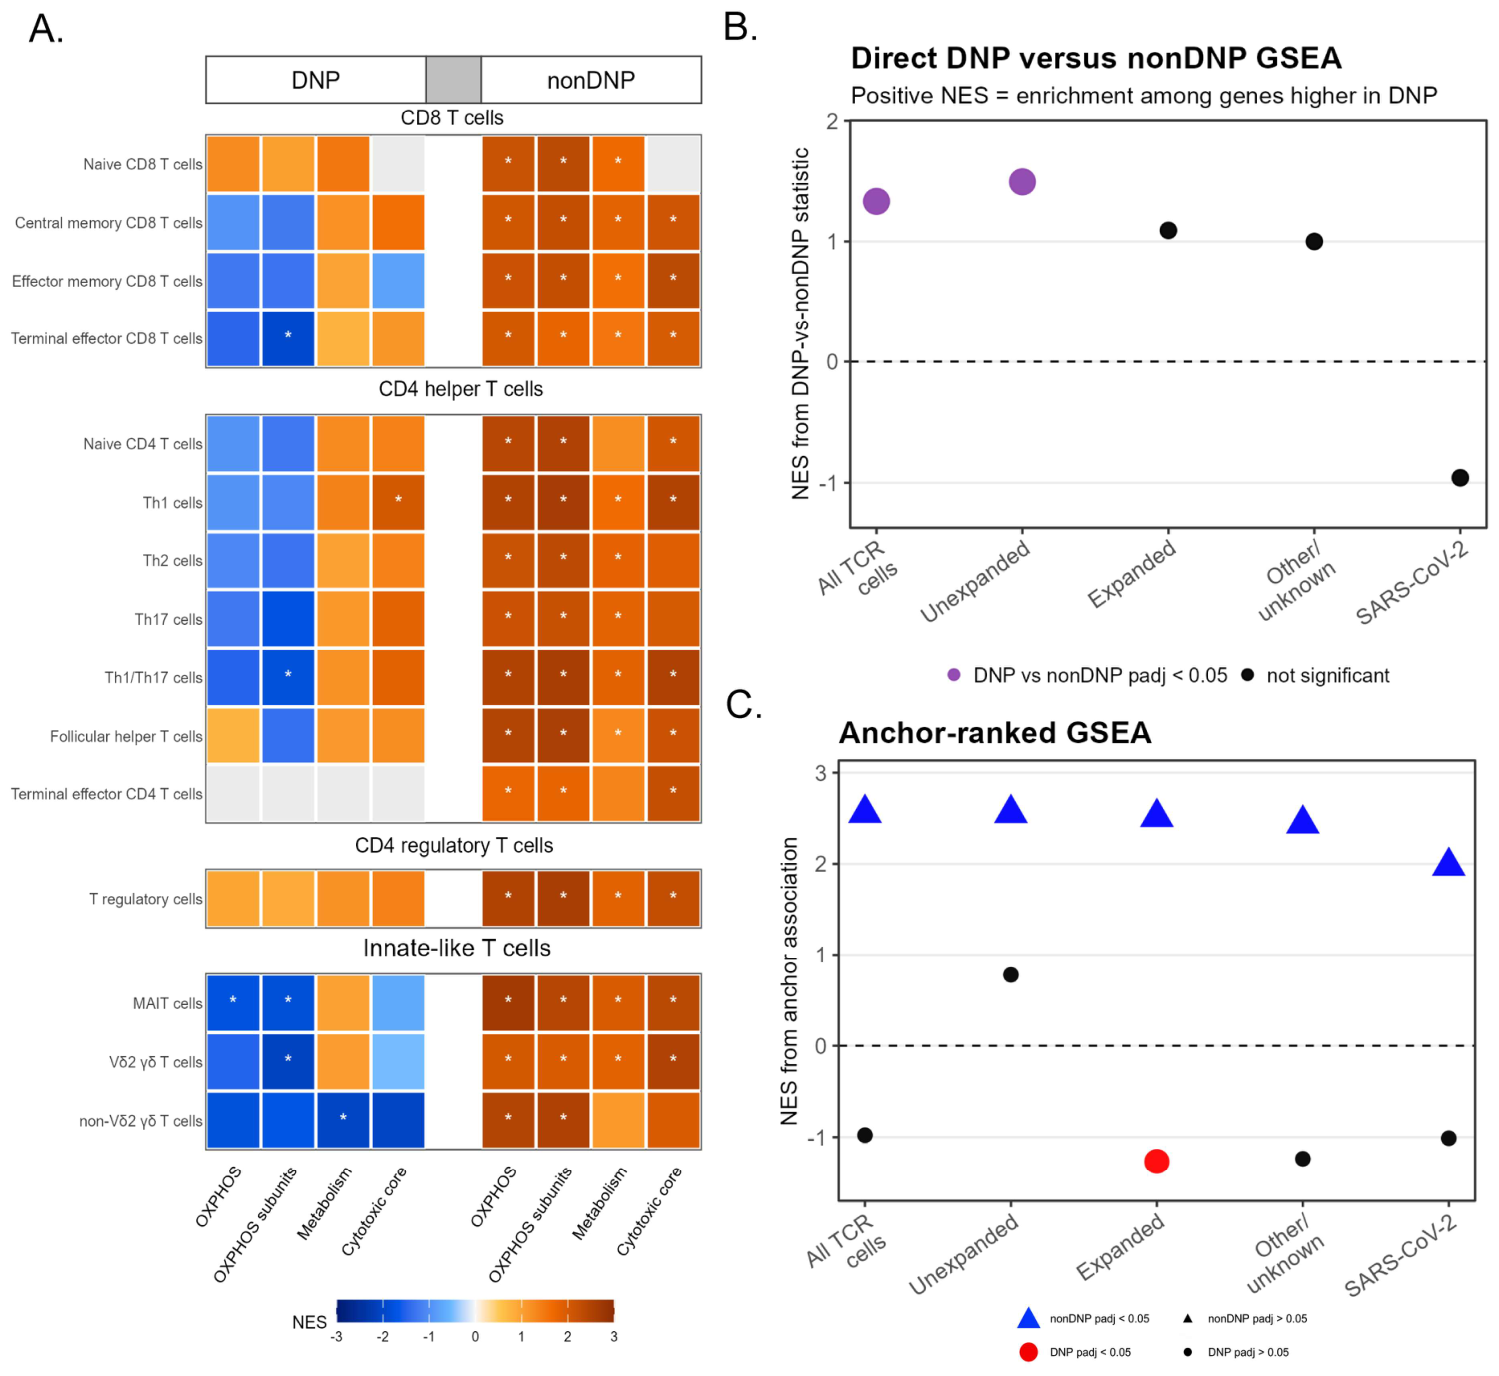
In this study, we identified a monocyte-centered mitochondrial phenotype and reduced coordination between monocyte and lymphocyte mitochondrial programs in adults over the age of 55 with NP. FC showed reduced circulating monocyte abundance together with increased monocyte mtROS in participants with NP. Among DNP participants, minimum SpO2 was positively associated with objective cognitive performance. In monocytes, ATP synthase/Complex V pathways were associated with both minimum SpO2 and cognition, and the shared leading-edge genes from these analyses defined a 13-gene monocyte anchor. Increasing anchor scores were accompanied by broadly positive OXPHOS enrichment across CD3+ T-cell populations in nonDNP participants, whereas this relationship was weaker or absent in DNP. The same pattern was observed in expanded and unexpanded T-cell populations, and FC correlations provided orthogonal support for reduced coordination between monocyte and lymphocyte mitochondrial programs in NP.
The association between minimum SpO
2 and objective cognitive performance adds to existing evidence that sleep physiology and oxygenation remain altered in some individuals with long COVID/PASC. In a preliminary polysomnography study, adults with PASC had modestly lower average SpO
2 after sleep onset and during REM sleep than controls, including after controlling for apnea [
5]. Additional studies have identified altered sleep architecture or a higher burden of disordered sleep breathing in selected PASC populations [
4]. However, direct evidence linking nocturnal oxygenation to cognitive symptoms associated with PASC remains limited to date. Trials of supplemental oxygen found no overall improvement in cognitive performance [
24]. Altered cerebral perfusion and oxygenation have also been related to measures of cognition such as attention as well as fatigue associated with PASC, but while these central nervous system (CNS) measures may be related to peripheral SpO
2, they remain distinct. Our findings therefore suggest that nighttime hypoxemia as measured by minimum SpO
2 may prove relevant to cognitive performance in Neuro-PASC.
Our monocyte findings are consistent with growing evidence that SARS-CoV-2 infection is accompanied by substantial mitochondrial and metabolic remodeling in circulating immune cells. During acute infection, SARS-CoV-2 exposure can promote mtROS and HIF-1α-dependent glycolytic reprogramming in monocytes, supporting inflammatory cytokine production and impairing T-cell responses [
7]. Circulating monocytes from patients with COVID-19 pneumonia have also shown mitochondrial effects such as reduced basal and maximal respiration, diminished spare respiratory capacity, depolarization, and abnormal morphology [
8].
These acute studies establish that monocytes metabolically respond to SARS-CoV-2 infection, but the relevance to PASC remains less well understood, with studies showing inconsistent effects. Bulk PBMCs from individuals with PASC have shown increased basal, ATP-linked, maximal, and spare respiratory capacity compared with recovered and naive controls [
9,
10,
11]. Conversely, a small study of monocytes from participants with cardiovascular symptoms of PASC identified impaired respiratory adaptation to oxidative challenge, abnormal membrane potential, and decreased mitochondrial DNA. Collectively, these works support persistent mitochondrial remodeling in PASC monocytes but do not define a single uniform state of increased or decreased mitochondrial activity.
This distinction is particularly important for interpreting the OXPHOS and related Complex V enrichment observed in our scRNA-seq analyses. Enrichment of OXPHOS transcripts does not directly measure oxygen consumption, ATP production, respiratory coupling, mitochondrial mass, substrate preference, or spare respiratory capacity. Prior studies suggest that increased oxygen consumption can coexist with abnormal membrane potential or impaired adaptation to oxidative stress [
9,
10,
11]. Thus, the cognition-associated monocyte phenotype identified here should be directly measured before determining the functional effects of these findings. The concurrent elevation of monocyte MitoSOX fluorescence supports an altered mitochondrial redox state, but direct measurements, such as Seahorse, will be needed to determine whether the transcriptional program represents increased respiratory activity, compensatory remodeling, inefficient respiration, or another response to mitochondrial stress.
The central finding here is that the relationship between the monocyte phenotype and CD3
+ T-cell transcriptional programs differed between groups. In nonDNP participants, increasing anchor scores were accompanied by coordinated positive enrichment of OXPHOS genes across multiple CD3
+ T-cell subsets. In DNP, however, the corresponding relationships were weaker, inconsistent, or negative. Paired analyses of myeloid and lymphoid metabolism remain limited in PASC, but severe acute COVID-19 provides evidence that these compartments can develop distinct metabolic states within the same inflammatory environment. Thompson et al. identified metabolically abnormal T cells with mitochondrial dysfunction and susceptibility to apoptosis together with distinct myeloid suppressor populations in patients with severe COVID-19 [
13]. Additionally, Siska et al. observed disease-stage-dependent abnormalities in mitochondrial substrate uptake, ROS accumulation, and related gene expression across both T-cell and myeloid populations [
14].
Our findings may also reflect a broader transcriptomic signature of bioenergetic stress response in NP monocytes. Complex V, or mitochondrial ATP synthase, is the terminal oxidative phosphorylation complex responsible for ATP generation, but increased transcription of its component genes does not necessarily indicate increased ATP synthesis or more efficient respiration. One possibility is that the inverse relationship between Complex V-related transcription and cognition reflects compensatory induction of ATP synthase subunits in monocytes under energetic stress, particularly given the increased monocyte mtROS observed by FC. This interpretation is consistent with emerging evidence implicating mitochondrial dysfunction and impaired bioenergetics in PASC. Alternatively, sustained Complex V-related transcription could reflect maladaptive mitochondrial remodeling in which increased expression does not restore normal bioenergetic function, or it may represent a broader monocyte stress state associated with disease burden. However, because transcriptional induction does not necessarily indicate increased ATP production, future studies using direct measures of ATP synthesis will be needed to determine whether the Complex V alterations reflect compensatory upregulation, impaired ATP generation, maladaptive remodeling, or a broader stress response.
The results herein do not suggest that monocytes directly regulate T cell metabolism nor that the observed phenomenon reflects a direct interaction between the two compartments. We instead suggest that monocyte and lymphocyte mitochondrial programs may respond differently to a shared upstream factor, such as inflammatory mediators, altered nutrient availability, redox stress, hypoxia, or persistent immune stimulation. Nevertheless, the broadly positive association observed in nonDNP participants indicates that monocyte and lymphocyte mitochondrial programs varied together across individuals, whereas this association was diminished or absent in DNP. The distinction between pathway expression and transcriptomic coordination is also important. DNP T cells showed higher OXPHOS enrichment in direct group comparisons while failing to vary in parallel with the monocyte phenotype. Functional assays will be needed to determine how these transcriptional associations relate to mitochondrial metabolism and cellular function.
The TcR-stratified analyses further showed that the altered relationship was not limited to clonally expanded T cells. SARS-CoV-2-specific CD8
+ T cells and characteristic TcR clonotypes can persist for at least two years following infection, including in people with PASC [
25]. These findings indicate that this phenomenon is not dependent on SARS-CoV-2 specificity, and that persistence of antigen-specific T cells does not explain the PASC phenotype described here. In our study, similar alterations in the anchor relationship were observed in expanded and unexpanded T-cell populations. This argues against an explanation restricted to expanded clones but does not exclude contributions from persistent antigen, bystander activation, or antigen-specific cells not identified by the available TcR databases. Unexpanded cells should also not be interpreted as uniformly naïve, resting, or antigen-inexperienced.
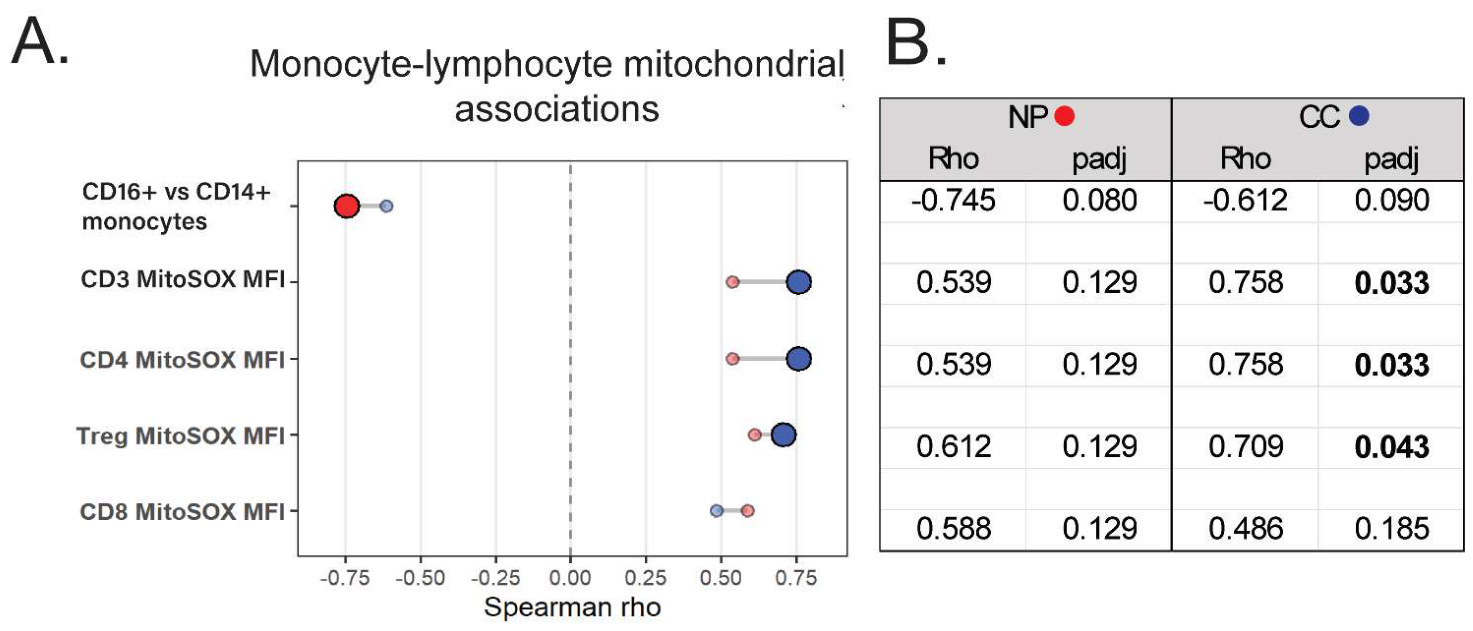
The FC analysis provided orthogonal support for altered monocyte–lymphocyte mitochondrial relationships. In a separate group of participants without PASC, monocyte MitoSOX fluorescence was positively associated with MitoSOX fluorescence in total CD3, CD4, and regulatory T-cell populations, whereas these associations were attenuated in NP, though it is important to note that MitoSOX fluorescence and OXPHOS transcriptional enrichment measure different aspects of mitochondrial biology. The convergence of the FC and scRNA-seq analyses supports the broader conclusion that mitochondrial states across monocyte and lymphocyte compartments were more closely related in participants without NP than in those with persistent neurologic symptoms.
Limitations
Several limitations should be considered. The analyses are exploratory, and the scRNA-seq cohort was small, limiting statistical precision and increasing the possibility that the identified genes and downstream pathway relationships are cohort-specific. Outlier screening and LOO analyses indicated that the 13-gene monocyte anchor was stable to individual donor omission, supporting its use as a summary measure of the monocyte transcriptional phenotype within this cohort. However, the broader finding of altered coordination between monocyte OXPHOS/Complex V transcriptional programs and T-cell transcriptional programs, and their connections to cognition, remains exploratory. Replication in larger, independent cohorts with paired monocyte and lymphocyte transcriptomic data will be important to determine the reproducibility and generalizability of this cross-compartment relationship.
The Complex V anchor was also defined from overlapping leading-edge genes in two related analyses: the nonDNP SpO2-linked cognition analysis and the DNP cognition-associated analysis. Because sleep oxygenation and cognition were associated in this cohort, these inputs were not fully independent. The resulting anchor should therefore be interpreted as a shared Complex V transcriptional signature related to the sleep-cognition relationship, rather than as a marker specific to either hypoxia or cognitive dysfunction alone. Independent cohorts and longitudinal studies will be needed to determine whether this monocyte program primarily reflects sleep-related oxygenation, cognitive dysfunction, or a broader process linking the two.
The CD3+ enrichment procedure represents an additional limitation because the non-CD3-expressing bystander cells carried through the isolation process may not fully represent the abundance or diversity of circulating monocytes in the original specimens. Although monocyte abundance was evaluated separately by FC, selection during cell isolation could have influenced which monocyte states were available for transcriptional analysis. In addition, although these monocytes were not directly targeted by the CD3 selection reagent, we cannot exclude transcriptional perturbations associated with ex vivo handling and passage through the enrichment workflow. The monocyte transcriptional findings should therefore be interpreted as representing the bystander monocyte population retained during CD3+ enrichment rather than an unbiased transcriptional profile of circulating monocytes. Cell annotations were reference-based because unsupervised dimensional reduction was strongly influenced by donor variability, and some finer immune states may not have been resolved. This study was also cross-sectional, preventing determination of changes over time. We therefore cannot establish whether the monocyte phenotype contributes to altered lymphocyte responses, whether lymphocyte changes influence monocytes, or whether both arise from a shared upstream process. Finally, pathway enrichment and MitoSOX fluorescence do not directly measure mitochondrial respiration, ATP production, coupling efficiency, or substrate use. Future studies of functional outputs should be considered.
Despite these limitations, the distinctive features found here identify altered relationships between myeloid and lymphoid mitochondrial programs in NP that are associated with decreased objective cognition. The persistence of this pattern across multiple CD3+ T-cell subsets, expanded and unexpanded T-cell populations, and an orthogonal FC analysis from a different set of patients suggests a broad alteration in coordination of mitochondria-associated transcriptional programs across myeloid and lymphoid compartments. Longitudinal studies combining objective sleep measures, cognitive assessment, paired monocyte and lymphocyte respirometry, metabolomics, and single-cell profiling will be required to determine the origin, direction, and functional consequences of this altered coordination.
4. Materials and Methods
4.1. Study Participants
Adult participants were enrolled through the Northwestern Medicine Neuro-COVID-19 Clinic and the DISCO study under Northwestern University Institutional Review Board (IRB) protocol STU00217720. Additional participants were enrolled from the Neuro-COVID-19 clinic or from the community under Northwestern University IRB protocol STU00212583. All participants provided written informed consent.
Subjects participated in one of three arms. Arm (1): DISCO participants with Neuro-PASC, designated as the DNP group, had a medically documented positive SARS-CoV-2 PCR or antigen test and persistent neurologic symptoms lasting at least 3 months following acute infection. Arm (2): DISCO participants were age- and sex-matched control subjects designated nonDNP with undocumented SARS-CoV-2 infection status and without symptoms of NP. Arm (3): NP patients who had a medically documented positive SARS-CoV-2 PCR or antigen test and persistent neurologic symptoms lasting at least 3 months following acute infection and age- and sex-matched COVID convalescent control participants, designated the CC group, who had a documented history of SARS-CoV-2 infection but no reported persistent post-acute symptoms.
Within arms 1 and 2, all 43 participants underwent sleep profiling and completed cognitive and quality-of-life assessments. Eleven of these participants (5 DNP and 6 nonDNP) were also included in the single-cell RNA-sequencing analysis. Final group sizes and participant overlap between the DISCO and flow cytometry cohorts are summarized in
Table 1.
The analyses reported here were performed on previously collected data and were not blinded to participant group assignment.
4.2. Clinical, Cognitive, and Sleep Assessments
Participants completed the objective NIH Toolbox and subjective Patient-Reported Outcomes Measurement Information System (PROMIS) questionnaires at or near the time of blood collection [
26,
27,
28]. NIH Toolbox domains included processing speed, attention, executive function, and working memory. PROMIS domain scores were expressed as standardized T-scores with a population mean of 50 and standard deviation of 10. Lower PROMIS cognitive-function scores indicated greater perceived cognitive difficulty, whereas higher fatigue, sleep-disturbance, anxiety, and depression scores indicated greater symptom severity.
Sleep assessments were obtained for all 43 DISCO participants as previously described [
29]. Briefly, level 2 polysomnography was conducted in a all participants using the Sleep Profiler system (Advanced Brain Monitoring, Carlsbad, CA, USA). Measurements included the duration and percentage of rapid eye movement sleep and non-rapid eye movement sleep stages N1, N2, and N3; sleep latency; wake after sleep onset; sleep efficiency; total and index measures of cortical arousals; pulse rate; electroencephalographic spectral power, including delta or slow-wave activity; and respiratory events, including apneas, hypopneas, and oxygen desaturations.
4.3. Peripheral Blood Mononuclear Cell and Plasma Isolation
Venous blood samples were collected into sodium heparin tubes. Whole blood was layered over 15 mL of Histopaque-1077 density-gradient medium (Sigma-Aldrich, St. Louis, MO, USA) in 50 mL Leucosep tubes (Greiner Bio-One, Kremsmünster, Austria) and centrifuged at 1000× g for 18 min at room temperature.
The plasma fraction was collected and stored at −80 °C. PBMCs were collected from the density-gradient interface, washed twice with sterile PBS, and treated with ACK red blood cell lysis buffer (Quality Biological, Gaithersburg, MD, USA). Cells were either used immediately or viably cryopreserved in 10% DMSO in FBS until downstream analysis.
4.4. CD3+ T-Cell Enrichment and Single-Cell RNA Sequencing
Freshly collected PBMCs were counted and subjected to positive selection for CD3-expressing cells using magnetic beads (Miltenyi Biotec, Bergisch Gladbach, Germany; catalog no. 130-050-101). The enriched cell fraction was then prepared for droplet-based single-cell RNA (scRNA) sequencing using the 10x Genomics platform (Chromium X, 10x Genomics, Pleasanton, CA, USA). Libraries were sequenced on a NovaSeq X Plus sequencing system (Illumina, Inc., San Diego, CA, USA).
Although the enrichment procedure targeted CD3+ T cells, a reproducible population of non-CD3+ cells was retained in the captured cell suspensions. These cells were considered bystander cells carried through the positive-selection procedure. Non-CD3+ cells were not analyzed for frequency because the enrichment process precluded interpretation of their relative abundance, but were retained for transcriptomic analyses when the relevant cell lineage was represented in all sequenced participants.
Single-cell gene-expression libraries were generated using the 10x Genomics platform. Base-call files were processed using Cell Ranger version 7.1.0 (10x Genomics, Pleasanton, CA, USA). Reads were aligned to the human GRCh38 reference genome using GENCODE release 32/Ensembl release 98 annotations. The resulting gene-by-cell count matrices were imported into Seurat for quality control and downstream analyses.
4.5. Flow Cytometry
Cryopreserved PBMCs were thawed and counted, and 1 × 10
6 cells per sample were stained with MitoSOX Red mitochondrial superoxide indicator (Invitrogen, Thermo Fisher Scientific, Waltham, MA, USA) at 37 °C according to the manufacturer’s instructions. Cells were washed and stained with viability dye (Invitrogen, Thermo Fisher Scientific) at room temperature in the dark. Following an additional wash, cells were stained with surface antibodies at 4 °C. Antibodies used for immunophenotyping are shown in
Table 2.
Samples were acquired on a BD FACSymphony A1 flow cytometer (BD Biosciences, San Jose, CA, USA), with 10,000 cellular events collected per sample. Data were analyzed using FlowJo version 10 (BD Biosciences, San Jose, CA, USA). Staining and analysis were performed as previously described [
30].
4.6. scRNA-Seq Data Processing and Quality Control
scRNA-seq data were analyzed in R version 4.4.1 using RStudio version 2024.12.1 Build 563 (Posit Software, PBC, Boston, MA, USA) on Windows. Single-cell analyses were performed using Seurat version 5.0.2 and SeuratObject version 5.1.0.
Cell Ranger filtered gene-by-cell count matrices from each participant were imported using Read10X and converted to individual Seurat objects. During initial object creation, genes detected in fewer than three cells within an individual participant and cells containing fewer than 200 detected genes were excluded. Participant-level objects were then merged into a single dataset.
The percentage of transcripts derived from mitochondrial genes was calculated for each cell. Cells were retained for analysis when they contained more than 500 and fewer than 6000 detected genes and less than 20% mitochondrial transcripts. Following quality-control filtering, gene-expression counts were normalized using Seurat’s log-normalization procedure.
4.7. Cell-Type Annotation and Lineage Selection
Final cell identities were assigned using a label-first strategy because unsupervised clustering approaches were dominated by interdonor variability and did not reproducibly resolve shared biologically meaningful populations across participants. Cell-level reference annotations were generated using SingleR version 2.6.0 with MonacoImmuneData from celldex version 1.14.0 as the reference dataset. Broad immune cell identities were assigned using the main Monaco reference labels, and T-cell populations were subsequently annotated using the fine-level reference labels. Reference-based annotations were evaluated using canonical lineage-marker expression and were manually reviewed and refined when supported by concordant marker patterns.
The annotated dataset was divided into T-cell and non-CD3+ compartments for downstream analysis. For lineage-specific analyses, only populations meeting the prespecified minimum cell-number requirements in both the DNP and nonDNP groups were retained. Final annotated objects were saved separately for the two compartments.
4.8. Associations of Monocyte Transcriptional Programs with Sleep and Cognitive Measures
Associations between monocyte gene expression and minimum SpO2 or cognitive performance were evaluated in the 11 participants included in the scRNA-seq cohort. Monocytes were identified using the broad SingleR annotation in the Seurat object. For each participant and gene, mean-positive expression was calculated as the mean normalized expression among monocytes with expression greater than zero; a value of zero was assigned when no monocytes from a participant expressed the gene.
For the minimum SpO2 analysis, within each group, participant-level monocyte mean-positive gene expression was modeled as a function of minimum SpO2 for each gene. Genes were ranked by the signed t statistic for minimum SpO2 and used for gene set enrichment analysis.
For the direct cognition analysis, NIH Toolbox processing speed, attention, executive function, and working memory scores were combined in a repeated-measures analysis. Associations between participant-level monocyte mean-positive gene expression and NIH Toolbox scores were calculated separately within each group using linear mixed-effects models with Toolbox domain as a fixed effect and participant ID as a random intercept.
For both analyses, genes were ranked by the corresponding within-group association statistic, and GSEA was performed separately in the DNP and nonDNP groups. The complete ranked gene universe was tested against the pathway collection contained in immune_t2g.rds. The complete gene membership for each pathway used in the analysis is provided in
Supplementary Table S2.
4.9. Monocyte Anchor Score
For each of the 13 anchor genes, a z-score was calculated from participant-level mean-positive expression using the standard formula:
where
x is the subject mean-positive expression value for each respective anchor gene,
μ is the mean expression of that gene across the 11 scRNA-seq participants, and
σ is the corresponding standard deviation. The monocyte anchor score for each subject was calculated as the average of the 13 anchor-gene z-scores.
4.10. CD3+ T-Cell Subset Differential Expression and Pathway Analyses
CD3+ T cells were analyzed using SingleR fine annotations. For each CD3+ T-cell subset, raw counts were summed by subject to generate pseudobulk count matrices. Only subsets represented by at least 50 cells per subject in at least three subjects within each group were included. Genes with at least 10 counts in at least two subjects were retained. Pseudobulk counts were converted to log2(counts per million [CPM] + 1), and Pearson correlations between gene expression and the monocyte anchor z-score were calculated separately within the DNP and nonDNP groups.
For pathway analysis, genes were ranked by their Pearson correlation coefficient with the monocyte anchor z-score. GSEA was performed using fgsea version 1.30.0 against the immune pathway collection contained in immune_t2g.rds. Pathways were evaluated using the multilevel GSEA algorithm with the lower p value boundary set to zero. Benjamini–Hochberg-adjusted p values were calculated across all pathways tested within each group and CD3+ T-cell subset.
4.11. TcR-Stratified Anchor-Ranked Pathway Analysis
TcR clonotype annotations were assigned using paired T-cell receptor beta variable gene (TRBV) and complementarity-determining region 3 beta (CDR3β) sequences. A TcR matching key was generated for each cell as TRBV:CDR3β. Cells lacking a valid matching key were excluded from the TcR analysis. Clonotype specificity annotations were generated by comparing TRBV and CDR3β sequences with VDJdb (release 30 July 2025;
https://vdjdb.cdr3.net), McPAS-TcR (
http://friedmanlab.weizmann.ac.il/McPAS-TCR/, accessed on 13 August 2026), and ImmuneCODE MIRA (
https://clients.adaptivebiotech.com/pub/covid-2020, accessed on 13 August 2026) entries using exact matches and near matches with a maximum Hamming or Levenshtein distance of one. Clonotypes were classified as SARS-CoV-2, autoreactive, both, or other/unknown based on the combined database annotations.
Clonotypes were considered expanded when the same TRBV:CDR3β combination was represented by at least two cells within a subject. Cells were evaluated in three analysis schemes: all cells in the TcR analysis universe; a primary expansion scheme separating unexpanded and expanded cells; and a detailed specificity scheme separating expanded other/unknown, expanded SARS-CoV-2, expanded autoreactive, and expanded clonotypes annotated as both SARS-CoV-2 and autoreactive.
For each analysis bin, raw counts were summed across cells within each subject to generate pseudobulk count matrices. Subject-level pseudobulk bins containing at least five cells were retained, and analyses were performed for group/bin combinations represented by at least three subjects. Pseudobulk counts were converted to log2(CPM + 1). Within each analysis bin, Pearson correlations between gene expression and the monocyte anchor z-score were calculated separately in the DNP and nonDNP groups, and genes were ranked by the resulting correlation coefficient.
NES and adjusted p values were determined by GSEA using the multilevel fgsea algorithm for the MITOCARTA_OXPHOS and CUSTOM_CYTOTOX_CORE pathways contained in immune_t2g.rds. Pathways with adjusted p < 0.05 were considered significant.
4.12. Associations Between Monocyte Mitochondrial Superoxide and Immune Cell Measures
Associations between monocyte mitochondrial superoxide and immune cell phenotypes were evaluated separately in the CC and NP groups. Monocyte MitoSOX fluorescence intensity was correlated with the percentages of CD14-positive and CD16-positive cells within the myeloid compartment and with MitoSOX fluorescence intensity in total CD3+, CD4+, and CD8+ populations as well as Tregs. Spearman correlation coefficients and corresponding p values were calculated using subjects with complete values for each comparison. Benjamini–Hochberg correction was applied across the tested correlations separately within each group.
4.13. Statistical Analysis
Statistical tests were selected according to the structure of each analysis. Two-group flow cytometry comparisons were evaluated by Mann–Whitney U tests and analyses incorporating group and cell subset factors by two-way ANOVA. Associations between continuous clinical measures were evaluated using Pearson or Spearman correlations as specified, and group differences in continuous associations were tested using regression interaction terms. Repeated NIH Toolbox cognitive domains were analyzed using linear mixed-effects models with participant as a random intercept. Ranked transcriptomic associations were evaluated by GSEA with multiple-testing correction as described in the corresponding analysis sections. Analyses were exploratory, and no a priori sample-size or power calculation was performed for the hypotheses evaluated in this study.
Outlier sensitivity analyses were performed to assess influential observations. Multivariate participant data were evaluated by PCA followed by robust Mahalanobis distance screening in the principal component space. For scRNA-seq data, participant-level pseudobulk profiles were evaluated together with donor technical quality control metrics of cell number, pseudobulk library size, median RNA count, median detected features, and median mitochondrial read percentage. Flow cytometry comparisons, minimum SpO2-to-processing speed interaction, and monocyte anchor z-scores were additionally assessed by LOO analysis.
4.14. Software and Code Availability
Software packages and applications used for data processing, statistical analysis, pathway analysis, and figure generation included GraphPad Prism version 10.4.1, Seurat version 5.0.2, SeuratObject version 5.1.0, SingleR version 2.6.0, celldex version 1.14.0, SingleCellExperiment version 1.26.0, clustree version 0.5.1, Harmony version 1.2.3, DESeq2 version 1.44.0, edgeR version 4.2.2, limma version 3.60.6, fgsea version 1.30.0, GSVA version 1.52.3, msigdbr version 25.1.1, org.Hs.eg.db version 3.19.1, Matrix version 1.7.0, dplyr version 1.1.4, tidyr version 1.3.1, readr version 2.1.5, ggplot2 version 3.5.2, pheatmap version 1.0.13, ComplexHeatmap version 2.20.0, openxlsx version 4.2.8, and vegan version 2.7.1.




 ,
,