Article

Nrf2 Deficiency Exacerbates Methamphetamine-Induced Neuronal Apoptosis and Cognitive Dysfunction in Male Mice

1
National Health Commission (NHC) Key Laboratory of Drug Addiction Medicine, School of Forensic Medicine, Kunming Medical University, Kunming 650500, China
2
Key Laboratory of Tropical Translational Medicine of Ministry of Education, School of Basic Medical Sciences, Hainan Academy of Medical Sciences, Hainan Medical University, Haikou 571199, China
3
School of Basic Medical Sciences & Forensic Medicine, North Sichuan Medical College, Nanchong 637000, China
*
Authors to whom correspondence should be addressed.
These authors contributed equally to this work.
Int. J. Mol. Sci. 2026, 27(15), 6565; https://doi.org/10.3390/ijms27156565
Submission received: 7 January 2026 / Revised: 29 June 2026 / Accepted: 1 July 2026 / Published: 23 July 2026

Abstract

Methamphetamine (MA) abuse, a growing global public health concern, has been linked to the emergence of neuropsychiatric effects, largely attributed to MA-induced neurotoxicity. Despite its significant impact, the precise mechanisms underlying this neurotoxicity remain poorly understood, and current therapeutic options for MA abusing patients are limited. In the present study, primary mouse neurons with 400 μM MA treatment and Nrf2 knockout C57BL/6J mice with 10 mg/kg MA treatment were used to investigate the regulatory mechanisms of Nrf2 in MA-induced cognitive impairment and neuronal apoptosis. Results revealed that Nrf2 activation occurred with in vitro and in vivo exposure to MA, with pronounced cognitive dysfunction in mice. In both primary neurons and prefrontal cortex and hippocampus tissues, MA exposure induced oxidative stress, disrupted mitochondrial dynamics (characterized by elevated Drp1 and p-Drp1 expression and reduced Mfn1 expression), enhanced mitophagy (characterized by high PINK1 and Parkin expression), and increased apoptosis. Notably, silencing or knocking out Nrf2 exacerbated MA-induced cognitive dysfunction, oxidative stress, and disruptions in mitochondrial dynamics, while further impairing mitophagy through reduced PINK1 and Parkin expression, ultimately leading to increased apoptosis. These results suggest that Nrf2 deficiency exacerbates MA-induced neuronal apoptosis and cognitive dysfunction. Consequently, Nrf2 may represent a promising therapeutic target for mitigating neurotoxic effects induced by MA.

1. Introduction

Amphetamine-type stimulants, mainly including methamphetamine (MA), are the third most widely abused class of drugs globally, posing a significant global public health challenge [1]. As a synthetic sympathomimetic amine, MA exerts adverse effects on multiple organ systems. Prolonged MA use can lead to strong drug dependence and severe neurotoxic effects. Chronic MA abuse is associated with various psychiatric disorders, such as anxiety, hallucinations, delusions, and reduced volition [2,3], along with varying degrees of cognitive dysfunction [4,5,6].
MA-induced neuropsychiatric adverse effects are strongly linked to its neurotoxic properties. Chronic MA abuse can lead to shorter neuronal dendritic lengths and a significant increase in the expression of neuronal death and apoptosis-related markers in the human brain [7,8]. Apoptosis, a well-established form of programmed cell death, plays an important regulatory role in neurotoxic damage caused by MA exposure. In addition, MA-induced cognitive impairment is also closely associated with neuronal apoptosis [9,10]. MA induces neurotoxicity via mitochondrial dysfunction and apoptosis initiation. Evidence suggests that oxidative products of dopamine cause mitochondrial dysfunction, including respiratory chain disorders, mitochondrial swelling, loss of membrane potential, and decreased phosphorylation ability [11,12]. In addition, MA exacerbates mitochondrial dysfunction via multiple molecular pathways, such as Glu receptors, ONOO•, proliferator-activated gamma receptor coactivator 1-alpha, and protein kinase C-delta [13,14,15]. The neurotoxicity resulting from mitochondrial dysfunction is primarily mediated by mitochondria-induced apoptosis [16]. Various studies have reported that MA increases pro-apoptotic protein expression while reducing anti-apoptotic protein expression in rodent brains [17,18]. This pro-apoptotic shift is largely due to the extensive release of mitochondrial membrane gap proteins such as cytochrome c (Cyt-c) [19], which interacts with adaptor protein apoptotic peptidase activating factor 1 (Apaf-1) and pro-caspase-9 to form an apoptosome, leading to caspase cascade activation [20]. In our previous study, we also found that MA induces caspase cascade activation and apoptosis in the hippocampus, prefrontal cortex, and primary cells of rats [21].
Mitochondrial dynamics refers to the balance between mitochondrial fission and fusion. Dynamin-related protein 1 (Drp1) is essential for mitochondrial fission [22], while mitofusin 1 (Mfn1) initiates the fusion of the outer mitochondrial membrane [23], and optic atrophy protein 1 (Opa1) induces endosomal fusion in an Mfn1-dependent manner [24]. The PINK1/Parkin pathway is a key regulator of mitophagy, vital for preserving mitochondrial function [25]. Drp1-mediated mitochondrial fission has also attracted attention in behavioral modulation, neurotoxicity, and myocardial toxicity associated with drug abuse [26]. Transcription factor early growth response 3 (Egr3) can be induced by acute cocaine exposure and has been shown to be a key factor in cocaine induced reward effects and exercise responses [27]. In addition, the binding of Erg3 to Drp1 increases during cocaine exposure, while knocking down Erg3 expression can weaken cocaine induced mitochondrial fission [28]. These studies reveal that mitochondrial dynamic changes may be involved in the regulatory mechanisms of drug abuse behavior. For cocaine induced neurotoxicity, cocaine reduces neuronal mitochondrial membrane potential and activates autophagy to produce neurotoxicity, involving mitochondrial dynamics related proteins such as Drp1, Fis1, and Parkin [29]. Moreover, a drug-related cardiovascular study showed that before any structural changes occur in myocardial tissue, the effect of cocaine on myocardial cells has altered mitochondrial dynamics: its division activity significantly increases while fusion activity significantly decreases [30]. Recent research has found that MA can cause ultrastructural changes in mitochondrial cristae structure, inner and outer membranes, and matrix, while MA-induced neurodegeneration is significantly associated with specific mitochondrial damage. In addition, after MA exposure, the expression of fission/autophagy related proteins such as Fis1 and Drp1 decreased, while the expression of Pink1 and Parkin increased, all of which occurred synchronously with mitochondrial structural changes [31].
Nuclear factor E2-related factor 2 (Nrf2) is a classical cytoplasmic transcription factor involved in the regulation of antioxidative stress. Its activation requires dissociation from Kelch-like ECH-associated protein 1 (Keap1) and subsequent translocation into the nucleus, where it binds to antioxidant response elements (AREs) in the promoter regions of target genes to modulate transcription and translation [32]. Given its pivotal role in aging and neurodegenerative diseases, such as Alzheimer’s disease (AD) and Parkinson’s disease (PD), Nrf2 has emerged as a promising therapeutic target [33]. In studies related to substance abuse, 6,7,4′-trihydroxyflavanone has demonstrated antioxidant and anti-apoptotic effects via activation of the Nrf2/heme oxygenase-1 (HO-1) and PI3K/Akt/mTOR signaling pathways, offering resistance against MA-induced neurotoxicity [34]. Similarly, buprenorphine has been shown to increase antioxidant capacity in rats through activation of Nrf2, attenuating MA-induced anxiety-like behavior [35]. Thus, Nrf2 has garnered extensive attention in the study of both diseases and substance abuse, making it a key target for the development of novel therapeutic strategies and priority research.
The Nrf2/ARE signaling pathway plays a pivotal role in the process of neuronal apoptosis [36]. Curcumin has been shown to attenuate ketamine-induced oxidative stress and apoptosis in rat cortical and hippocampal tissues via the Nrf2 signaling pathway [37]. Overexpression of Nrf2 exerts a protective effect on cells by resisting oxidative stress and inhibiting apoptosis [38,39], while Nrf2 deficiency triggers endoplasmic reticulum stress and apoptosis, contributing to secondary brain damage in traumatic brain injury in mice [40]. These findings underscore the significant regulatory function of the Nrf2 signaling pathway in apoptosis. In models of ischemia and hypoxia, Nrf2 negatively regulates Drp1-mediated mitochondrial fission, with Nrf2 activation and overexpression exerting a protective effect [41]. Nrf2 also up-regulates PINK1 transcription, facilitating the removal of damaged mitochondria via mitophagy to preserve mitochondrial homeostasis and reduce oxidative stress-induced cell death [42].
Our previous studies demonstrated that Nrf2 regulates oxidative stress and autophagy to attenuate MA-induced renal damage [43], as well as oxidative stress and apoptosis to mitigate MA-induced cardiac damage [44]. Both MA abusers and MA-dependent rats show reduced expression of Nrf2 and Mfn1 in the prefrontal cortex, coupled with elevated expression levels of Drp1 and apoptosis-related proteins. Nrf2 is positively correlated with Mfn1 and negatively correlated with Drp1 and apoptosis-related proteins [45]. Given these findings, we established a mouse model and cultured primary mouse neurons to explore how Nrf2 regulates mitochondrial dynamics and mitophagy in relation to MA-induced learning and memory deficits and neuronal apoptosis.

2. Results

2.1. Nrf2 Activation in MA Administration Model

Microtubule-associated protein 2 (MAP2) staining confirmed that the purity of mouse primary neurons reached 98% (Supplemental Figure S1), ensuring the suitability of these cells for subsequent experiments. Exposure to 400 μM MA significantly increased total Nrf2 (T-Nrf2) levels in neurons (Figure 1A). Concurrently, nuclear Nrf2 (N-Nrf2) expression was also markedly elevated (Figure 1B). In the mouse prefrontal cortex, Nrf2 expression was higher in the MA group compared to the control group (Figure 1C). Similarly, MA exposure led to increased Nrf2 expression in hippocampal tissue (Figure 1D). These findings suggest that Nrf2 is activated in both MA-exposed neurons and mouse models.

2.2. Nrf2 Knockout Exacerbated MA-Induced Cognitive Dysfunction in Mice

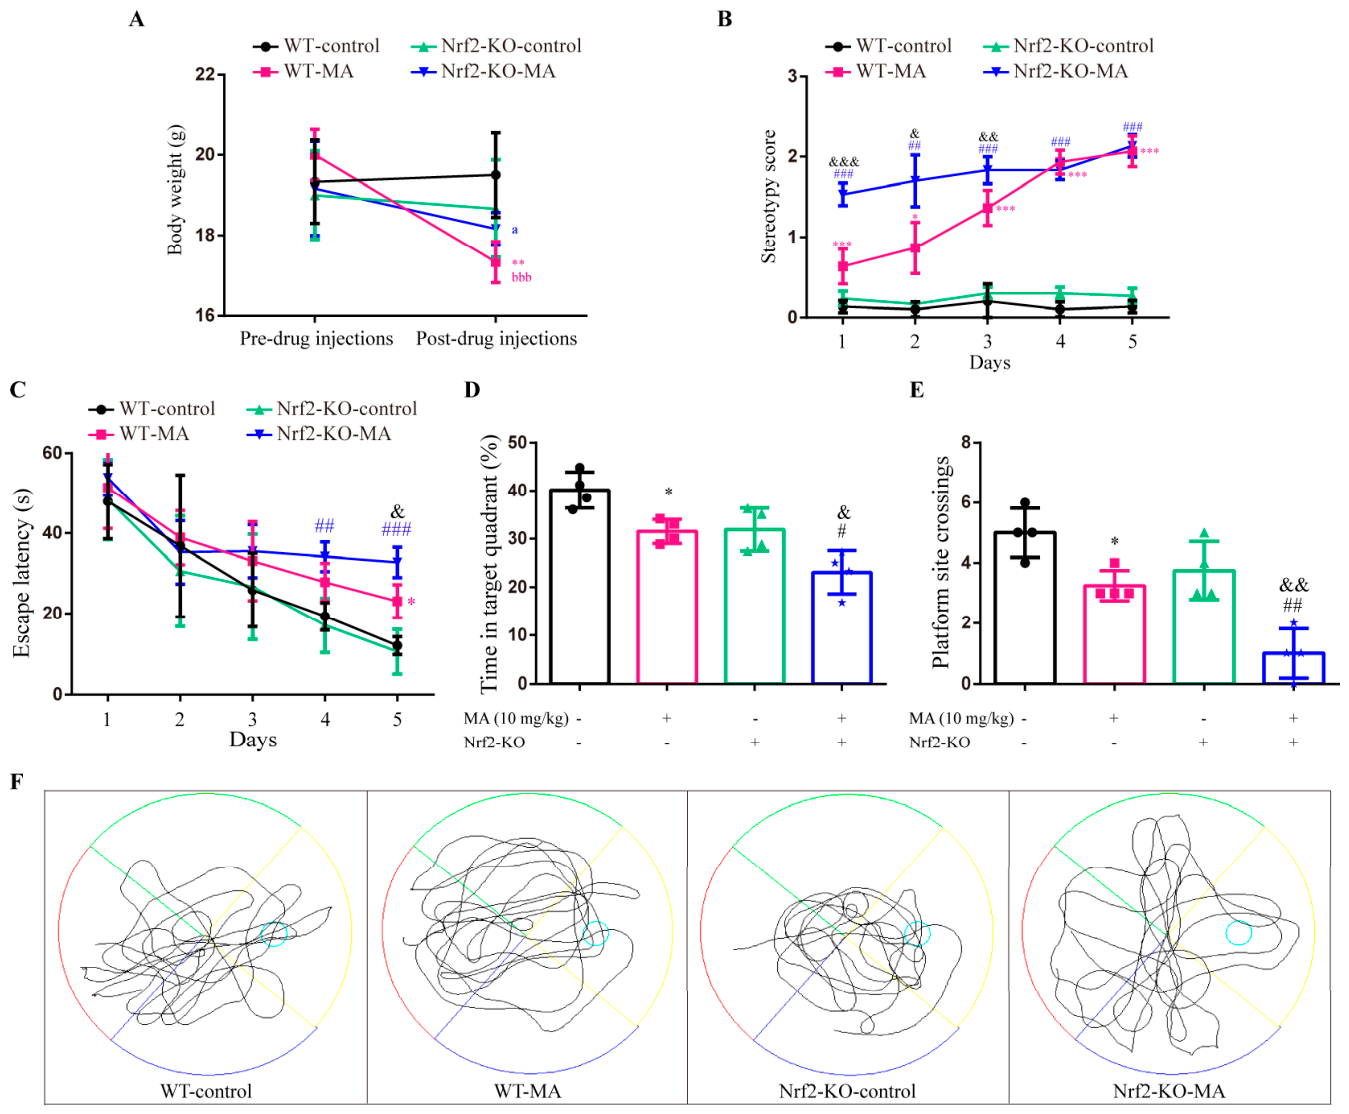
Changes in mouse body weight before and after MA administration are shown in Figure 2A. No significant differences in body weight were observed between groups before drug administration. However, after 5 days of MA treatment, body weight of the WT-MA group was significantly lower than that of the WT-control group (p = 0.002). Similarly, both the WT-MA (p = 0.000055) and Nrf2- knockout (KO)-MA (p = 0.041) groups exhibited significant reductions in body weight post-administration compared to pre-administration.
Changes in the stereotyped behavior of mice after MA administration are shown in Figure 2B. Over days 1–5, both the WT-MA and Nrf2-KO-MA groups displayed significantly higher stereotypy scores. Compared to the WT-MA group, the Nrf2-KO-MA group showed higher scores on days 1–3, though no significant difference was observed on days 4–5.
Escape latency results during the training phase of the Morris water maze are shown in Figure 2C. No significant differences were noted among the groups on days 1–3. However, on day 4, escape latency increased in the Nrf2-KO-MA group compared to the Nrf2-KO-control group. By day 5, escape latency increased in both the WT-MA and Nrf2-KO-MA groups, with the Nrf2-KO-MA group showing a further increase compared to the WT-MA group. The test phase results, which analyzed time spent in the target quadrant and number of platform crossings, are shown in Figure 2D. Notably, the residence time in the target quadrant was shorter in the WT-MA group than in the WT control group (p = 0.037), and a decreasing trend was also observed in the Nrf2-KO-MA group relative to the Nrf2-KO control group (p = 0.032). Moreover, the Nrf2-KO-MA group exhibited a significantly shorter residence time in the target quadrant compared with the WT-MA group (p = 0.041). As shown in Figure 2E for platform crossing frequency, the WT-MA group displayed reduced crossings versus the WT control group (p = 0.038). Similarly, the Nrf2-KO-MA group had fewer crossings than the Nrf2-KO control group (p = 0.002). More importantly, the number of platform crossings was markedly lower in the Nrf2-KO-MA group than in the WT-MA group (p = 0.008). Representative locomotor trajectories during the probe trial are presented in Figure 2F. These findings indicate that MA administration increases escape latency, decreases time spent in the target quadrant, and reduces platform crossing frequency, reflecting impaired learning and memory in mice, with the deleterious effects of MA administration exacerbated by Nrf2 knockout.

2.3. Nrf2 Deficiency Exacerbated MA-Induced Oxidative Stress

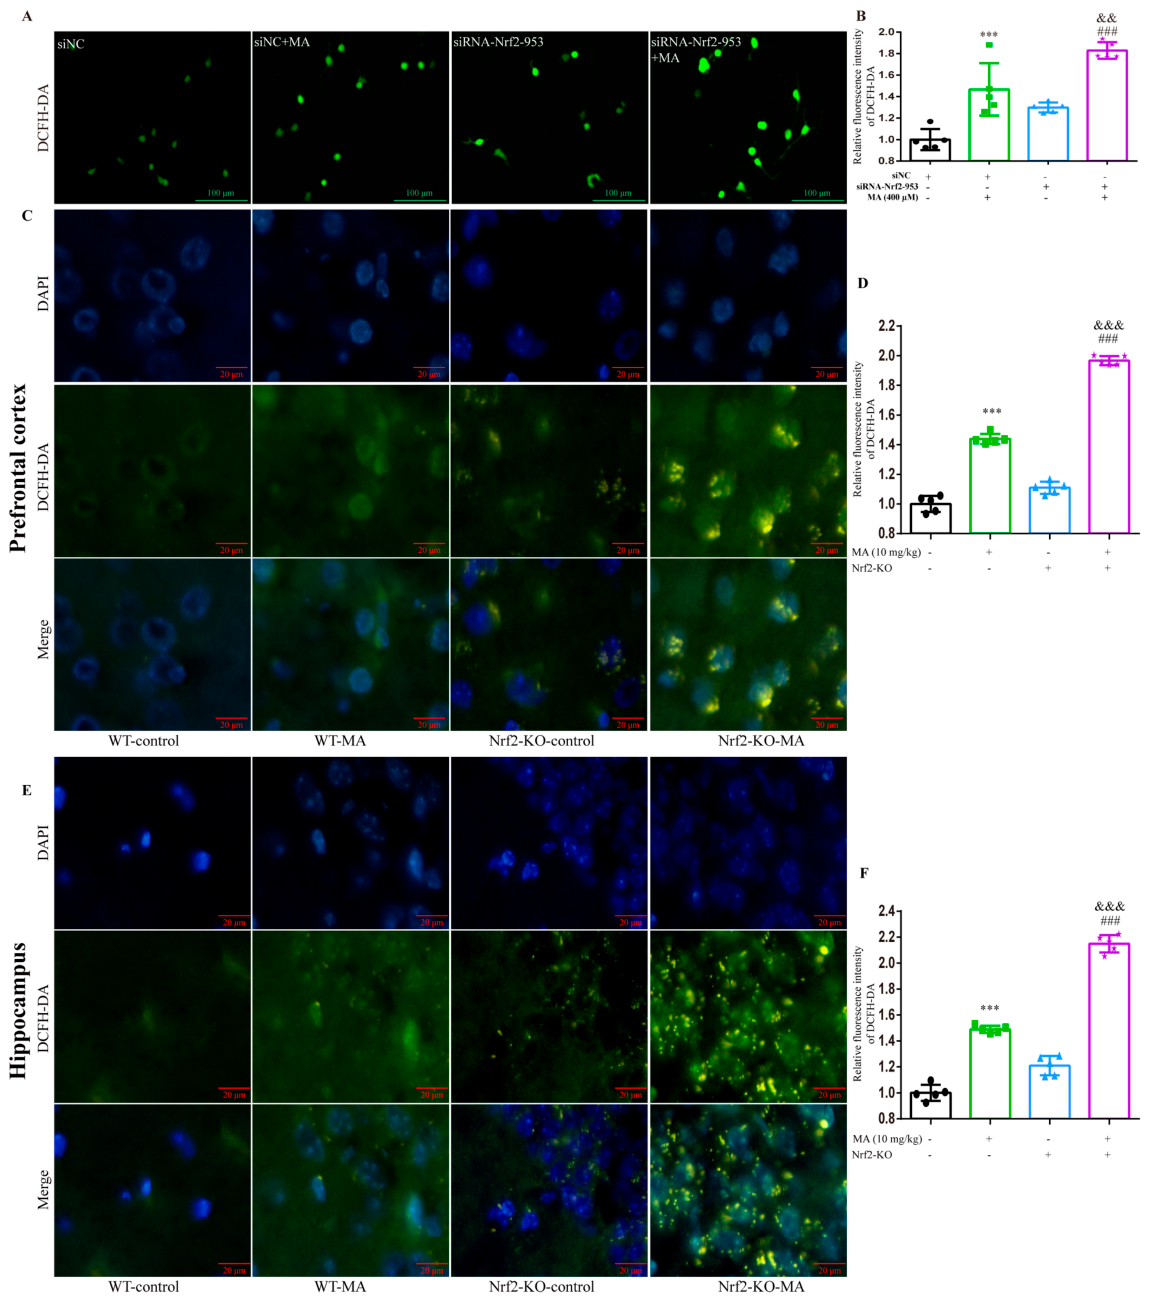
The effectiveness of Nrf2 silencing was first confirmed by Western blot analysis, with the results indicating that siRNA-Nrf2-953 had the strongest silencing effect (Supplemental Figure S2). Therefore, siRNA-Nrf2-953 was used for subsequent experiments to transfect neurons and silence the Nrf2 gene. Reactive oxygen species (ROS) levels in neurons were assessed using the DCFH-DA fluorescent probe (Figure 3A,B). The results revealed that ROS levels were elevated in the siNC + MA group relative to the siNC group. Compared with the siRNA-Nrf2-953 group, the siRNA-Nrf2-953 + MA group exhibited further increased ROS levels. Meanwhile, ROS levels in the siRNA-Nrf2-953 + MA group were higher than those in the siNC + MA group. These findings suggest that silencing Nrf2 exacerbates MA-induced oxidative stress in neurons.
In the prefrontal cortex, the level of ROS was significantly increased in the WT-MA group compared with the WT-control group. In Nrf2 knockout mice, MA administration also elevated ROS levels in the prefrontal cortex. Additionally, Nrf2 knockout mice treated with MA showed higher ROS levels in this region than the WT-MA group (Figure 3C,D). Similar results were observed in the hippocampus: MA treatment induced an increase in ROS production, and this effect was further potentiated upon Nrf2 knockout (Figure 3E,F). These findings suggest that MA induces oxidative stress in the mouse prefrontal cortex and hippocampus, and that Nrf2 knockout intensifies oxidative stress.

2.4. Effects of Nrf2 on MA-Induced Mitochondrial Morphological Changes, Mitochondrial Dynamics, and Mitophagy

2.4.1. Effects of Nrf2 on MA-Induced Mitochondrial Morphology

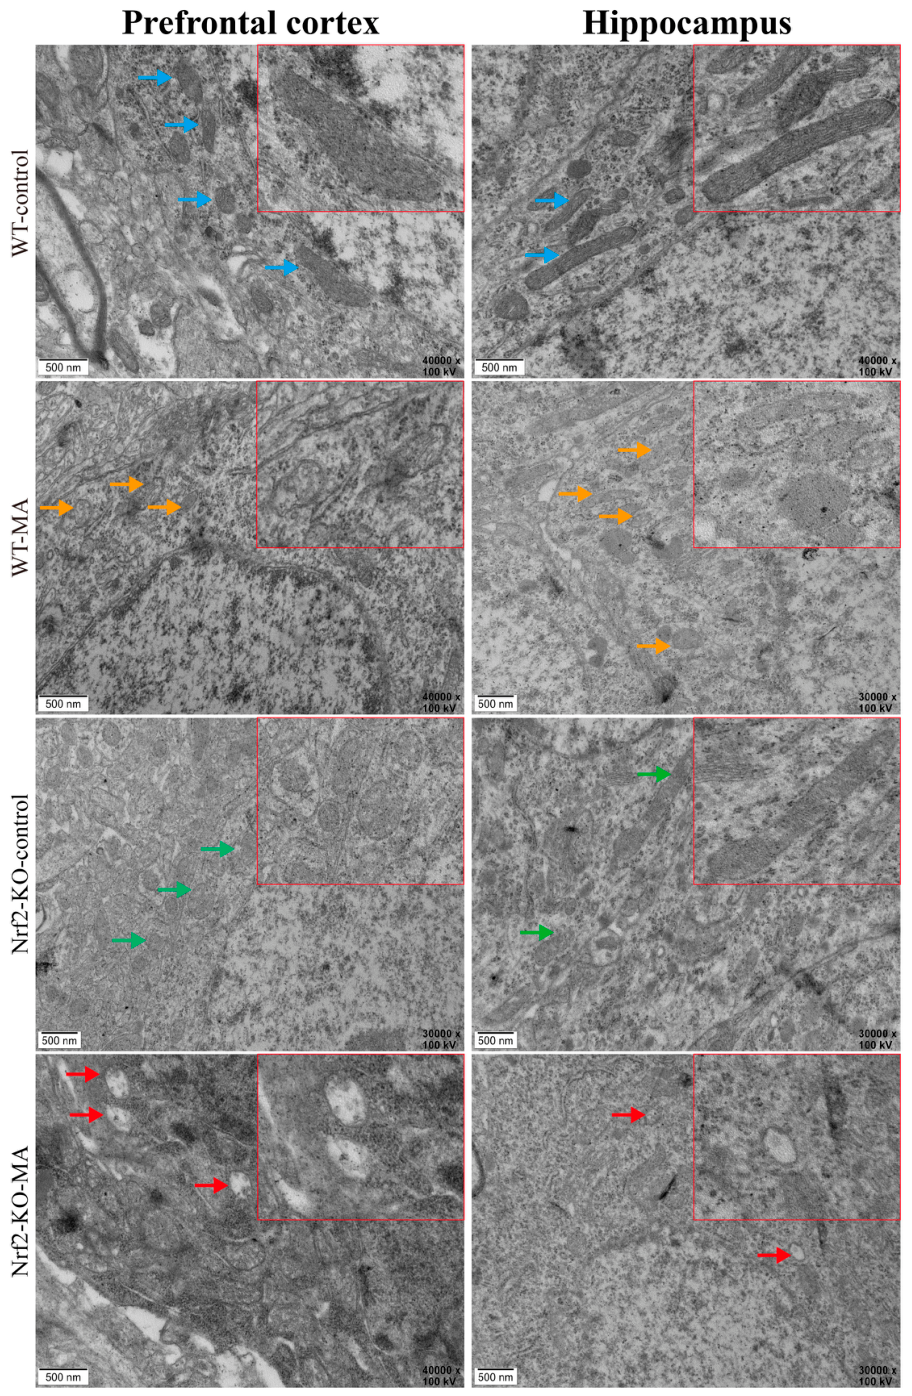
As shown in Figure 4, mitochondria in the prefrontal cortex of the WT-MA group were swollen, with cristae becoming shorter and slightly disorganized. In contrast, mitochondria in the Nrf2-KO-control group appeared largely normal in structure, with only slight swelling. Mitochondria in the Nrf2-KO-MA group exhibited severe morphological changes, including pronounced swelling, shortened and disorganized cristae, a reduced number of mitochondria, and the loss of most cristae. In extreme cases, the entire mitochondrial matrix collapsed into structureless vacuoles. Similar changes were observed in the hippocampal tissues. These results suggest that MA induces notable morphological and structural changes in the mitochondria of the prefrontal cortex and hippocampus of mice, and that Nrf2 knockout exacerbates this damage.

2.4.2. Effects of Nrf2 on MA-Induced Mitochondrial Dynamics

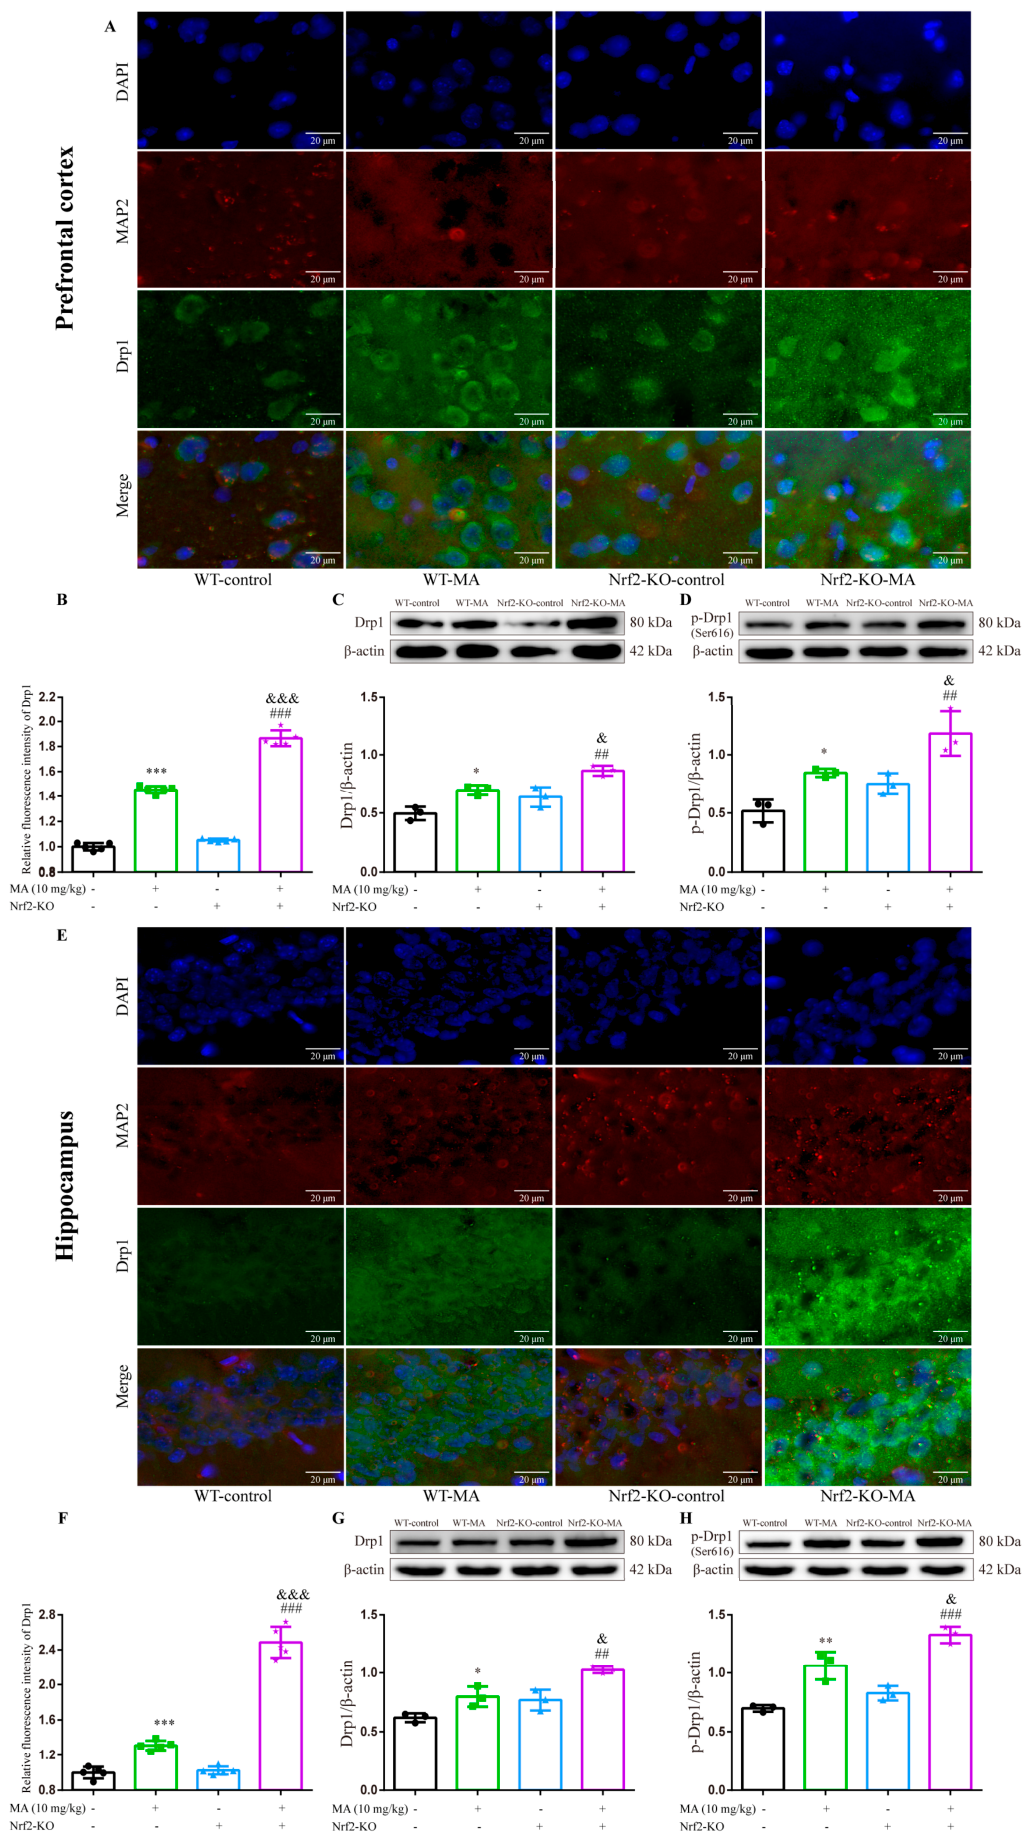
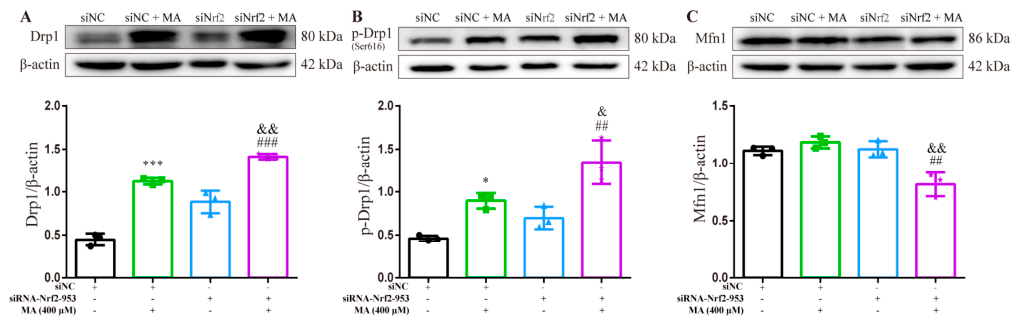
In primary neurons, the expression levels of Drp1 and p-Drp1 were significantly upregulated in the siNC + MA group relative to the siNC group. Similarly, increased expression of Drp1 and p-Drp1 was detected in the siRNA-Nrf2-953 + MA group compared with the siRNA-Nrf2-953 group (Figure 5A,B). Consistent findings were observed in the prefrontal cortex and hippocampus. Compared with the WT-control group, the WT-MA group presented elevated expression of Drp1 and p-Drp1 in both brain regions. Likewise, the Nrf2-KO-MA group showed higher levels of Drp1 and p-Drp1 than the Nrf2-KO group (Figure 6). The high Drp1 and p-Drp1 expression trends induced by MA were further enhanced by Nrf2 knockout.
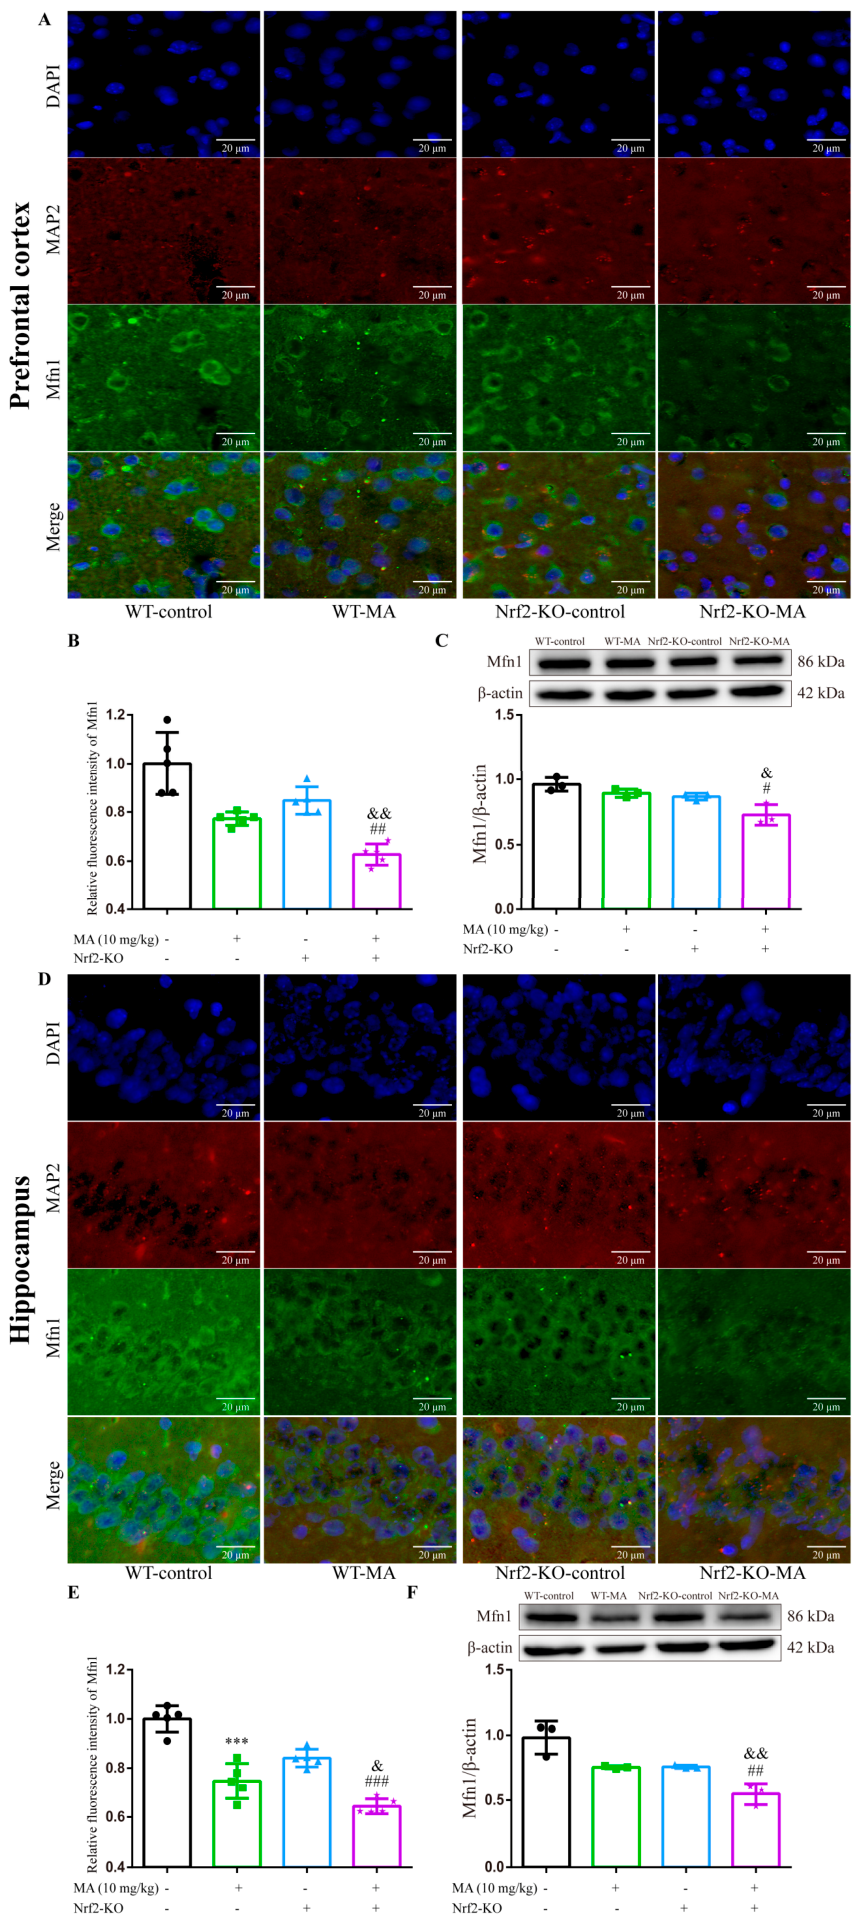
As shown in Figure 5C, there was no significant difference in Mfn1 expression between the siNC group and the siNC + MA group in primary neurons. The expression of Mfn1 was decreased in the siRNA-Nrf2-953 + MA group relative to the siRNA-Nrf2-953 group. In animal models, no obvious differences were found in the fluorescence intensity and protein expression of Mfn1 in the prefrontal cortex between the WT-MA group and WT control group (Figure 7A–C). Compared with the Nrf2-KO group, the Nrf2-KO-MA group exhibited reduced Mfn1 levels in the prefrontal cortex (Figure 7A–C). Furthermore, MA treatment downregulated Mfn1 levels in the hippocampus of Nrf2 knockout mice (Figure 7D–F).
These results indicated that MA enhances mitochondrial fission by upregulating the expression of Drp1 and p-Drp1 in primary neurons, as well as in the prefrontal cortex and hippocampus of mice. Meanwhile, the decreased expression of Mfn1 suggests the inhibition of mitochondrial fusion. Silencing or knockout of Nrf2 further exacerbates MA-induced excessive activation of mitochondrial fission and suppression of mitochondrial fusion, thereby deteriorating MA-mediated disturbance of mitochondrial dynamics.

2.4.3. Effects of Nrf2 on MA-Induced Mitophagy

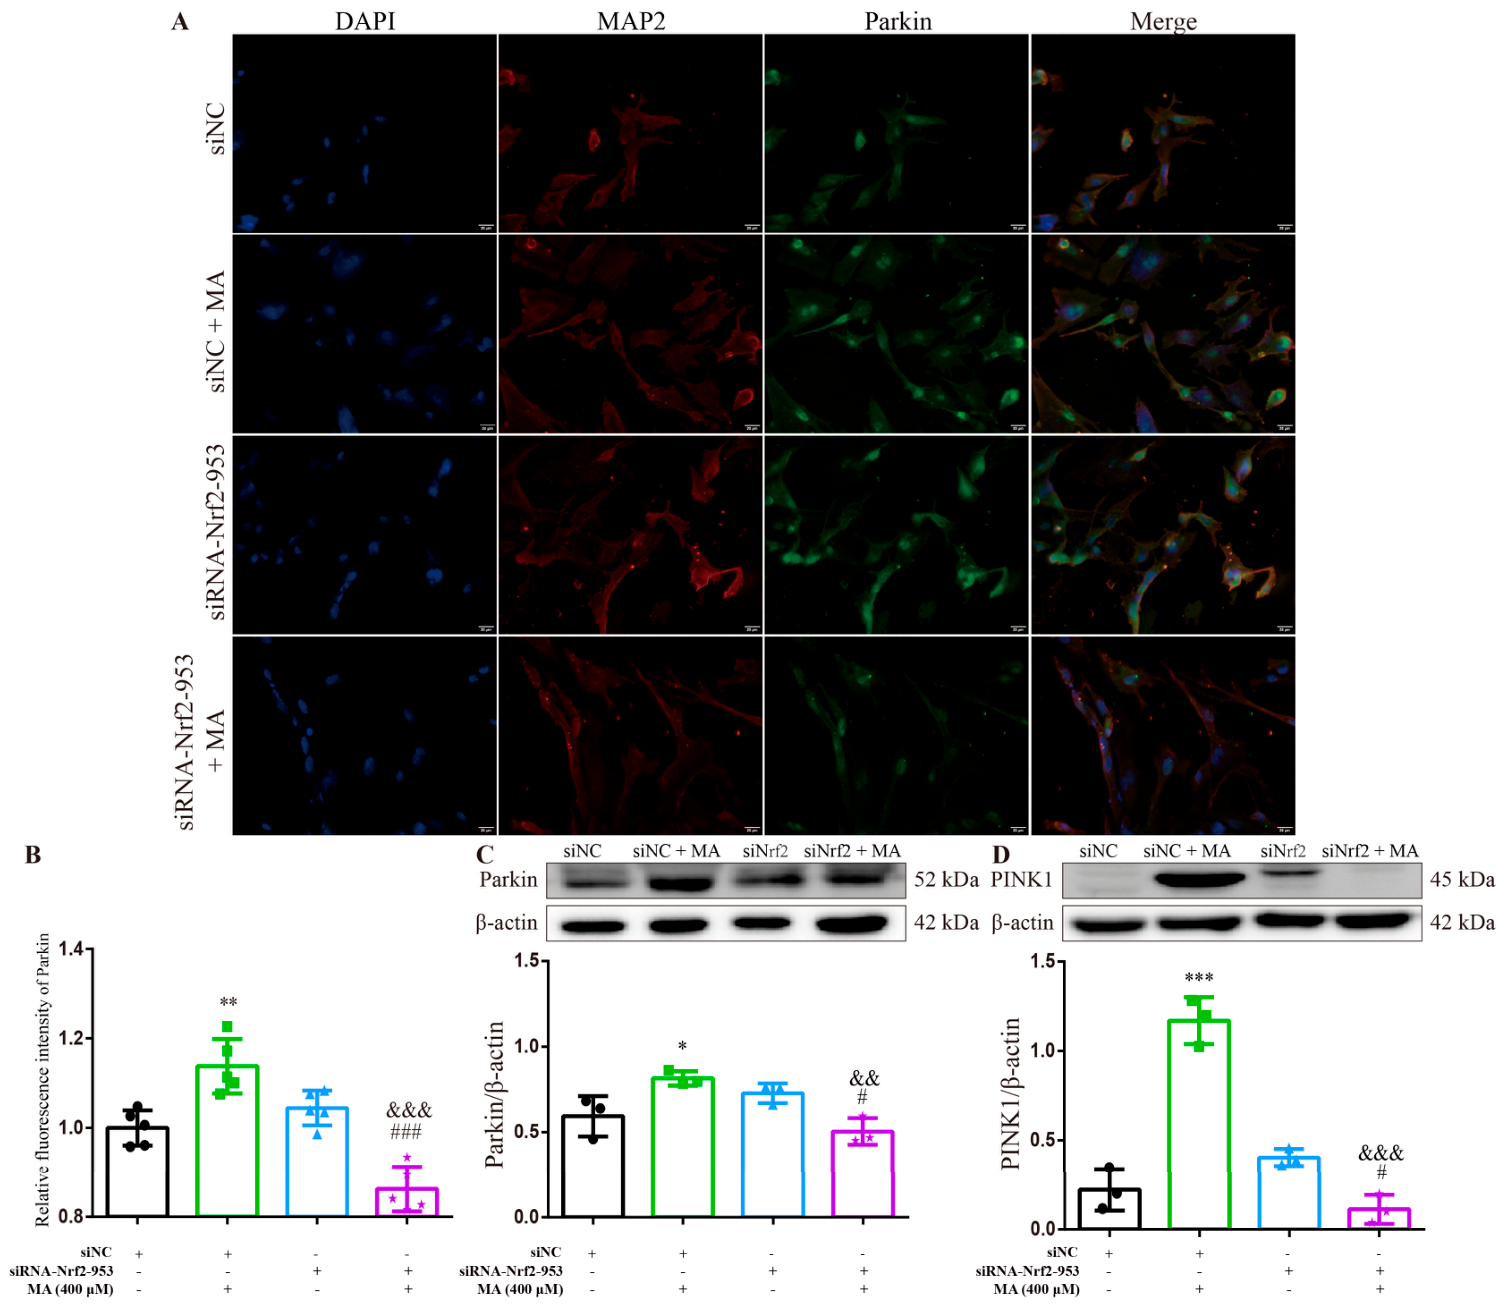
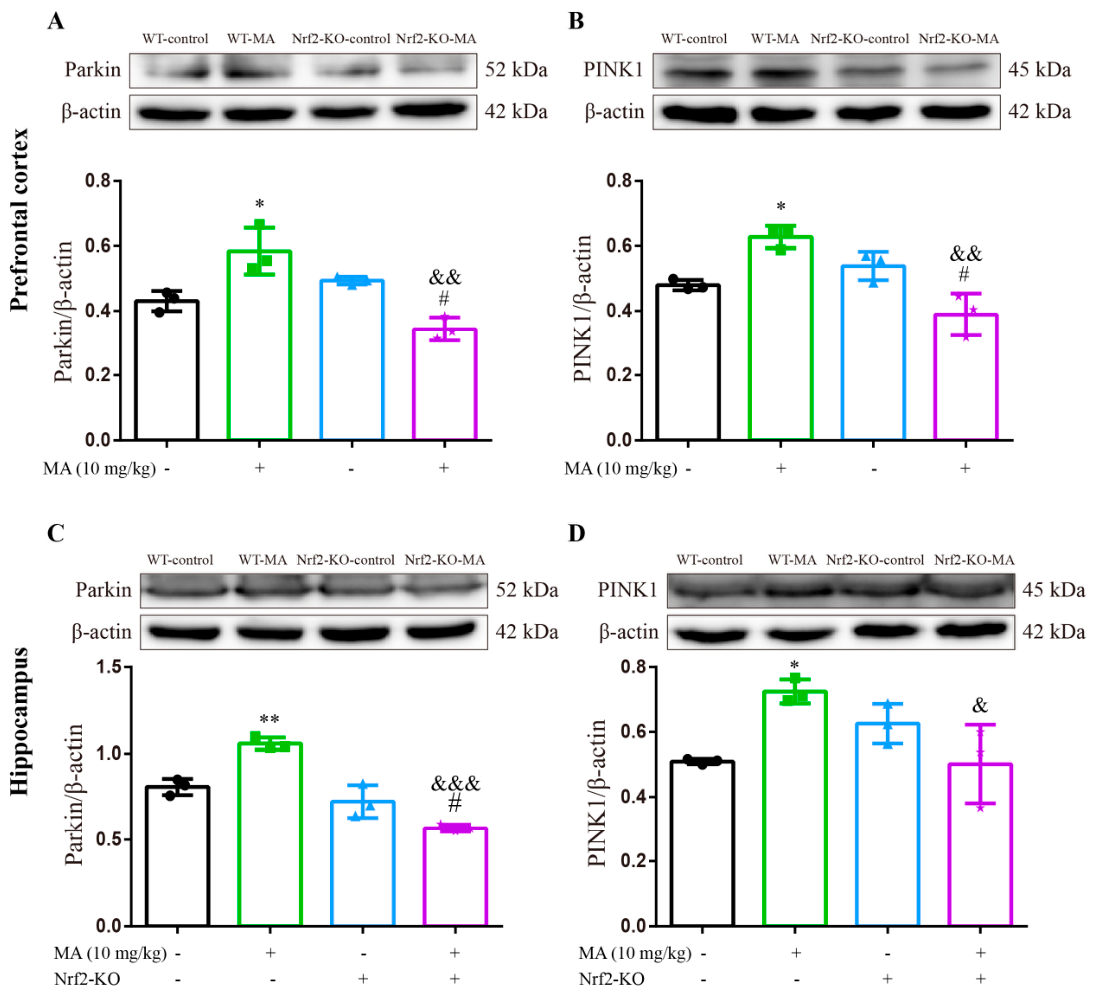
The expression levels of mitophagy-related proteins Parkin and PINK1 in primary neurons are shown in Figure 8. Compared to the siNC group, both Parkin and PINK1 were highly expressed in the siNC + MA group. However, after silencing Nrf2, the expression of Parkin and PINK1 was significantly reduced in the siRNA-Nrf2-953 + MA group, showing a marked decrease compared to the siNC + MA group.
In the prefrontal cortex, MA treatment induced high expression of Parkin and PINK1 in WT mice, while Nrf2 knockout resulted in reduced levels of both proteins, with a significant decrease in the Nrf2-KO-MA group compared to the WT-MA group (Figure 9A,B). In the hippocampus, MA treatment induced high expression of Parkin and PINK1 in WT mice, while Nrf2 knockout significantly reduced Parkin levels without affecting PINK1 expression; both proteins were significantly decreased in the Nrf2-KO-MA group compared to the WT-MA group (Figure 9C,D).
These results suggest that MA administration induces high Parkin and PINK1 expression, promoting mitophagy in primary neurons and prefrontal cortical and hippocampal tissues of WT mice, while Nrf2 knockout inhibits MA-induced mitophagy.

2.5. Effects of Nrf2 on MA-Induced Neuronal Apoptosis

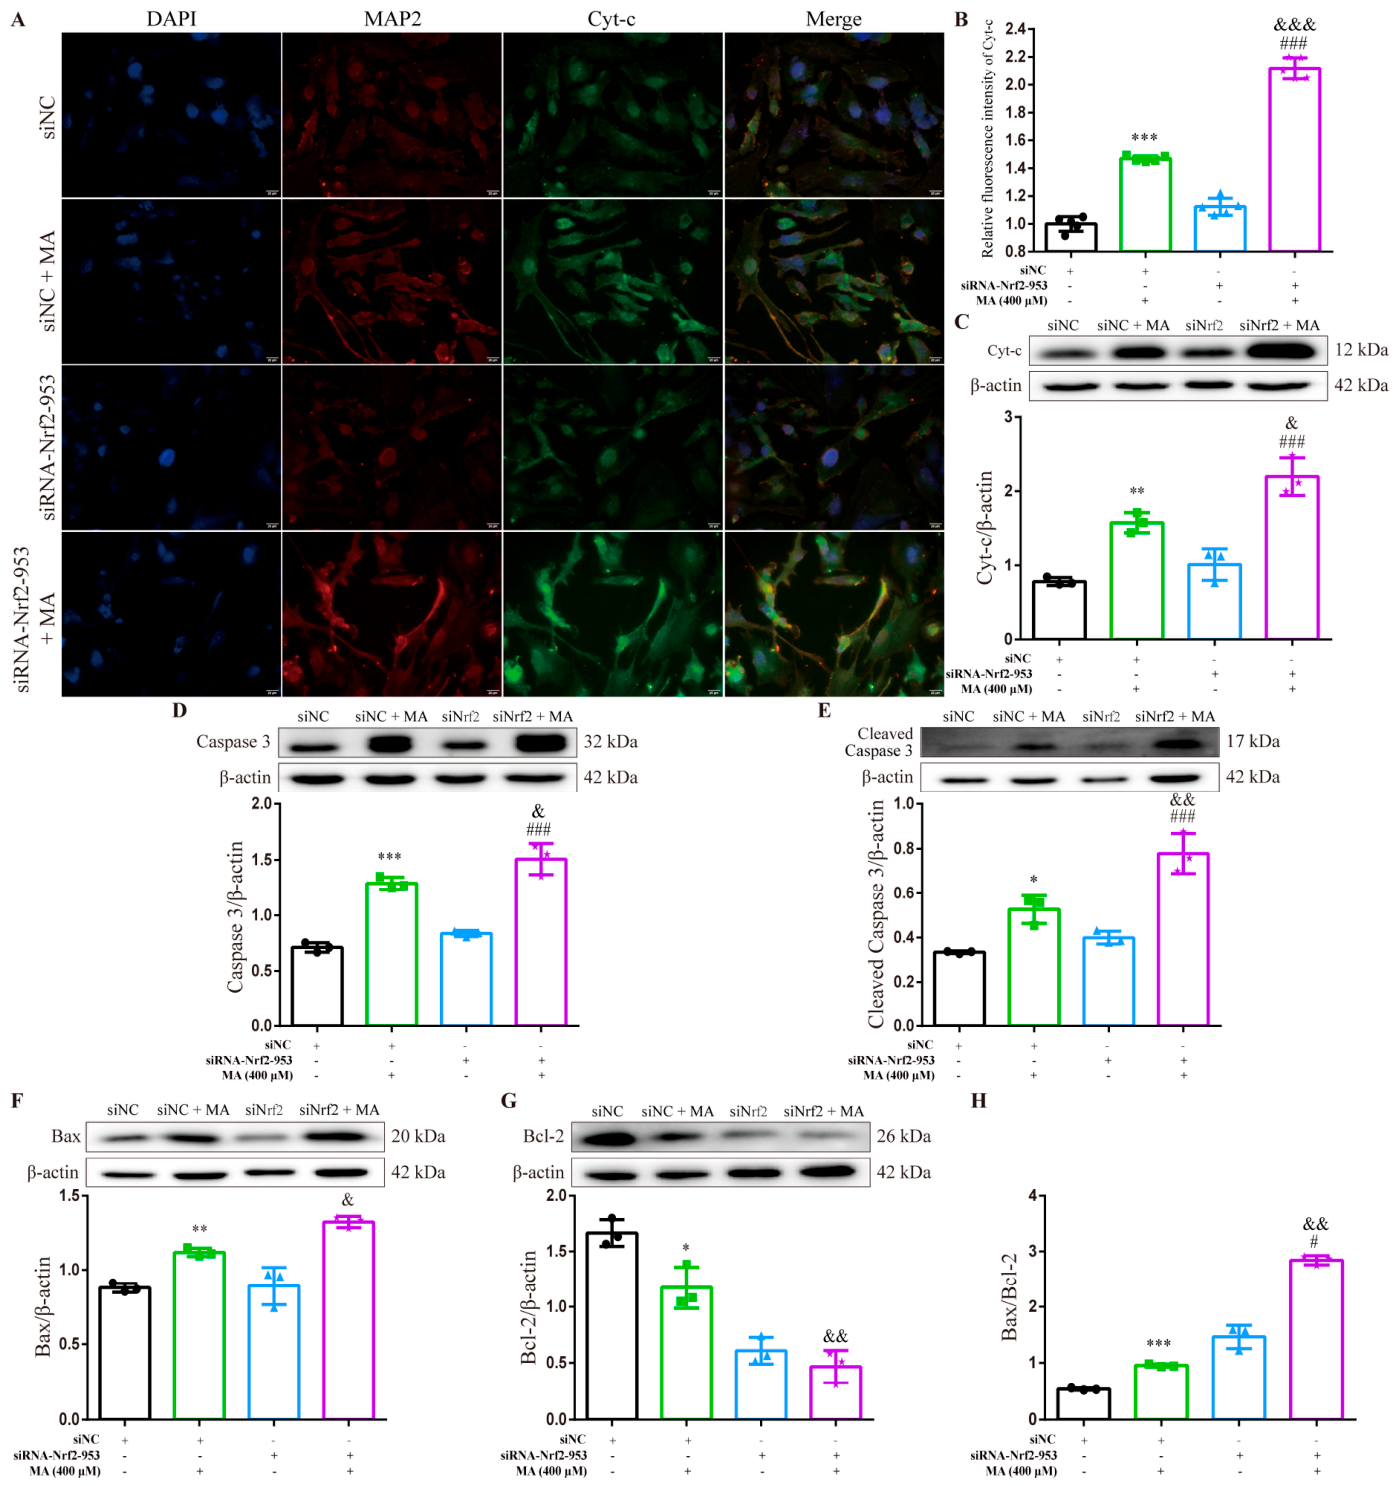
The expression of Cyt-c in neurons is shown in Figure 10A–C. Results showed that MA exposure induced high expression of Cyt-c, which was further elevated upon Nrf2 silencing. The siRNA-Nrf2-953 + MA group exhibited a significantly higher Cyt-c level compared to the siNC + MA group. Apoptosis-related protein expression is shown in Figure 10D–H. Results indicated that MA exposure increased the levels of Caspase 3, Cleaved Caspase-3 Bax, and Bax/Bcl-2, while reducing Bcl-2 expression compared to the siNC group. After Nrf2 silencing, these changes were further amplified. These findings indicate that exposure of neurons to 400 μM MA for 24 h induces apoptosis, and this effect is further intensified following Nrf2 silencing.
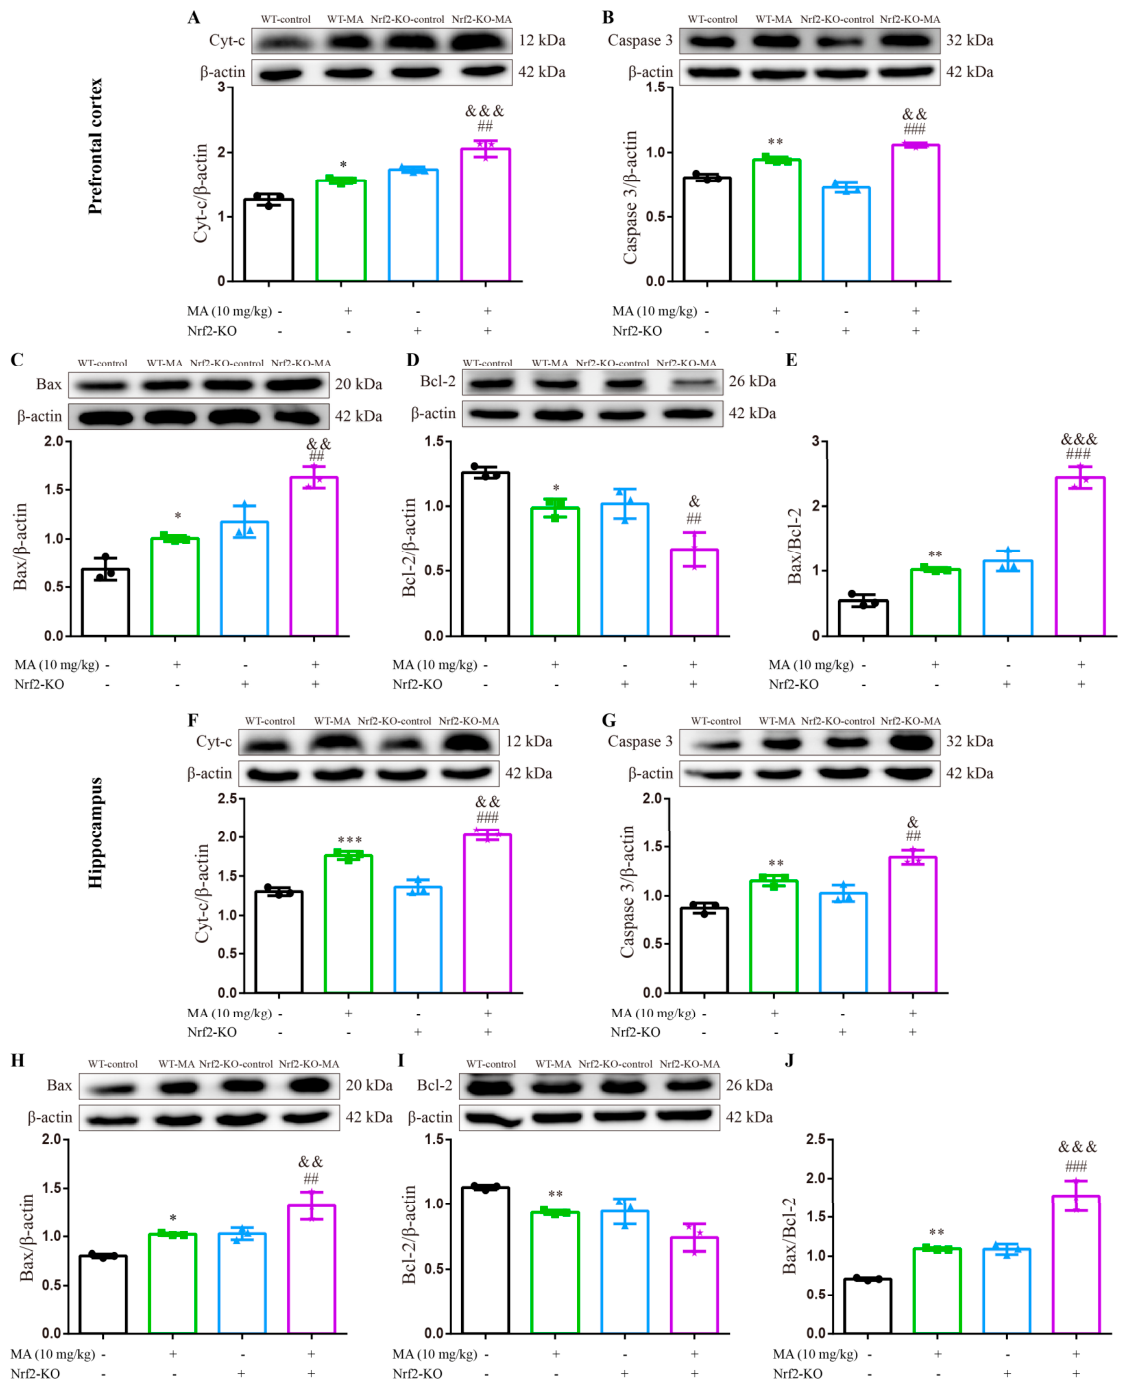
Similar results were observed in the prefrontal cortex and hippocampus of mice, as shown in Figure 11. MA exposure caused increased expression of Cyt-c, Caspase 3, Bax, and Bax/Bcl-2, along with reduced levels of Bcl-2 in WT mice. In Nrf2 knockout mice, MA further elevated the levels of Cyt-c, Caspase 3, Bax, and Bax/Bcl-2, while further decreasing Bcl-2 levels. The differences in these indicators between the Nrf2-KO-control and Nrf2-KO-MA groups were statistically significant, indicating an aggravated degree of apoptosis. These findings suggest that MA induces high expression of apoptosis-related proteins in the prefrontal cortex and hippocampus, thereby promoting apoptosis, and this apoptotic effect is further enhanced by Nrf2 knockout.

3. Discussion

This study demonstrated that MA exposure induced cognitive deficits in mice, as well as oxidative stress, mitochondrial dynamics disruption, altered mitophagy, and increased apoptosis in the hippocampus and prefrontal cortex. Similarly, in the MA-administered primary neuronal model, MA exposure also triggered disturbances in oxidative stress, mitochondrial dynamics, mitophagy, and apoptosis. Notably, Nrf2 activation was observed in all established MA-exposure models. Mice lacking the Nrf2 gene exhibited more pronounced cognitive impairments, while Nrf2 knockout exacerbated MA-induced oxidative stress, mitochondrial dysfunction, mitophagy dysregulation, and apoptosis in both hippocampal and prefrontal cortical tissues. These detrimental effects were also observed in MA-treated primary neurons following Nrf2 silencing.
Clinical evidence has shown that the neurotoxic effects of MA can contribute to cognitive dysfunction and may even accelerate the progression to PD [46]. Chronic MA abuse has been linked to structural and functional neuronal damage in key cognitive regions, leading to deficits in spatial memory capacity [47,48]. During spatial learning, the hippocampus, particularly the CA1 region, plays an important regulatory role in prospective planning and retrospective assessment, while the prefrontal cortex is essential for memory retrieval and decision-making. Interactions between the hippocampal CA1 region and prefrontal cortex are critical for both spatial learning and memory-guided decision-making [49]. Thus, damage to these regions may underlie the cognitive dysfunction observed in MA abusers. Research has shown that hippocampal volume is reduced in MA abusers compared to healthy controls, with this reduction showing a correlation with impaired memory performance in recall tasks [50]. Additionally, MA abusers show decreased activation of the dorsolateral prefrontal cortex and impaired engagement of the ventral medial cortex, which contribute to deficits in decision-making [51]. Based on this evidence, we focused on the prefrontal cortex and hippocampus in the present study.
The extent of cognitive dysfunction caused by MA varies depending on the dose and duration of exposure. Notably, lower doses of MA (1 mg/kg) administered continuously for 20 days have been shown to impair spatial memory ability without affectinglearning acquisition, while higher doses (10 mg/kg) administered continuously for 5 days impair both spatial memory and learning acquisition [52]. Repeated administration of MA (10 mg/kg) for 7 days has been shown to cause learning memory impairments in mice [53], and continuous administration at the same dose for 21 days similarly impairs learning memory ability in rats [54]. In this study, 10 mg/kg MA administered for 5 consecutive days (twice a day) was also successful in establishing a mouse model of MA-induced cognitive impairment. Our results indicated that MA treatment led to pro-longed escape latency, reduced retention time in the target quadrant, and fewer platform crossings in the Morris water maze test, consistent with cognitive impairment. The molecular mechanisms underlying MA-induced cognitive deficits remain to be fully elucidated, and further research is needed to explore these pathways in greater depth.
MA-induced cognitive impairment is strongly linked to sustained neuronal damage. As a lipid-soluble compound, MA crosses the blood–brain barrier and disrupts normal dopamine regulation by competitively inhibiting dopamine transporters and vesicular monoamine transporter proteins, resulting in increased dopamine concentrations in the cytoplasmic and synaptic gaps. The excess dopamine is further oxidized to dopaquinone, generating significant amounts of ROS, which, in turn, trigger oxidative stress. This cascade inhibits mitochondrial adenosine triphosphate (ATP) production and depolarizes mitochondrial membrane potential. MA-induced mitochondrial dysfunction not only enhances oxidative stress but also activates the mitochondrial apoptotic pathway, ultimately leading to neuronal death [55,56,57]. MA has been shown to cause oxidative stress and apoptosis in neurons, particularly within the prefrontal cortex [58,59,60,61] and hippocampus [9,62,63,64]. This neuronal damage leads to cell death and brain volume reduction, contributing to cognitive dysfunction [9,58,62]. Our study corroborated these findings, demonstrating that MA administration induced oxidative stress and neuronal apoptosis in primary neurons, as well as in the prefrontal cortex and hippocampus, accompanied by cognitive deficits in MA-treated mice. Moreover, evidence suggests that MA-induced oxidative stress triggers the formation of Drp1 oligomers, which drive mitochondrial fission, further leading to apoptosis of hippocampal neural progenitor cells [65].
Mitochondria are central regulators of cellular activity, and their morphology is significantly altered during the early stages of apoptosis, including mitochondrial fragmentation and cristae remodeling [66]. Mitochondrial quality control is governed by three primary processes: mitochondrial biogenesis, mitochondrial dynamics, and mitophagy [67]. Mitochondria are in a constant process of fission and fusion, a process referred to as mitochondrial dynamics. The dynamic changes in mitochondrial fusion and fission play critical roles in mitochondrial morphology, mitochondrial number, cellular energy synthesis, and apoptosis. Disruptions in this balance are implicated in the pathogenesis of several neurodegenerative diseases. As a neurotoxic psychoactive substance associated with neurodegeneration, MA has also been shown to induce substantial disruptions in mitochondrial dynamics. Specifically, MA exposure results in a reduction of cellular activity in SH-SY5Y cells, a decline in mitochondrial membrane potential, and structural damage to mitochondria, including cristae swelling, fragmentation, partial vacuolization, and the formation of small, spherical mitochondrial structures. These changes are accompanied by elevated expression of fission-related proteins Drp1 and Fis1, reduced expression of the fusion protein Mfn1, and increased levels of the pro-apoptotic protein Bax [68]. Additionally, MA exposure can induce marked mitochondrial fragmentation in human primary neurons, characterized by increased Drp1 expression and significant oxidative stress, leading to pronounced neurotoxicity [69]. These findings are consistent with those found in this study, which demonstrated elevated Drp1 and p-Drp1 expression alongside decreased Mfn1 expression in MA-treated primary neurons, as well as in the prefrontal cortex and hippocampus. These results suggest that disruptions in mitochondrial dynamics contribute to MA-induced neurotoxicity. Furthermore, previous research has shown that inhibiting Drp1 expression suppresses mitochondrial fission and reduces apoptosis and necrosis [70], reinforcing the link between disrupted mitochondrial dynamics and cell death.
Mitophagy acts as a “double-edged sword”, with early or moderate mitophagy eliminating damaged mitochondria to maintain cellular homeostasis [71], while late or excessive mitophagy results in mitochondrial over-degradation and cell death [72]. Mitochondrial dynamics and mitophagy are tightly interconnected, regulating each other to maintain mitochondrial homeostasis [73,74]. Mitophagy is a critical component of mitochondrial quality control, responsible for the elimination of damaged or excess mitochondria via phagocytosis of vesicles encapsulated by autophagosome-tagged microtubule-associated protein 1 light chain 3 (LC3), ensuring mitochondrial homeostasis and regulating cellular metabolism. Under physiological conditions, maintaining a basal level of mitophagy is essential for mitochondrial quality control; however, excessive mitophagy can lead to cell death and disease development. Dysregulated mitophagy is an important factor in aging and the progression of degenerative diseases such as AD, PD, and multiple sclerosis [75,76]. The PINK1/Parkin pathway is a well-established ubiquitination-mediated mitophagy pathway. MA exposure increases the proportion of damaged mitochondria in PC12 cells, stimulating PINK1 to recruit Beclin1 and Parkin to the mitochondria, thereby initiating mitophagy. Silencing PINK1 disrupts this autophagic system, leading to the accumulation of dysfunctional mitochondria and increased apoptosis [77]. MA-induced mitochondrial damage activates the PINK1/Parkin signaling pathway, initiating mitophagy to clear damaged mitochondria; however, terminal retardation of autophagic flow may contribute to MA-induced apoptosis [78]. In animal models, overexpression of Parkin via adenovirus injection into the substantia nigra of the rat brain has been shown to reduce MA-induced immunoreactivity of striatal tyrosine hydroxylase, suggesting that Parkin exerts protective effects against MA-induced toxicity in the striatal dopaminergic nerve terminal [79]. Similarly to the previous study [31], our study demonstrated that MA-induced mitophagy, driven by activation of the PINK1/Parkin pathway, occurred in primary neurons, as well as the prefrontal cortex and hippocampus of mice, but failed to rescue MA-induced apoptosis. This may be due to impaired autophagic flux or the inability of stress-elevated mitophagy to adequately counteract the extent of MA-induced neuronal damage. Further research is required to elucidate the mechanisms underlying the failure of mitophagy to exert a protective effect in this context.
Mitochondria are central hubs for oxidative stress, and the Nrf2/ARE pathway serves as a crucial endogenous antioxidant defense mechanism. Our findings showed that MA exposure led to oxidative stress and robust activation of Nrf2, consistent with previous research from our group [43,44,80]. Supporting evidence from similar studies has shown that a single dose of 35 mg/kg MA increases Nrf2 nuclear translocation in the mouse striatum from 30 min to 7 d post-injection [81]. Additionally, acute MA administration has been reported to elevate mRNA levels of Nrf2-regulated antioxidant and cytoprotective proteins in the mouse brain [82]. However, contrasting evidence suggests that MA can down-regulate Nrf2 expression and its associated pathways [9,53,59,83,84]. This apparent discrepancy in Nrf2 expression following MA stimulation may be attributed to differences in the timing and duration of MA administration. While acute exposure appears to induce a defensive up-regulation of Nrf2, chronic MA exposure has been associated with Nrf2 down-regulation, suggesting that the mode and duration of MA abuse may significantly impact Nrf2 signaling activation and persistence [82]. Studies have further revealed that Nrf2 knockout exacerbates MA-induced neurotoxicity, leading to reduced expression of tyrosine hydroxylase and dopamine transporter proteins in the striatum, as well as increased glial cell activation [82,85]. Additionally, fetal Nrf2 deficiency has been shown to intensify MA-induced oxidative DNA damage and neurotoxicity [86]. Our study demonstrated that Nrf2 knockout exacerbated MA-induced systemic damage and cognitive deficits in mice. Interestingly, compounds such as LCZ696 [84] and Terminalia chebula retzius extracts (TREs) [53] have beenshown to exert neuroprotective effects against MA-induced cognitive dysfunction by activating the Nrf2 pathway. Furthermore, our study revealed that Nrf2 knockout exacerbated MA-induced neuronal apoptosis and oxidative stress. Antioxidants such as tert-butylhydroquinone (TBHQ) [59], melatonin [87], 6,7,4′-trihydroxyflavanone (THF) [34], and resveratrol [9] have been shown to attenuate MA-induced neuronal apoptosis and neuroinflammation by up-regulating Nrf2 expression. Therefore, Nrf2 may attenuate MA-induced neuronal apoptosis through its antioxidant properties, thereby reducing MA-induced cognitive dysfunction.
Mitochondria are critical regulators of cell viability, mediating essential biochemical processes and supporting respiratory function. As a primary source of ROS, mitochondria are highly vulnerable to oxidative stress, and Nrf2 plays a key role in the regulation of antioxidant responses. Substantial evidence suggests that Nrf2 is positively associated with mitochondrial biogenesis and quality control. Cheng et al. [88] reported that H2O2-induced oxidative stress in H9c2 cells (rat embryonic cardiomyocytes) leads to mitochondrial fragmentation, reduced expression of Mfn2 and Opa1, and elevated expression of Fis1. Pre-treatment with gastrodin significantly improved these mitochondrial abnormalities, protecting cardiomyocytes from oxidative damage by restoring mitochondrial dynamics and function. This protection was attributed to the enhanced nuclear translocation of Nrf2 induced by H2O2. Notably, Nrf2 knockout nullified the protective effects of gastrodin, suggesting that gastrodin mediates mitochondrial protection through Nrf2 activation. Similarly, RTA408 has been shown to stimulate Nrf2 nuclear translocation, regulate mitochondrial fission and fusion, and redistribute p65, ultimately reducing oxidative stress, apoptosis, and inflammation in cardiomyocytes, thereby protecting the cardiac myocardium [89]. Additionally, icariside II has been found to attenuate myocardial infarction-induced disturbances in mitochondrial dynamics and oxidative stress by activating the Nrf2/SIRT3 signaling pathway [90]. Procyanidin B2 exerts a protective effect against septic acute kidney injury by promoting Nrf2 nuclear translocation, which, in turn, improves mitochondrial dynamics and mitochondrial quality control [91]. Our results similarly showed that Nrf2 plays a regulatory role in MA-induced mitochondrial dynamics. Specifically, Nrf2 deficiency exacerbated MA-induced mitochondrial fission and further reduced mitochondrial fusion.
Our results also showed that Nrf2 silencing or knockout further suppressed MA-induced expression of PINK1 and Parkin, leading to a reduction in mitophagy levels and an increase in neuronal apoptosis. Many studies support the role of Nrf2 in positively regulating mitophagy. For example, stimulation of Nrf2 by TBHQ has been shown to increase PINK1 mRNA levels in a dose-dependent manner, while Nrf2 silencing reduced TBHQ-induced PINK1 mRNA expression to basal levels [42]. Additionally, Nrf2 overexpression can rescue neuromuscular degeneration in Drosophila models following Parkin or PINK1 knockdown [92]. Furthermore, mitoquinone has been shown to alleviate brain damage after subarachnoid hemorrhage in rats by inhibiting oxidative stress and activating mitophagy through the Keap1/Nrf2/PHB2 signaling pathway [93]. In mice with cerebral edema-induced brain injury, Nrf2 has been found to inhibit apoptosis by promoting mitophagy, exerting a neuroprotective effect [94]. Consistent with these findings, our study showed that Nrf2 mitigates MA-induced neurotoxicity by regulating mitophagy.

4. Materials and Methods

4.1. Reagents

High purity (98%) MA, provided by the Yunnan Provincial Public Security Department (Kunming, China), was dissolved in saline at a concentration of 10 mg/mL, with a 10 mg/kg dose administered by intraperitoneal injection [52,53]. Additionally, MA was dissolved with phosphate-buffered saline (PBS) at a concentration of 100 mmol/L, then filtered and stored at 4 °C. Bovine serum albumin (A500023-0100, Sangon Biotech, Shanghai, China) and Tween-20 (T8220, Solarbio, Beijing, China) were also used in the experiments.

4.2. Antibodies

The following primary antibodies were used for immunoblotting and immunofluorescence experiments to detect specific proteins: MAP2 (67015-1-lg, Proteintech, Rosemont, IL, USA), Nrf2 (16396-1-AP, Proteintech, USA), Drp1 (12957-1-AP, Proteintech, USA), p-Drp1(Ser616) (#3455, Cell Signaling Technology, Danvers, MA, USA), Mfn1 (13798-1-AP, Proteintech, USA), PINK1 (23274-1-AP, Proteintech, USA), Parkin (14060-1-AP, Proteintech, USA), Cyt-c (10993-1-AP, Proteintech, USA), Caspase 3 (19677-1-AP, Proteintech, USA), Cleaved Caspase-3 (#9664, Cell Signaling Technology, USA), Bax (50599-2-lg, Proteintech, USA), Bcl-2 (26593-1-AP, Proteintech, USA), β-actin (66009-1-lg, Proteintech, USA), and Lamin B1 (#13435S, Cell Signaling Technology, USA).

4.3. Primary Neuronal Culture

Wild-type (WT) C57BL/6J mice (with 48 h of birth) were provided by the Laboratory Animal Center of Kunming Medical University (China). All experimental protocols were approved by the Ethics Committee for Animal Experiments of Kunming Medical University (No. kmmu20221746) and conducted in accordance with relevant guidelines. Primary neuronal culture was performed as follows: under aseptic conditions, neonatal mice were rapidly decapitated and cerebral brain tissue was isolated. The pia mater and blood vessels were carefully removed. Brain tissue homogenates were digested with 0.25% trypsin-EDTA (25200072, Gibco, Grand Island, NY, USA) for 10 min, followed by filtration and collection of cell suspensions using a 70 μm cell strainer (BS-70-XBS, Biosharp, Beijing, China). After centrifugation at 3000 rpm for 8 min at 4 °C, cells were resuspended in Dulbecco’s Modified Eagle Medium (DMEM; C11995500BT, Gibco, USA) containing 10% fetal bovine serum (C04001-500, ViVaCell, Shanghai, China) and 2% penicillin-streptomycin mixture (P1400, Solarbio, China). Cells were placed in 25 cm2 culture flasks containing 6 mL of medium and incubated in an incubator at 37 °C, 5% CO2, and 95% humidity. After 24 h or overnight incubation, the culture medium was replaced with neuronal medium (05790, Stem-Cell, Vancouver, BC, Canada) containing 10% fetal bovine serum, 2% penicillin-streptomycin mixture, 2% B27 (17504044, Gibco, USA), and 1% glutamine (35050061, Gibco, USA). The culture medium was subsequently changed every two days. Neurons were cultured for 7–8 days or until growth density reached 80–90%. The cells were then exposed to 400 μM MA for 24 h before being used in subsequent experiments [21]. The purity of the cultured neurons was determined by immunofluorescence detection of microtubule-associated protein-2 (MAP2) expression.

4.4. Animal Model Establishment

Adult male WT C57BL/6J mice (6–8 weeks, 18–22 g) were purchased from the Laboratory Animal Center of Kunming Medical University (China). Male Nrf2 knockout C57BL/6J mice were purchased from Cyagen Model Biology Research Center Co. Ltd. (Guangzhou, China). All mice were housed at the Laboratory Animal Center of Kunming Medical University and acclimatized to the new environment for 3 days before the start of the experiments. Body weight measurements were recorded before and after drug administration. All study protocols were approved by the Ethics Committee for Animal Experiments of Kunming Medical University (No. kmmu20221746). The WT mice were randomly divided into two groups of 10 mice each, including a WT-control group and WT-MA group. Nrf2 knockout mice were randomly divided into two groups of 6 mice each, including a Nrf2-KO-control group and Nrf2-KO-MA group. An intraperitoneal injection of MA (10 mg/kg) was given twice a day for 5 consecutive days to the WT-MA and Nrf2-KO-MA groups, while an intraperitoneal injection of saline (10 mL/kg) was given twice a day for 5 consecutive days to the WT-control and Nrf2-KO-control groups. All mice were subjected to stereotyped behavioral observations and the Morris water maze test. Specific experimental protocols are detailed in Supplemental Figure S3A. All mice were deeply anesthetized with an overdose of isoflurane (3–5%), and subsequently, transcardial perfusion was carried out using saline. After confirming the absence of vital signs (including heartbeat and respiration), the tissues of prefrontal cortex and hippocampus were collected.

4.5. Stereotyped Behavior

Stereotyped behavior is characterized by repetitive, purposeless, and mechanical movements [95]. MA-induced stereotyped behavior was observed as described previously [96,97]. The scoring scale was as follows: 0: no repetitive head movements; 1: slight repetitive side-to-side head movements; 2: strong repetitive side-to-side head movements; 3: stereotypical behaviors involving stationary body posture, accompanied by strong side-to-side or turning head movements. The examiners were blind to the experimental groups.

4.6. Morris Water Maze

The Morris water maze is a widely used test for estimating learning and memory functions. The apparatus used in this study consisted of a circular pool with a diameter of 120 cm and height of 50 cm, as well as a height-adjustable platform 6 cm in diameter. The water temperature was adjusted to 21–22 °C. To obscure the platform, titanium dioxide was added to the water and mixed thoroughly, with the platform positioned approximately 1 cm below the water surface. Behavioral performance was recorded using a video tracking system (SMART v3.0, Panlab, Cornellà, Barcelona, Spain). The experimental procedure was based on established protocols [52,98], with slight modifications. The pool quadrants and platform location are detailed in Supplemental Figure S3B, and the water entry points are detailed in Supplemental Figure S3C. The experimental procedure consisted of a training phase and a test phase. In the training phase, the platform was fixed in the center of quadrant 3 (SE). After drug administration at 8:30 am daily, each mouse was gently placed into the pool facing the wall, with swimming trajectory and time taken to locate the platform then recorded for 60 s. Upon reaching the platform and staying on it for 5 s, the recording was stopped, and the mice were allowed to remain on the platform for a further 15 s. If a mouse failed to locate the platform within 60 s, the recording was stopped and the mouse was manually placed on the platform for 15 s, maintaining a total trial time of 60 s. After all mice completed training in one quadrant, the procedure was repeated for the remaining three quadrants. The average time taken to reach the platform across all four quadrants (escape latency) was recorded as the learning performance on that day. In the test phase, following 5 days of training, the platform was removed. Each mouse was gently placed into the pool from quadrant 1 (NW) facing the wall, with retention time in each quadrant, swim trajectory, and number of traverses of the former platform location recorded over 60 s. After completing the behavioral tests, the prefrontal cortex and hippocampus were isolated for further analysis.

4.7. DCFH-DA Fluorescent Probe

Primary neurons were washed twice with Hank’s buffer solution and seeded into a 96-well plate, followed by the addition of 100 μL of DCFH-DA working solution (R252, Dojindo, Kumamoto, Japan) to each well. The cells were incubated in the dark for 30 min at 37 °C, after which the DCFH-DA solution was removed, and the wells were washed twice with Hank’s buffer. Finally, 100 μL of Hank’s buffer was added to each well. For frozen mouse brain tissue sections, the samples were rinsed three times with PBS (5 min each time). Under light-avoidance conditions, 10 μM DCFH-DA solution (S0033S, Beyotime, Shanghai, China) was added and incubated at 37 °C for 1 h. The sections were then rinsed three times in PBS, and subsequently blocked with an anti-fluorescent attenuating blocking agent containing 4′,6-diamidino-2-phenylindole (DAPI, S2110, Solarbio, China). Images were acquired using a fluorescence microscope and analyzed with ImageJv1.46r.

4.8. Transmission Electron Microscopy

Prefrontal cortex and hippocampus brain tissue samples were prefixed in 2.5% glutaraldehyde, then postfixed with 1% osmium fixative. Dehydration was performed under increasing concentrations of ethanol (50%, 70%, 80%, 90%, and 100%). After dehydration, the samples were embedded in epoxy resin and propylene oxide, and ultrathin sections (70 nm) were sliced and stained with uranium and lead salt solutions. The sections were observed and imaged using a transmission electron microscope (JEM-1400Flash, HITACHI, Tokyo, Japan).

4.9. Immunofluorescence Staining

Primary neurons were seeded onto poly-D-lysine-coated coverslips placed in 24-well plates. After treatment, cells were fixed with 4% paraformaldehyde for 30 min at room temperature. Brains were carefully extracted and post-fixed in 4% paraformaldehyde at 4 °C for 24 h. Following fixation, brains were transferred to a 30% sucrose solution in PBS at 4 °C until they sank to the bottom, ensuring complete dehydration and cryoprotection. The brains were then embedded in Optimal Cutting Temperature compound and frozen on dry ice. Coronal sections were cut using a cryostat at a thickness of 10 μm. Sections were collected on positively charged glass slides and stored at −20 °C until further processing. Both cells and frozen mouse brain tissue sections were rinsed three times with PBS, followed by permeabilization with 0.2% Triton X-100 solution (T8200, Solarbio, China) for 30 min at room temperature. After rinsing with PBS, the samples were blocked with 10% goat serum (SL038, Solarbio, China) at room temperature for 1 h, then incubated overnight with primary antibodies (MAP2, Drp1, and Mfn1) at 4 °C. The following day, the samples were washed three times with PBS, then incubated with fluorescent secondary antibodies, including goat anti-mouse IgG, Dylight 594 (A23410, Abbkine, CA, USA), goat anti-rabbit IgG H&L (Alexa Fluor® 488; ab150077, Abcam, Cambridge, UK) at 37 °C for 1 h, protected from light. The samples were sealed with anti DAPI-containing fluorescence attenuating sealer (S2110, Solarbio, China). Images were acquired using a fluorescence microscope and analyzed with ImageJ software. Quantification was performed on single-channel images rather than merged images to avoid spectral overlap and ensure accuracy. Merged images were used only for representative presentation and localization assessment and were not included in fluorescence intensity quantification. Background fluorescence was measured from a cell-free region in each image and subtracted from the mean neuronal fluorescence intensity to normalize the data.

4.10. SiRNA Transfection

Neurons were transfected with SiRNA-NC, SiRNA-Nrf2-297, SiRNA-Nrf2-741, and SiRNA-Nrf2-953 (Shanghai GenePharma Co., Ltd., Shanghai, China). The transfection process was as follows: neurons at a density of 3–4 × 10⁵ cells/well were inoculated in 6-well plates and cultured in an incubator at 37 °C, 5% CO2, and 95% humidity. The next day, transfection was performed using neuronal medium containing SiRNA-NC/SiRNA-Nrf2 and polybrene (1 μL/mL) for 48 h. After replacing the medium with fresh neuronal medium, the cells were incubated for an additional 24 h, resulting in a total transfection time of 72 h.
Following incubation, the cells were collected, and transfection efficiency was detected by Western blot analysis. Transfected neurons were then treated with MA for 24 h.

4.11. Total Cellular Protein and Nuclear Protein Extraction

Neuronal cells and prefrontal cortical and hippocampal brain tissues from mice were used for protein extraction. Total cell lysates were prepared using RIPA lysate (P0013B, Beyotime, China) containing protease and phosphatase inhibitors. The samples were lysed on ice for 30 min, with gently shaking and mixing every 10 min, then centrifuged at 4 °C and 12,000 rpm for 15 min. The resulting supernatant was collected for further analysis. Nuclear proteins were extracted using a Cellular Nuclear Protein and Plasma Protein Extraction Kit (P0027, Beyotime, China). All collected proteins were stored at −80 °C.

4.12. Western Blot Analysis

Protein concentrations were determined using a BCA Protein Concentration Assay Kit (P0010, Beyotime, China). Equal amounts of protein were separated using 12% sodium dodecyl-sulfate polyacrylamide gel electrophoresis (SDS-PAGE) and transferred to polyvinylidene fluoride (PVDF) membranes (10600023, Cytiva, Marlborough, MA, USA). The membranes were blocked with 5% skimmed milk at room temperature for 2 h, washed with TBST solution, and incubated with primary antibodies (Nrf2, Drp1, p-Drp1, Mfn1, PINK1, Parkin, Cyt-c, Caspase 3, Cleaved Caspase-3, Bax, Bcl-2, β-actin, and Lamin B1) overnight at 4 °C. The following day, the membranes were incubated with horseradish peroxidase (HRP)-conjugated goat anti-rabbit (A21020, Abbkine, USA) or goat anti-mouse (A21010, Abbkine, USA) secondary antibodies at room temperature for 1.5 h. Protein bands were visualized using an Extra-Ultra-Sensitive ECL Chemiluminescent Substrate Kit (BL520A, Biosharp, China) and imaged using the Bio-Rad ChemiDoc™ MP system (Bio-Rad, Hercules, CA, USA). Protein gray values were calculated using ImageJ software.

4.13. Statistical Analysis

All statistical analyses were performed using SPSS v21.0, while graphs and charts were created using GraphPad Prism v6.0. Images were arranged and combined using Adobe Illustrator 2020. All data are expressed as mean ± standard deviation (SD) of at least three independent experiments. The relative fluorescence intensity was calculated by dividing the fluorescence intensity of each group by the average fluorescence intensity of the control group. Changes in body weight before and after drug administration were analyzed using paired t-tests. Water maze latency was analyzed by repeated measures-multifactorial analysis of variance (ANOVA). Independent samples t-tests were used to compare data between two groups, and one-way ANOVA was used for comparisons across multiple groups with Tukey honestly significant difference (HSD) or Tamhane’s T2 post hoc comparison. Statistical significance was determined at p < 0.05.

5. Conclusions

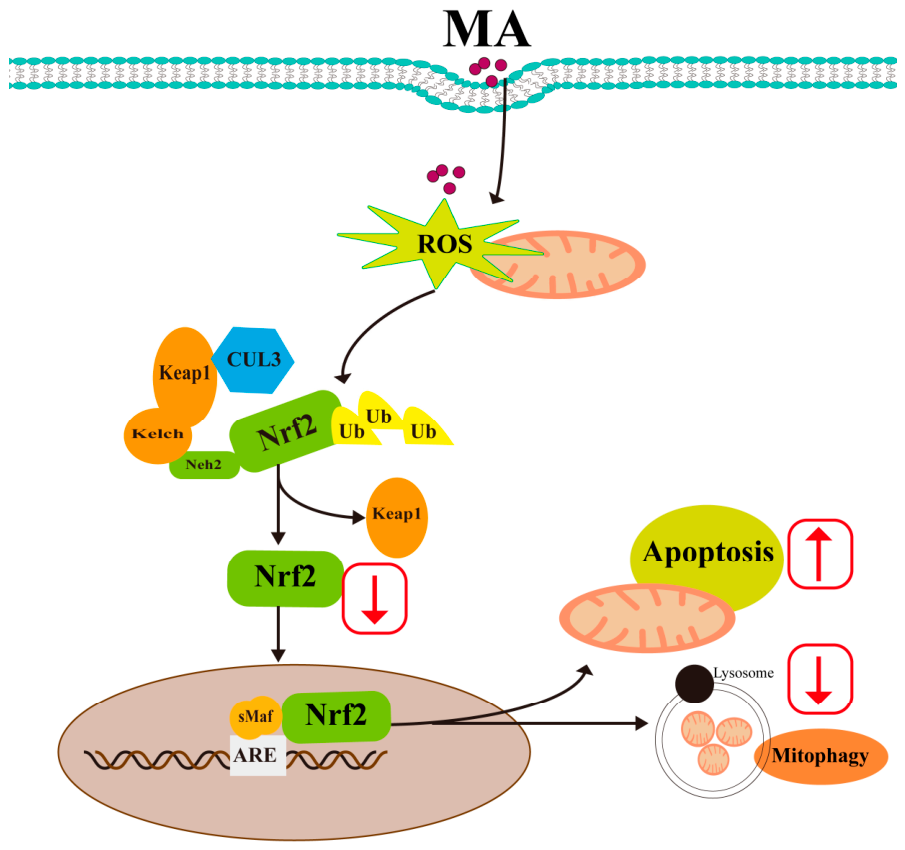
In conclusion, this study demonstrated that the Nrf2 signaling pathway was activated in MA-exposed primary neurons, as well as in the prefrontal cortex and hippocampus, to resist MA-induced neurotoxicity. Knockout or silencing of Nrf2 aggravated cognitive dysfunction in MA-exposed mice and exacerbated MA-induced oxidative stress, disturbed mitochondrial dynamics, and suppressed mitophagy levels (Figure 12). Consequently, Nrf2 may represent a promising therapeutic target for mitigating neurotoxic effects induced by MA.
It is important to note that the present study employed primary neuronal cultures derived from the whole brain. While this model provides a robust platform for assessing general neurotoxicity, it may not fully recapitulate the specific pathophysiology induced by MA, a drug known to preferentially target catecholaminergic neurons. The relative scarcity of dopaminergic neurons in whole-brain cultures likely dilutes the magnitude of MA-induced cellular effects, potentially leading to an underestimation of its true impact on vulnerable cell populations. Future investigations utilizing mesencephalic neuron cultures or tyrosine hydroxylase positive cell sorting are necessary to validate whether the observed effects are specific to catecholaminergic systems. This study utilized silencing and knockout techniques to explore the role of Nrf2 in MA-induced neurotoxicity. Future studies should incorporate the use of Nrf2 agonists or overexpression approaches to further validate the role of Nrf2 in the above processes. In addition, human brain tissue samples should be collected to assess relevant biomarkers and strengthen the findings through clinical validation.

Supplementary Materials

The following supporting information can be downloaded at: https://www.mdpi.com/article/10.3390/ijms27156565/s1.

Author Contributions

Q.N.: conceptualization; methodology; formal analysis; data curation; writing—original draft preparation; funding acquisition. W.D.: methodology; data curation; writing—original draft preparation. P.Z.: investigation; data curation; writing—original draft preparation. G.Y., D.J., Z.H., Y.P. and Y.Y.: investigation. L.L.: conceptualization; supervision; project administration; funding acquisition. S.H.: conceptualization; writing—review and editing; supervision; project administration; funding acquisition. All authors have read and agreed to the published version of the manuscript.

Funding

This work was supported by the National Natural Science Foundation of China [82260336, 82371898], Research Project of the National Health Commission Key Laboratory of Drug Addiction Medicine, Kunming Medical University [2020DAMARC-002], Joint Research Project of Science and Technology Department of Yunnan Province & Kunming Medical University [202301AY070001-026], Education Department of Hainan Province [Hnky2024-32], Hainan Provincial Natural Science Foundation of China [825QN333], the Undergraduate Scientific Research and Innovation Training Program of Hainan Medical University, China [RZ2500002193], and Academic Enhancement Support Program of Hainan Medical University [XSTS2026192].

Institutional Review Board Statement

All animal protocols were approved by the Ethics Committee for Animal Experiments of Kunming Medical University (No. kmmu20221746; 8 November 2022).

Informed Consent Statement

Not applicable.

Data Availability Statement

The original contributions presented in this study are included in the article/Supplementary Material. Further inquiries can be directed to the corresponding authors.

Conflicts of Interest

The authors declare no conflicts of interest.

Abbreviations

The following abbreviations are used in this manuscript:
MAMethamphetamine
Cyt-cCytochrome c
Drp1Dynamin-related protein 1
Egr3Early growth response 3
Mfn1Mitofusin 1
Nrf2Nuclear factor E2-related factor 2
Keap1Kelch-like ECH-associated protein 1
AREAntioxidant response element
ADAlzheimer’s disease
PDParkinson’s disease
HO-1Heme oxygenase-1
MAP2Microtubule-associated protein 2
KOKnockout
ROSReactive oxygen species
ATPAdenosine triphosphate
LC3Microtubule-associated protein 1 light chain 3
TBHQTert-butylhydroquinone
PBSphosphate-buffered saline
WTWild-type

References

  1. Kohno, M.; Beste, C.; Pilhatsch, M. Editorial: The Global Methamphetamine Problem: Approaches to Elucidate the Neurobiology, Epidemiology, and Therapeutic Effectiveness. Front. Psychiatry 2020, 11, 850. [Google Scholar] [CrossRef] [Scilit] [PubMed]
  2. Chiang, M.; Lombardi, D.; Du, J.; Makrum, U.; Sitthichai, R.; Harrington, A.; Shukair, N.; Zhao, M.; Fan, X. Methamphetamine-associated psychosis: Clinical presentation, biological basis, and treatment options. Hum. Psychopharmacol. 2019, 34, e2710. [Google Scholar] [CrossRef] [Scilit] [PubMed]
  3. Glasner-Edwards, S.; Mooney, L.J.; Marinelli-Casey, P.; Hillhouse, M.; Ang, A.; Rawson, R. Anxiety disorders among methamphetamine dependent adults: Association with post-treatment functioning. Am. J. Addctn. 2010, 19, 385–390. [Google Scholar] [CrossRef] [Scilit]
  4. Zhao, T.; Zhai, C.; Song, H.; Wu, Y.; Ge, C.; Zhang, Y.; Xu, H.; Chi, Z.; Chu, H.; Shi, W.; et al. Methamphetamine-Induced Cognitive Deficits and Psychiatric Symptoms Are Associated with Serum Markers of Liver Damage. Neurotox. Res. 2020, 37, 67–76. [Google Scholar] [PubMed]
  5. Guerin, A.A.; Bridson, T.; Plapp, H.M.; Bedi, G. A systematic review and meta-analysis of health, functional, and cognitive outcomes in young people who use methamphetamine. Neurosci. Biobehav. Rev. 2023, 153, 105380. [Google Scholar] [CrossRef] [Scilit] [PubMed]
  6. Behle, N.; Kamp, F.; Proebstl, L.; Hager, L.; Riebschläger, M.; Schacht-Jablonowsky, M.; Hamdorf, W.; Neumann, S.; Krause, D.; Manz, K.; et al. Treatment outcome, cognitive function, and psychopathology in methamphetamine users compared to other substance users. World J. Psychiatry 2022, 12, 944–957. [Google Scholar] [CrossRef] [Scilit] [PubMed]
  7. Tabatabaei Mirakabad, F.S.; Khoramgah, M.S.; Abdollahifar, M.A.; Tehrani, A.S.; Rezaei-Tavirani, M.; Niknazar, S.; Tahmasebinia, F.; Mahmoudiasl, G.R.; Khoshsirat, S.; Abbaszadeh, H.A. NUPR1- CHOP experssion, autophagosome formation and apoptosis in the postmortem striatum of chronic methamphetamine user. J. Chem. Neuroanat. 2021, 114, 101942. [Google Scholar] [CrossRef] [Scilit] [PubMed]
  8. Khoshsirat, S.; Khoramgah, M.S.; Mahmoudiasl, G.R.; Rezaei-Tavirani, M.; Abdollahifar, M.A.; Tahmasebinia, F.; Darabi, S.; Niknazar, S.; Abbaszadeh, H.A. LC3 and ATG5 overexpression and neuronal cell death in the prefrontal cortex of postmortem chronic methamphetamine users. J. Chem. Neuroanat. 2020, 107, 101802. [Google Scholar] [CrossRef] [Scilit] [PubMed]
  9. Zeng, Q.; Xiong, Q.; Zhou, M.; Tian, X.; Yue, K.; Li, Y.; Shu, X.; Ru, Q. Resveratrol attenuates methamphetamine-induced memory impairment via inhibition of oxidative stress and apoptosis in mice. J. Food Biochem. 2021, 45, e13622. [Google Scholar] [CrossRef] [Scilit] [PubMed]
  10. Luo, H.; Li, X.; Fan, R.; Ruan, Y.; Qian, L.; Shen, Y.; Si, Z.; Li, L.; Liu, Y. Neuroprotective effect of histamine H3 receptor blockade on methamphetamine-induced cognitive impairment in mice. Pharmacol. Biochem. Behav. 2023, 222, 173512. [Google Scholar] [CrossRef] [Scilit] [PubMed]
  11. Berman, S.B.; Hastings, T.G. Dopamine oxidation alters mitochondrial respiration and induces permeability transition in brain mitochondria: Implications for Parkinson’s disease. J. Neurochem. 1999, 73, 1127–1137. [Google Scholar] [CrossRef] [Scilit] [PubMed]
  12. Jana, S.; Sinha, M.; Chanda, D.; Roy, T.; Banerjee, K.; Munshi, S.; Patro, B.S.; Chakrabarti, S. Mitochondrial dysfunction mediated by quinone oxidation products of dopamine: Implications in dopamine cytotoxicity and pathogenesis of Parkinson’s disease. Biochim. Biophys. Acta 2011, 1812, 663–673. [Google Scholar] [CrossRef] [Scilit] [PubMed]
  13. Brown, J.M.; Quinton, M.S.; Yamamoto, B.K. Methamphetamine-induced inhibition of mitochondrial complex II: Roles of glutamate and peroxynitrite. J. Neurochem. 2005, 95, 429–436. [Google Scholar] [CrossRef] [Scilit] [PubMed]
  14. Sepehr, A.; Taheri, F.; Heidarian, S.; Motaghinejad, M.; Safari, S. Neuroprotective and neuro-survival properties of safinamide against methamphetamine-induced neurodegeneration: Hypothetic possible role of BDNF/TrkB/PGC-1α signaling pathway and mitochondrial uncoupling protein-2(UCP-2). Med. Hypotheses 2020, 143, 110094. [Google Scholar] [CrossRef] [Scilit] [PubMed]
  15. Nguyen, X.K.; Lee, J.; Shin, E.J.; Dang, D.K.; Jeong, J.H.; Nguyen, T.T.; Nam, Y.; Cho, H.J.; Lee, J.C.; Park, D.H.; et al. Liposomal melatonin rescues methamphetamine-elicited mitochondrial burdens, pro-apoptosis, and dopaminergic degeneration through the inhibition PKCδ gene. J. Pineal Res. 2015, 58, 86–106. [Google Scholar] [PubMed]
  16. Jayanthi, S.; Deng, X.; Noailles, P.A.; Ladenheim, B.; Cadet, J.L. Methamphetamine induces neuronal apoptosis via cross-talks between endoplasmic reticulum and mitochondria-dependent death cascades. FASEB J. 2004, 18, 238–251. [Google Scholar] [CrossRef] [Scilit] [PubMed]
  17. Jayanthi, S.; Deng, X.; Bordelon, M.; McCoy, M.T.; Cadet, J.L. Methamphetamine causes differential regulation of pro-death and anti-death Bcl-2 genes in the mouse neocortex. FASEB J. 2001, 15, 1745–1752. [Google Scholar] [CrossRef] [Scilit] [PubMed]
  18. Cadet, J.L.; Jayanthi, S.; Deng, X. Methamphetamine-induced neuronal apoptosis involves the activation of multiple death pathways. Rev. Neurotox. Res. 2005, 8, 199–206. [Google Scholar] [CrossRef] [Scilit]
  19. Galluzzi, L.; Blomgren, K.; Kroemer, G. Mitochondrial membrane permeabilization in neuronal injury. Nat. Rev. Neurosci. 2009, 10, 481–494. [Google Scholar] [CrossRef] [Scilit] [PubMed]
  20. Ravagnan, L.; Roumier, T.; Kroemer, G. Mitochondria, the killer organelles and their weapons. J. Cell Physiol. 2002, 192, 131–137. [Google Scholar] [CrossRef] [Scilit] [PubMed]
  21. Shen, B.; Zhang, R.; Yang, G.; Peng, Y.; Nie, Q.; Yu, H.; Dong, W.; Chen, B.; Song, C.; Tian, Y.; et al. Cannabidiol prevents methamphetamine-induced neurotoxicity by modulating dopamine receptor D1-mediated calcium-dependent phosphorylation of methyl-CpG-binding protein 2. Front. Pharmacol. 2022, 13, 972828. [Google Scholar] [CrossRef] [Scilit] [PubMed]
  22. Wilson, T.J.; Slupe, A.M.; Strack, S. Cell signaling and mitochondrial dynamics: Implications for neuronal function and neurodegenerative disease. Neurobiol. Dis. 2013, 51, 13–26. [Google Scholar] [CrossRef] [Scilit] [PubMed]
  23. Ishihara, N.; Eura, Y.; Mihara, K. Mitofusin 1 and 2 play distinct roles in mitochondrial fusion reactions via GTPase activity. J. Cell Sci. 2004, 117, 6535–6546. [Google Scholar] [CrossRef] [Scilit] [PubMed]
  24. Mattie, S.; Riemer, J.; Wideman, J.G.; McBride, H.M. A new mitofusin topology places the redox-regulated C terminus in the mitochondrial intermembrane space. J. Cell Biol. 2018, 217, 507–515. [Google Scholar] [PubMed]
  25. Kim, Y.Y.; Um, J.H.; Yoon, J.H.; Kim, H.; Lee, D.Y.; Lee, Y.J.; Jee, H.J.; Kim, Y.M.; Jang, J.S.; Jang, Y.G.; et al. Assessment of mitophagy in mt-Keima Drosophila revealed an essential role of the PINK1-Parkin pathway in mitophagy induction in vivo. FASEB J. 2019, 33, 9742–9751. [Google Scholar] [CrossRef] [Scilit] [PubMed]
  26. Wen, S.; Aki, T.; Funakoshi, T.; Unuma, K.; Uemura, K. Role of Mitochondrial Dynamics in Cocaine’s Neurotoxicity. Int. J. Mol. Sci. 2022, 23, 5418. [Google Scholar] [CrossRef] [Scilit] [PubMed]
  27. Chandra, R.; Francis, T.C.; Konkalmatt, P.; Amgalan, A.; Gancarz, A.M.; Dietz, D.M.; Lobo, M.K. Opposing role for Egr3 in nucleus accumbens cell subtypes in cocaine action. J. Neurosci. 2015, 35, 7927–7937. [Google Scholar] [CrossRef] [Scilit] [PubMed]
  28. Cole, S.L.; Chandra, R.; Harris, M.; Patel, I.; Wang, T.; Kim, H.; Jensen, L.; Russo, S.J.; Turecki, G.; Gancarz-Kausch, A.M.; et al. Cocaine-induced neuron subtype mitochondrial dynamics through Egr3 transcriptional regulation. Mol. Brain 2021, 14, 101. [Google Scholar] [CrossRef] [Scilit] [PubMed]
  29. Funakoshi, T.; Furukawa, M.; Aki, T.; Uemura, K. Repeated exposure of cocaine alters mitochondrial dynamics in mouse neuroblastoma Neuro2a. Neurotoxicology 2019, 75, 70–77. [Google Scholar] [CrossRef] [Scilit] [PubMed]
  30. Wen, S.; Unuma, K.; Funakoshi, T.; Aki, T.; Uemura, K. Altered cardiac mitochondrial dynamics and biogenesis in rat after short-term cocaine administration. Sci. Rep. 2021, 11, 24129. [Google Scholar] [CrossRef] [Scilit] [PubMed]
  31. Lenzi, P.; Biagioni, F.; Busceti, C.L.; Lazzeri, G.; Polzella, M.; Frati, A.; Ferrucci, M.; Fornai, F. Alterations of Mitochondrial Structure in Methamphetamine Toxicity. Int. J. Mol. Sci. 2022, 23, 8926. [Google Scholar] [CrossRef] [Scilit] [PubMed]
  32. Yagishita, Y.; Chartoumpekis, D.V.; Kensler, T.W.; Wakabayashi, N. NRF2 and the Moirai: Life and Death Decisions on Cell Fates. Antioxid. Redox Signal 2023, 38, 684–708. [Google Scholar] [CrossRef] [Scilit] [PubMed]
  33. George, M.; Tharakan, M.; Culberson, J.; Reddy, A.P.; Reddy, P.H. Role of Nrf2 in aging, Alzheimer’s and other neurodegenerative diseases. Ageing Res. Rev. 2022, 82, 101756. [Google Scholar] [CrossRef] [Scilit] [PubMed]
  34. Lee, H.S.; Jeong, G.S. 6,7,4′-Trihydroxyflavanone Mitigates Methamphetamine-Induced Neurotoxicity in SH-SY5y Cells via Nrf2/heme Oxyganase-1 and PI3K/Akt/mTOR Signaling Pathways. Molecules 2021, 26, 2442. [Google Scholar] [CrossRef] [Scilit] [PubMed]
  35. Kholghi, A.; Hatami, H.; Khajehnasiri, N.; Sadeghian, R. Intraperitoneal injection of buprenorphine on anxiety-like behavior and alteration in expression of Gfap and Nrf2 in methamphetamine treated rats. Vet. Res. Forum 2022, 13, 417–422. [Google Scholar] [PubMed]
  36. Zhou, L.; Zhou, M.; Tan, H.; Xiao, M. Cypermethrin-induced cortical neurons apoptosis via the Nrf2/ARE signaling pathway. Pestic. Biochem. Physiol. 2020, 165, 104547. [Google Scholar] [CrossRef] [Scilit] [PubMed]
  37. Zhang, X.; Cui, Y.; Song, X.; Jin, X.; Sheng, X.; Xu, X.; Li, T.; Chen, H.; Gao, L. Curcumin alleviates ketamine-induced oxidative stress and apoptosis via Nrf2 signaling pathway in rats’ cerebral cortex and hippocampus. Env. Toxicol. 2023, 38, 300–311. [Google Scholar] [CrossRef] [Scilit]
  38. Chen, X.; Liu, J.; Chen, S.Y. Over-expression of Nrf2 diminishes ethanol-induced oxidative stress and apoptosis in neural crest cells by inducing an antioxidant response. Reprod. Toxicol. 2013, 42, 102–109. [Google Scholar] [CrossRef] [Scilit] [PubMed]
  39. Liang, J.; Li, L.; Sun, Y.; He, W.; Wang, X.; Su, Q. The protective effect of activating Nrf2/HO-1 signaling pathway on cardiomyocyte apoptosis after coronary microembolization in rats. BMC Cardiovasc. Disord. 2017, 17, 272. [Google Scholar] [CrossRef] [Scilit] [PubMed]
  40. Sun, G.; Zhao, Z.; Lang, J.; Sun, B.; Zhao, Q. Nrf2 loss of function exacerbates endoplasmic reticulum stress-induced apoptosis in TBI mice. Neurosci. Lett. 2022, 770, 136400. [Google Scholar] [CrossRef] [Scilit] [PubMed]
  41. Wang, X.L.; Zhu, Q.Q.; Simayi, A.; Xu, G.P. Nrf2 protects against myocardial ischemia-reperfusion injury in diabetic rats by inhibiting Drp1-mediated mitochondrial fission. Open Med. 2023, 18, 20230711. [Google Scholar] [CrossRef] [Scilit]
  42. Murata, H.; Takamatsu, H.; Liu, S.; Kataoka, K.; Huh, N.H.; Sakaguchi, M. NRF2 Regulates PINK1 Expression under Oxidative Stress Conditions. PLoS ONE 2015, 10, e0142438. [Google Scholar] [CrossRef] [Scilit] [PubMed]
  43. Dong, W.; Wan, J.; Yu, H.; Shen, B.; Yang, G.; Nie, Q.; Tian, Y.; Qin, L.; Song, C.; Chen, B.; et al. Nrf2 protects against methamphetamine-induced nephrotoxicity by mitigating oxidative stress and autophagy in mice. Toxicol. Lett. 2023, 384, 136–148. [Google Scholar] [CrossRef] [Scilit] [PubMed]
  44. Yu, H.; Peng, Y.; Dong, W.; Shen, B.; Yang, G.; Nie, Q.; Tian, Y.; Qin, L.; Song, C.; Chen, B.; et al. Nrf2 attenuates methamphetamine-induced myocardial injury by regulating oxidative stress and apoptosis in mice. Hum. Exp. Toxicol. 2023, 42, 9603271231219488. [Google Scholar] [CrossRef] [Scilit] [PubMed]
  45. Nie, Q.Y.; Yang, G.M.; Zhang, P.; Dong, W.J.; Jing, D.; Hou, Z.P.; Peng, Y.X.; Yu, Y.; Li, L.H.; Hong, S.J. Nrf2 expression, mitochondrial fission, and neuronal apoptosis in the prefrontal cortex of methamphetamine abusers and rats. Brain Res. 2024, 1837, 148973. [Google Scholar] [CrossRef] [Scilit] [PubMed]
  46. Shrestha, P.; Katila, N.; Lee, S.; Seo, J.H.; Jeong, J.H.; Yook, S. Methamphetamine induced neurotoxic diseases, molecular mechanism, and current treatment strategies. Biomed. Pharmacother. 2022, 154, 113591. [Google Scholar] [CrossRef] [Scilit] [PubMed]
  47. Potvin, S.; Pelletier, J.; Grot, S.; Hébert, C.; Barr, A.M.; Lecomte, T. Cognitive deficits in individuals with methamphetamine use disorder: A meta-analysis. Addict. Behav. 2018, 80, 154–160. [Google Scholar] [CrossRef] [Scilit] [PubMed]
  48. Mizoguchi, H.; Yamada, K. Methamphetamine use causes cognitive impairment and altered decision-making. Neurochem. Int. 2019, 124, 106–113. [Google Scholar] [CrossRef] [Scilit] [PubMed]
  49. Shin, J.D.; Tang, W.; Jadhav, S.P. Dynamics of Awake Hippocampal-Prefrontal Replay for Spatial Learning and Memory-Guided Decision Making. Neuron 2019, 104, 1110–1125.e7. [Google Scholar] [CrossRef] [Scilit] [PubMed]
  50. Thompson, P.M.; Hayashi, K.M.; Simon, S.L.; Geaga, J.A.; Hong, M.S.; Sui, Y.; Lee, J.Y.; Toga, A.W.; Ling, W.; London, E.D. Structural abnormalities in the brains of human subjects who use methamphetamine. J. Neurosci. 2004, 24, 6028–6036. [Google Scholar] [CrossRef] [Scilit] [PubMed]
  51. Paulus, M.P.; Hozack, N.E.; Zauscher, B.E.; Frank, L.; Brown, G.G.; Braff, D.L.; Schuckit, M.A. Behavioral and functional neuroimaging evidence for prefrontal dysfunction in methamphetamine-dependent subjects. Neuropsychopharmacology 2002, 26, 53–63. [Google Scholar] [CrossRef] [Scilit] [PubMed]
  52. Cao, G.; Zhang, Y.; Zhu, L.; Zhu, J.; Zhao, N.; Dong, N.; Dang, Y.; Chen, Y.; Chen, T. The inhibitory effect of levo-tetrahydropalmatine on the methamphetamine-induced spatial memory impairment in mice. Neurosci. Lett. 2018, 672, 34–39. [Google Scholar] [CrossRef] [Scilit] [PubMed]
  53. Zeng, Q.; Xiong, Q.; Lin, K.; Liang, Z.; Zhou, M.; Tian, X.; Xu, C.; Ru, Q. Terminalia chebula extracts ameliorate methamphetamine-induced memory deficits via activating the ERK and Nrf2 pathway. Brain Res. Bull. 2022, 184, 76–87. [Google Scholar] [CrossRef] [Scilit] [PubMed]
  54. Mozaffari, S.; Ramezany Yasuj, S.; Motaghinejad, M.; Motevalian, M.; Kheiri, R. Crocin Acting as a Neuroprotective Agent against Methamphetamine-induced Neurodegeneration via CREB-BDNF Signaling Pathway. Iran. J. Pharm. Res. 2019, 18, 745–758. [Google Scholar] [PubMed]
  55. Marshall, J.F.; O’Dell, S.J. Methamphetamine influences on brain and behavior: Unsafe at any speed? Trends Neurosci. 2012, 35, 536–545. [Google Scholar] [CrossRef] [Scilit] [PubMed]
  56. Moratalla, R.; Khairnar, A.; Simola, N.; Granado, N.; Garcia-Montes, J.R.; Porceddu, P.F.; Tizabi, Y.; Costa, G.; Morelli, M. Amphetamine-related drugs neurotoxicity in humans and in experimental animals: Main mechanisms. Prog. Neurobiol. 2017, 155, 149–170. [Google Scholar] [CrossRef] [Scilit] [PubMed]
  57. Fleckenstein, A.E.; Volz, T.J.; Riddle, E.L.; Gibb, J.W.; Hanson, G.R. New insights into the mechanism of action of amphetamines. Annu. Rev. Pharmacol. Toxicol. 2007, 47, 681–698. [Google Scholar] [CrossRef] [Scilit] [PubMed]
  58. Long, J.D.; Liu, Y.; Jiao, D.L.; Wang, Y.J.; Zan, G.Y.; Ju, Y.Y.; Zhao, M.; Liu, J.G. The neuroprotective effect of memantine on methamphetamine-induced cognitive deficits. Behav. Brain Res. 2017, 323, 133–140. [Google Scholar] [CrossRef] [Scilit] [PubMed]
  59. Meng, X.; Zhang, C.; Guo, Y.; Han, Y.; Wang, C.; Chu, H.; Kong, L.; Ma, H. TBHQ Attenuates Neurotoxicity Induced by Methamphetamine in the VTA through the Nrf2/HO-1 and PI3K/AKT Signaling Pathways. Oxid. Med. Cell Longev. 2020, 2020, 8787156. [Google Scholar] [CrossRef] [Scilit] [PubMed]
  60. Abekawa, T.; Ito, K.; Nakagawa, S.; Nakato, Y.; Koyama, T. Effects of aripiprazole and haloperidol on progression to schizophrenia-like behavioural abnormalities and apoptosis in rodents. Schizophr. Res. 2011, 125, 77–87. [Google Scholar] [CrossRef] [Scilit] [PubMed]
  61. Nakato, Y.; Abekawa, T.; Ito, K.; Inoue, T.; Koyama, T. Lamotrigine blocks apoptosis induced by repeated administration of high-dose methamphetamine in the medial prefrontal cortex of rats. Neurosci. Lett. 2011, 490, 161–164. [Google Scholar] [CrossRef] [Scilit] [PubMed]
  62. Garmabi, B.; Mohaddes, R.; Rezvani, F.; Mohseni, F.; Khastar, H.; Khaksari, M. Erythropoietin improve spatial memory impairment following methamphetamine neurotoxicity by inhibition of apoptosis, oxidative stress and neuroinflammation in CA1 area of hippocampus. J. Chem. Neuroanat. 2022, 124, 102137. [Google Scholar] [CrossRef] [Scilit] [PubMed]
  63. Li, C.; Wang, H.; Wang, M.; Chen, C.; Bai, F.; Ban, M.; Wu, C. Oxytocin Attenuates Methamphetamine-Induced Apoptosis via Oxytocin Receptor in Rat Hippocampal Neurons. Front. Pharmacol. 2021, 12, 639571. [Google Scholar] [CrossRef] [Scilit] [PubMed]
  64. Ghanbari, F.; Khaksari, M.; Vaezi, G.; Hojati, V.; Shiravi, A. Hydrogen Sulfide Protects Hippocampal Neurons Against Methamphetamine Neurotoxicity Via Inhibition of Apoptosis and Neuroinflammation. J. Mol. Neurosci. 2019, 67, 133–141. [Google Scholar] [PubMed]
  65. Tian, C.; Murrin, L.C.; Zheng, J.C. Mitochondrial fragmentation is involved in methamphetamine-induced cell death in rat hippocampal neural progenitor cells. PLoS ONE 2009, 4, e5546. [Google Scholar] [CrossRef] [Scilit] [PubMed]
  66. Castanier, C.; Arnoult, D. Mitochondrial dynamics during apoptosis. Med. Sci. 2010, 26, 830–835. [Google Scholar]
  67. May, A.C.; Aupperle, R.L.; Stewart, J.L. Dark Times: The Role of Negative Reinforcement in Methamphetamine Addiction. Front. Psychiatry 2020, 11, 114. [Google Scholar] [CrossRef] [Scilit] [PubMed]
  68. Parameyong, A.; Govitrapong, P.; Chetsawang, B. Melatonin attenuates the mitochondrial translocation of mitochondrial fission proteins and Bax, cytosolic calcium overload and cell death in methamphetamine-induced toxicity in neuroblastoma SH-SY5Y cells. Mitochondrion 2015, 24, 1–8. [Google Scholar] [CrossRef] [Scilit] [PubMed]
  69. Teodorof-Diedrich, C.; Spector, S.A. Human Immunodeficiency Virus Type 1 and Methamphetamine-Mediated Mitochondrial Damage and Neuronal Degeneration in Human Neurons. J. Virol. 2020, 94, e00924-20. [Google Scholar] [CrossRef] [Scilit] [PubMed]
  70. Breckenridge, D.G.; Kang, B.H.; Kokel, D.; Mitani, S.; Staehelin, L.A.; Xue, D. Caenorhabditis elegans drp-1 and fis-2 regulate distinct cell-death execution pathways downstream of ced-3 and independent of ced-9. Mol. Cell 2008, 31, 586–597. [Google Scholar] [CrossRef] [Scilit] [PubMed]
  71. Kamat, P.K.; Kalani, A.; Kyles, P.; Tyagi, S.C.; Tyagi, N. Autophagy of mitochondria: A promising therapeutic target for neurodegenerative disease. Cell Biochem. Biophys. 2014, 70, 707–719. [Google Scholar] [CrossRef] [Scilit] [PubMed]
  72. Chu, C.T. Mechanisms of selective autophagy and mitophagy: Implications for neurodegenerative diseases. Neurobiol. Dis. 2019, 122, 23–34. [Google Scholar] [CrossRef] [Scilit] [PubMed]
  73. Wang, C.W.; Klionsky, D.J. The molecular mechanism of autophagy. Mol. Med. 2003, 9, 65–76. [Google Scholar] [CrossRef] [Scilit] [PubMed]
  74. Shirihai, O.S.; Song, M.; Dorn, G.W., 2nd. How mitochondrial dynamism orchestrates mitophagy. Circ. Res. 2015, 116, 1835–1849. [Google Scholar] [CrossRef] [Scilit] [PubMed]
  75. Swerdlow, N.S.; Wilkins, H.M. Mitophagy and the Brain. Int. J. Mol. Sci. 2020, 21, 9661. [Google Scholar] [CrossRef] [Scilit] [PubMed]
  76. Jayatunga, D.P.W.; Hone, E.; Bharadwaj, P.; Garg, M.; Verdile, G.; Guillemin, G.J.; Martins, R.N. Targeting Mitophagy in Alzheimer’s Disease. J. Alzheimers Dis. 2020, 78, 1273–1297. [Google Scholar] [CrossRef] [Scilit] [PubMed]
  77. Lenzi, P.; Marongiu, R.; Falleni, A.; Gelmetti, V.; Busceti, C.L.; Michiorri, S.; Valente, E.M.; Fornai, F. A subcellular analysis of genetic modulation of PINK1 on mitochondrial alterations, autophagy and cell death. Arch. Ital. Biol. 2012, 150, 194–217. [Google Scholar] [CrossRef] [Scilit] [PubMed]
  78. Hwang, E.S.; Song, S.B. Impaired Autophagic Flux in Glucose-Deprived Cells: An Outcome of Lysosomal Acidification Failure Exacerbated by Mitophagy Dysfunction. Mol. Cells 2023, 46, 655–663. [Google Scholar] [CrossRef] [Scilit]
  79. Liu, B.; Traini, R.; Killinger, B.; Schneider, B.; Moszczynska, A. Overexpression of parkin in the rat nigrostriatal dopamine system protects against methamphetamine neurotoxicity. Exp. Neurol. 2013, 247, 359–372. [Google Scholar] [CrossRef] [Scilit] [PubMed]
  80. Yang, G.; Li, J.; Leung, C.K.; Shen, B.; Wang, C.; Xu, Y.; Lin, S.; Zhang, S.; Tan, Y.; Zhang, H.; et al. Methamphetamine and HIV-1 Tat proteins synergistically induce microglial autophagy via activation of the Nrf2/NQO1/HO-1 signal pathway. Neuropharmacology 2022, 220, 109256. [Google Scholar] [CrossRef] [Scilit] [PubMed]
  81. Dang, D.K.; Shin, E.J.; Kim, D.J.; Tran, H.Q.; Jeong, J.H.; Jang, C.G.; Ottersen, O.P.; Nah, S.Y.; Hong, J.S.; Nabeshima, T.; et al. PKCδ-dependent p47phox activation mediates methamphetamine-induced dopaminergic neurotoxicity. Free Radic. Biol. Med. 2018, 115, 318–337. [Google Scholar] [CrossRef] [Scilit] [PubMed]
  82. Ramkissoon, A.; Wells, P.G. Methamphetamine oxidative stress, neurotoxicity, and functional deficits are modulated by nuclear factor-E2-related factor 2. Free Radic. Biol. Med. 2015, 89, 358–368. [Google Scholar] [CrossRef] [Scilit] [PubMed]
  83. Wei, T.; Li, J.D.; Wang, Y.J.; Zhao, W.; Duan, F.; Wang, Y.; Xia, L.L.; Jiang, Z.B.; Song, X.; Zhu, Y.Q.; et al. p-Nrf2/HO-1 Pathway Involved in Methamphetamine-induced Executive Dysfunction through Endoplasmic Reticulum Stress and Apoptosis in the Dorsal Striatum. Neurotox. Res. 2023, 41, 446–458. [Google Scholar] [CrossRef] [Scilit] [PubMed]
  84. Qian, L.; Ruan, Y.; Gong, X.; Yu, Z.; Lin, S.; Li, X.; Shen, Y.; Luo, H.; Si, Z.; Liu, Y. The neuroprotective effect of LCZ696 on methamphetamine-induced cognitive impairment in mice. Neurosci. Lett. 2024, 823, 137630. [Google Scholar] [CrossRef] [Scilit] [PubMed]
  85. Granado, N.; Lastres-Becker, I.; Ares-Santos, S.; Oliva, I.; Martin, E.; Cuadrado, A.; Moratalla, R. Nrf2 deficiency potentiates methamphetamine-induced dopaminergic axonal damage and gliosis in the striatum. Glia 2011, 59, 1850–1863. [Google Scholar] [CrossRef] [Scilit] [PubMed]
  86. Ramkissoon, A.; Wells, P.G. Developmental role of nuclear factor E2-related factor 2 in mitigating methamphetamine fetal toxicity and postnatal neurodevelopmental deficits. Free Radic. Biol. Med. 2013, 65, 620–631. [Google Scholar] [CrossRef] [Scilit] [PubMed]
  87. Jumnongprakhon, P.; Govitrapong, P.; Tocharus, C.; Pinkaew, D.; Tocharus, J. Melatonin Protects Methamphetamine-Induced Neuroinflammation Through NF-κB and Nrf2 Pathways in Glioma Cell Line. Neurochem. Res. 2015, 40, 1448–1456. [Google Scholar] [CrossRef] [Scilit] [PubMed]
  88. Cheng, Q.Q.; Wan, Y.W.; Yang, W.M.; Tian, M.H.; Wang, Y.C.; He, H.Y.; Zhang, W.D.; Liu, X. Gastrodin protects H9c2 cardiomyocytes against oxidative injury by ameliorating imbalanced mitochondrial dynamics and mitochondrial dysfunction. Acta Pharmacol. Sin. 2020, 41, 1314–1327. [Google Scholar] [CrossRef] [Scilit] [PubMed]
  89. Hao, J.; Zhou, J.; Hu, S.; Zhang, P.; Wu, H.; Yang, J.; Zhao, B.; Liu, H.; Lin, H.; Chi, J.; et al. RTA 408 ameliorates diabetic cardiomyopathy by activating Nrf2 to regulate mitochondrial fission and fusion and inhibiting NF-κB-mediated inflammation. Am. J. Physiol. Cell Physiol. 2024, 326, C331–C347. [Google Scholar] [CrossRef] [Scilit] [PubMed]
  90. Li, Y.; Feng, L.; Xie, D.; Luo, Y.; Lin, M.; Gao, J.; Zhang, Y.; He, Z.; Zhu, Y.Z.; Gong, Q. Icariside II mitigates myocardial infarction by balancing mitochondrial dynamics and reducing oxidative stress through the activation of Nrf2/SIRT3 signaling pathway. Eur. J. Pharmacol. 2023, 956, 175987. [Google Scholar] [CrossRef] [Scilit] [PubMed]
  91. Liu, J.X.; Yang, C.; Liu, Z.J.; Su, H.Y.; Zhang, W.H.; Pan, Q.; Liu, H.F. Protection of procyanidin B2 on mitochondrial dynamics in sepsis associated acute kidney injury via promoting Nrf2 nuclear translocation. Aging 2020, 12, 15638–15655. [Google Scholar] [CrossRef] [Scilit] [PubMed]
  92. Gumeni, S.; Papanagnou, E.D.; Manola, M.S.; Trougakos, I.P. Nrf2 activation induces mitophagy and reverses Parkin/Pink1 knock down-mediated neuronal and muscle degeneration phenotypes. Cell Death Dis. 2021, 12, 671. [Google Scholar] [CrossRef] [Scilit] [PubMed]
  93. Zhang, T.; Wu, P.; Budbazar, E.; Zhu, Q.; Sun, C.; Mo, J.; Peng, J.; Gospodarev, V.; Tang, J.; Shi, H.; et al. Mitophagy Reduces Oxidative Stress Via Keap1 (Kelch-Like Epichlorohydrin-Associated Protein 1)/Nrf2 (Nuclear Factor-E2-Related Factor 2)/PHB2 (Prohibitin 2) Pathway After Subarachnoid Hemorrhage in Rats. Stroke 2019, 50, 978–988, Erratum in Stroke 2020, 51, e57. [Google Scholar] [CrossRef] [Scilit] [PubMed]
  94. Zhang, E.; Wu, T.; Zhuo, Y.; Cui, J.; Sun, S.; Wu, G.; Zhang, G. Effect of Nrf2 on brain injury induced by hydraulic shock via regulation of mitophagy and apoptosis. Aging 2023, 15, 13422–13433. [Google Scholar] [CrossRef] [Scilit] [PubMed]
  95. Sayers, N.; Oliver, C.; Ruddick, L.; Wallis, B. Stereotyped behaviour in children with autism and intellectual disability: An examination of the executive dysfunction hypothesis. J. Intellect. Disabil. Res. JIDR 2011, 55, 699–709. [Google Scholar] [CrossRef] [Scilit] [PubMed]
  96. Sams-Dodd, F. Phencyclidine-induced stereotyped behaviour and social isolation in rats: A possible animal model of schizophrenia. Behav. Pharmacol. 1996, 7, 3–23. [Google Scholar] [CrossRef] [Scilit] [PubMed]
  97. Sams-Dodd, F. Effects of continuous D-amphetamine and phencyclidine administration on social behaviour, stereotyped behaviour, and locomotor activity in rats. Neuropsychopharmacology 1998, 19, 18–25. [Google Scholar] [CrossRef] [Scilit] [PubMed]
  98. Vorhees, C.V.; Williams, M.T. Morris water maze: Procedures for assessing spatial and related forms of learning and memory. Nat. Protoc. 2006, 1, 848–858. [Google Scholar] [CrossRef] [Scilit] [PubMed]
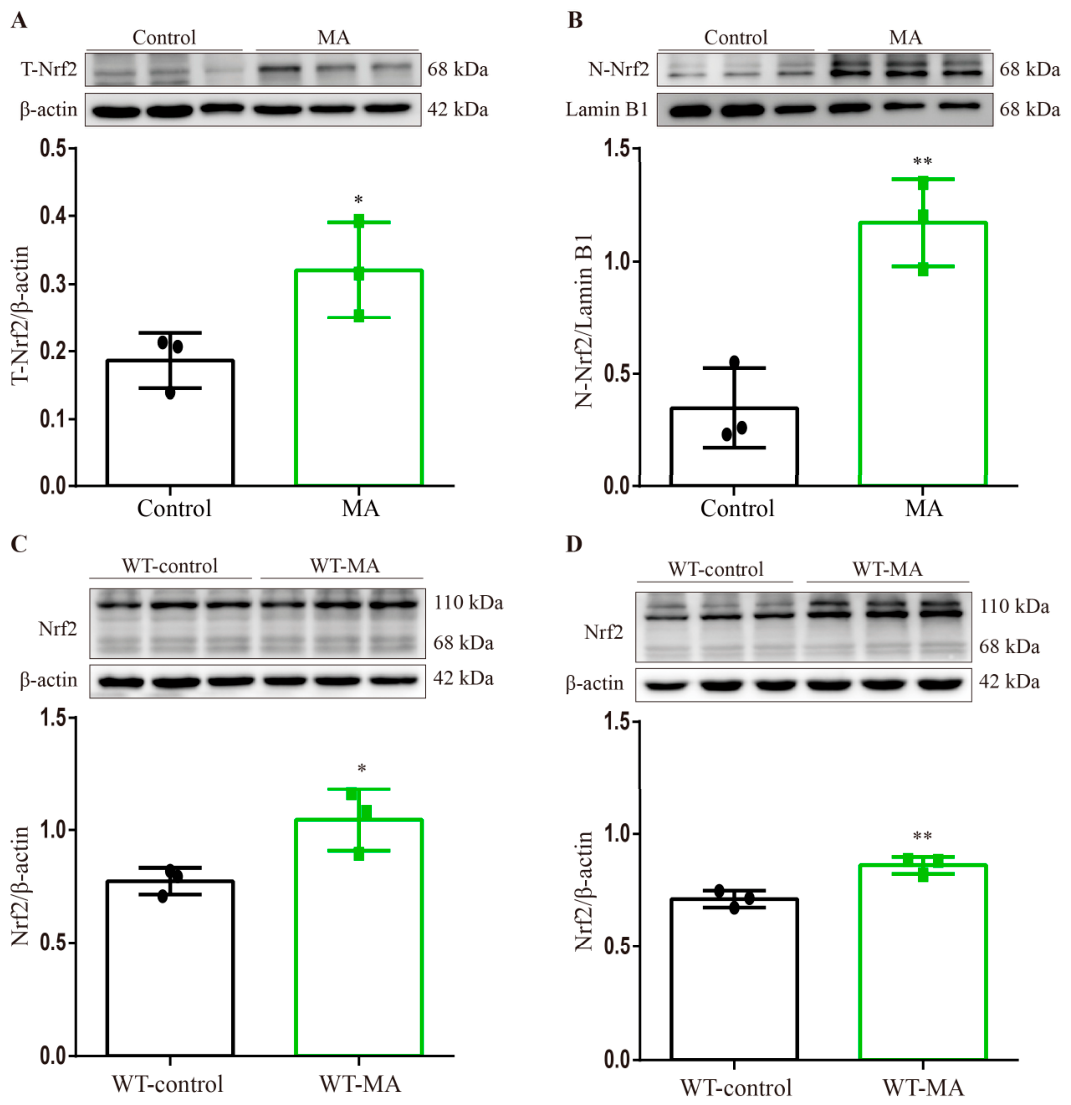
Figure 1. MA induced Nrf2 expression. (A) T-Nrf2 and (B) N-Nrf2 expression levels in primary neurons were detected by Western blot analysis. (C) Nrf2 expression in the prefrontal cortex. (D) Nrf2 expression in the hippocampus. *, p < 0.05; **, p < 0.01 vs. control group, independent samples t-tests.
Ijms 27 06565 g001
Figure 2. Knockout of Nrf2 exacerbated MA-induced cognitive dysfunction in mice. (A) Changes in body weight in each group before and after drug administration (n = 6). (B) Changes in stereotypy score in each group after daily administration (n = 5). (C) Changes in escape latency, (D) time in target quadrant, and (E) platform crossings in Morris water maze (n = 4). (F) Representative trajectory plots of test phase. *, p < 0.05; **, p < 0.01; ***, p < 0.001 vs. WT-control group. a, p < 0.05 vs. the pre-administration Nrf2-KO-MA group. bbb, p < 0.001 vs. pre-administration WT-MA group. #, p < 0.05; ##, p < 0.01; ###, p < 0.001 vs. Nrf2-KO-control group. &, p < 0.05; &&, p < 0.01; &&&, p < 0.001 vs. WT-MA group. Paired t-tests, independent samples t-tests, repeated measures-multifactorial ANOVA, Tukey HSD or Tamhane’s T2 post hoc comparison after significant ANOVA.
Ijms 27 06565 g002
Figure 3. Effects of Nrf2 on MA-induced ROS in primary neurons and mouse prefrontal cortex and hippocampus. (A,B) ROS expression was detected by DCFH-DA fluorescent probe, and Nrf2 silencing exacerbated MA-induced oxidative stress in neurons. Scale bars = 100 μm. ***, p < 0.001 vs. siNC group. ###, p < 0.001 vs. siRNA-Nrf2-953 group. &&, p < 0.01 vs. siNC + MA group. ROS expression in prefrontal cortex (C,D) and hippocampus (E,F). Knockout of Nrf2 exacerbated oxidative stress. Scale bars = 20 μm. ***, p < 0.001 vs. WT-control group. ###, p < 0.001 vs. Nrf2-KO group. &&&, p < 0.001 vs. WT-MA group. Tukey HSD post hoc comparison after significant ANOVA.
Ijms 27 06565 g003
Figure 4. Knockout of Nrf2 aggravated MA-induced mitochondrial morphological changes in the prefrontal cortex and hippocampus. Mitochondrial membrane and cristae structures were basically normal in WT-control (blue arrows) and Nrf2-KO control groups (green arrows). In WT-MA group (orange arrows), mitochondrial swelling was evident, cristae became shorter and slightly disorganized. Mitochondrial morphology changed markedly in the Nrf2-KO-MA group (red arrows), with cristae becoming shorter, fewer, and more disorganized, disappearing in most cases. n = 3 per group. Scale bars = 500 nm.
Ijms 27 06565 g004
Figure 5. Silencing Nrf2 promoted MA-induced mitochondrial fission and exacerbated inhibitory effects of MA on mitochondrial fusion in primary neurons. (A) Drp1, (B) p-Drp1 and (C) Mfn1 expression. *, p < 0.05; ***, p < 0.001 vs. siNC group. ##, p < 0.01; ###, p < 0.001 vs. siRNA-Nrf2-953 group. &, p < 0.05; &&, p < 0.01 vs. siNC + MA group. Tukey HSD post hoc comparison after significant ANOVA.
Ijms 27 06565 g005
Figure 6. Knockout of Nrf2 promoted MA-induced mitochondrial fission in the prefrontal cortex and hippocampus. (A) Fluorescence expression of Drp1 in prefrontal cortex and (B) its relative fluorescence intensity. Scale bars = 20 μm. Western blot analysis of (C) Drp1 and (D) p-Drp1 expression. (E) Fluorescence expression of Drp1 in hippocampus and (F) its relative fluorescence intensity. Scale bars = 20 μm. Western blot analysis of (G) Drp1 and (H) p-Drp1 expression. *, p < 0.05; **, p < 0.01; ***, p < 0.001 vs. WT-control group. ##, p < 0.01; ###, p < 0.001 vs. Nrf2-KO-control group. &, p < 0.05; &&&, p < 0.001 vs. WT-MA group. n = 3 per group. Tukey HSD or Tamhane’s T2 post hoc comparison after significant ANOVA.
Ijms 27 06565 g006
Figure 7. Knockout of Nrf2 exacerbated MA inhibition of mitochondrial fusion in the prefrontal cortex and hippo-campus. (A) Fluorescence expression of Mfn1 in prefrontal cortex and (B) its relative fluorescence intensity. Scale bars = 20 μm. (C) Western blot analysis of Mfn1 expression. (D) Fluorescence expression of Mfn1 in hippocampus and (E) its relative fluorescence intensity. Scale bars = 20 μm. (F) Western blot analysis of Mfn1 expression. ***, p < 0.001 vs. WT-control group. #, p < 0.05; ##, p < 0.01; ###, p < 0.001 vs. Nrf2-KO-control group. &, p < 0.05; &&, p < 0.01 vs. WT-MA group. n = 3 per group. Tukey HSD or Tamhane’s T2 post hoc comparison after significant ANOVA.
Ijms 27 06565 g007
Figure 8. Silencing Nrf2 reduced MA-induced mitophagy in primary neurons. (A) Fluorescence expression of Parkin and (B) its relative fluorescence intensity. Scale bars = 20 μm. Western blot analysis of (C) Parkin and (D) PINK1 expression. *, p < 0.05; **, p < 0.01; ***, p < 0.001 vs. siNC group. #, p < 0.05; ###, p < 0.001 vs. siR-NA-Nrf2-953 group. &&, p < 0.01; &&&, p < 0.001 vs. siNC + MA group. Tukey HSD post hoc comparison after significant ANOVA.
Ijms 27 06565 g008
Figure 9. Knockout of Nrf2 reduced MA-induced mitophagy. Western blot analysis of (A) Parkin and (B) PINK1 expression in prefrontal cortex. (C) Parkin and (D) PINK1 expression in hippocampus. *, p < 0.05; **, p < 0.01 vs. WT-control group. #, p < 0.05 vs. Nrf2-KO-control group. &, p < 0.05; &&, p < 0.01; &&&, p < 0.001 vs. WT-MA group. n = 3 per group. Tukey HSD post hoc comparison after significant ANOVA.
Ijms 27 06565 g009
Figure 10. Silencing Nrf2 aggravated MA-induced apoptosis in primary neurons. (A) Fluorescence expression of Cyt-c and (B) its relative fluorescence intensity. Scale bars = 20 μm. Western blot analysis of (C) Cyt-c, (D) Caspase 3, (E) Cleaved Caspa-se-3, (F) Bax, and (G) Bcl-2 expression, and (H) Bax/Bcl2 ratio. *, p < 0.05; **, p < 0.01; ***, p < 0.001 vs. siNC group. #, p < 0.05; ###, p < 0.001 vs. siRNA-Nrf2-953 group. &, p < 0.05; &&, p < 0.01; &&&, p < 0.001 vs. siNC + MA group. Tukey HSD or Tam-hane’s T2 post hoc comparison after significant ANOVA.
Ijms 27 06565 g010
Figure 11. Knockout of Nrf2 exacerbated MA-induced apoptosis. Western blot analysis of (A) Cyt-c, (B) Caspase 3, (C) Bax, and (D) Bcl-2 expression, and (E) Bax/Bcl-2 ratio in prefrontal cortex. (F) Cyt-c, (G) Caspase 3, (H) Bax, and (I) Bcl-2 expression, and (J) Bax/Bcl-2 ratio in hippocampus. *, p < 0.05; **, p < 0.01; ***, p < 0.001 vs. WT-control group. ##, p < 0.01; ###, p < 0.001 vs. Nrf2-KO-control group. &, p < 0.05; &&, p < 0.01; &&&, p < 0.001 vs. WT-MA group. n = 3 per group. Tukey HSD or Tamhane’s T2 post hoc comparison after significant ANOVA.
Ijms 27 06565 g011
Figure 12. Schematic depicting the regulatory role of Nrf2 in regulating MA-induced mitophagy and apoptosis in neurons.
Ijms 27 06565 g012
Disclaimer/Publisher’s Note: The statements, opinions and data contained in all publications are solely those of the individual author(s) and contributor(s) and not of MDPI and/or the editor(s). MDPI and/or the editor(s) disclaim responsibility for any injury to people or property resulting from any ideas, methods, instructions or products referred to in the content.