Article

Genetic Determinants of Severe Hypertriglyceridemia: Rare Variants in LPL, APOC2, APOA5, GPIHBP1, LMF1, APOE and Polygenic Risk


by
Anastasia V. Blokhina
1,*,†,
Alexey N. Meshkov
1,2,†,
Alexandra I. Ershova
1,
Marija Zaicenoka
1,
Viktoria I. Mikhailina
1,
Stepan A. Smetnev
1,
Anna A. Bukaeva
1,
Alena. S. Limonova
1,
Anna V. Kiseleva
1,
Evgeniia A. Sotnikova
1,
Anastasia A. Zharikova
1,3,
Elizaveta A. Novokhatskaya
1,
Elizaveta V. Baranovskaya
1,
Yuri V. Vyatkin
1,4,
Vasily E. Ramensky
1,3,5,
Maria S. Pokrovskaya
1 and
Oxana M. Drapkina
1
1
National Medical Research Center for Therapy and Preventive Medicine, Ministry of Healthcare of the Russian Federation, Petroverigsky per. 10, Bld. 3, 101000 Moscow, Russia
2
Department of General and Medical Genetics, Pirogov Russian National Research Medical University, 1, Ostrovityanova Str., 117997 Moscow, Russia
3
Faculty of Bioengineering and Bioinformatics, Lomonosov Moscow State University, 1-73, Leninskie Gory, 119991 Moscow, Russia
4
Department of Natural Sciences, Novosibirsk State University, 1, Pirogova Str., 630090 Novosibirsk, Russia
5
Institute for Artificial Intelligence, Lomonosov Moscow State University, 1-73, Leninskie Gory, 119991 Moscow, Russia
*
Author to whom correspondence should be addressed.
These authors contributed equally to this work.
Int. J. Mol. Sci. 2026, 27(12), 5443; https://doi.org/10.3390/ijms27125443
Submission received: 27 April 2026 / Revised: 5 June 2026 / Accepted: 11 June 2026 / Published: 16 June 2026
(This article belongs to the Special Issue The Role of Lipoprotein in Cardiovascular Disease)

Abstract

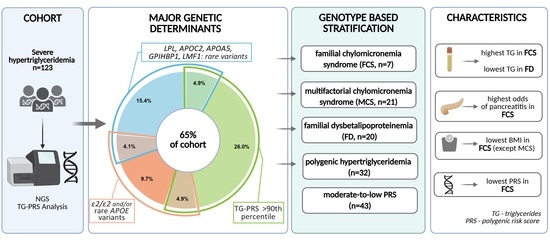
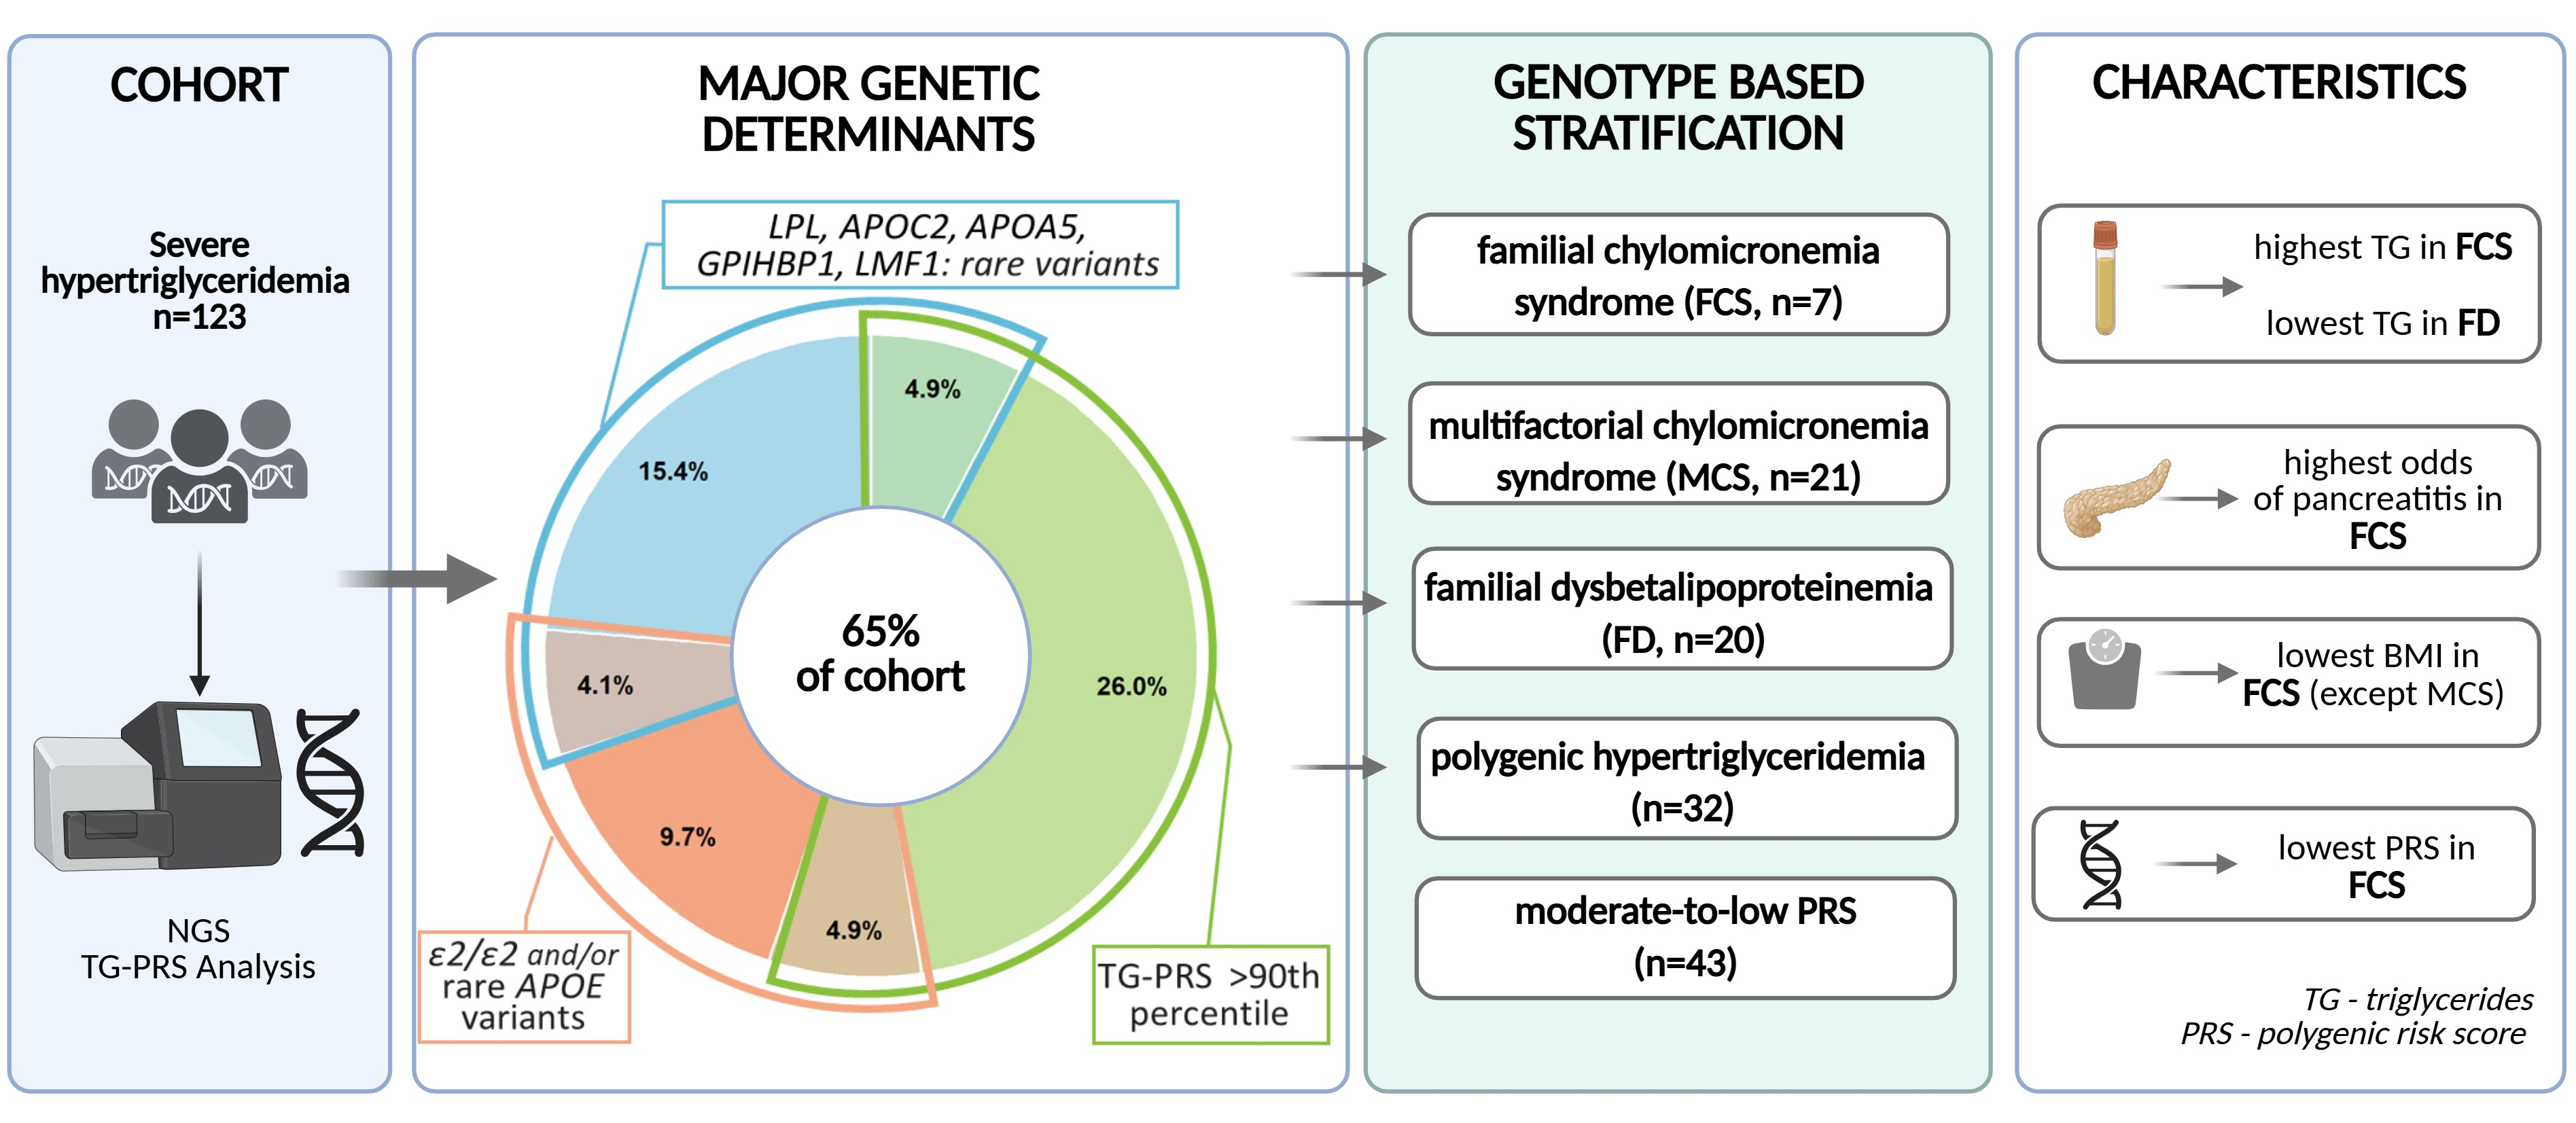
Severe hypertriglyceridemia (HTG) is genetically heterogeneous, but its genetic architecture remains incompletely characterized. We investigated the genetic determinants of severe HTG in 123 patients with triglyceride (TG) levels > 5.0 mmol/L and available NGS data. We analyzed rare variants in LPL, APOC2, APOA5, GPIHBP1, LMF1, and APOE; the ε2/ε2 APOE genotype; and TG-polygenic risk score (PRS) based on 40 variants. Major genetic determinants were identified in 65.0% of individuals, including rare variants in chylomicronemia genes (24.4%; 28 variants, including 10 novel, 53.6% in LPL), rare APOE variants or the ε2/ε2 genotype (18.7%, overlapping with chylomicronemia variants in 4.1%), and an extreme polygenic burden (35.8%; PRS > 90th percentile), including 26.0% with isolated polygenic HTG. The remaining 35.0% had moderate-to-low PRS. The cohort was categorized into familial chylomicronemia syndrome (FCS, n = 7), multifactorial chylomicronemia syndrome (MCS, n = 21), polygenic HTG (n = 32), familial dysbetalipoproteinemia (FD, n = 20), and moderate-to-low PRS (n = 43) groups based on genetic determinants. FCS had the lowest PRS percentile (median 26) and the most distinct clinical profile, with the highest TG levels (median 30.60 mmol/L) and 6–24-fold higher odds of pancreatitis compared with other groups (p < 0.05), alongside a lower body mass index (median 23.0 kg/m2) than all groups except MCS, whereas FD had the lowest TG levels (10.20 mmol/L, p < 0.05). These results further advance the understanding of the complex genetic architecture of severe HTG and demonstrate that broader genetic analysis, including APOE and TG-PRS, may increase the yield of genetic determinants in severe HTG.

Graphical Abstract

1. Introduction

Hypertriglyceridemia (HTG) is a common dyslipidemia, typically defined by a fasting triglyceride (TG) level > 1.7 mmol/L, with levels > 5.65 mmol/L classified as severe HTG and levels > 10.0 mmol/L as extreme HTG [1,2], which are usually associated with chylomicronemia [3]. HTG is increasingly viewed not as a discrete diagnostic threshold, but as a continuum of metabolic dysregulation affecting the production, lipolysis, and clearance of TG-rich lipoproteins, including chylomicrons, very-low-density lipoproteins, and cholesterol-enriched remnants [2,4].
Genetic and epidemiological evidence consistently links TG-rich lipoproteins and their remnants to an increased risk of atherosclerotic cardiovascular disease, independent of low-density lipoproteins [5,6,7]. Similarly, the risk of pancreatitis increases progressively with TG levels, becoming detectable at 2.0–10.0 mmol/L, rising markedly above 10.0 mmol/L, and reaching extreme levels at ≥20.0 mmol/L [8,9,10].
At the genetic level, HTG is heterogeneous. Familial chylomicronemia syndrome (FCS), a rare cause of HTG, is driven by biallelic (homozygous or compound heterozygous) or, less commonly, double-heterozygous pathogenic variants in key genes of the lipoprotein lipase pathway, including LPL, APOC2, APOA5, GPIHBP1, and LMF1. FCS is typically early-onset, characterized by extreme HTG in the absence of secondary factors, and associated with a high risk of recurrent pancreatitis [3,11,12]. In contrast, multifactorial chylomicronemia syndrome (MCS) is far more common and reflects partial impairment of lipoprotein lipase activity. It may result from a single heterozygous variant, the combined effect of a rare pathogenic variant and additional variants of uncertain significance (VUS), or the cumulative impact of multiple VUSs in chylomicronemia genes [3]. MCS typically manifests in adulthood and is often accompanied by secondary factors [3,11].
Severe HTG may also be driven by rare APOE variants [13,14,15] or the ε2/ε2 genotype [16,17,18], which are associated with familial dysbetalipoproteinemia (FD), also known as type III hyperlipoproteinemia. FD is characterized by the accumulation of highly atherogenic, cholesterol-enriched remnants [19,20,21] and is one of the most common inherited dyslipidemias [22,23,24].
However, most cases of severe HTG in adults are likely polygenic, reflecting the cumulative effect of multiple TG-raising variants along with non-genetic factors. Polygenic HTG may also coexist with other genetic forms of HTG [25,26,27,28,29,30].
Most previous studies of severe HTG have focused on canonical chylomicronemia genes, with limited evaluation of polygenic risk [25,26,27,31,32,33,34,35]. Moreover, a comprehensive genetic characterization of severe HTG has not been performed in Eastern European cohorts. This study aimed to investigate the genetic determinants of severe HTG by jointly analyzing variants in five canonical chylomicronemia genes, APOE (including the ε2/ε2 genotype), as well as the TG-polygenic risk score (PRS). We further compared clinical characteristics and PRS percentiles across genetically defined groups.

2. Results

2.1. Characteristics of Study Subjects

A total of 123 index patients with TG levels > 5.0 mmol/L and available genetic data were included in the study (Section 4.1). Clinical and demographic characteristics are presented in Table 1.
The median age of the participants was 48 years (41; 54), and 59.3% were men. Most patients (72.4%) had extremely elevated TG levels (>10.0 mmol/L).
The cohort demonstrated a high burden of cardiometabolic disease. The majority of patients (86.0%) had a body mass index (BMI) > 24.9 kg/m2, and 42.1% were obese. Type 2 diabetes was present in 33.3% of the participants, while impaired fasting glucose or impaired glucose tolerance was observed in an additional 4.9%. The prevalence of metabolic syndrome components was 35.0%.
A history of pancreatitis was reported in 25.9% of patients. Coronary artery disease (CAD) was present in approximately one quarter of patients with severe HTG, and among these patients, 65.5% had early-onset CAD.

2.2. Rare Variants in Chylomicronemia Genes and APOE and the ε2/ε2 Genotype

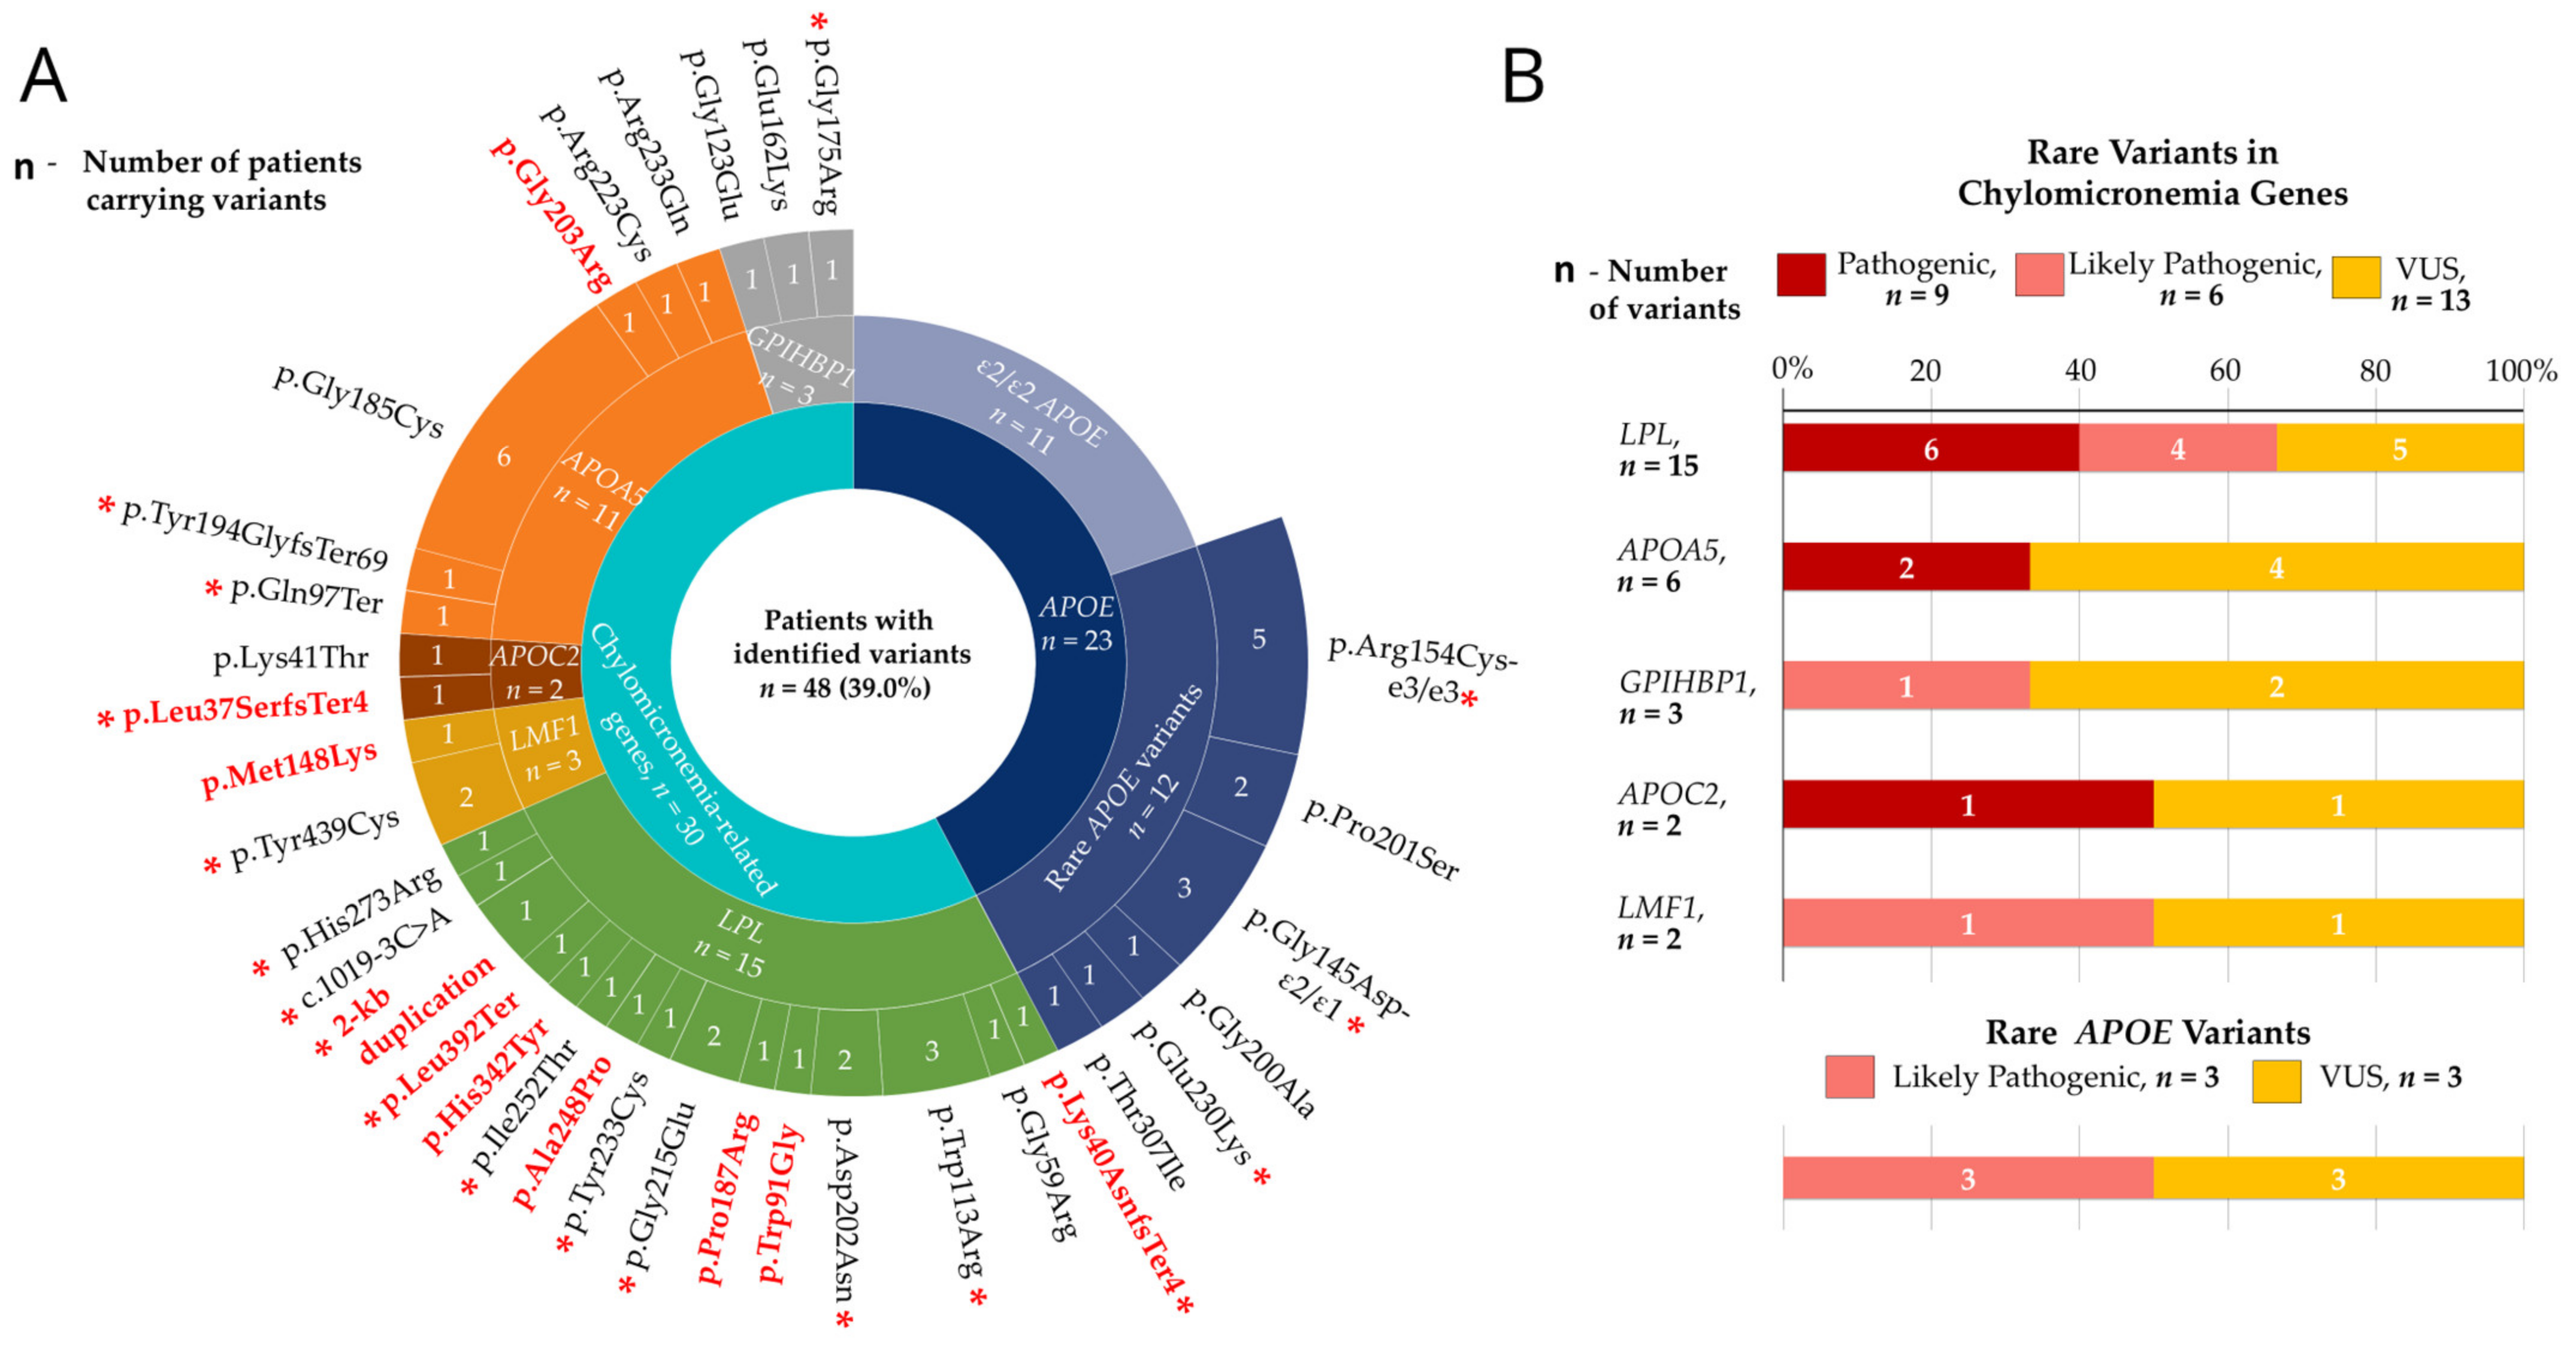
Genetic data from 123 patients were analyzed for rare variants in five canonical chylomicronemia genes (LPL, APOC2, APOA5, GPIHBP1, and LMF1) and APOE. The ε2/ε2 APOE genotype, a major genetic determinant of FD, was also included. Overall, rare variants in these genes or the ε2/ε2 genotype were identified in 39.0% of patients (Figure 1A, Table A1 and Table A2).

2.2.1. Rare Variants in Chylomicronemia Genes

Rare variants in chylomicronemia genes were identified in 30 patients (24.4%). The highest number of patients carried variants in LPL (12.2%), followed by APOA5 (8.9%), GPIHBP1 (2.4%), LMF1 (2.4%), and APOC2 (1.6%) (Figure 1A).
A total of 28 rare variants were identified across five genes. More than half were located in LPL (53.6%), followed by APOA5 (21.4%), GPIHBP1 (10.7%), and 7.1% each in APOC2 and LMF1. Missense variants predominated (75.0%), whereas 57.1% of loss-of-function variants were found in LPL. Most variants (82.1%) were identified in a single index patient, while five were observed in two or more patients.
Of all identified variants, 15 (53.6%) were classified as pathogenic or likely pathogenic; of these, 66.7% were located in LPL. Moreover, we identified 10 previously unreported variants, including six missense VUSs, three pathogenic frameshift variants (p.Lys40AsnfsTer4 and p.Leu392Ter in LPL, and p.Leu37SerfsTer4 in APOC2), and one large-scale pathogenic duplication in LPL (Figure 1, Table A1).
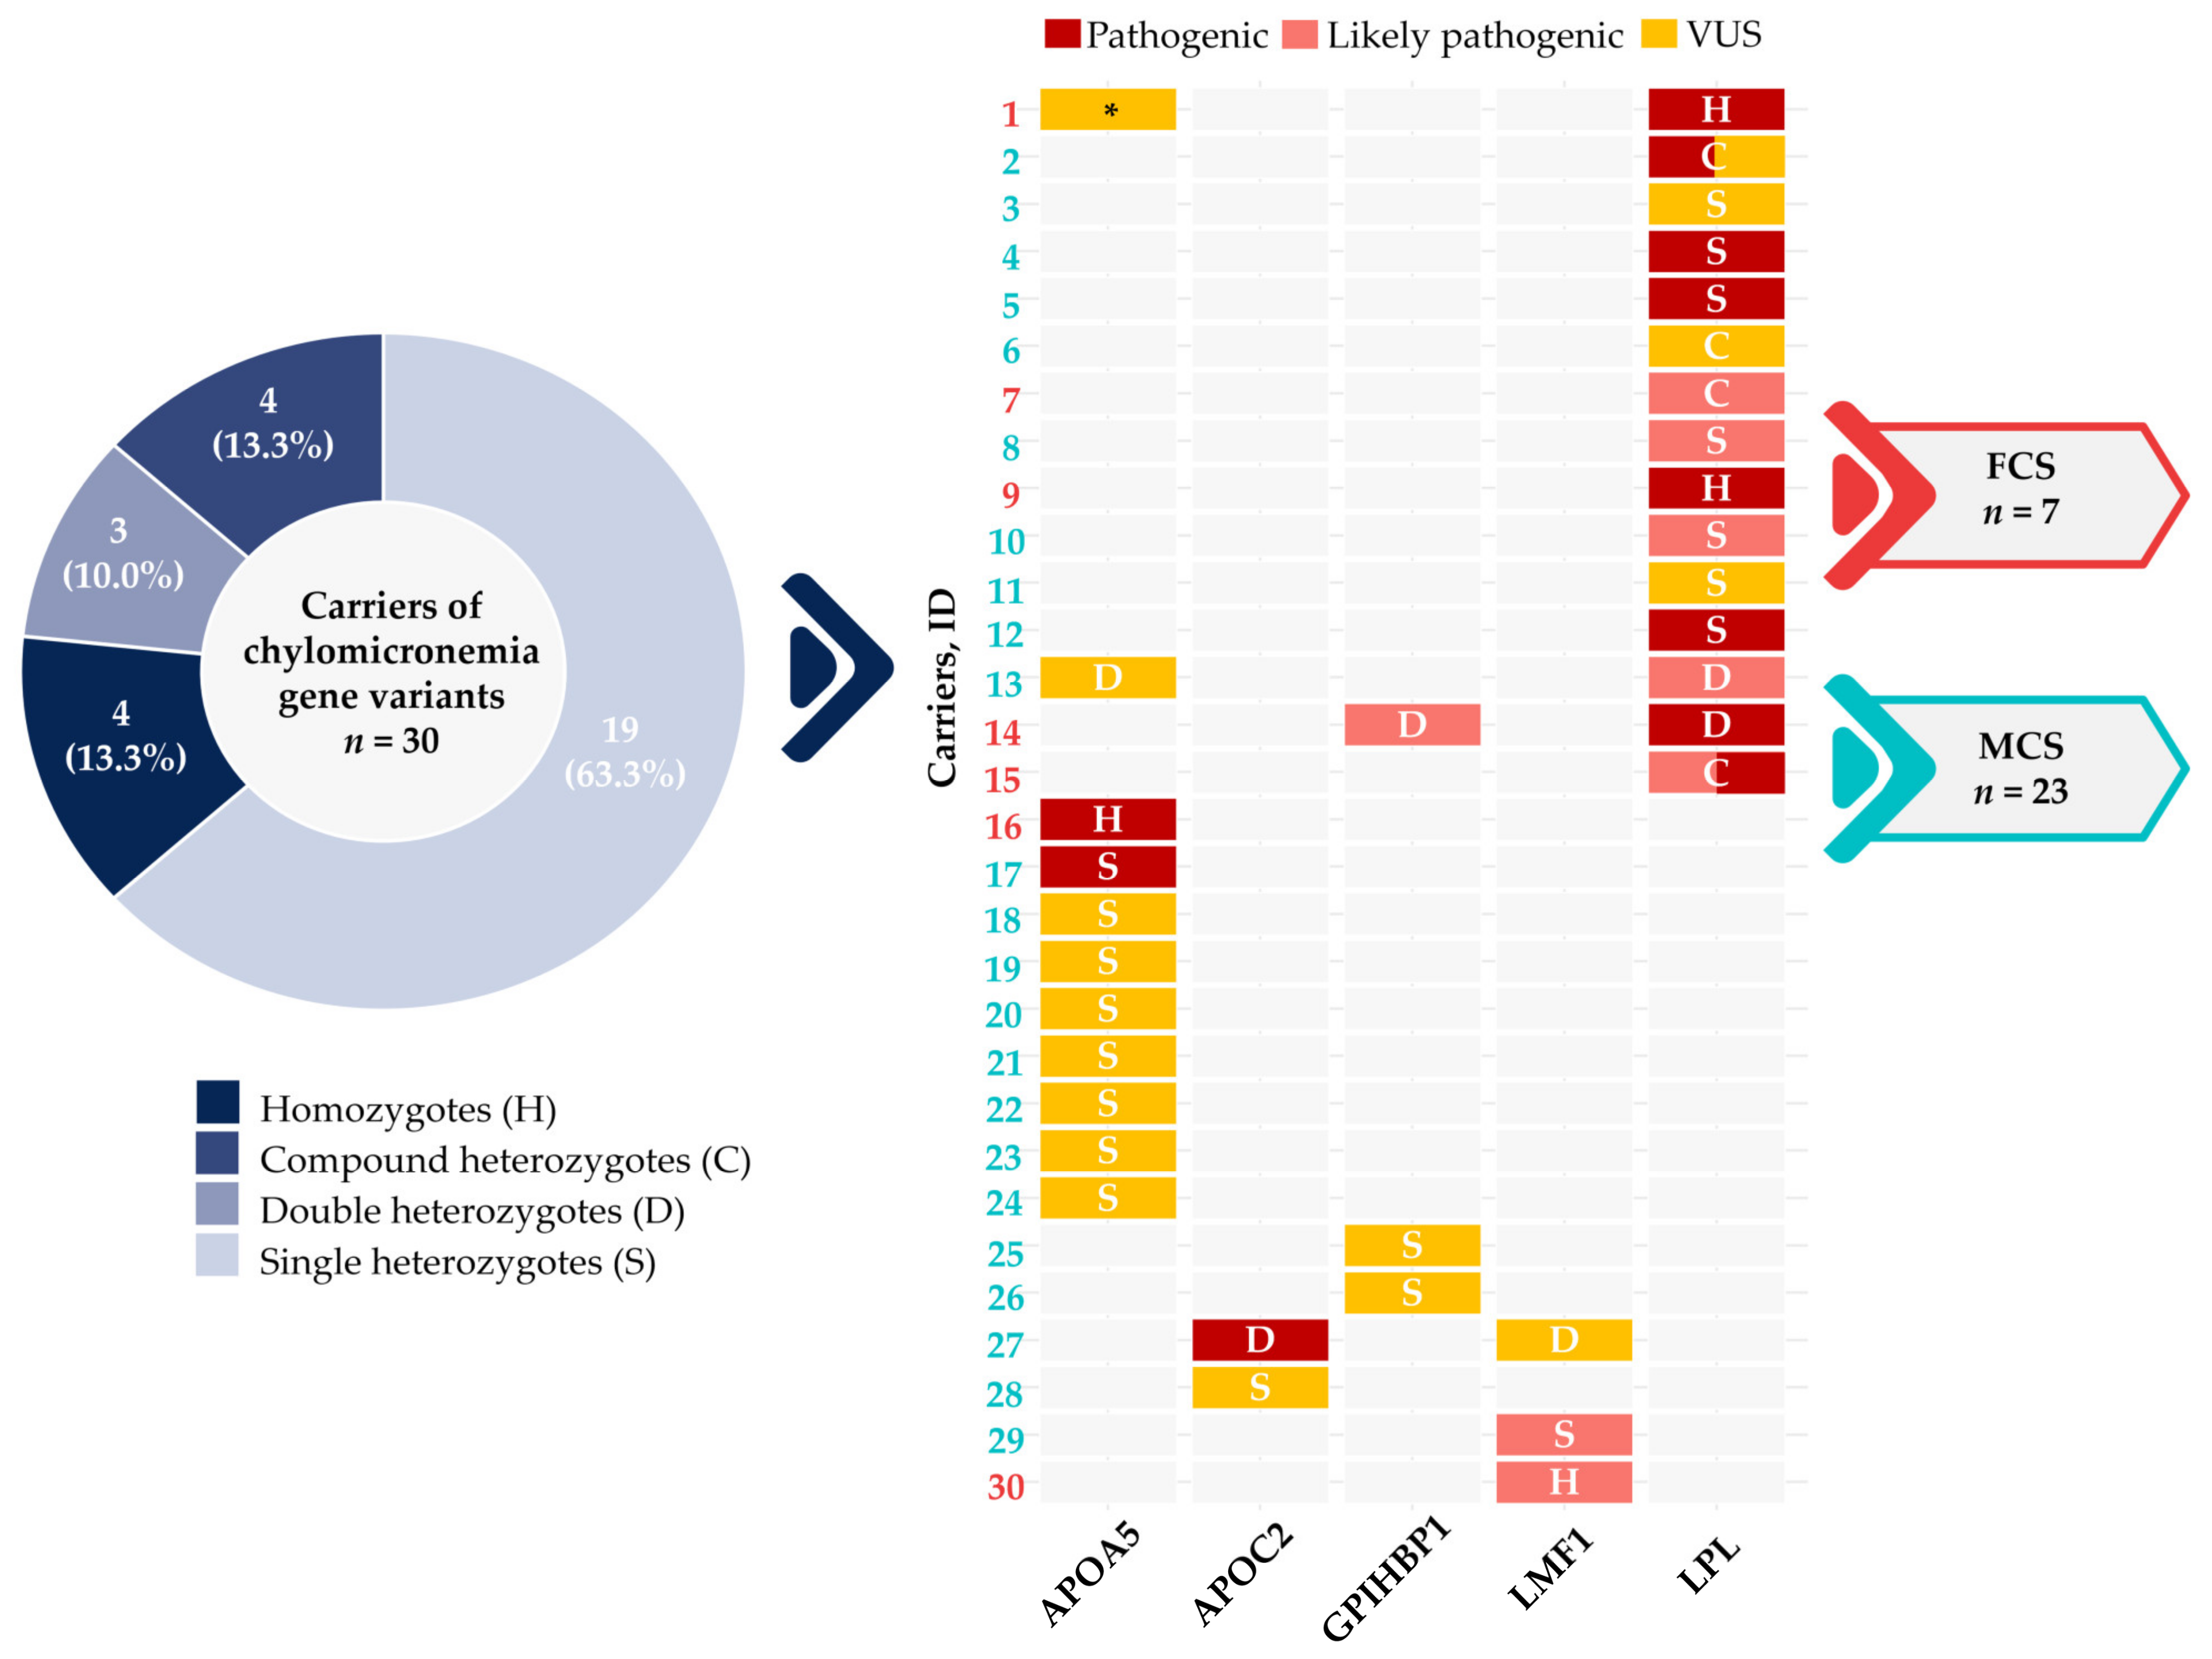
Among variant carriers, 26.6% had biallelic variants, 10.0% were double heterozygotes, and 63.3% were single heterozygotes (Figure 2).

2.2.2. Genotype-Based Stratification of Variant-Positive FCS and MCS

Among the study participants, seven (5.7%) met the genetic criteria for FCS, whereas variant-positive MCS was identified in 23 of 123 patients (18.7%).
Of all FCS cases, six (85.7%) were biallelic carriers of pathogenic or likely pathogenic variants, including four homozygotes (57.1%) and two compound heterozygotes (28.6%). Biallelic variants were most frequently identified in LPL (four cases, 66.7%), followed by APOA5 (one case, 16.7%) and LMF1 (one case, 16.7%). One patient (14.3%) was a double heterozygote, carrying a pathogenic frameshift variant in LPL and a likely pathogenic missense variant in GPIHBP1. Overall, LPL was the most frequently involved gene, with variants identified in five FCS cases (71.4%) (Figure 2). Loss-of-function and missense variants were equally frequent in FCS (five variants each). Loss-of-function variants included frameshift variants (p.Lys40AsnfsTer4 and p.Leu392Ter in LPL), a nonsense variant (p.Gln97Ter in APOA5), a splice-site variant (c.1019-3C > A in LPL), and a large-scale duplication in LPL, and were predominantly identified in LPL (80.0%) (Supplementary Table S1).
Among variant-positive MCS patients, seven (30.4%) carried a single pathogenic or likely pathogenic variant in one of the canonical chylomicronemia genes in the heterozygous state. Three patients (13.0%) carried a pathogenic or likely pathogenic variant together with an additional VUS, including one case of compound heterozygosity and two cases of double heterozygosity. Similar to FCS, most patients carried pathogenic or likely pathogenic variants in LPL (70.0%). In addition, 13 patients (56.5%) carried only VUSs in either a heterozygous (12 cases, 52.2%) or compound heterozygous (one case, 4.3%) state (Figure 2). Overall, 20 variants were observed in variant-positive MCS cases, with missense variants predominating (18 variants, 90.0%). Loss-of-function variants included two frameshift variants (p.Tyr194GlyfsTer69 in APOA5 and p.Leu37SerfsTer4 in APOC2). The majority of identified variants were VUSs (12 variants, 60.0%) (Supplementary Table S1).

2.2.3. APOE Variants and the ε2/ε2 Genotype

Rare APOE variants or the ε2/ε2 genotype were identified in 23 patients with severe HTG (18.7%). Eleven patients (8.9%) carried the ε2/ε2 genotype associated with the autosomal-recessive form of FD, while rare APOE variants linked to autosomal-dominant FD were detected in 12 patients (9.8%). All rare APOE variants were missense, and the most frequent was the likely pathogenic p.Arg154Cys variant (41.7% of cases). Among carriers of rare APOE variants, the ε2/ε1 genotype was observed in 25.0% of cases (Figure 1, Table A2).

2.3. Accumulation of Common TG-Raising Variants

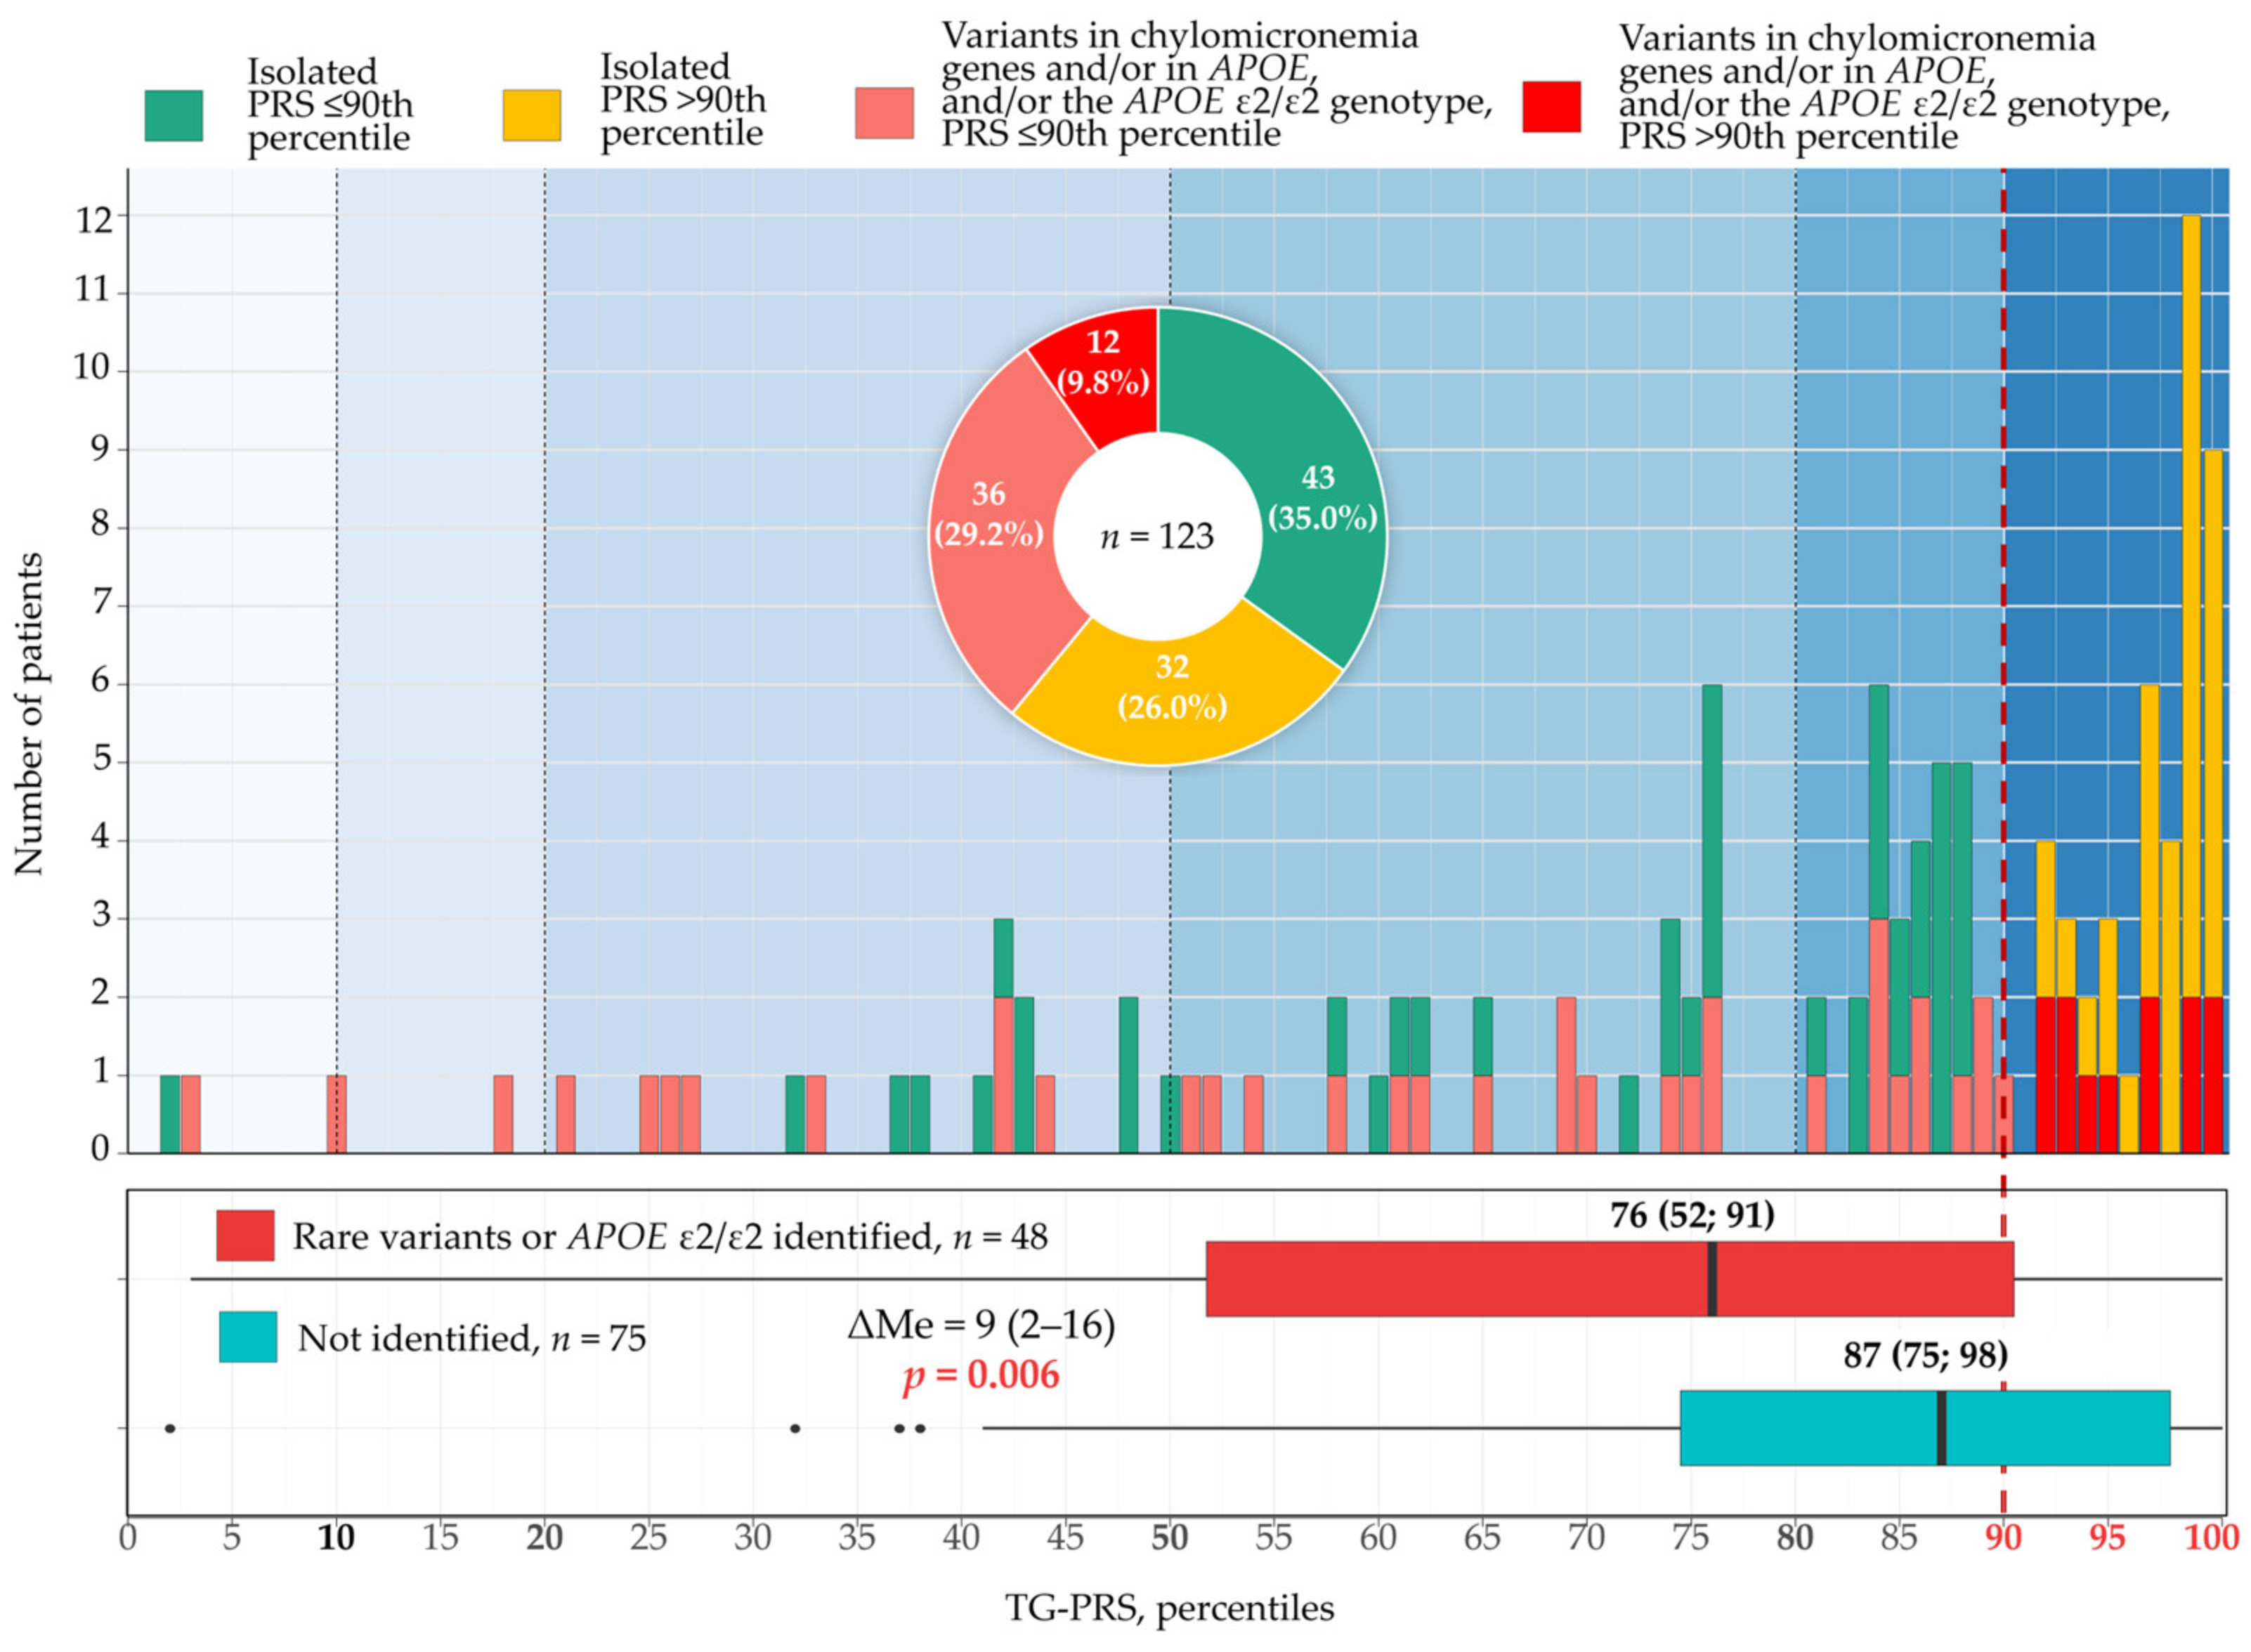
PRS was calculated for all 123 participants to assess the contribution of common TG-raising variants to severe HTG. An extreme polygenic burden was defined as a PRS > 90th percentile based on the score distribution in the population-based sample (Section 4.4).
Overall, 44 patients (35.8%) had an extreme polygenic contribution to TG levels. Among carriers of rare variants in chylomicronemia genes and/or in APOE, including the ε2/ε2 genotype, 12 of 48 individuals (25.0%), corresponding to 9.8% of all HTG cases, also had PRS > 90th percentile, indicating a combined genetic etiology of severe HTG and a potentially more severe phenotype. In contrast, among those without these genetic determinants, 32 of 75 (42.7%), representing 26.0% of all HTG cases, had PRS > 90th percentile, suggesting an isolated extreme polygenic contribution (Figure 3).
Among the remaining 43 cases (35.0%) without rare variants, the ε2/ε2 genotype, or an extreme PRS, 33 individuals had PRS in the 50–90th percentile range, and 10 had PRS < 50th percentile (Figure 3).
In the study cohort, the median PRS percentile was 85 (62; 97). PRS percentiles were higher in patients without rare variants or the APOE ε2/ε2 genotype than in those with these genetic determinants: 87 (75; 98) vs. 76 (52; 91), respectively (ΔMe 9, 95% confidence interval (CI): 2–16; p = 0.006) (Figure 3).

2.4. Overlap Between Chylomicronemia Gene Variants, APOE, and an Extreme PRS

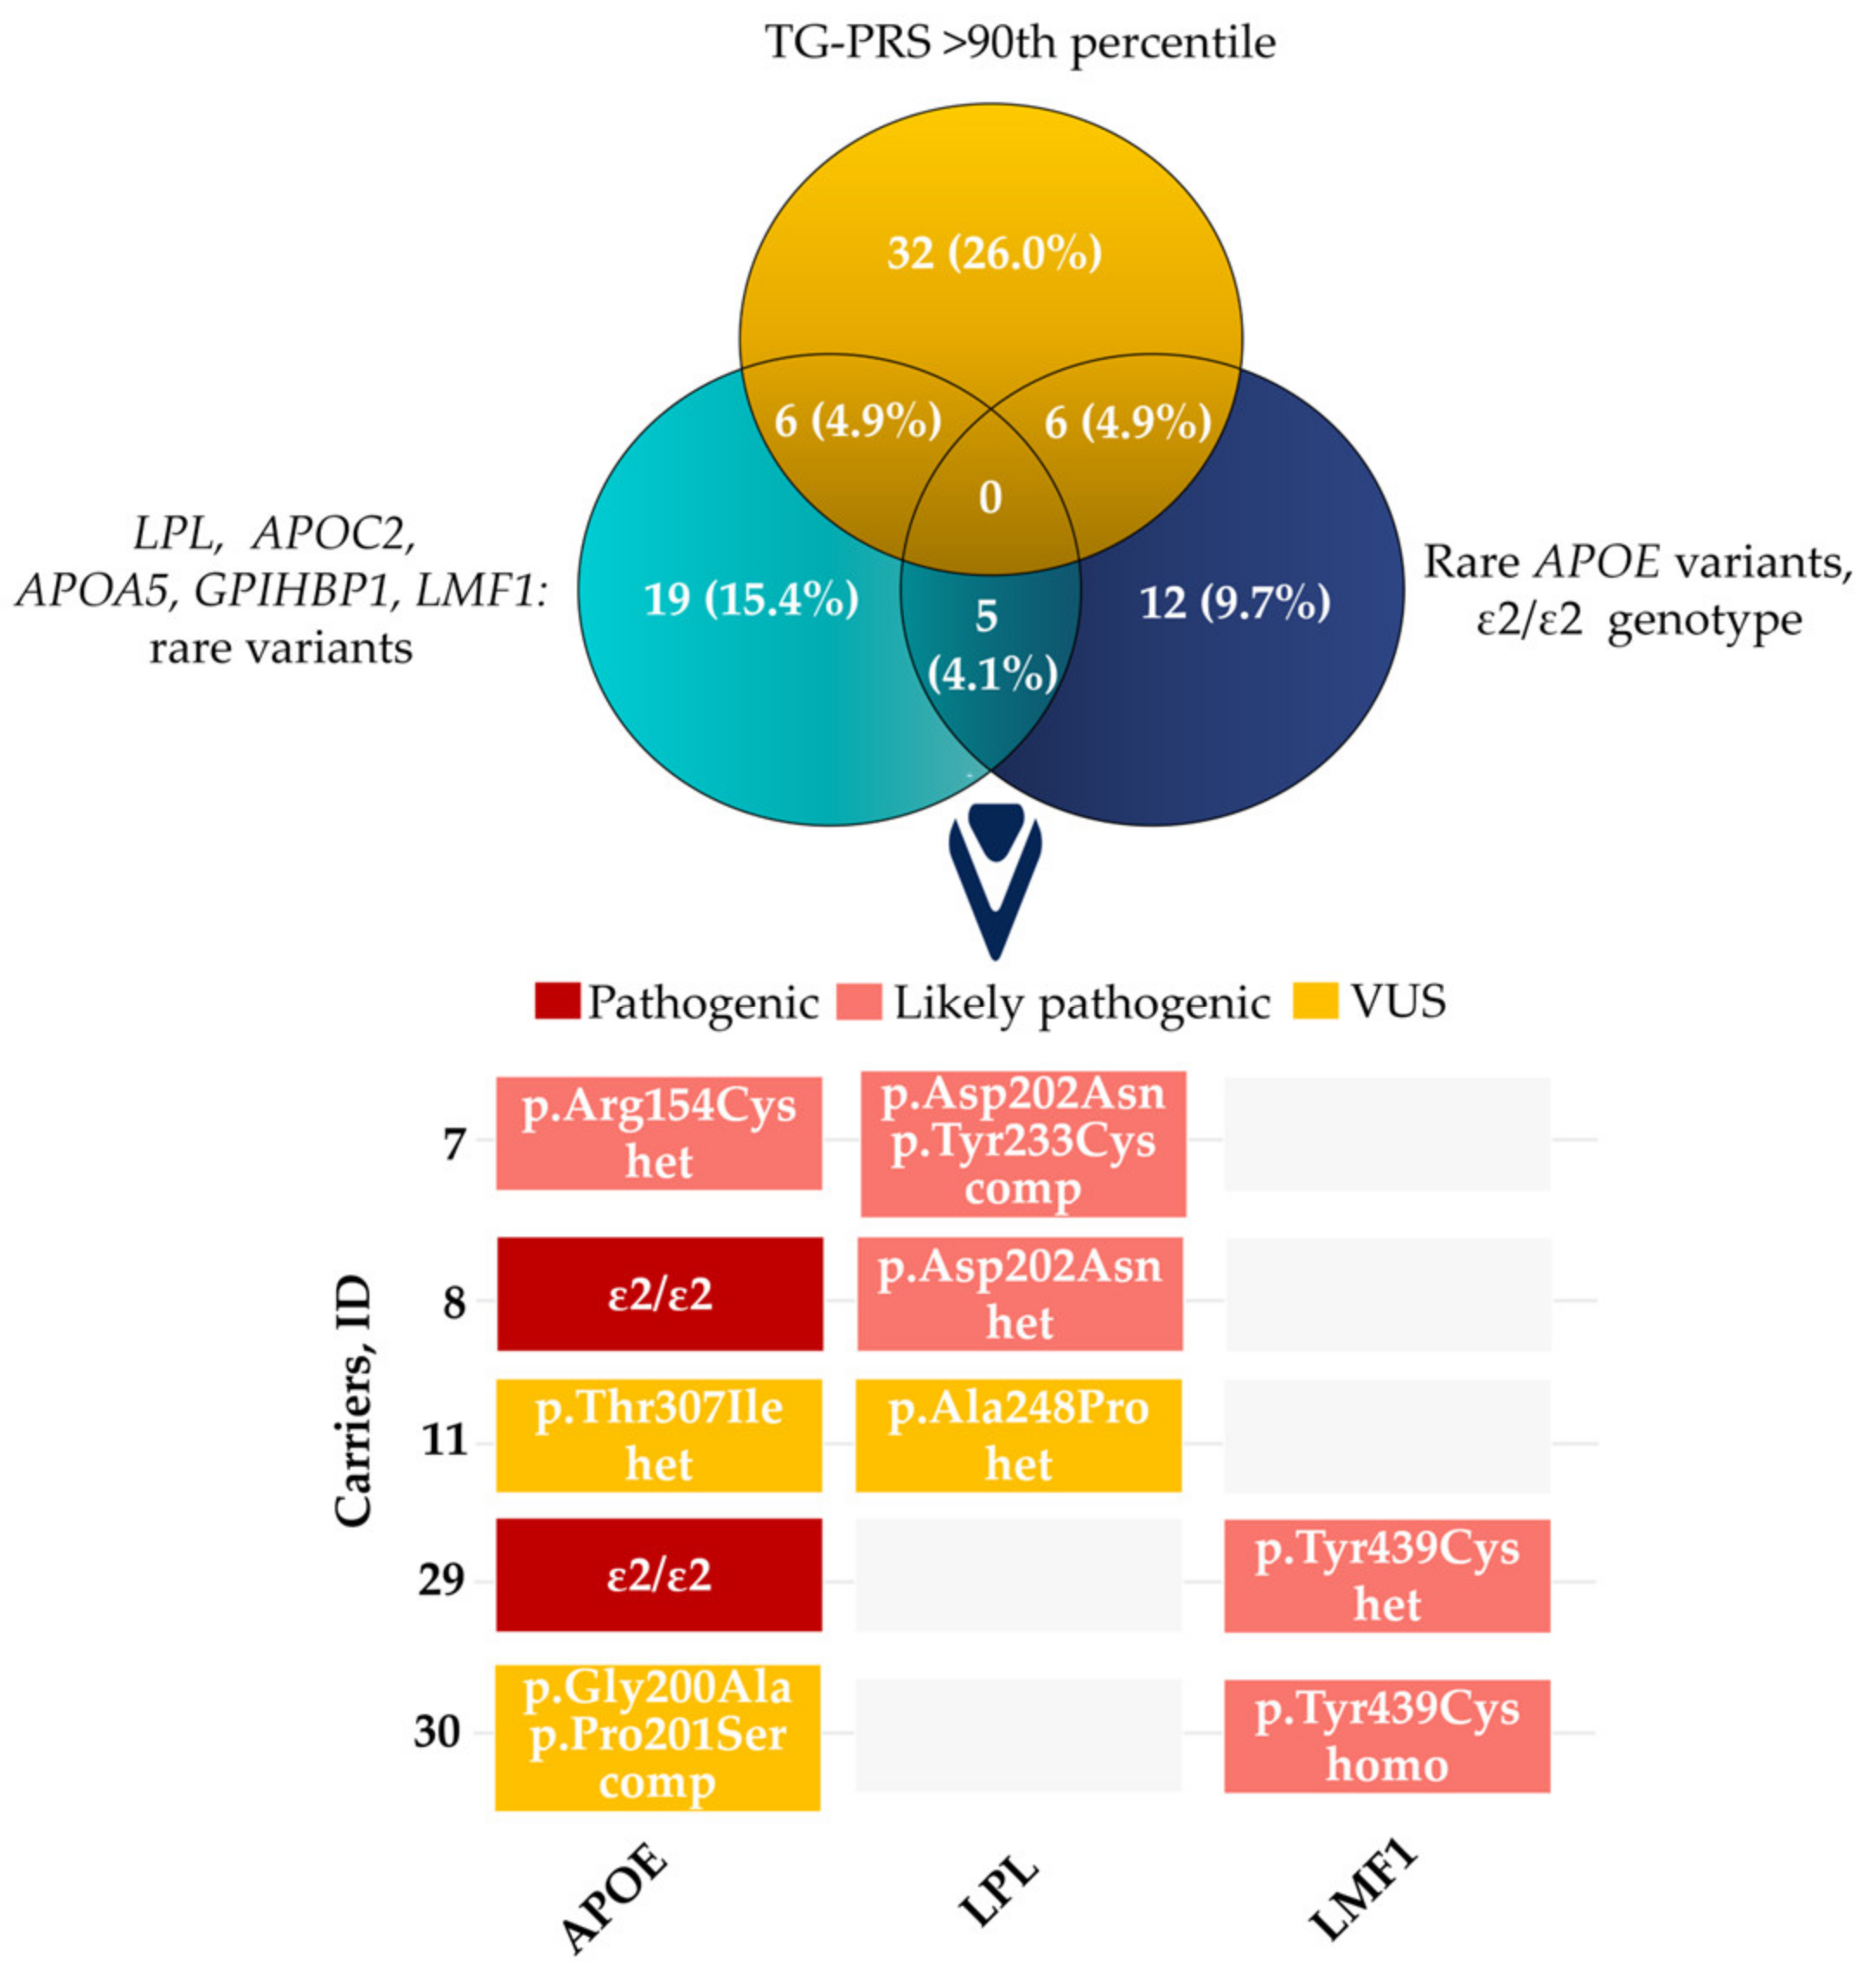
Overall, major genetic determinants of severe HTG were verified in 80 individuals (65.0%). Overlap between rare variants in chylomicronemia genes and APOE was identified in five patients (4.1%). One patient was compound heterozygous for likely pathogenic variants in LPL and also carried a likely pathogenic APOE variant associated with FD. Another was homozygous for a likely pathogenic LMF1 variant and additionally carried two VUSs in APOE. A third patient carried VUSs in both LPL and APOE, and the remaining two patients had the ε2/ε2 genotype and also carried likely pathogenic variants in LPL or LMF1, respectively (Figure 4). The median PRS percentile was 54 (42; 69) and none of these patients had an extreme PRS.

2.5. Comparison of Clinical Characteristics and PRS Percentile Across Genetically Defined Groups

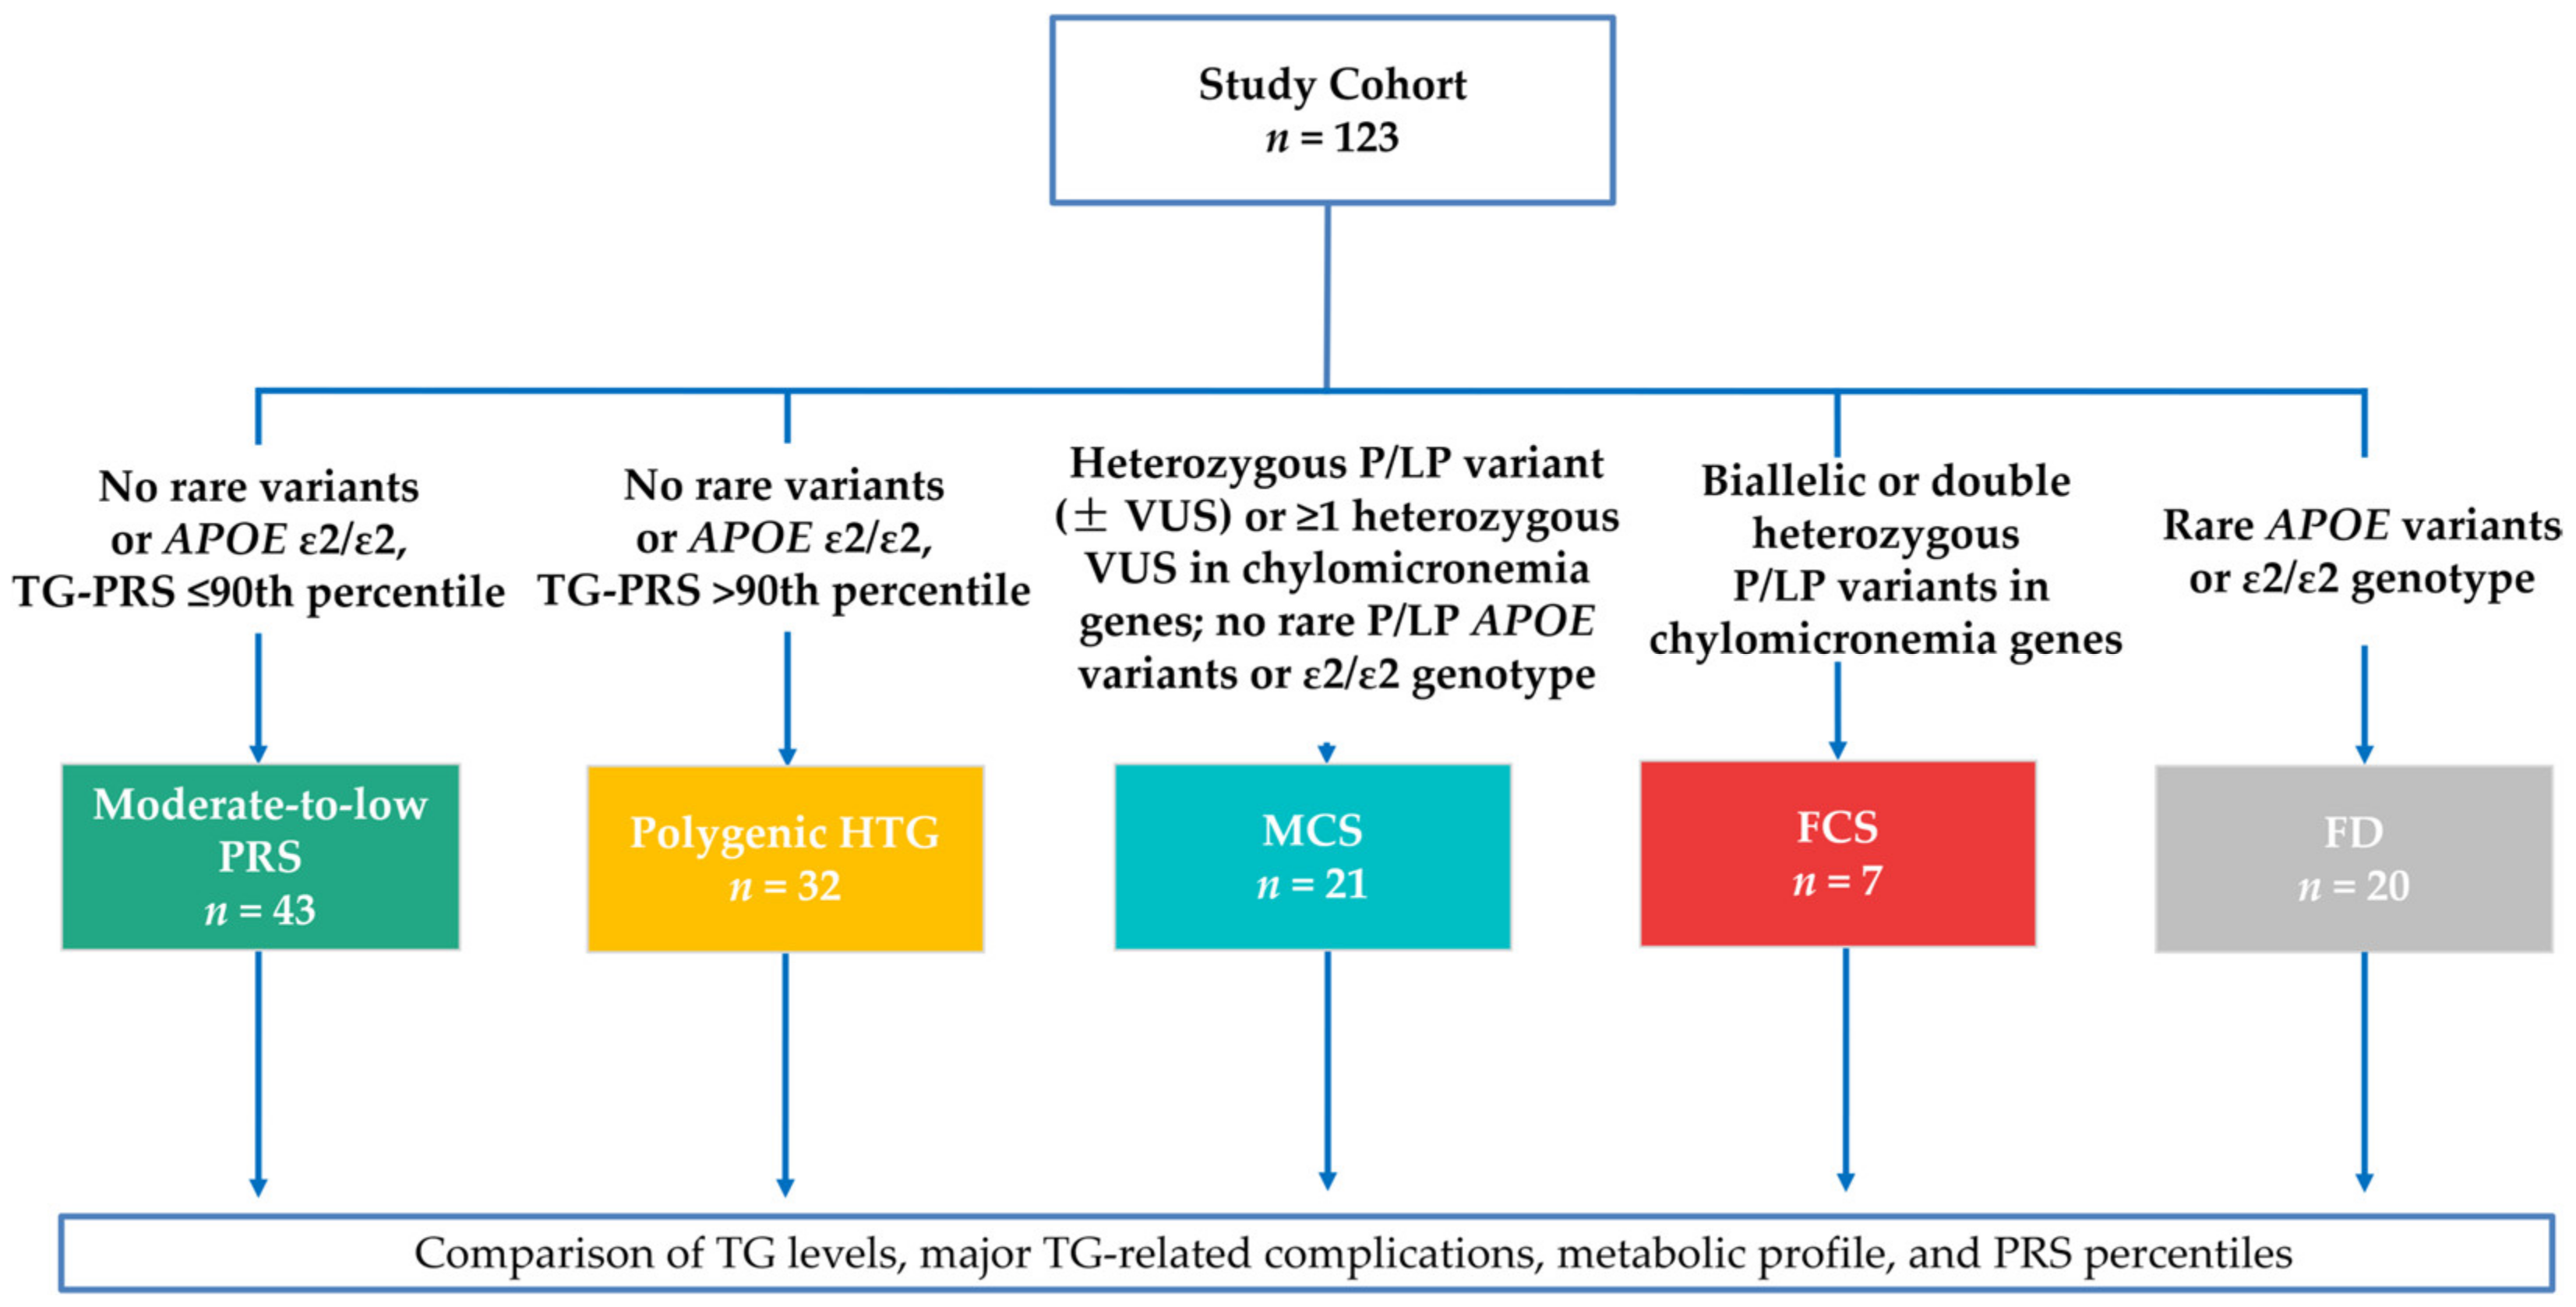
We further categorized the cohort into five groups according to genetic findings (Figure 5). In cases with overlapping APOE-related findings and rare variants in chylomicronemia genes (Figure 4), group assignment was based on the genetic determinant with the strongest predicted causal effect (patients 7 and 30 were assigned to the FCS group, patients 8 and 29 to the FD group, and patient 11 to the MCS group).
We then assessed differences in TG levels, major TG-related complications, metabolic profile, and PRS percentiles across genetically defined groups (moderate-to-low PRS, polygenic HTG, MCS, FCS, and FD).
The clinical and demographic characteristics of the five genetic groups are presented in Table 2. Supplementary Table S1 provides the clinical and genetic characteristics for each individual with the identified rare genetic determinants of severe HTG.
After adjustment for sex and age, BMI was lower in FCS than in the FD, polygenic HTG, and moderate-to-low PRS groups, with mean differences of −5.6 kg/m2 (95% CI: −10.0 to −1.3; p = 0.012), −5.7 kg/m2 (95% CI: −9.9 to −1.5; p = 0.008), and −6.8 kg/m2 (95% CI: −11.1 to −2.6; p = 0.002), respectively. BMI was higher in the moderate-to-low PRS group than in MCS by 3.0 kg/m2 (95% CI: 0.1−5.9; p = 0.040). No significant differences were observed across the remaining groups (Supplementary Table S2).
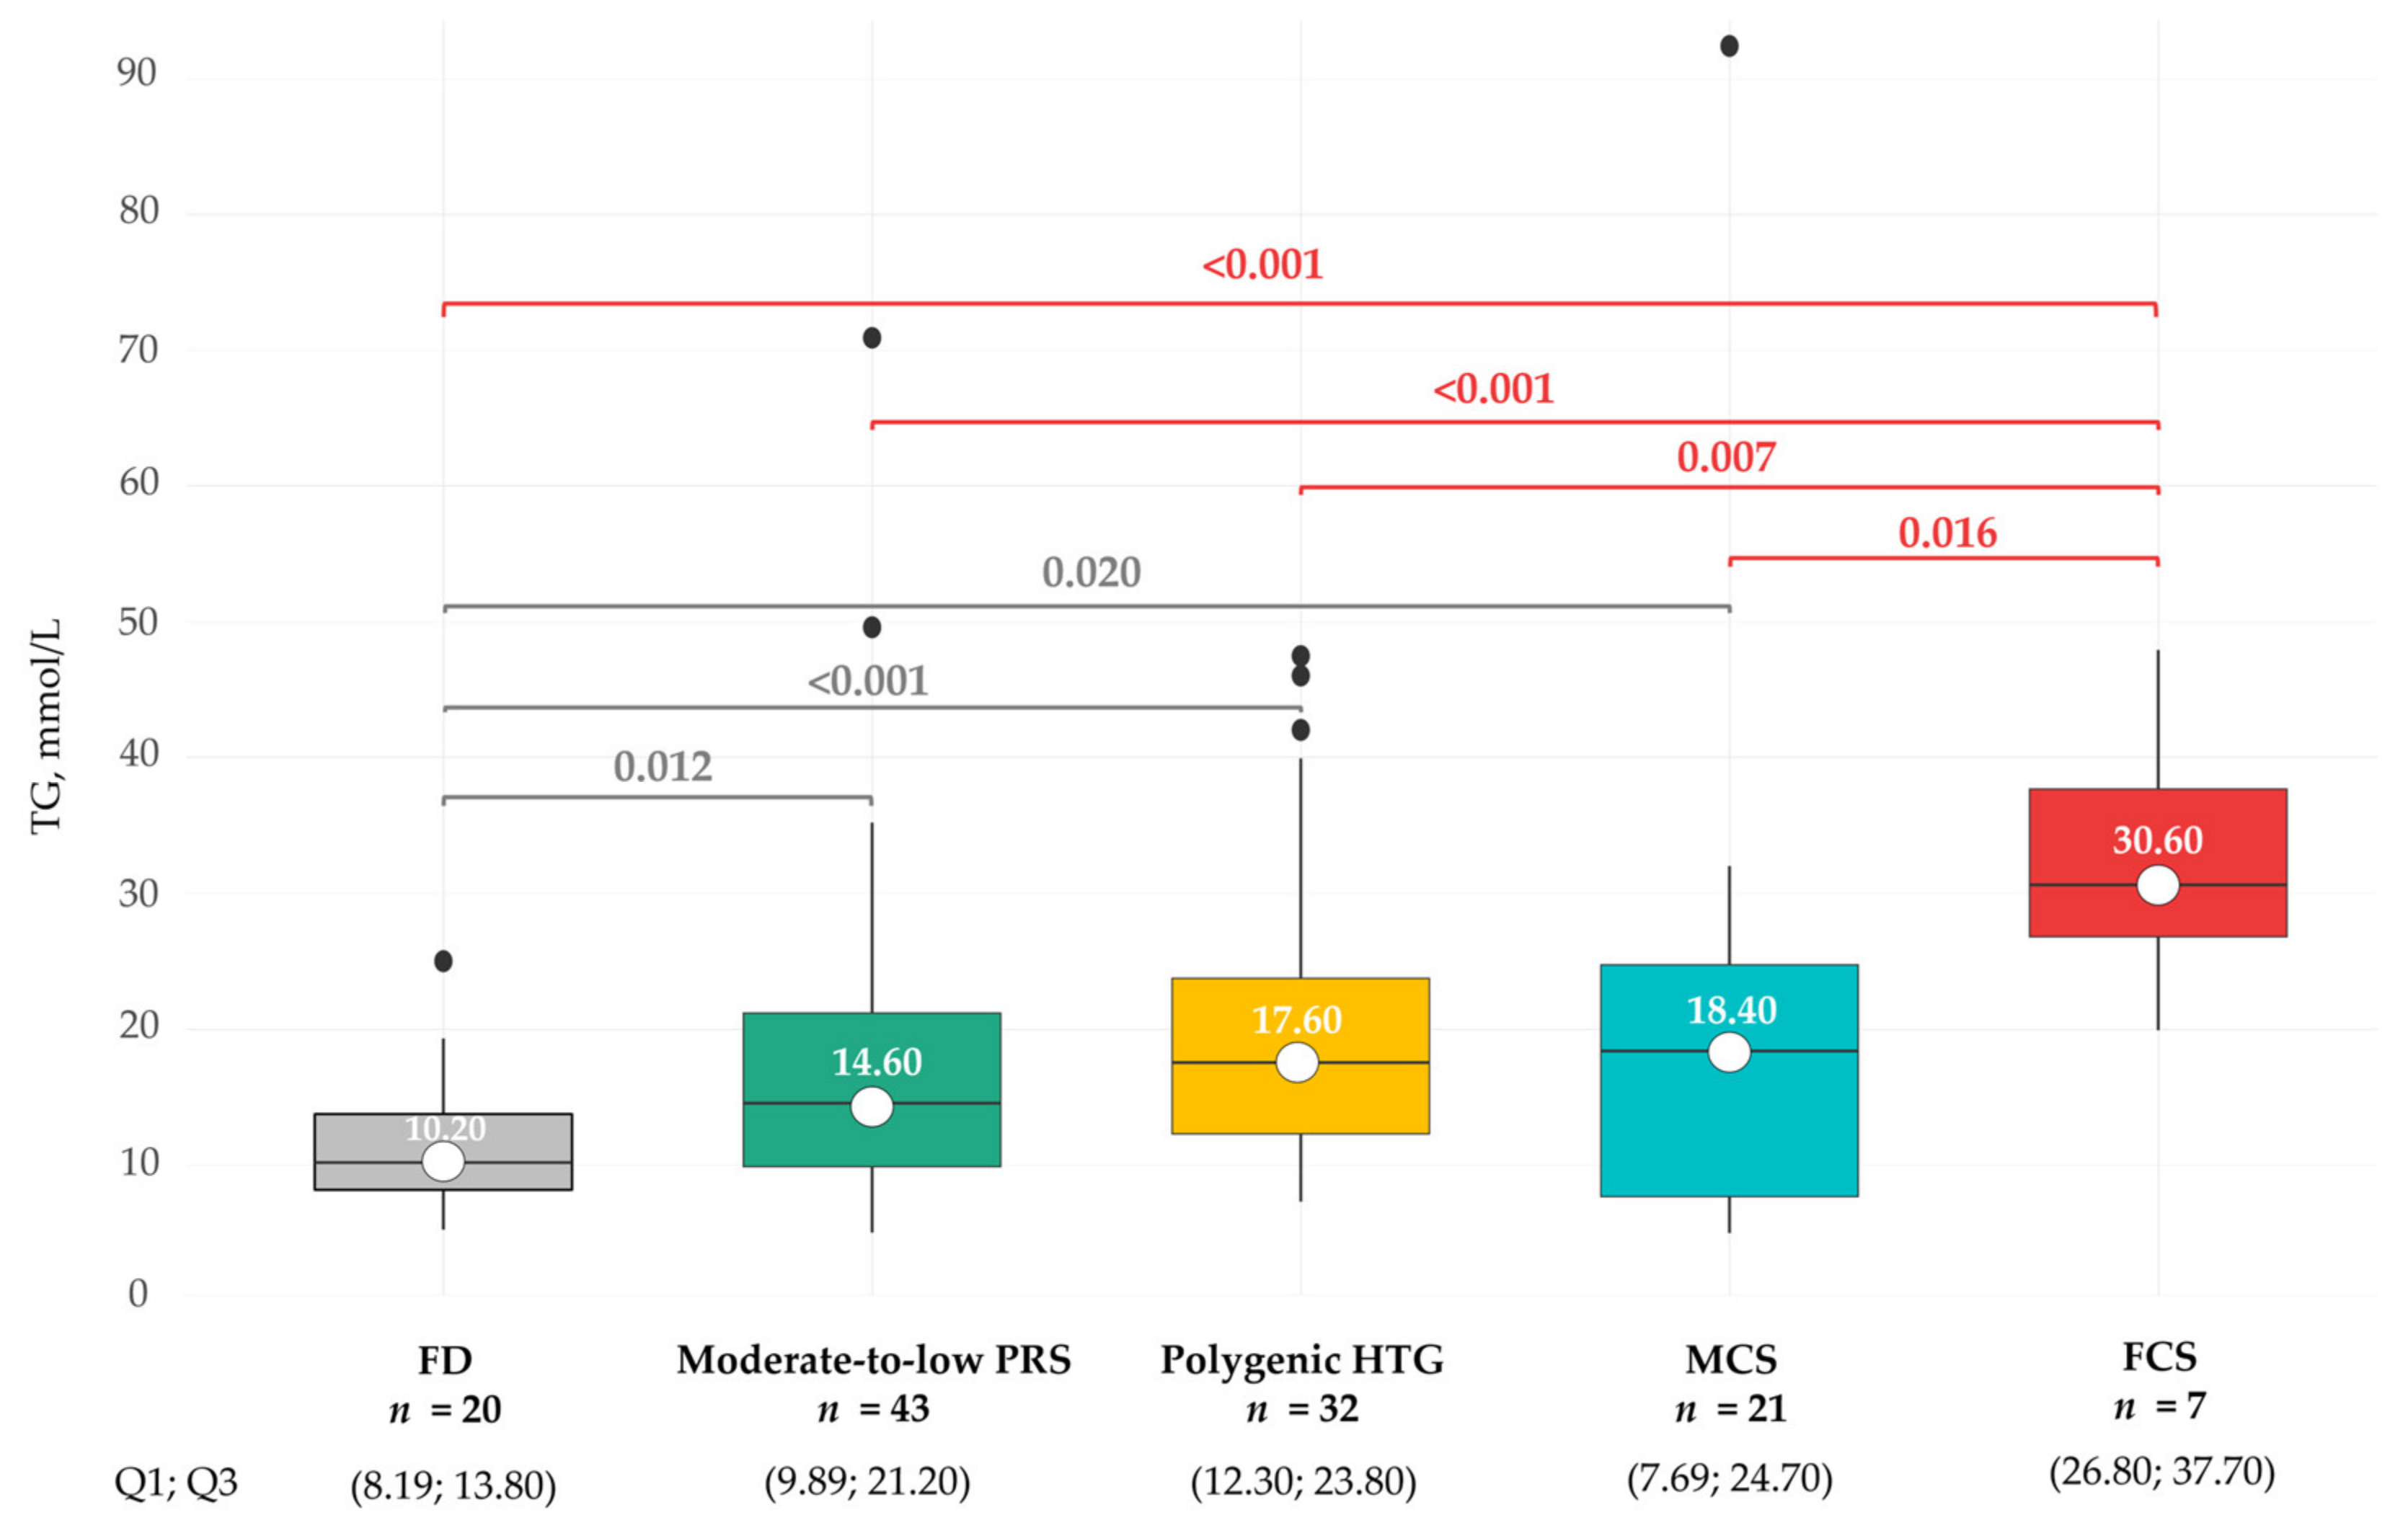
After adjustment for sex, age, and lipid-lowering therapy (LLT), TG levels were significantly higher in FCS than in all other genetic groups. In contrast, TG levels were significantly lower in FD than in the other groups. TG levels were comparable across polygenic HTG, MCS, and moderate-to-low PRS groups (Figure 6, Supplementary Table S2).
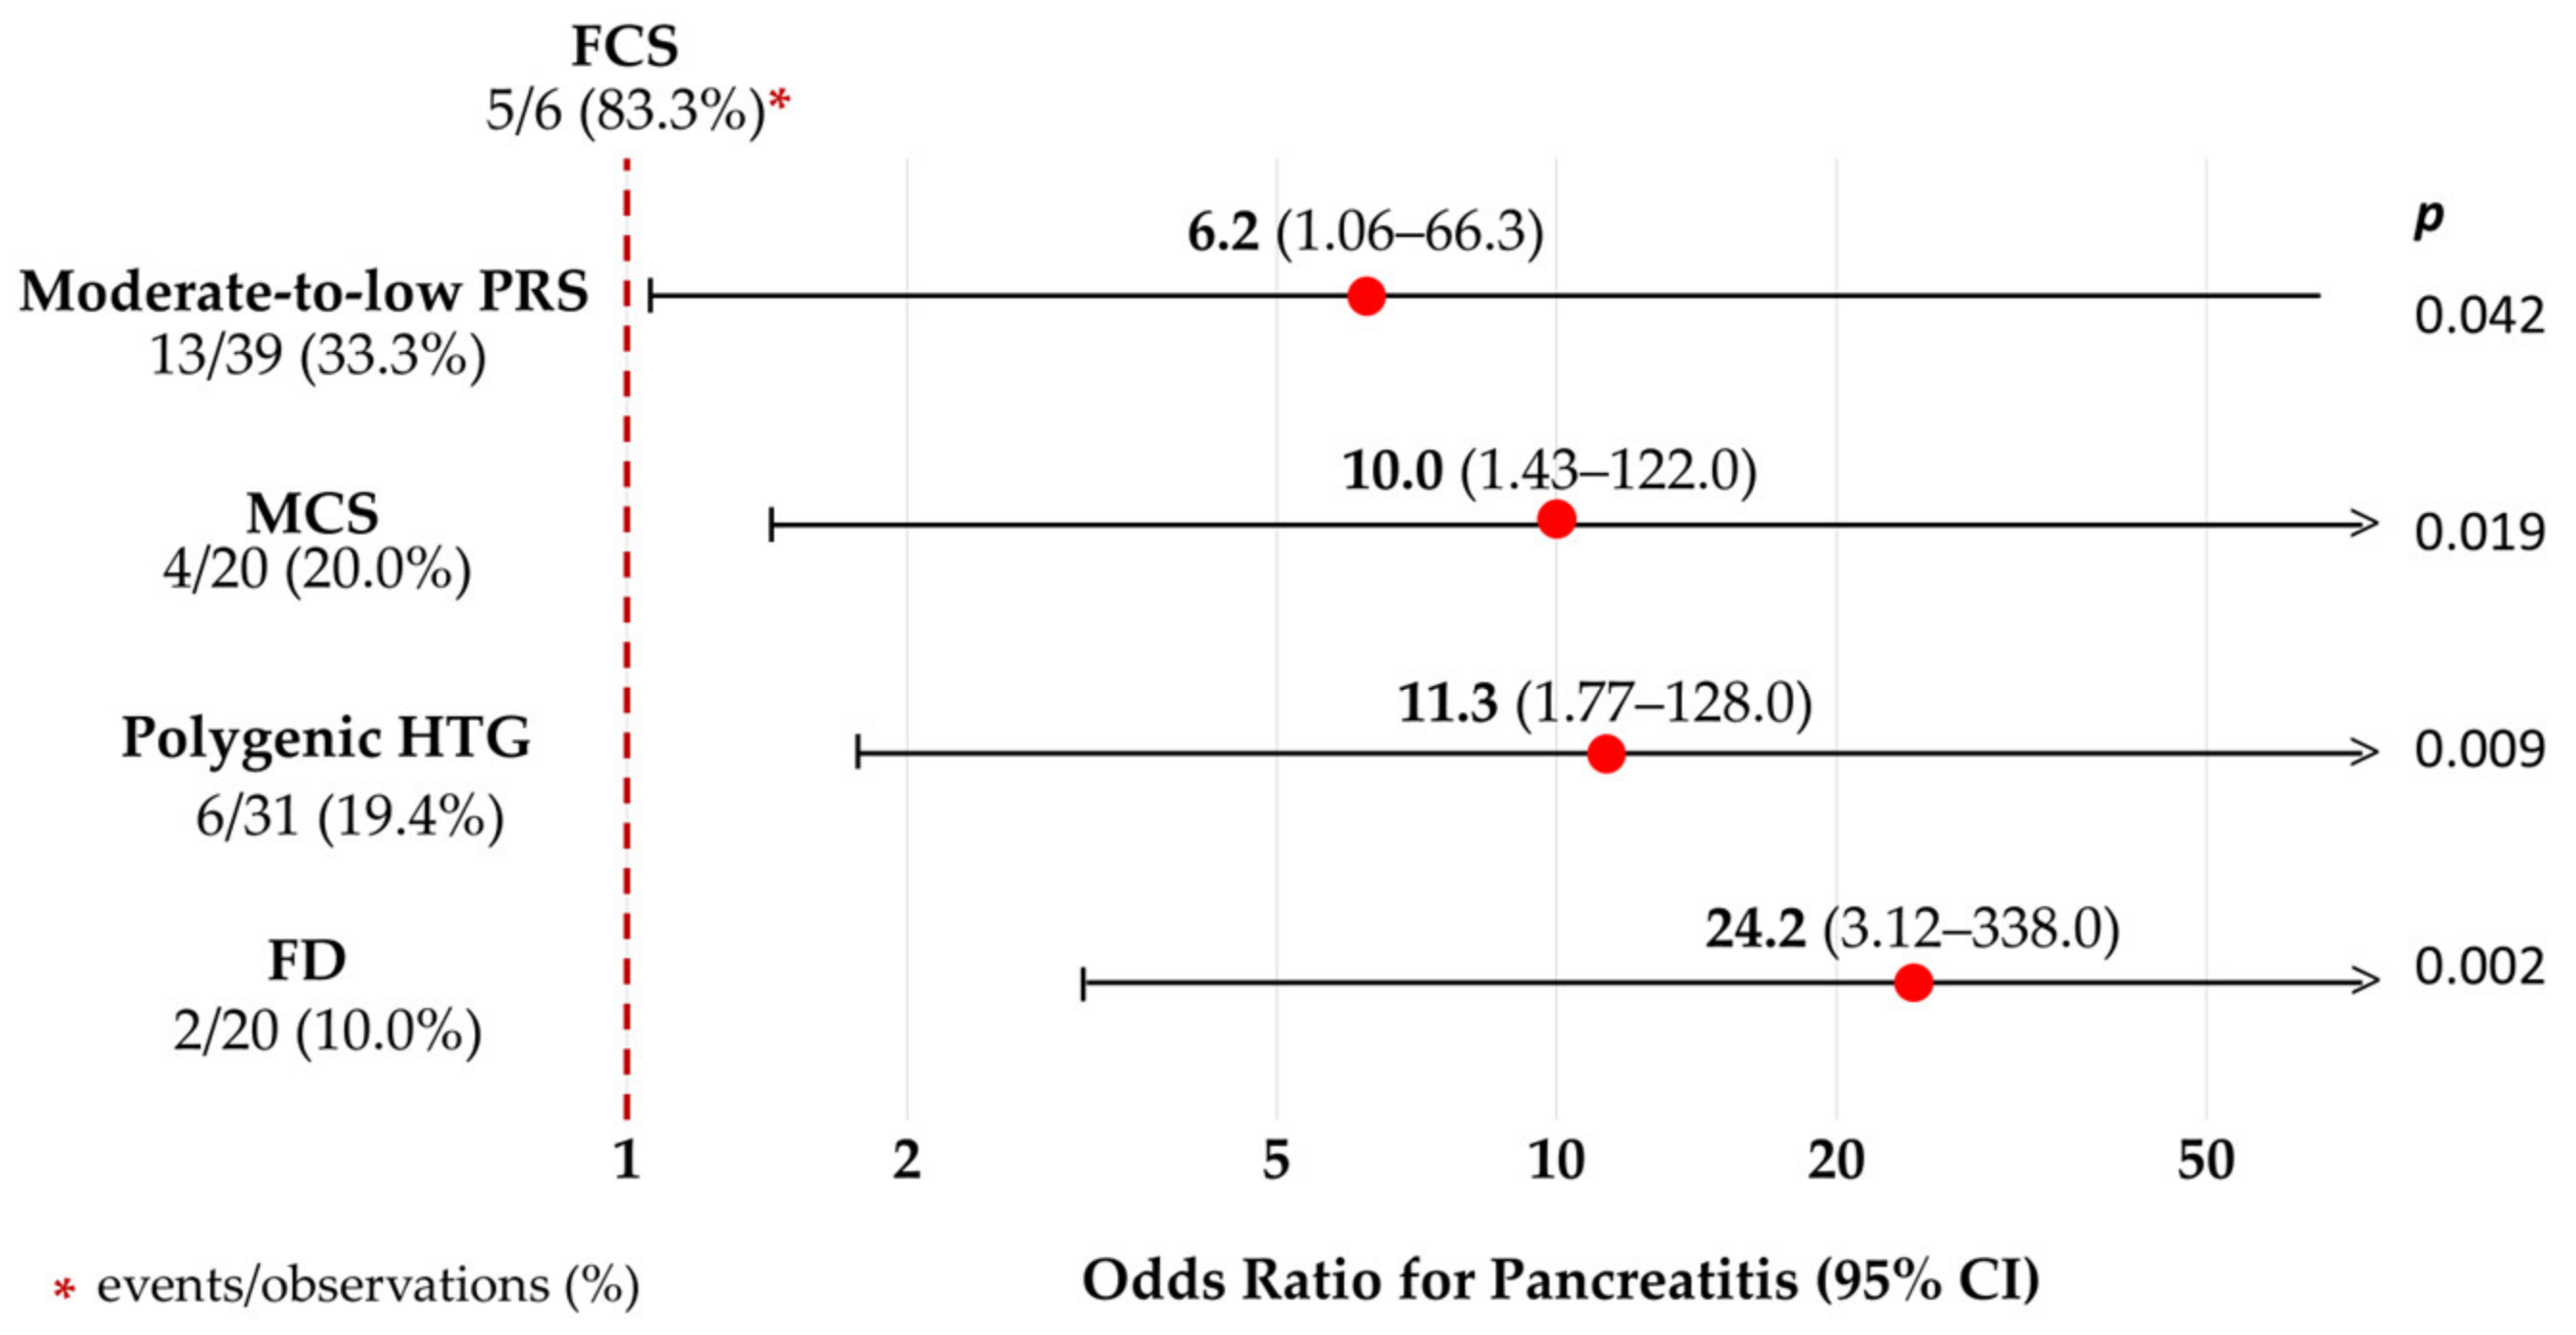
The prevalence of pancreatitis differed across five genetic groups (p = 0.008) (Table 2). In a logistic regression adjusted for sex and age, FCS was associated with higher odds of pancreatitis compared with the moderate-to-low PRS, MCS, polygenic HTG, and FD groups (Figure 7). The wide CIs reflect limited precision due to the small sample size of this group, which is expected given the rare prevalence of the disease. The risk of pancreatitis was comparable across the FD, polygenic HTG, MCS, and moderate-to-low PRS groups (Supplementary Table S2).
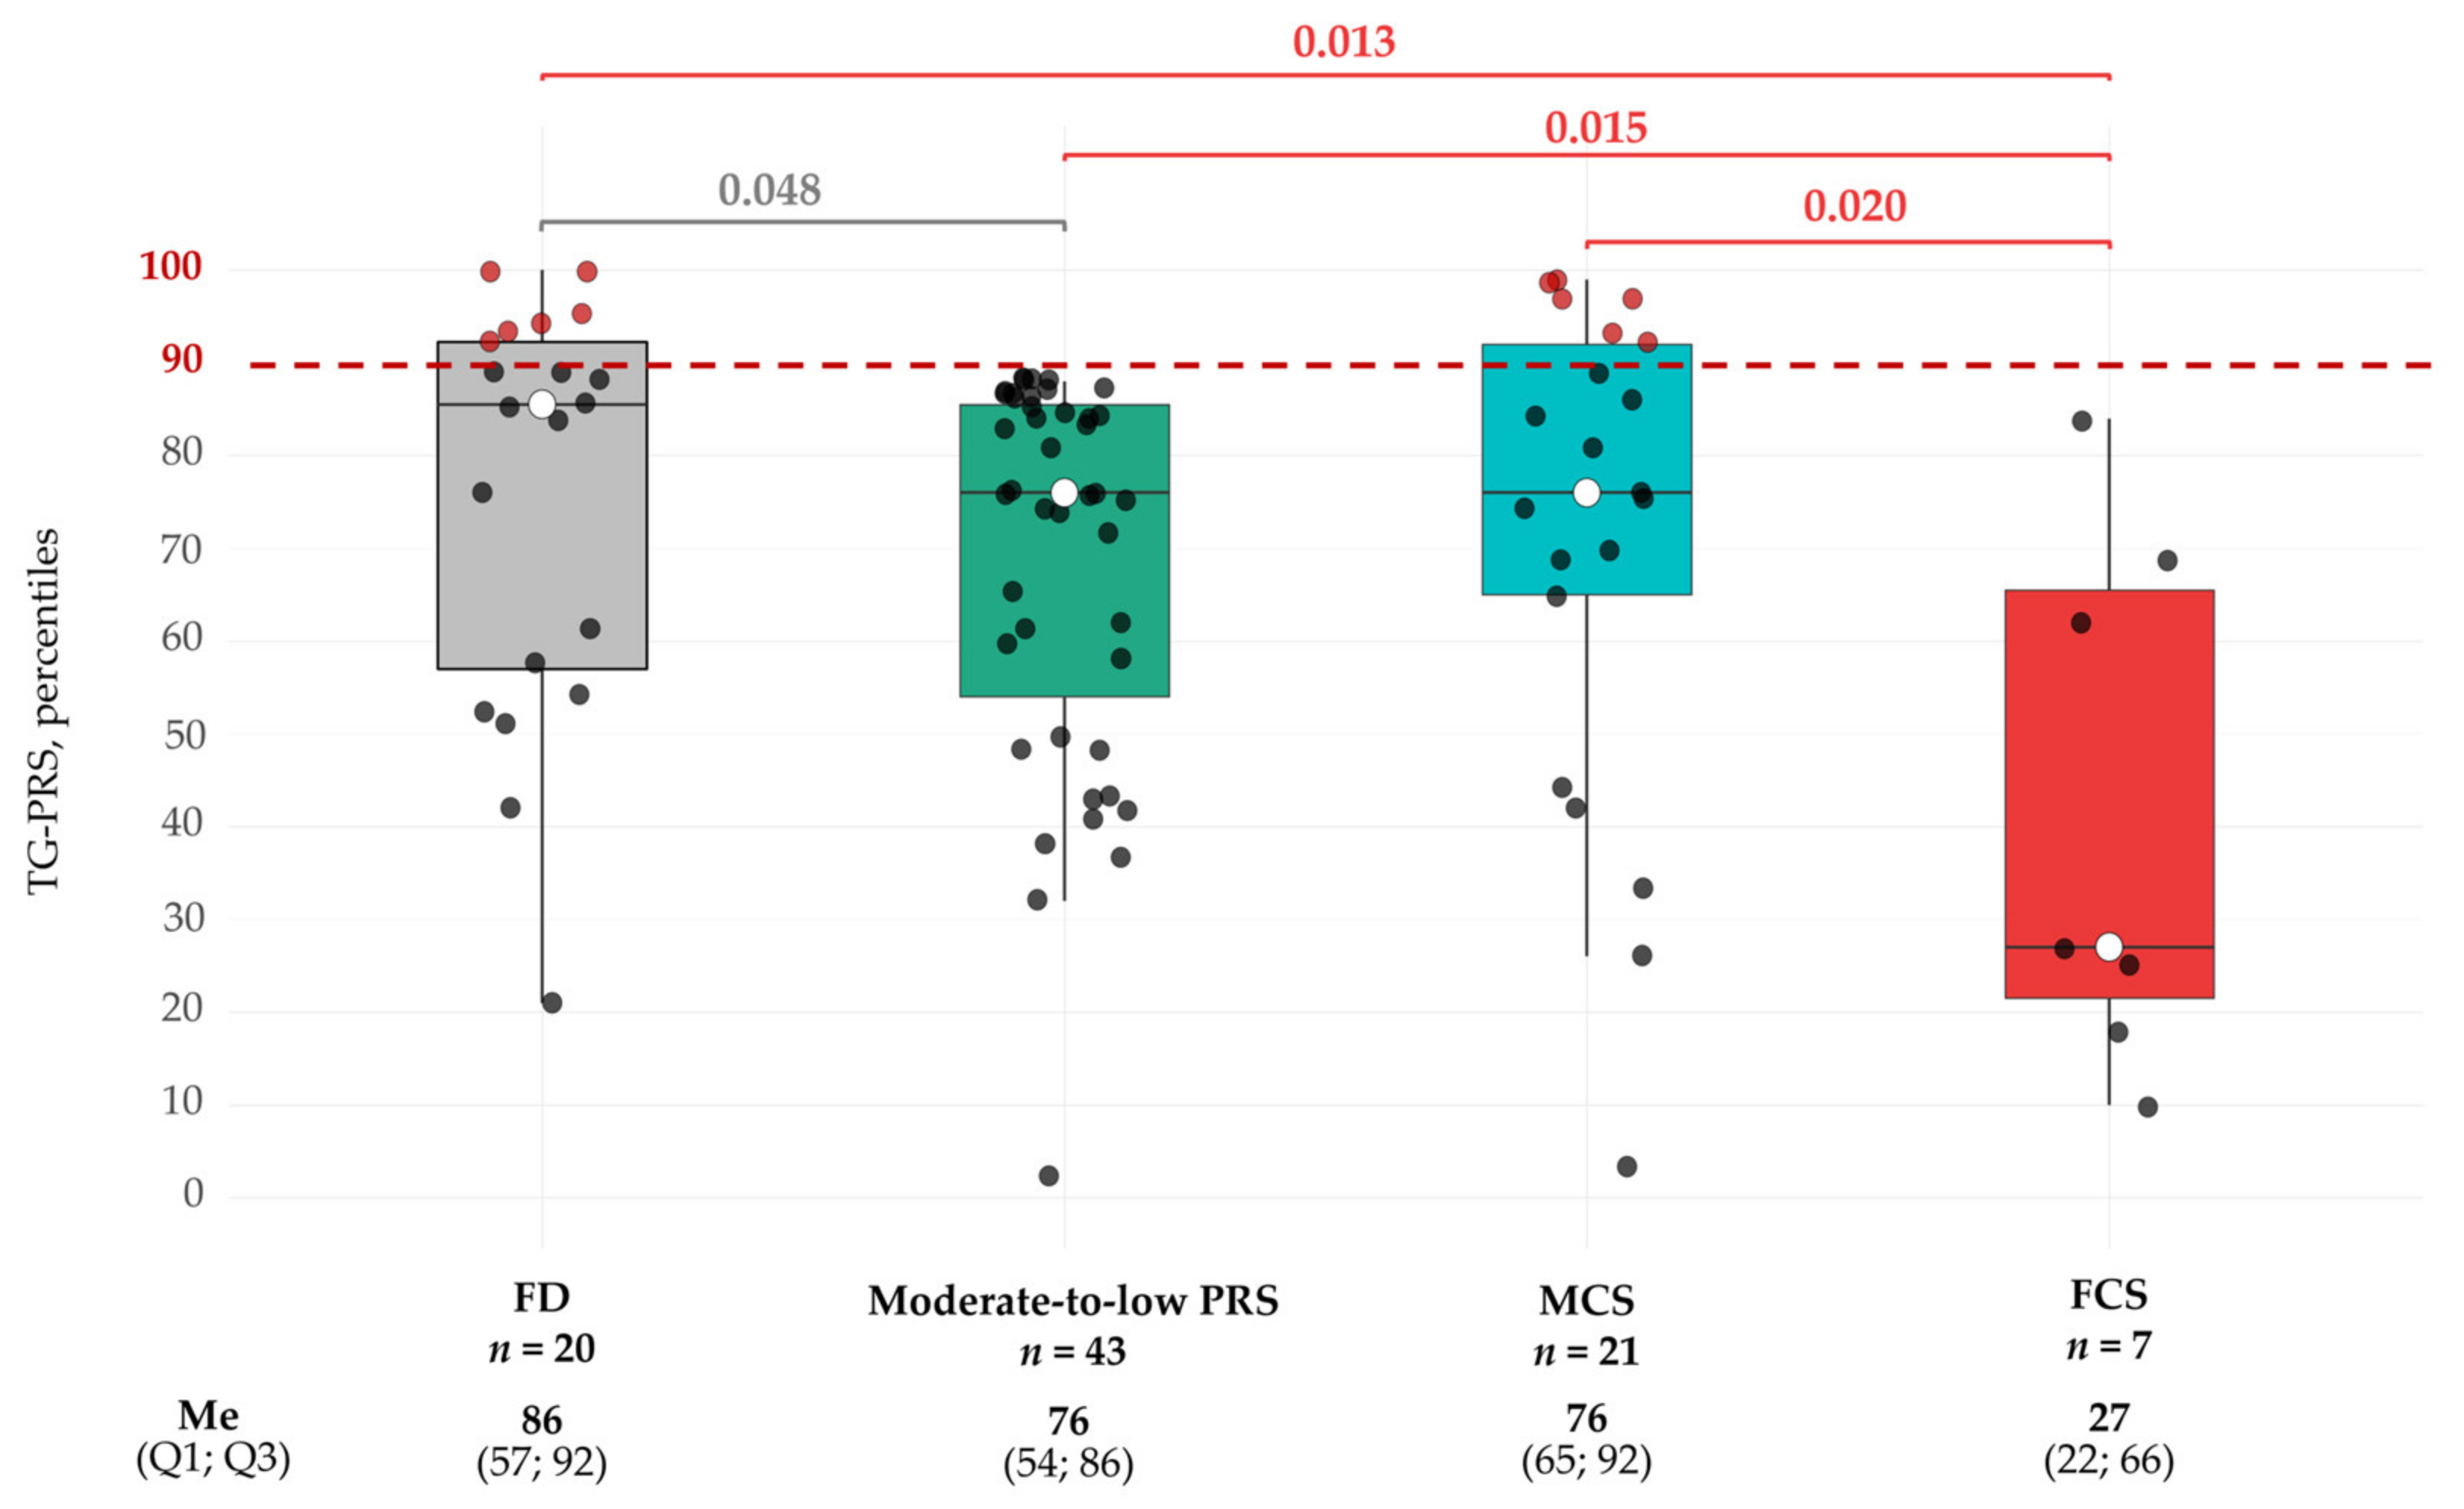
In pairwise comparisons, PRS percentiles were lower in the FCS than in the MCS (ΔMe −30, 95% CI: −62 to −6; p = 0.020), moderate-to-low PRS (ΔMe −25, 95% CI: −58 to −4; p = 0.015), and FD groups (ΔMe −32, 95% CI: −66 to −10; p = 0.013). No extremely elevated PRS were observed in FCS. PRS percentiles were higher in FD than in the moderate-to-low PRS group (ΔMe 8, 95% CI: 0−15; p = 0.048), with borderline significance. The PRS distribution was comparable between FD and MCS and between MCS and the moderate-to-low PRS group (Figure 8, Supplementary Table S2).

3. Discussion

This study analyzed the genetic determinants of severe HTG. The main strength is the integrative genetic approach, which combined analysis of the canonical chylomicronemia genes, APOE variants, the ε2/ε2 genotype, and TG-PRS. This approach also allowed us to compare the clinical characteristics and PRS distribution across the moderate-to-low PRS, polygenic HTG, MCS, FCS, and FD groups. This is the first study providing a comprehensive assessment of the genetic determinants of severe HTG in an Eastern European cohort.

3.1. Genetic Determinants of Severe HTG

Major genetic determinants of severe HTG were identified in 65.0% of individuals. This yield is broadly consistent with previous reports (24.3–67.5%) [25,26,27,33,34,35,36]. Direct comparisons, however, are limited by differences in TG thresholds, the spectrum of genes analyzed, variant classification methods, PRS assessment, and population ancestry, which may influence the spectrum and frequency of detected variants [33].
Our results further underscore the genetic heterogeneity of severe HTG: 25.1% of individuals carried rare variants in canonical chylomicronemia genes or APOE, including the ε2/ε2 genotype; 4.1% had overlap between these findings; 9.8% had both rare variants or the ε2/ε2 genotype and an extreme PRS; and 26.0% had isolated polygenic HTG. The remaining 35.0% without major genetic determinants had moderate-to-low PRS.

3.1.1. Chylomicronemia Genes

The prevalence of rare-variant carriers across five canonical chylomicronemia genes was 24.4%, consistent with rates reported in large international cohorts, including 23.6% and 24.3% in Canadian and UK studies of extreme HTG [27,34], and similar to the 15.5% observed in a combined Canadian and US cohort [25]. The higher prevalence in the Italian LIPIGEN cohort (63.9%) likely reflects differences in study design, including clinically confirmed FCS, as well as analysis of additional genes (CREB3L3 and GPD1) [35].
At the genotype level, single heterozygotes predominated (63.3% of variant carriers), while biallelic or double heterozygotes were less common (36.6%). Accordingly, genetically confirmed FCS was relatively infrequent in our cohort (5.7%) compared with international reports (12.9–48.0%) [33,34,35]. The only previous Russian study reported a higher prevalence of biallelic variants in canonical genes (14.6%). However, it focused on patients with extreme HTG (median TG 39.0 mmol/L) and clinically confirmed FCS, which likely explains the differences [37]. Emerging evidence supporting the pathogenicity of identified VUSs may increase the prevalence of genetically defined FCS in our cohort to 8.9%.
Rare variants were predominantly identified in LPL (53.6%), accounting for the majority of causative variants across chylomicronemia genes. Consistently, LPL variants were present in 71.4% of FCS cases, confirming their central role in the genetic architecture of FCS. This predominance has been previously observed in European individuals from the UK cohort [33] and is consistent with the LIPIGEN study, where LPL variants were detected in 72.0% of FCS cases [35].
Although missense variants predominated in the overall spectrum of chylomicronemia genes, we identified seven loss-of-function variants, 57.1% of which were located in LPL. Furthermore, in the genetic architecture of FCS, loss-of-function variants were also predominantly observed in LPL. LPL is the key catalytic enzyme that hydrolyzes TG in TG-rich lipoproteins. Loss-of-function variants typically result in a marked reduction or complete loss of LPL activity, particularly in biallelic carriers. As a result, affected patients may present with a more severe phenotype and a reduced response to standard TG-lowering therapy that depend on LPL activity. In contrast, missense variants may be associated with variable residual LPL activity depending on their functional impact [3,12].
We also identified four novel pathogenic variants and six missense VUSs in chylomicronemia genes. The identification of novel variants expands the known spectrum of HTG-associated variants and improves variant interpretation and genetic diagnosis. As additional evidence accumulates, including segregation with the phenotype in affected family members or unrelated patients, as well as results from functional studies, VUSs may be reclassified as pathogenic variants. Such reclassification would improve the genetic diagnosis of severe HTG, facilitate cascade screening, and contribute to more accurate risk stratification and therapeutic decision-making.

3.1.2. APOE Gene

We extended the analysis beyond the canonical chylomicronemia genes to include rare APOE variants and the ε2/ε2 genotype, both associated with FD. APOE encodes apolipoprotein E, a key ligand mediating receptor-dependent hepatic clearance of cholesterol-enriched remnants. Interactions between FD-associated genetic variants and additional modifying factors (metabolic or genetic) promote the accumulation of remnant lipoproteins and the development of the FD phenotype [14,16,29].
This approach identified additional genetic determinants in 18 individuals (+14.6% relative to carriers of variants in chylomicronemia genes) and detected overlap between chylomicronemia variants and APOE in five patients. Overall, rare APOE variants or the ε2/ε2 genotype were present in 18.7% of the cohort, representing the significant component of the genetic architecture of severe HTG, comparable to rare variants in chylomicronemia genes.
This is the first study to evaluate both the ε2/ε2 genotype, associated with autosomal-recessive FD, and rare APOE variants linked to autosomal-dominant FD alongside the canonical chylomicronemia genes. The prevalence of the ε2/ε2 genotype in our cohort (8.9%) was higher than that reported in a Turkish cohort with severe HTG (1.5%) [36], which may reflect population-specific differences [23].

3.1.3. Polygenic HTG

Polygenic predisposition to elevated TG levels can be calculated using a TG-PRS, which reflects the cumulative burden of multiple common TG-raising variants across genes involved in TG-rich lipoprotein metabolism. The accumulation of such variants has an additive effect on TG levels and may contribute to a severe HTG phenotype, even in the absence of rare TG-associated variants [25,26]. In this study, we used a TG-PRS based on 40 TG-raising variants.
An extreme polygenic contribution to TG levels was present in 35.8% of individuals, representing the most common genetic component of severe HTG in this cohort. Isolated polygenic HTG was observed in 26.0% of individuals, suggesting that a predominant polygenic burden may contribute to a severe HTG phenotype, potentially in interaction with non-genetic factors. In the Dron 2019 and Dron 2020 studies, isolated polygenic HTG was the most common type of genetically defined severe HTG (32.0% and 26.4%, respectively) [25,27]. Our results demonstrate that severe HTG may also be caused by APOE variants. Together with rare chylomicronemia gene variants, they accounted for 39.0% of cases, a prevalence comparable to that of an extreme PRS.
The overlap of extreme PRS with rare variants, including the ε2/ε2 genotype (9.8% of all patients), further extends the complexity of the genetic architecture of severe HTG. These findings are similar to the Dron 2020 study, in which 6.3% of patients had both chylomicronemia gene variants and an extreme PRS [27].

3.1.4. Moderate-to-Low PRS Cases

In the remaining 35.0% of patients, no major genetic determinants of severe HTG were identified. These individuals nonetheless had a relatively high PRS distribution (median 76th percentile), which may have contributed to elevated TG levels. Among these cases, 76.7% had PRS in the 50–90th percentile range, reflecting a moderate PRS, while 23.3% had low PRS (<50th percentile). Additional drivers of severe HTG in these patients may include rare variants in noncanonical HTG genes that were not evaluated in this study, such as GPD1 and CREB3L3. In particular, the inclusion of CREB3L3 has been shown to increase the genetic diagnostic yield of severe HTG and is likely more prevalent in patients with MCS [35,37]; genes associated with secondary causes of HTG, such as monogenic diabetes or inherited forms of lipodystrophy; and non-genetic factors. Although lifestyle-related factors, including dietary habits, were not evaluated in this study, we observed a relatively high prevalence of metabolic syndrome components (40.0%) within this group, suggesting a potential additive effect of these factors with PRS on extremely elevated TG levels.

3.2. Differences in Main Clinical Characteristics and PRS Distribution

Clinical differences among FCS, MCS, and the ”rare-variant-negative” groups have been well-described [33,35,38,39], but most previous studies did not assess PRS or include FD for comparison.
In our cohort, BMI was significantly lower in FCS than in the moderate-to-low PRS, polygenic HTG, and FD groups, underlining a lower metabolic burden in FCS. These findings are consistent with LIPIGEN [35] and the Paquette 2021 [38] studies. However, these studies did not assess TG-PRS, and their “rare-variant-negative” group may have included patients with polygenic HTG. Notably, BMI was comparable between FCS and MCS, likely reflecting the overall high metabolic burden across cohorts and overlapping BMI distribution.
All genetic groups had extreme TG levels (>10.0 mmol/L), but FCS demonstrated the highest values, similar to previous chylomicronemia studies [35,38,39]. In contrast, TG levels were significantly lower in FD than in the other groups, a result we report here for the first time, which likely reflects differences in TG metabolism.
The prevalence of pancreatitis in FCS was 83.3%, with 6-to-11-fold higher odds than in the moderate-to-low PRS, MCS, and polygenic HTG groups, consistent with previous reports [33,35,38]. Although, in contrast to our findings, which may reflect comparable PRS and TG burden between moderate-to-low PRS and MCS, the Paquette 2021 study reported a significant difference between MCS and “rare-variant-negative” groups [38]. In addition, the odds of pancreatitis in our cohort were up to 24-fold higher in FCS than in FD, consistent with the lower TG levels observed in FD.
In addition, we compared PRS percentiles across the FCS, MCS, moderate-to-low PRS, and FD groups. Lower PRS percentiles in FCS and the absence of extremely elevated PRS align with FCS’s predominantly monogenic architecture. Differences between FD and the moderate-to-low PRS group were borderline.
We did not observe differences in CAD prevalence across five groups, consistent with previous studies demonstrating comparable rates between FCS and MCS in LIPIGEN [35] and in a UK cohort, where borderline differences became nonsignificant after adjustment for age, sex, and BMI [33].
Despite distinct genetic determinants across FCS, MCS, polygenic HTG, and moderate-to-low PRS groups, their clinical comparisons show that patients with FCS are likely to benefit the most from genetic testing, which is consistent with the Spagnuolo 2025 study [39]. The contribution of an elevated TG-PRS toward phenotype severity requires further analysis [40]. A previous study has shown that individuals carrying both rare pathogenic variants in chylomicronemia genes and a high TG-PRS have more severe HTG and a higher risk of acute pancreatitis than those without such variants and with low PRS [41]. We were unable to replicate this comparison in our cohort due to the limited number of MCS individuals with PRS > 90th percentile. In FD patients, the phenotype may develop at lower TG levels (≥1.5 mmol/L). Identification of APOE variants or the ε2/ε2 genotype, as well as assessment of TG-PRS, may improve early detection and risk stratification in FD, as previously reported [29].

4. Materials and Methods

4.1. Study Subjects

The study sample was derived from the genotyped subset of the Biobank of the National Medical Research Center (NMRC) for Therapy and Preventive Medicine (Moscow, Russia) [28]. In the present analysis, we included unrelated index patients aged ≥ 18 years with fasting TG levels > 5.0 mmol/L (n = 123). These patients were recruited within an ongoing research project focused on chronic noncommunicable diseases, including lipid metabolism disorders [42].
Although a TG level > 5.0 mmol/L corresponds to moderate HTG according to the 2021 European Atherosclerosis Society consensus [2], the cutoff was selected to reduce underdiagnosis of severe cases (>500 mg/dL or >5.65 mmol/L [2]) due to TG variability and the use of LLT. Only five individuals (4.1%) had TG levels between 5.0 and 5.65 mmol/L, indicating minimal inclusion of milder cases. This approach allowed capturing a broader spectrum of genetically determined HTG.

4.2. Clinical and Biochemical Data

The retrospective clinical and biochemical data included age, sex, BMI, smoking status, and the presence of hypertension, glucose metabolism disorders, hypothyroidism, pancreatitis, and CAD, including myocardial infarction and coronary revascularization. The presence of CAD was based on medical records and was diagnosed according to current European clinical guidelines. Early-onset CAD was defined as age at diagnosis <55 years in men and <60 years in women. Glucose metabolism disorders were defined as clinical diagnoses of either type 2 diabetes, impaired glucose tolerance, or impaired fasting glucose. Metabolic syndrome components included at least two of the following: hypertension, BMI ≥ 30.0 kg/m2, or glucose metabolism disorders. The presence of xanthomas was considered when these data were available. The type of LLT was also analyzed.
TG levels were reported in mmol/L and were measured using the Abbott Architect C-8000 system (Abbott Laboratories, North Chicago, IL, USA). To capture maximal phenotypic severity, the highest documented fasting TG value from the medical record was used for each participant. For the 29 patients receiving LLT, no TG recalculation was performed.

4.3. Genetic Analysis

4.3.1. NGS

Blood samples were stored at −32 °C in the Biobank of the NMRC for Therapy and Preventive Medicine [42]. NGS was performed using custom target panel (n = 123) designs with the NextSeq 550 (Illumina, San Diego, CA, USA) platform, as previously described [13]. Five canonical chylomicronemia genes—LPL (HGNC:6677), APOC2 (HGNC:609), APOA5 (HGNC:17288), GPIHBP1 (HGNC:24945), and LMF1 (HGNC:14154)—as well as FD gene APOE (HGNC:613) were analyzed. Sanger sequencing was performed using the Applied Biosystem 3500 Genetic Analyzer (Thermo Fisher Scientific, Waltham, MA, USA) following the manufacturer’s protocol.

4.3.2. Bioinformatic Analysis and Clinical Interpretation

All steps of the bioinformatic analysis have been described previously [13]. Briefly, the GRCh38/hg38 reference genome was selected for aligning paired-end reads. The generated VCF files contained a list of variants, their genomic coordinates, coverage data, and other characteristics. For the current study, principal component analysis (PCA) was performed on individual genotypes using Hail v.0.2.130 [43]. For this analysis, variants with a minor allele frequency < 5.0% were excluded, and linkage disequilibrium pruning was applied (r2 = 0.2). Samples were projected onto reference populations from the 1000 Genomes Project Phase 3, and all analyzed individuals clustered within the European population. No outliers were detected or removed.
The following canonical transcripts were used for variant annotation: NM_000237.3 (LPL), NM_000483.5 (APOC2), NM_052968.5 (APOA5), NM_178172.6 (GPIHBP1), NM_022773.4 (LMF1), and NM_000041.4 (APOE). Variants with a minor allele frequency <0.5% across populations in the Genome Aggregation Database v4.1.0 [44] and predicted to have moderate or high impact were selected for evaluation according to the ACMG/AMP2015 guidelines [45]. For APOE, the ε2/ε2 genotype was additionally considered and identified as described previously [23]. The following types of variants are reported in the article: pathogenic, likely pathogenic, or VUS.
Combined Annotation Dependent Depletion (CADD v1.7 for GRCh38) was used to predict the impact of single-nucleotide variants as well as deletion variants [46]. Scaled CADD scores (PHRED-like scaled C-scores) were obtained to assess the deleteriousness of identified variants [47]. Variants with a PHRED score ≥ 20 were considered potentially pathogenic. In this case, the criterion PP3 ACMG/AMP2015 was used. For splice variants we used the SpliceAI Δ score obtained from CADD v.1.7 [47].
We reported variants as novel when they had not been previously described in public databases or in the literature, including our own previous studies.
A genetic diagnosis of FCS was established based on one of the following criteria: (1) homozygous or compound heterozygous pathogenic or likely pathogenic variants in one of the five canonical chylomicronemia genes (LPL, APOC2, APOA5, GPIHBP1, LMF1); or (2) pathogenic or likely pathogenic variants in two of these genes (double heterozygotes).
Variant-positive MCS was defined by the presence of the following types of variants in chylomicronemia genes: (1) a heterozygous pathogenic or likely pathogenic variant; or (2) a heterozygous pathogenic or likely pathogenic variant with an additional VUS; or (3) one or more heterozygous VUS [3].
The FD genetic group was defined by the presence of the ε2/ε2 APOE genotype or rare APOE variants [13].
For comparison of clinical and genetic characteristics, cases with overlapping APOE-related findings and rare variants in chylomicronemia genes were assigned into groups based on the genetic determinant with the strongest predicted causal effect.

4.4. Polygenic Risk Score for Elevated TG Levels

PRS was calculated for all study participants using the β-coefficients from the original study [48], which previously demonstrated significant associations with TG levels (40 variants, Supplementary Table S3) in the population from the European part of Russia [49]. In the present study, the PRS percentile distribution was acquired from this joint population sample (n = 2490) and was used to calculate participants’ PRS percentiles. Polygenic HTG was defined as a weighted PRS > 90th percentile [49].

4.5. Ethical Statement

The study was conducted in accordance with the Declaration of Helsinki and the National Standard of the Russian Federation “Good Clinical Practice (GCP)” (GOST R 52379-2005 [50]) and was approved by the Independent Ethics Committee of the NMRC for Therapy and Preventive Medicine (protocols number 05-05/15, dated 9 June 2015, and number 07-05/20, dated 26 November 2020). To comply with these regulations, as well as Article 93 of the Federal Law “On the Fundamentals of Health Protection of Citizens of the Russian Federation” (dated 21 November 2011, No. 323-FZ), each participant provided written informed consent for the processing of their personal data. The database containing clinical, biochemical, and genetic data was deidentified and encrypted to ensure participant confidentiality.

4.6. Statistical Analysis

Statistical analyses were performed using R version 4.4.3 (R Foundation for Statistical Computing, Vienna, Austria) [51].
Continuous variables (age, BMI, PRS percentiles, and TG levels) were summarized as Me (25th; 75th percentiles) to provide distribution-robust descriptive statistics that are not sensitive to limited and heterogeneous subgroup sizes. Categorical variables were presented as absolute numbers and percentages.
For comparisons of continuous variables between two independent groups, the Mann–Whitney U test was used. In these cases, the pseudomedian difference was estimated using the Hodges–Lehmann method with a corresponding 95% CI. For comparisons across five genetic groups, the Kruskal–Wallis test was used for continuous variables, and the two-sided Fisher’s exact test was applied for categorical variables.
TG levels were log2-transformed prior to analysis. Between-group differences in TG levels were assessed using multivariable linear regression models adjusted for sex, age, and LLT. For BMI, models were adjusted for sex and age. Robust standard errors (HC3) were applied. Estimated marginal means derived from these models were used for pairwise comparisons between genetic groups. For TG levels, the results are presented as fold-changes (2^estimate, i.e., back-transformed from the log2 scale), and for BMI as mean differences (kg/m2), both with 95% CI and p-values.
Firth penalized logistic regression (logistf package version 1.26.1 [52]) was used to evaluate the association between genetically defined groups and the risk of pancreatitis, adjusted for sex and age. Pairwise comparisons were obtained within the same model framework by varying the reference category. Results are reported as odds ratios with 95% CI and corresponding p-values.
p-values reported in the main analyses are unadjusted for multiple comparisons, as comparisons were prespecified and performed between biologically defined genetic groups. Holm–Bonferroni-adjusted p-values are provided in Supplementary Table S2. p-values of less than 0.05 were considered statistically significant.
Data visualization was performed using the ggplot2 version 4.0.0 [53], patchwork version 1.3.2 [54], and VennDiagram version 1.8.2 [55].

4.7. Limitations

This study has several limitations. The genetic analysis did not include noncanonical chylomicronemia genes or genes associated with secondary causes of HTG, which may have increased the diagnostic yield of genetically defined cases. Several patients in the MCS group carried VUS in the compound heterozygous or double-heterozygous state. Future reclassification of these variants as pathogenic may increase the proportion of genetically defined FCS. However, given the limited number of such patients (n = 4), a significant impact on the observed genotype–phenotype associations in the current study is unlikely. Six patients in the MCS group and six in the FD group carried both rare pathogenic variants and high TG-PRS, suggesting a potentially more severe phenotype. However, their limited number prevented separate subgroup analyses. In addition, the cohort included only individuals of European ancestry, limiting generalizability to other populations. The clinical data were retrospectively derived from a project not specifically designed for patients with chylomicronemia, limiting the completeness of comparisons of related complications. In addition, lifestyle-related factors, such as dietary habits, were not available for evaluation. Finally, the relatively small sample size, particularly in the FCS group, may have reduced statistical power to detect less pronounced associations.

5. Conclusions

Severe HTG demonstrated a highly heterogeneous genetic architecture in this cohort. Analysis of canonical chylomicronemia genes identified 24.4% of cases. A broader genetic approach, including APOE variants and the ε2/ε2 genotype, detected an additional 14.6% of non-overlapping cases and overlap with chylomicronemia variants in 4.1%. Assessment of TG-PRS further identified 26.0% with isolated polygenic HTG and 9.8% with overlap, increasing the overall yield of major genetic determinants to 65.0%. The remaining 35.0% had moderate-to-low PRS. Among genetically defined HTG groups, FCS had the most distinct clinical profile. Further studies are required to determine whether elevated TG-PRS modifies phenotype severity in carriers of rare variants.

Supplementary Materials

The following supporting information can be downloaded at https://www.mdpi.com/article/10.3390/ijms27125443/s1.

Author Contributions

Conceptualization, A.V.B. and A.N.M.; methodology, A.V.B., A.N.M. and A.I.E.; validation, A.V.B., A.N.M., A.I.E., M.Z., A.A.B., A.S.L., A.V.K. and E.A.S.; formal analysis, A.V.B., A.N.M., A.I.E., M.Z., V.I.M., S.A.S., A.A.B., A.S.L., A.V.K., E.A.S., A.A.Z., E.A.N., E.V.B., Y.V.V., V.E.R. and M.S.P.; investigation, A.V.B., A.N.M., A.I.E., M.Z., V.I.M., S.A.S., A.A.B., A.S.L., A.V.K., E.A.S., A.A.Z., E.A.N., E.V.B., Y.V.V., V.E.R. and M.S.P.; data curation, A.V.B., A.N.M. and A.I.E.; writing—original draft preparation, A.V.B.; writing—review and editing, A.V.B., A.N.M., A.I.E., M.Z., V.I.M., S.A.S., A.A.B., A.S.L., A.V.K., E.A.S., E.A.N. and E.V.B.; visualization, A.V.B.; project administration, A.N.M. and A.I.E.; software, A.V.B., M.Z., A.A.Z., Y.V.V., V.E.R. and M.S.P.; resources, A.N.M., A.I.E. and O.M.D.; supervision, A.N.M., A.I.E. and O.M.D.; funding acquisition, A.N.M., A.I.E. and O.M.D. All authors have read and agreed to the published version of the manuscript.

Funding

This research received no external funding.

Institutional Review Board Statement

This study was conducted in accordance with the Declaration of Helsinki and was approved by the Independent Ethics Committee of the National Medical Research Center for Therapy and Preventive Medicine (protocols No. 05-05/15, 9 June 2015, and No. 07-05/20, 26 November 2020).

Informed Consent Statement

Written informed consent was obtained from all the patients involved in this study.

Data Availability Statement

The data used in this study, including individual genotype information, cannot be publicly disclosed according to the rules of the Ethics Committee of the National Medical Research Center for Therapy and Preventive Medicine. Deidentified data will be provided upon reasonable request by the corresponding author, Anastasia Blokhina (blokhina0310@gmail.com), or by the Ethics Committee of the National Medical Research Center for Therapy and Preventive Medicine (phone number +74995536810, secretarynec@gnicpm.ru). Proposals will be reviewed and approved by the investigators, local regulatory authorities, and the Ethics Committee of the National Medical Research Center for Therapy and Preventive Medicine. Once the proposal is approved, data can be transferred through a secure online platform after signing a data access agreement and a confidentiality agreement.

Acknowledgments

The graphical abstract created in BioRender. Blokhina, A. (2026), https://BioRender.com/v7grvsm (accessed on 10 June 2026).

Conflicts of Interest

The authors declare no conflicts of interest. The funders had no role in the design of the study, in the collection, analyses, or interpretation of data, in the writing of the manuscript, or in the decision to publish the results.

Abbreviations

The following abbreviations are used in this manuscript:
BMIBody mass index
CADCoronary artery disease
CADDCombined annotation dependent depletion
CIConfidence interval
FCSFamilial chylomicronemia syndrome
FDFamilial dysbetalipoproteinemia
HTGHypertriglyceridemia
LLTLipid-lowering therapy
MCSMultifactorial chylomicronemia syndrome
NMRCNational Medical Research Center
PRSPolygenic risk score
TGTriglyceride
VUSVariant of uncertain significance

Appendix A

Table A1. Rare variants identified in chylomicronemia genes in the study cohort.
Gene, Total No. of VariantsVariant No.VariantGenomic
Coordinates (GRCh38)
Reference
Allele
Alternative
Allele
Variant
Type
HGVScHGVSpTotal AF
gnomAD v4.1.0, %
ACMG
Class
CADD
PHRED
v1.7
Carrier
Count
Allele CountPreviously Reported
LPL,
n = 15
1Not registeredchr8:19948208TATFrameshiftc.120delp.Lys40AsnfsTer4Not reportedP33.012no
2rs375484335chr8:19948266GAMissensec.175G>Ap.Gly59Arg0.002106VUS28.211yes
3Not registeredchr8:19951790TGMissensec.271T>Gp.Trp91GlyNot reportedVUS29.911no
4rs118204069chr8:19951856TCMissensec.337T>Cp.Trp113Arg0.0006196P29.833yes
5Not registeredchr8:19954138CGMissensec.560C>Gp.Pro187ArgNot reportedVUS28.511no
6Not registeredchr8:19954182GAMissensec.604G>Ap.Asp202AsnNot reportedLP28.822yes
7rs118204057chr8:19954222GAMissensec.644G>Ap.Gly215Glu0.03556P24.723yes
8Not registeredchr8:19954276AGMissensec.698A>Gp.Tyr233CysNot reportedLP28.111yes
9Not registeredchr8:19954320GCMissensec.742G>Cp.Ala248ProNot reportedVUS26.911no
10rs118204080chr8:19954333TCMissensec.755T>Cp.Ile252Thr0.003779P25.311yes
11rs773407951chr8:19955883AGMissensec.818A>Gp.His273Arg0.0006195LP26.111yes
12Not registeredchr8:19959265CTMissensec.1024C>Tp.His342TyrNot reportedVUS26.511no
13Not registeredchr8:19960933TCTFrameshiftc.1174delp.Leu392TerNot reportedP27.711no
14rs2128839190chr8:19959257CASplice-region variantc.1019-3C>A0.0001239LPSpliceAI Δ score = 0.6711yes
15Not registeredchr8:19955963
-19958022
2-kb duplicationc.897_1019-1238dupNot reportedP11no
APOA5,
n = 6
16rs201079485chr11:116790940GANonsensec.289C>Tp.Gln97Ter0.01711P36.012yes
17rs1940989106chr11:116790636AGGCTCTCGGCGTATAFrameshiftc.579_592delp.Tyr194GlyfsTer69Not reportedP33.011yes
18rs2075291chr11:116790676CAMissensec.553G>Tp.Gly185Cys0.2916VUS18.7966yes
19Not registeredchr11:116790622CTMissensec.607G>Ap.Gly203ArgNot reportedVUS20.311no
20Not registeredchr11:116790562GAMissensec.667C>Tp.Arg223CysNot reportedVUS25.311yes
21rs563462071chr11:116790531CTMissensec.698G>Ap.Arg233Gln0.002189VUS7.90211yes
GPIHBP1,
n = 3
22rs201685731chr8:143215331GAMissensec.368G>Ap.Gly123Glu0.04198VUS11.6811yes
23rs373297994chr8:143215447GAMissensec.484G>Ap.Glu162Lys0.005086VUS0.01011yes
24rs145844329chr8:143215486GCMissensec.523G>Cp.Gly175Arg0.07318LP6.94911yes
APOC2,
n = 2
25Not registeredchr19:44948752TCTFrameshiftc.109delp.Leu37SerfsTer4Not reportedP11no
26rs120074114chr19:44948767ACMissensec.122A>Cp.Lys41Thr0.08605VUS17.2511yes
LMF1,
n = 2
27Not registeredchr16:954417ATMissensec.443T>Ap.Met148LysNot reportedVUS23.211no
28rs764885027chr16:869983TCMissensec.1316A>Gp.Tyr439Cys0.004649LP23.123yes
ACMG—American College of Medical Genetics and Genomics/Association for Molecular Pathology; AF—allele frequency; CADD—combined annotation dependent depletion; del—deletion; dup—duplication; fs—frameshift; gnomAD—Genome Aggregation Database; HGVSc—Human Genome Variation Society coding sequence name; HGVSp—Human Genome Variation Society protein; LP—likely pathogenic; P—pathogenic; ter—termination codon; VUS—variant of uncertain significance.
Table A2. Rare APOE variants identified in the study cohort.
Gene, Total No. of VariantsVariant No.VariantGenomic
Coordinates (GRCh38)
Reference
Allele
Alternative
Allele
Variant
Type
HGVScHGVSpTotal AF
gnomAD v4.1.0, %
ACMG
Class
CADD
PHRED v1.7
Carrier
Count
APOE GenotypePreviously Reported
Rare APOE variants,
n = 6
1rs267606664chr19:44908730GAMissensec.434G>Ap.Gly145Asp0.01673LP23.23ε2/ε1yes
2rs121918393chr19:44908756CTMissensec.460C>Tp.Arg154Cys0.005642LP27.55ε3/ε3yes
3Not registeredchr19:44908895GCMissensec.599G>Cp.Gly200AlaNot reportedVUS5.6851ε3/ε3yes
4Not registeredchr19:44908897CTMissensec.601C>Tp.Pro201SerNot reportedVUS16.472ε3/ε3
ε4/ε4
yes
5rs567353589chr19:44908984GAMissensec.688G>Ap.Glu230Lys0.002415LP18.301ε3/ε3yes
6rs770562611chr19:44909216CTMissensec.920C>Tp.Thr307Ile0.0002505VUS10.721ε3/ε3yes
ACMG—American College of Medical Genetics and Genomics/Association for Molecular Pathology; AF—allele frequency; CADD—combined annotation dependent depletion; gnomAD—Genome Aggregation Database; HGVSc—Human Genome Variation Society coding sequence name; HGVSp—Human Genome Variation Society protein sequence name; LP—likely pathogenic; VUS—variant of uncertain significance.

References

  1. Mach, F.; Baigent, C.; Catapano, A.L.; Koskinas, K.C.; Casula, M.; Badimon, L.; Chapman, M.J.; De Backer, G.G.; Delgado, V.; Ference, B.A.; et al. 2019 ESC/EAS Guidelines for the management of dyslipidaemias: Lipid modification to reduce cardiovascular risk: The Task Force for the management of dyslipidaemias of the European Society of Cardiology (ESC) and European Atherosclerosis Society (EAS). Eur. Heart J. 2020, 41, 111–188, Corrigendum in Eur. Heart J. 2020, 41, 4255. https://doi.org/10.1093/eurheartj/ehz455. [Google Scholar]
  2. Ginsberg, H.N.; Packard, C.J.; Chapman, M.J.; Borén, J.; Aguilar-Salinas, C.A.; Averna, M.; Ference, B.A.; Gaudet, D.; Hegele, R.A.; Kersten, S.; et al. Triglyceride-rich lipoproteins and their remnants: Metabolic insights, role in atherosclerotic cardiovascular disease, and emerging therapeutic strategies-a consensus statement from the European Atherosclerosis Society. Eur. Heart J. 2021, 42, 4791–4806. [Google Scholar] [CrossRef] [Scilit]
  3. Hegele, R.A. Approach to the Adult Patient with Chylomicronemia. J. Clin. Endocrinol. Metab. 2026, 111, 845–859. [Google Scholar] [CrossRef] [Scilit] [PubMed]
  4. Chapman, M.J.; Packard, C.J.; Björnson, E.; Ginsberg, H.N.; Borén, J. Triglyceride-rich lipoproteins, remnants and atherosclerotic cardiovascular disease: What we know and what we need to know. Atherosclerosis 2025, 410, 120529. [Google Scholar] [CrossRef] [Scilit] [PubMed]
  5. Varbo, A.; Benn, M.; Tybjærg-Hansen, A.; Jørgensen, A.B.; Frikke-Schmidt, R.; Nordestgaard, B.G. Remnant cholesterol as a causal risk factor for ischemic heart disease. J. Am. Coll. Cardiol. 2013, 61, 427–436, Erratum in J. Am. Coll. Cardiol. 2019, 73, 987–988. https://doi.org/10.1016/j.jacc.2012.08.1026. [Google Scholar] [CrossRef] [Scilit] [PubMed]
  6. Björnson, E.; Adiels, M.; Taskinen, M.R.; Burgess, S.; Rawshani, A.; Borén, J.; Packard, C.J. Triglyceride-rich lipoprotein remnants, low-density lipoproteins, and risk of coronary heart disease: A UK Biobank study. Eur. Heart J. 2023, 44, 4186–4195. [Google Scholar] [CrossRef] [Scilit] [PubMed]
  7. Borén, J.; Packard, C.J.; Binder, C.J. Apolipoprotein B-containing lipoproteins in atherogenesis. Nat. Rev. Cardiol. 2025, 22, 399–413. [Google Scholar] [CrossRef] [Scilit] [PubMed]
  8. Hansen, S.E.J.; Madsen, C.M.; Varbo, A.; Nordestgaard, B.G. Low-grade inflammation in the association between mild-to-moderate hypertriglyceridemia and risk of acute pancreatitis: A study of more than 115000 individuals from the general population. Clin. Chem. 2019, 65, 321–332. [Google Scholar] [CrossRef] [Scilit] [PubMed]
  9. Patel, R.S.; Pasea, L.; Soran, H.; Downie, P.; Jones, R.; Hingorani, A.D.; Neely, D.; Denaxas, S.; Hemingway, H. Elevated plasma triglyceride concentration and risk of adverse clinical outcomes in 1.5 million people: A CALIBER linked electronic health record study. Cardiovasc. Diabetol. 2022, 21, 102. [Google Scholar] [CrossRef] [Scilit] [PubMed]
  10. Fogacci, F.; Cicero, A.F.G. Hypertriglyceridaemia-associated acute pancreatitis: Risk stratification, drivers, and prevention of recurrence. Diseases 2026, 14, 47. [Google Scholar] [CrossRef] [Scilit] [PubMed]
  11. Moulin, P.; Dufour, R.; Averna, M.; Arca, M.; Cefalù, A.B.; Noto, D.; D’Erasmo, L.; Di Costanzo, A.; Marçais, C.; Alvarez-Sala Walther, L.A.; et al. Identification and diagnosis of patients with familial chylomicronaemia syndrome (FCS): Expert panel recommendations and proposal of an “FCS score. Atherosclerosis 2018, 275, 265–272. [Google Scholar] [CrossRef] [Scilit] [PubMed]
  12. Javed, F.; Hegele, R.A.; Garg, A.; Patni, N.; Gaudet, D.; Williams, L.; Khan, M.; Li, Q.; Ahmad, Z. Familial chylomicronemia syndrome: An expert clinical review from the National Lipid Association. J. Clin. Lipidol. 2025, 19, 382–403. [Google Scholar] [CrossRef] [Scilit] [PubMed]
  13. Blokhina, A.V.; Ershova, A.I.; Kiseleva, A.V.; Sotnikova, E.A.; Zharikova, A.A.; Zaicenoka, M.; Vyatkin, Y.V.; Ramensky, V.E.; Kutsenko, V.A.; Garbuzova, E.V.; et al. Spectrum and Prevalence of Rare APOE Variants and Their Association with Familial Dysbetalipoproteinemia. Int. J. Mol. Sci. 2024, 25, 12651. [Google Scholar] [CrossRef] [Scilit] [PubMed]
  14. Heidemann, B.E.; Koopal, C.; Baass, A.; Defesche, J.C.; Zuurbier, L.; Mulder, M.T.; Roeters van Lennep, J.E.; Riksen, N.P.; Boot, C.; Marais, A.D.; et al. Establishing the relationship between familial dysbetalipoproteinemia and genetic variants in the APOE gene. Clin. Genet. 2022, 102, 253–261. [Google Scholar] [CrossRef] [Scilit] [PubMed]
  15. Bea, A.M.; Larrea-Sebal, A.; Marco-Benedi, V.; Uribe, K.B.; Galicia-Garcia, U.; Lamiquiz-Moneo, I.; Laclaustra, M.; Moreno-Franco, B.; Fernandez-Corredoira, P.; Olmos, S.; et al. Contribution of APOE genetic variants to dyslipidemia. Arterioscler. Thromb. Vasc. Biol. 2023, 43, 1066–1077. [Google Scholar] [CrossRef] [Scilit] [PubMed]
  16. Smelt, A.H.M.; De Beer, F. Apolipoprotein E and familial dysbetalipoproteinemia: Clinical, biochemical, and genetic aspects. Semin. Vasc. Med. 2004, 4, 249–257. [Google Scholar] [CrossRef] [Scilit] [PubMed]
  17. Marais, A.D.; Solomon, G.A.; Blom, D.J. Dysbetalipoproteinaemia: A mixed hyperlipidaemia of remnant lipoproteins due to mutations in apolipoprotein E. Crit. Rev. Clin. Lab. Sci. 2014, 51, 46–62. [Google Scholar] [CrossRef] [Scilit] [PubMed]
  18. Blokhina, A.V.; Ershova, A.I.; Meshkov, A.N.; Drapkina, O.M. Familial dysbetalipoproteinemia: Highly atherogenic and underdiagnosed disorder. Cardiovasc. Ther. Prev. 2021, 20, 2893. (In Russian) [Google Scholar] [CrossRef] [Scilit]
  19. Hopkins, P.N.; Wu, L.L.; Hunt, S.C.; Brinton, E.A. Plasma triglycerides and type III hyperlipidemia are independently associated with premature familial coronary artery disease. J. Am. Coll. Cardiol. 2005, 45, 1003–1012. [Google Scholar] [CrossRef] [Scilit] [PubMed]
  20. Blokhina, A.V.; Ershova, A.I.; Kiseleva, A.V.; Sotnikova, E.A.; Zharikova, A.A.; Zaicenoka, M.; Vyatkin, Y.V.; Ramensky, V.E.; Kutsenko, V.A.; Litinskaya, O.A.; et al. Clinical and biochemical features of atherogenic hyperlipidemias with different genetic basis: A comprehensive comparative study. PLoS ONE 2024, 19, e0315693. [Google Scholar] [CrossRef] [Scilit] [PubMed]
  21. Paquette, M.; Trinder, M.; Guay, S.P.; Brunham, L.R.; Baass, A. Predictors of Cardiovascular Disease in Individuals with Dysbetalipoproteinemia: A Prospective Study in the UK Biobank. J. Clin. Endocrinol. Metab. 2025, 110, e1959–e1965. [Google Scholar] [CrossRef] [Scilit] [PubMed]
  22. Pallazola, V.A.; Sathiyakumar, V.; Park, J.; Vakil, R.M.; Toth, P.P.; Lazo-Elizondo, M.; Brown, E.; Quispe, R.; Guallar, E.; Banach, M.; et al. Modern prevalence of dysbetalipoproteinemia (Fredrickson-Levy-Lees type III hyperlipoproteinemia). Arch. Med. Sci. 2019, 16, 993–1003. [Google Scholar] [CrossRef] [Scilit] [PubMed]
  23. Blokhina, A.V.; Ershova, A.I.; Kiseleva, A.V.; Sotnikova, E.A.; Zharikova, A.A.; Zaicenoka, M.; Vyatkin, Y.V.; Ramensky, V.E.; Kutsenko, V.A.; Shalnova, S.A.; et al. Applicability of Diagnostic Criteria and High Prevalence of Familial Dysbetalipoproteinemia in Russia: A Pilot Study. Int. J. Mol. Sci. 2023, 24, 13159. [Google Scholar] [CrossRef] [Scilit] [PubMed]
  24. Paquette, M.; Trinder, M.; Guay, S.P.; Brunham, L.R.; Baass, A. Prevalence of Dysbetalipoproteinemia in the UK Biobank According to Different Diagnostic Criteria. J. Clin. Endocrinol. Metab. 2024, 110, 703–709. [Google Scholar] [CrossRef] [Scilit] [PubMed]
  25. Dron, J.S.; Wang, J.; Cao, H.; McIntyre, A.D.; Iacocca, M.A.; Menard, J.R.; Movsesyan, I.; Malloy, M.J.; Pullinger, C.R.; Kane, J.P.; et al. Severe hypertriglyceridemia is primarily polygenic. J. Clin. Lipidol. 2019, 13, 80–88. [Google Scholar] [CrossRef] [Scilit] [PubMed]
  26. Dron, J.S.; Wang, J.; McIntyre, A.D.; Cao, H.; Hegele, R.A. The polygenic nature of mild-to-moderate hypertriglyceridemia. J. Clin. Lipidol. 2020, 14, 28–34.e2. [Google Scholar] [CrossRef] [Scilit] [PubMed]
  27. Dron, J.S.; Wang, J.; McIntyre, A.D.; Iacocca, M.A.; Robinson, J.F.; Ban, M.R.; Cao, H.; Hegele, R.A. Six years’ experience with LipidSeq: Clinical and research learnings from a hybrid, targeted sequencing panel for dyslipidemias. BMC Med. Genom. 2020, 13, 23. [Google Scholar] [CrossRef] [Scilit] [PubMed]
  28. Dron, J.S.; Hegele, R.A. Genetics of hypertriglyceridemia. Front. Endocrinol. 2020, 11, 455. [Google Scholar] [CrossRef] [Scilit] [PubMed]
  29. Blokhina, A.V.; Ershova, A.I.; Kiseleva, A.V.; Sotnikova, E.A.; Zaicenoka, M.; Zharikova, A.A.; Vyatkin, Y.V.; Ramensky, V.E.; Novokhatskaya, E.A.; Borisova, A.L.; et al. Genetic and metabolic factors of familial dysbetalipoproteinemia phenotype: Insights from a cross-sectional study. Int. J. Mol. Sci. 2025, 26, 7376. [Google Scholar] [CrossRef] [Scilit] [PubMed]
  30. De Luca, C.; Ciciola, P.; D’Errico, G.; Di Taranto, M.D.; Fortunato, G.; Gross, C.; Garn, J.; Iannuzzo, G.; Di Minno, M.; Calcaterra, I. Genetic assessment and clinical correlates in severe hypertriglyceridemia: A systematic review. Genes 2025, 16, 1377. [Google Scholar] [CrossRef] [Scilit] [PubMed]
  31. Surendran, R.P.; Visser, M.E.; Heemelaar, S.; Wang, J.; Peter, J.; Defesche, J.C.; Kuivenhoven, J.A.; Hosseini, M.; Péterfy, M.; Kastelein, J.J.; et al. Mutations in LPL, APOC2, APOA5, GPIHBP1 and LMF1 in patients with severe hypertriglyceridaemia. J. Intern. Med. 2012, 272, 185–196. [Google Scholar] [CrossRef] [Scilit] [PubMed]
  32. Gill, P.K.; Dron, J.S.; Dilliott, A.A.; McIntyre, A.D.; Cao, H.; Wang, J.; Movsesyan, I.G.; Malloy, M.J.; Pullinger, C.R.; Kane, J.P.; et al. Ancestry-specific profiles of genetic determinants of severe hypertriglyceridaemia. J. Clin. Lipidol. 2021, 15, 88–96. [Google Scholar] [CrossRef] [Scilit] [PubMed]
  33. Bashir, B.; Downie, P.; Forrester, N.; Wierzbicki, A.S.; Dawson, C.; Jones, A.; Jenkinson, F.; Mansfield, M.; Datta, D.; Delaney, H.; et al. Ethnic diversity and distinctive features of familial versus multifactorial chylomicronemia syndrome: Insights from the UK FCS National Registry. Arterioscler. Thromb. Vasc. Biol. 2024, 44, 2334–2346. [Google Scholar] [CrossRef] [Scilit] [PubMed]
  34. Bashir, B.; Forrester, N.; Downie, P.; Marsh, S.; Dent, C.; Wierzbicki, A.S.; Dawson, C.; Schofield, J.; Jenkinson, F.; Mansfield, M.; et al. Rare variant genetic landscape of familial chylomicronemia syndrome (FCS) in the United Kingdom. Genet. Med. Open 2025, 3, 103445. [Google Scholar] [CrossRef] [Scilit] [PubMed]
  35. D’Erasmo, L.; Tramontano, D.; Di Costanzo, A.; Casula, M.; Galimberti, F.; Baratta, F.; Cefalù, A.B.; Tarugi, P.M.; Calandra, S.; Zambon, A.; et al. Contemporary management of familial and multifactorial chylomicronemia syndromes in Italy: Insights from the national LIPIGEN registry. Arterioscler. Thromb. Vasc. Biol. 2025, 45, 2264–2276. [Google Scholar] [CrossRef] [Scilit] [PubMed]
  36. Abedi, A.H.; Yıldırım Şimşir, I.; Bayram, F.; Onay, H.; Özgür, S.; McIntyre, A.D.; Toth, P.P.; Hegele, R.A. Genetic variants associated with severe hypertriglyceridemia: LPL, APOC2, APOA5, GPIHBP1, LMF1, and APOE. Turk. Kardiyol. Dern. Ars. 2023, 51, 10–21. [Google Scholar] [CrossRef] [Scilit] [PubMed]
  37. Kurguzova, E.A.; Mironova, Y.D.; Ivanova, O.N.; Chubykina, U.V.; Sergienko, I.V.; Gurtziev, T.M.; Ezhov, M.V.; Zakharova, E.Y.; Vasiliev, P.A. CREB3L3-associated hypertriglyceridemia: A significant contribution to the spectrum of monogenic dyslipidemias in the Russian population. Med. Genet. 2025, 24, 88–96. [Google Scholar] [CrossRef]
  38. Paquette, M.; Amyot, J.; Fantino, M.; Baass, A.; Bernard, S. Rare variants in triglycerides-related genes increase pancreatitis risk in multifactorial chylomicronemia syndrome. J. Clin. Endocrinol. Metab. 2021, 106, e3473–e3482. [Google Scholar] [CrossRef] [Scilit] [PubMed]
  39. Spagnuolo, C.M.; Wang, J.; McIntyre, A.D.; Kennedy, B.A.; Hegele, R.A. Comparison of patients with familial chylomicronemia syndrome and multifactorial chylomicronemia syndrome. J. Clin. Endocrinol. Metab. 2025, 110, 1158–1165. [Google Scholar] [CrossRef] [Scilit] [PubMed]
  40. Zaicenoka, M.; Ramensky, V.E.; Kiseleva, A.V.; Bukaeva, A.A.; Blokhina, A.V.; Ershova, A.I.; Meshkov, A.N.; Drapkina, O.M. On Penetrance Estimation in Family, Clinical, and Population Cohorts. Circ. Genom. Precis. Med. 2025, 18, e004816. [Google Scholar] [CrossRef] [Scilit] [PubMed]
  41. Guay, S.P.; Paquette, M.; Taschereau, A.; Girard, L.; Desgagné, V.; Bouchard, L.; Bernard, S.; Baass, A. Acute pancreatitis risk in multifactorial chylomicronemia syndrome depends on the molecular cause of severe hypertriglyceridemia. Atherosclerosis 2024, 392, 117489. [Google Scholar] [CrossRef] [Scilit] [PubMed]
  42. Kopylova, O.V.; Ershova, A.I.; Pokrovskaya, M.S.; Meshkov, A.N.; Efimova, I.A.; Serebryanskaya, Z.Z.; Blokhina, A.V.; Borisova, A.L.; Kondratskaya, V.A.; Limonova, A.S.; et al. Population-nosological research biobank of the National Medical Research Center for Therapy and Preventive Medicine: Analysis of biosamples, principles of collecting and storing information. Cardiovasc. Ther. Prev. 2021, 20, 3119. (In Russian) [Google Scholar] [CrossRef] [Scilit]
  43. Poterba, T.; Vittal, C.; King, D.; Goldstein, D.; Goldstein, J.I.; Schultz, P.; Karczewski, K.J.; Seed, C.; Neale, B.M. The scalable variant call representation: Enabling genetic analysis beyond one million genomes. Bioinformatics 2024, 41, btae746. [Google Scholar] [CrossRef] [Scilit] [PubMed]
  44. gnomAD Browser. Available online: https://gnomad.broadinstitute.org (accessed on 27 November 2025).
  45. Richards, S.; Aziz, N.; Bale, S.; Bick, D.; Das, S.; Gastier-Foster, J.; Grody, W.W.; Hegde, M.; Lyon, E.; Spector, E.; et al. Standards and guidelines for 321 the interpretation of sequence variants: A joint consensus recommendation of the American 322 College of Medical Genetics and Genomics and the Association for Molecular Pathology. Genet. Med. 2015, 17, 405–423. [Google Scholar] [CrossRef] [Scilit] [PubMed]
  46. Schubach, M.; Maass, T.; Nazaretyan, L.; Röner, S.; Kircher, M. CADD v1.7: Using protein language models, regulatory CNNs and other nucleotide-level scores to improve genome-wide variant predictions. Nucleic Acids Res. 2024, 52, D1143–D1154. [Google Scholar] [CrossRef] [Scilit] [PubMed]
  47. CADD—Combined Annotation Dependent Depletion. Available online: https://cadd.gs.washington.edu/ (accessed on 11 March 2026).
  48. Willer, C.J.; Schmidt, E.M.; Sengupta, S.; Peloso, G.M.; Gustafsson, S.; Kanoni, S.; Ganna, A.; Chen, J.; Buchkovich, M.L.; Mora, S. Discovery and refinement of loci associated with lipid levels. Nat. Genet. 2013, 45, 1274–1283. [Google Scholar] [CrossRef] [Scilit] [PubMed]
  49. Zaicenoka, M.; Ershova, A.I.; Kiseleva, A.V.; Blokhina, A.V.; Kutsenko, V.A.; Sotnikova, E.A.; Zharikova, A.A.; Vyatkin, Y.V.; Pokrovskaya, M.S.; Shalnova, S.A.; et al. Blood Lipid Polygenic Risk Score Development and Application for Atherosclerosis Ultrasound Parameters. Biomedicines 2024, 12, 2798. [Google Scholar] [CrossRef] [Scilit] [PubMed]
  50. GOST R 52379-2005; Good Clinical Practice (GCP). Standartinform: Moscow, Russian, 2005.
  51. R Development Core Team. R: A Language and Environment for Statistical Computing; R Foundation for Statistical Computing: Vienna, Austria, 2013; Available online: https://www.R-project.org/ (accessed on 16 February 2026).
  52. Heinze, G.; Ploner, M.; Jiricka, L.; Steiner, G.; Dunkler, D.; Southworth, H. logistf: Firth’s Bias-Reduced Logistic Regression; R Package Version 1.26.1. 2025. Available online: https://CRAN.R-project.org/package=logistf (accessed on 16 February 2026).
  53. Wickham, H. GGPLOT2: Elegant Graphics for Data Analysis; Springer: New York, NY, USA, 2016; p. 3. [Google Scholar]
  54. Pedersen, T. patchwork: The Composer of Plots. R Package Version 1.3.2.9000. 2025. Available online: https://patchwork.data-imaginist.com (accessed on 31 March 2026).
  55. Chen, H.; Boutros, P.C. VennDiagram: A package for the generation of highly-customizable Venn and Euler diagrams in R. BMC Bioinform. 2011, 12, 35. [Google Scholar] [CrossRef] [Scilit]
Figure 1. Genetic spectrum of rare variants in chylomicronemia genes and APOE and the ε2/ε2 genotype: (A) The inner rings represent patients carrying variants in five chylomicronemia genes and those with rare variants in APOE or the ε2/ε2 genotype. The outer ring indicates the number of patients carrying each variant. Because some patients had multiple genetic findings, the sum of variant-specific carriers exceeds the total number of affected individuals. Novel variants (n = 10) are highlighted in red. * indicates pathogenic or likely pathogenic variants. (B) Distribution of rare variants across chylomicronemia genes and APOE, stratified by pathogenicity. VUS—variant of uncertain significance.
Ijms 27 05443 g001
Figure 2. Distribution of genotypes among carriers of chylomicronemia gene variants. The donut chart shows the spectrum of genotypes. The patient–gene matrix details all 30 carriers by genes, indicating genotype and variant pathogenicity. Carrier IDs are color-coded according to the genotype-based stratification: red indicates individuals meeting genetic criteria for FCS (biallelic or double-heterozygous pathogenic or likely pathogenic variants in chylomicronemia genes), and blue indicates variant-positive MCS (a single heterozygous variant or a heterozygous pathogenic or likely pathogenic variant together with an additional VUS in chylomicronemia genes). * indicates an additional heterozygous variant in APOA5 in a patient homozygous for a pathogenic LPL variant. VUS—variant of uncertain significance.
Ijms 27 05443 g002
Figure 3. Distribution of 123 patients with severe HTG according to PRS percentiles and genetic status. The donut chart illustrates the spectrum of identified genetic determinants of HTG. Stacked bar plots show the distribution of patients across PRS percentiles (0–100). Bar height represents the total number of patients per percentile, while colored segments indicate the number of patients within each category. Blue background shading, increasing in intensity, indicates PRS percentile groups: <10, 10–19, 20–49, 50–79, 80–89, and 90–100. Horizontal boxplots summarize PRS percentile distributions according to rare genetic determinants of HTG: central lines indicate medians, box limits represent upper and lower quartiles, and horizontal lines represent 1.5 times the quartile range. Median (25th; 75th percentiles) is labeled above each boxplot. Group differences were assessed using the Mann–Whitney U test; ΔMe and 95% CI were estimated via the Hodges–Lehmann method. ΔMe—median difference; PRS—polygenic risk score; TG—triglycerides.
Ijms 27 05443 g003
Figure 4. Overlap between chylomicronemia gene variants, APOE, and an extreme PRS. The Venn diagram shows the number of patients carrying variants in chylomicronemia genes, APOE, or both. PRS > 90th percentile, isolated or in combination with rare chylomicronemia variants or APOE (including ε2/ε2), are also indicated. The patient–gene matrix details the genetic spectrum of the five overlap cases, including involved genes, specific variants, zygosity, and variant classification.
Ijms 27 05443 g004
Figure 5. Genetic groups for comparison of clinical characteristics and TG-PRS. FCS—familial chylomicronemia syndrome; FD—familial dysbetalipoproteinemia; HTG—hypertriglyceridemia; LP—likely pathogenic; MCS—multifactorial familial chylomicronemia syndrome; P—pathogenic; PRS—polygenic risk score; TG—triglycerides; VUS—variant of uncertain significance.
Ijms 27 05443 g005
Figure 6. Distribution of TG levels across genetic groups. Boxplots show medians (white dots), first and third quartiles (lower and upper box limits), and whiskers represent 1.5 times the quartile range. Black dots represent outliers. Group comparisons were performed using a robust linear model on log2-transformed TG levels, adjusted for sex, age, and LLT. Pairwise comparisons between groups were based on estimated marginal means and are presented as back-transformed ratios. Only significant differences (p < 0.05) are indicated. Statistical significance annotations (connecting brackets and p-values) are color-coded according to the corresponding group. p-values are not corrected for multiple comparisons. Holm–Bonferroni-adjusted p-values are provided in Supplementary Table S2. FCS—familial chylomicronemia syndrome; FD—familial dysbetalipoproteinemia; HTG—hypertriglyceridemia; MCS—multifactorial familial chylomicronemia syndrome; PRS—polygenic risk score; TG—triglycerides.
Ijms 27 05443 g006
Figure 7. Pancreatitis risk: FCS vs. other genetic HTG groups. FCS was used as the index group for interpretation. The vertical dashed line indicates the null effect (odds ratio = 1). Odds ratios (red dots) and 95% CI were estimated using Firth penalized logistic regression adjusted for sex and age. Pairwise comparisons were obtained within the same model framework by varying the reference category. p-values are based on Firth profile likelihood tests from the covariate-adjusted model. p-values are unadjusted for multiple comparisons. Holm–Bonferroni-adjusted p-values are provided in Supplementary Table S2. CI—confidence interval; FCS—familial chylomicronemia syndrome; FD—familial dysbetalipoproteinemia; HTG—hypertriglyceridemia; MCS—multifactorial familial chylomicronemia syndrome; PRS—polygenic risk score.
Ijms 27 05443 g007
Figure 8. Distribution of PRS percentiles across genetic groups. Boxplots show medians (white dots), first and third quartiles (lower and upper box limits), and whiskers represent 1.5 times the quartile range. Individual PRS values are shown as black dots, patients with PRS > 90th percentile (red dash line) are highlighted in red. Pairwise comparisons were performed using the Mann–Whitney U test. Only significant differences (p < 0.05) are indicated. Statistical significance annotations (connecting brackets and p-values) are color-coded according to the corresponding group. p-values are unadjusted for multiple comparisons. Holm–Bonferroni-adjusted p-values are provided in Supplementary Table S2. FCS—familial chylomicronemia syndrome; FD—familial dysbetalipoproteinemia; MCS—multifactorial familial chylomicronemia syndrome; Me—median; PRS—polygenic risk score; TG—triglycerides.
Ijms 27 05443 g008
Table 1. Clinical and demographic characteristics.
ParameterTotal Cohort
(n = 123)
TG > 5.0 to 10.0 mmol/L
(n = 34)
TG > 10.0 mmol/L
(n = 89)
Men, n (%)73 (59.3)24 (70.6)49 (55.1)
Age, years,
Me (Q1; Q3)
48
(41; 54)
47
(37; 56)
49
(42; 53)
Smoking (current or former smokers), n (%)59 (50.0)
n = 118
19 (59.4)
n = 32
40 (46.5)
n = 86
Hypertension, n (%)77 (63.1)
n = 122
22 (66.7)
n = 33
55 (61.8)
BMI, kg/m2,
Me (Q1; Q3)
29.0
(26.4; 32.0)
n = 121
29.6
(25.5; 34.6)
n = 33
28.8
(26.6; 31.6)
n = 88
Glucose metabolism disorders, n (%) 147 (38.2)11 (32.4)36 (40.4)
Metabolic syndrome components, n (%) 242 (35.0)
n = 120
15 (46.9)
n = 32
27 (30.7)
n = 88
Cutaneous xanthomas, n (%)21 (19.3)
n = 109
4 (14.3)
n = 28
17 (21.0)
n = 81
Pancreatitis, n (%)30 (25.9)
n = 116
2 (6.5)
n = 31
28 (32.9)
n = 85
CAD, n (%)29 (23.6)12 (35.3)17 (19.1)
Age at onset of CAD, years, Me (Q1; Q3)48
(39; 54)
37
(36; 53)
48
(46; 54)
Maximal TG, mmol/L,
Me (Q1; Q3) 3
14.80
(9.70; 23.10)
7.78
(6.03; 9.06)
19.80
(14.10; 26.30)
LLT, n (%) 429 (23.6)12 (35.3)17 (19.1)
1 Glucose metabolism disorders included type 2 diabetes, impaired glucose tolerance, and impaired fasting glucose. 2 Metabolic syndrome components included at least two of the following: hypertension, BMI ≥ 30.0 kg/m2, or glucose metabolism disorders. 3 Highest documented fasting TG value available in the medical record for each participant. 4 Any LLT at the time of inclusion. BMI—body mass index; CAD—coronary artery disease; LLT—lipid-lowering therapy; Me—median; TG—triglycerides.
Table 2. Clinical and demographic characteristics across five genetic groups.
ParameterModerate-to-Low PRS
(n = 43)
Polygenic HTG
(n = 32)
MCS
(n = 21)
FCS
(n = 7)
FD
(n = 20)
p-Value 1
Men, n (%)23 (53.5)22 (68.8)15 (71.4)2 (28.6)11 (55.0)0.215
Age, years,
Me (Q1; Q3)
49 (41; 54)47 (41; 54)48 (41; 55)46 (37; 51)48 (39; 52)0.904
Smoking (current or former smokers),
n (%)
18 (46.2)
n = 39
19 (61.3)
n = 31
13 (61.9)1 (14.3)8 (40.0)0.124
Hypertension, n (%)28 (66.7)
n = 42
23 (71.9)14 (66.7)3 (42.9)9 (45.0)0.251
BMI, kg/m2,
Me (Q1; Q3)
29.6
(27.8; 34.5)
29.2
(27.0; 32.2)
28.0
(25.0; 31.0)
23.0
(19.6; 27.2)
29.1
(26.6; 31.8)
0.022
Glucose metabolism disorders, n (%) 218 (41.9)11 (34.4)9 (42.9)3 (42.9)6 (30.0)0.872
Metabolic syndrome components, n (%) 316 (40.0)
n = 40
12 (37.5)6 (28.6)1 (14.3)7 (35.0)0.749
Cutaneous xanthomas, n (%)10 (26.3)
n = 38
4 (14.3)
n = 28
2 (10.5)
n = 19
0
n = 5
5 (26.3)
n = 19
0.431
Pancreatitis, n (%)13 (33.3)
n = 39
6 (19.4)
n = 31
4 (20.0)
n = 20
5 (83.3)
n = 6
2 (10.0)0.008
CAD, n (%)14 (32.6)5 (15.6)4 (19.0)1 (14.3)5 (25.0)0.508
LLT, n (%) 410 (23.3)4 (12.5)7 (33.3)3 (42.9)5 (25.0)0.270
1 p-values indicate differences between five groups. The Kruskal–Wallis test was used for continuous variables. For categorical variables, p-values were obtained using the two-sided Fisher’s exact test. 2 Glucose metabolism disorders included type 2 diabetes, impaired glucose tolerance, and impaired fasting glucose. 3 Metabolic syndrome components included at least two of the following: hypertension, BMI ≥ 30.0 kg/m2, or glucose metabolism disorders. 4 Any LLT at the time of inclusion. BMI—body mass index; CAD—coronary artery disease; FCS—familial chylomicronemia syndrome; FD—familial dysbetalipoproteinemia; HTG—hypertriglyceridemia; LLT—lipid-lowering therapy; MCS—multifactorial familial chylomicronemia syndrome; Me—median; PRS—polygenic risk score.
Disclaimer/Publisher’s Note: The statements, opinions and data contained in all publications are solely those of the individual author(s) and contributor(s) and not of MDPI and/or the editor(s). MDPI and/or the editor(s) disclaim responsibility for any injury to people or property resulting from any ideas, methods, instructions or products referred to in the content.