Review

Roles of Metabolomics in Allergic Rhinitis: From Cell to Bedside Investigations

by
Pongsathorn Saligupta
1,
Mongkol Lao-Araya
1,
Siriporn C. Chattipakorn
2,3,4,
Nipon Chattipakorn
2,3,5,6 and
Chanisa Thonusin
2,3,5,*
1
Division of Allergy and Immunology, Department of Pediatrics, Faculty of Medicine, Chiang Mai University, Chiang Mai 50200, Thailand
2
Cardiac Electrophysiology Research and Training Center, Faculty of Medicine, Chiang Mai University, Chiang Mai 50200, Thailand
3
Center of Excellence in Cardiac Electrophysiology Research, Chiang Mai University, Chiang Mai 50200, Thailand
4
Department of Oral Biology and Diagnostic Sciences, Faculty of Dentistry, Chiang Mai University, Chiang Mai 50200, Thailand
5
Cardiac Electrophysiology Unit, Department of Physiology, Faculty of Medicine, Chiang Mai University, Chiang Mai 50200, Thailand
6
The Academy of Science, The Royal Society of Thailand, Bangkok 10300, Thailand
*
Author to whom correspondence should be addressed.
Int. J. Mol. Sci. 2026, 27(11), 5064; https://doi.org/10.3390/ijms27115064
Submission received: 6 May 2026 / Revised: 27 May 2026 / Accepted: 2 June 2026 / Published: 3 June 2026
(This article belongs to the Section Molecular Endocrinology and Metabolism)

Abstract

Alterations in various metabolic pathways observed in patients with allergies suggest that metabolomics offer a precise and comprehensive approach for the diagnosis of allergic diseases and the monitoring of the efficacy of allergen immunotherapy. The purpose of this review is to provide a comprehensive assessment of the existing evidence regarding metabolomic changes in allergic rhinitis and allergen immunotherapy. The PubMed database search was conducted from inception to December 2025. A narrative synthesis was performed. A total of 16 studies were included. Several metabolic pathways are affected in allergic rhinitis, including amino acid metabolism, fatty acid oxidation, and phospholipid metabolism. Additionally, fatty acids, diacylglycerols, and lysophosphatidylcholines have emerged as potential diagnostic and severity biomarkers for allergic rhinitis. Allergen immunotherapy has also been shown to modulate these metabolic disturbances. Notably, arachidonic acid, linolenic acid, and sphingosine may serve as indicators of therapeutic efficacy. In conclusion, AR is characterized by distinct metabolic alterations and mainly associated with alterations in lipid metabolism. AIT has been shown to modulate metabolic disturbances in AR. Future research should focus on integrating metabolomics with clinical and other molecular approaches to enhance clinical applicability in AR.

1. Introduction

Allergic rhinitis (AR) is a common atopic disorder characterized by chronic inflammation of the nasal mucosa due to an exaggerated immune response to environmental allergens [1]. Clinically, AR presents with various symptoms including sneezing, nasal congestion, clear rhinorrhea, and nasal pruritus [2].
Allergen immunotherapy (AIT) is a recommended treatment option for patients with moderate to severe AR [3]. AIT involves the administration of specific allergens via sublingual or subcutaneous routes, with the goal of modulating the immune system to prevent type 2 inflammatory responses being triggered by allergen exposure [4]. AIT inhibit activation and degranulation of mast cells and basophils, resulting in improvement in clinical symptoms, reduced medication use, and sustained therapeutic effects even after treatment cessation [4,5].
Metabolomics is an emerging field within systems biology that focuses on the comprehensive analysis of groups of metabolites, or metabolomes, within biological samples [6]. However, the metabolic alterations underlying AR and those occurring in response to AIT remain incompletely understood.
This review aims to provide an overview of the current applications of metabolomics in AR, with a focus on its potential utility in diagnosis, severity assessment, and monitoring responses to AIT. By integrating metabolomics data with clinical phenotypes and other molecular modalities, we aim to highlight the potential of a metabolomics-based approach in improving the clinical management of AR.
Identified studies were categorized into four key areas, including the following: (1) metabolome alterations in AR, (2) metabolomes and metabolic pathways as diagnostic and severity markers for AR, (3) metabolome alterations following AIT in AR, and (4) metabolomes and metabolic pathways as AIT response markers for AR.
A literature search of the PubMed database was conducted from July 2024 to December 2025 to identify studies published within the previous 10 years. The search strategy included the following terms: “allergen immunotherapy”, “allergic rhinitis”, “allergy”, “metabolites”, “metabolome”, and “metabolomics”.
Studies were included if they (1) were published in English, (2) were published between 2015 and 2025, and (3) reported metabolomic changes in patients with AR or individuals receiving AIT. Studies were excluded if they were systematic reviews, narrative reviews, review articles, opinion pieces, summaries, studies unrelated to AR metabolomics, or studies lacking original metabolomic data.
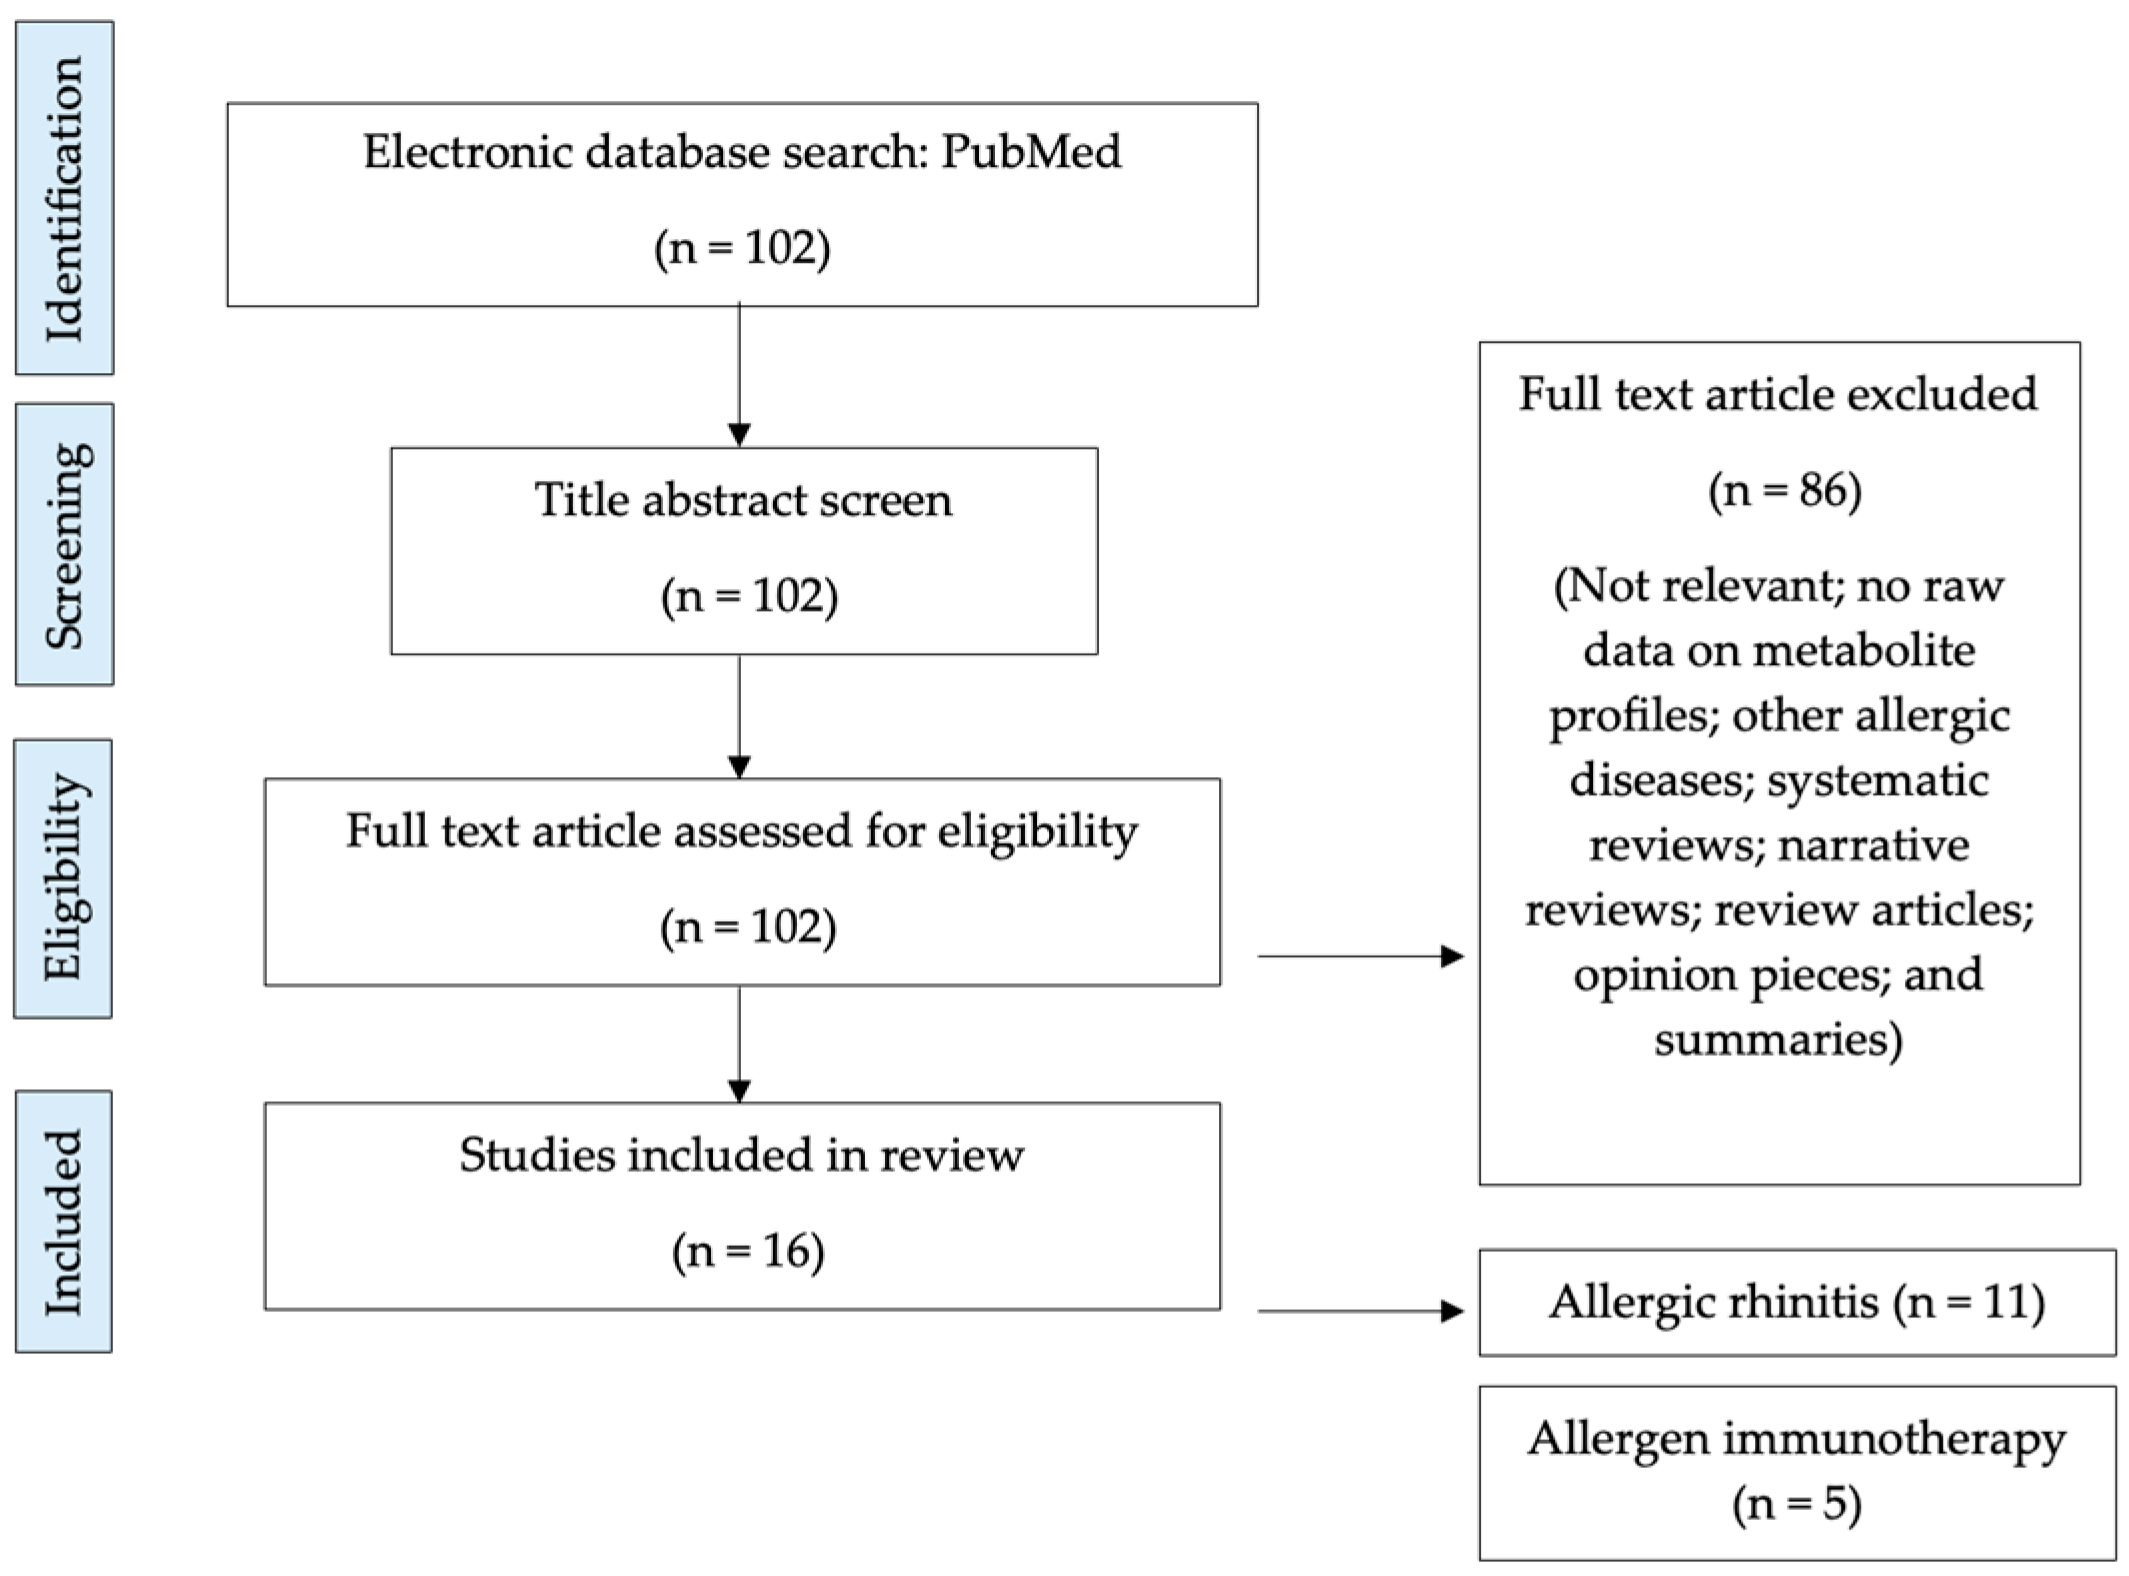
Studies were further evaluated according to methodological clarity, adequacy of metabolomic analysis, and relevance to the objectives of this review. Discrepancies were resolved through discussion and consensus. A total of 102 records were identified, of which 16 studies met the inclusion criteria and were included in the narrative synthesis. A flow chart summarizing the study selection process and reasons for exclusion was added to the manuscript (Figure 1).

2. Alterations in Metabolome in Allergic Rhinitis

In the context of AR, eleven metabolomics studies reported significant changes in metabolome profiles. Among these, one was an in vitro study [7], two were in vivo studies [8,9] while the remaining eight were clinical studies [10,11,12,13,14,15,16,17].
In AR, sensitization begins following exposure to allergens, which stimulate the airway epithelium to release alarmins such as thymic stromal lymphopoietin (TSLP), interleukin (IL)-25, and IL-33. These cytokines activate type 2 innate lymphoid cells (ILC2s) and promote dendritic cell-mediated allergen presentation, leading to B-cell activation and immunoglobulin E (IgE) production. Subsequently, IgE binds to high-affinity FcεRI receptors on mast cells and basophils. Upon re-exposure to the allergen, cross-linking of IgE–FcεRI complexes triggers the release of inflammatory mediators, including histamine, prostaglandin D2 (PGD2), leukotriene E4 (LTE4), and leukotriene D4 (LTD4) [18].
These immunologic and inflammatory responses are closely associated with metabolomic alterations observed in AR. The generation of prostaglandins and leukotrienes directly reflects activation of arachidonic acid (AA) and other lipid metabolic pathways, resulting in disturbances in phospholipid, fatty acid, and sphingolipid metabolism [19]. In addition, chronic type 2 inflammation and immune-cell activation increase energy consumption, oxidative stress, and protein turnover [20], thereby contributing to alterations in amino acid metabolism, including pathways related to arginine, ornithine, glycine, and branched-chain amino acids. Collectively, these inflammatory and metabolic interactions suggest that AR is not only an airway inflammatory disorder but also a condition associated with systemic metabolic dysregulation. Although metabolomic findings were heterogeneous across studies, several significant and consistent alterations in lipid metabolism, amino acid metabolism, and inflammation-related pathways have been identified and are discussed in the following sections.
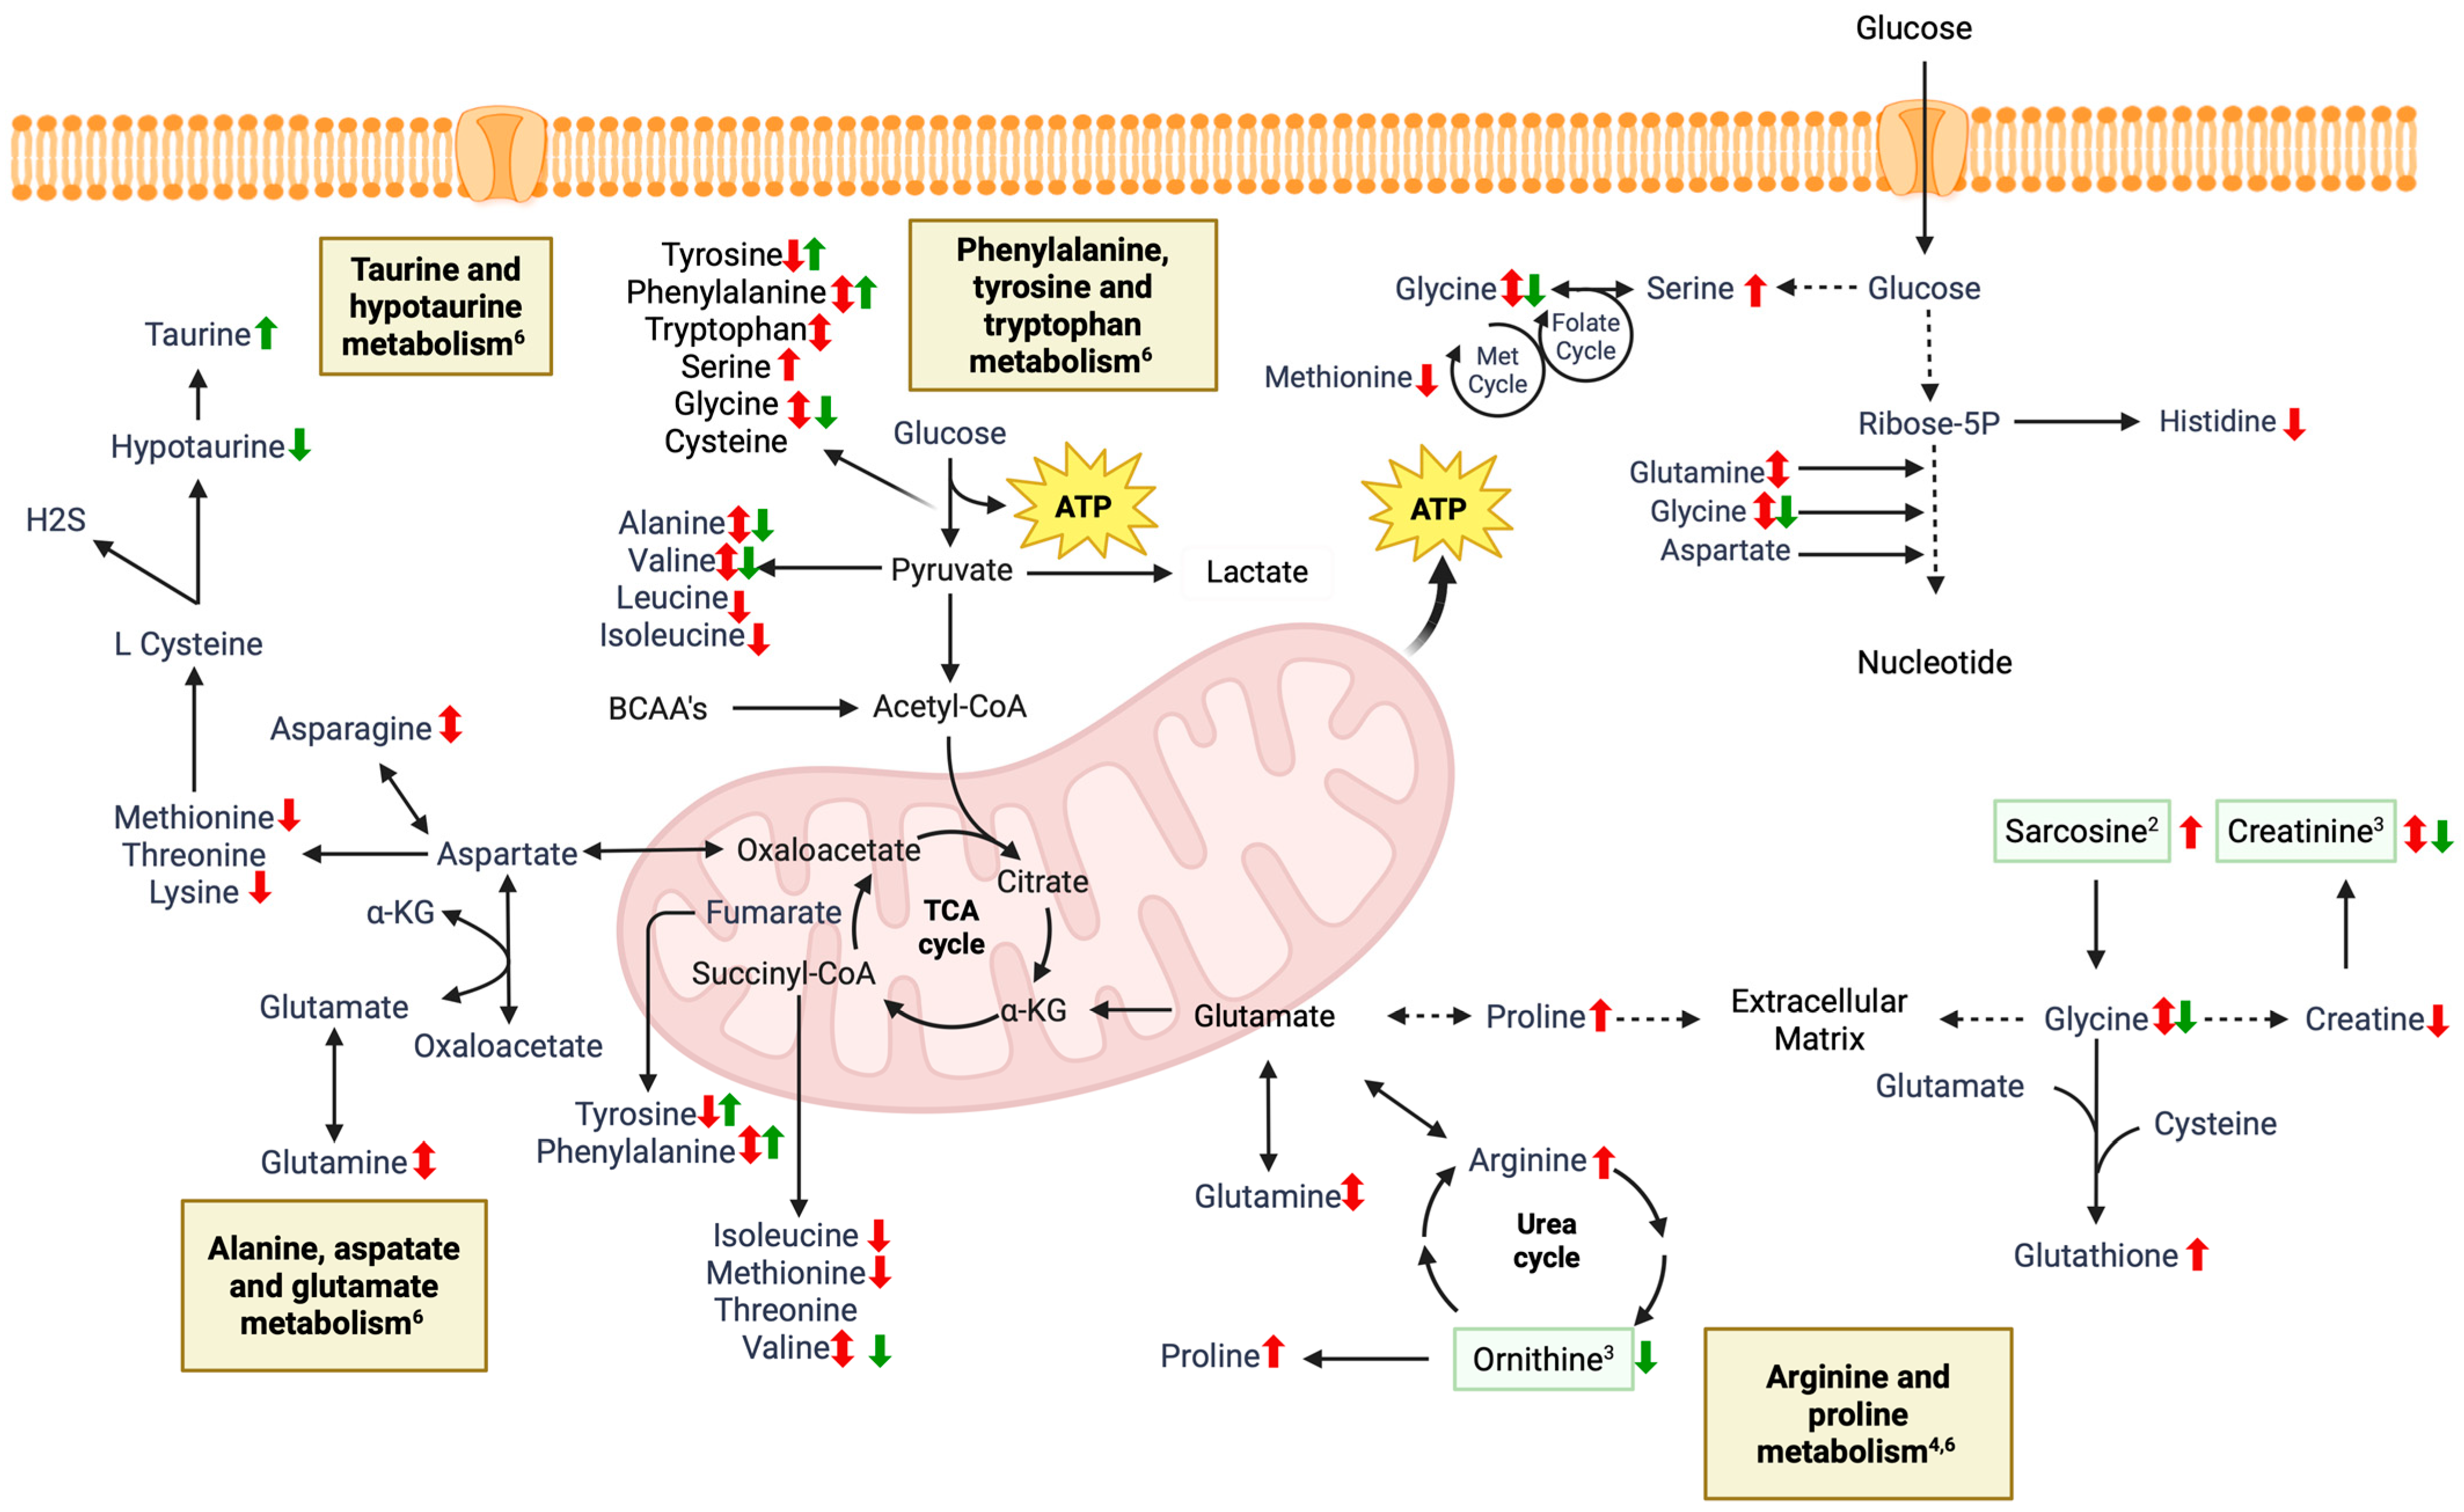
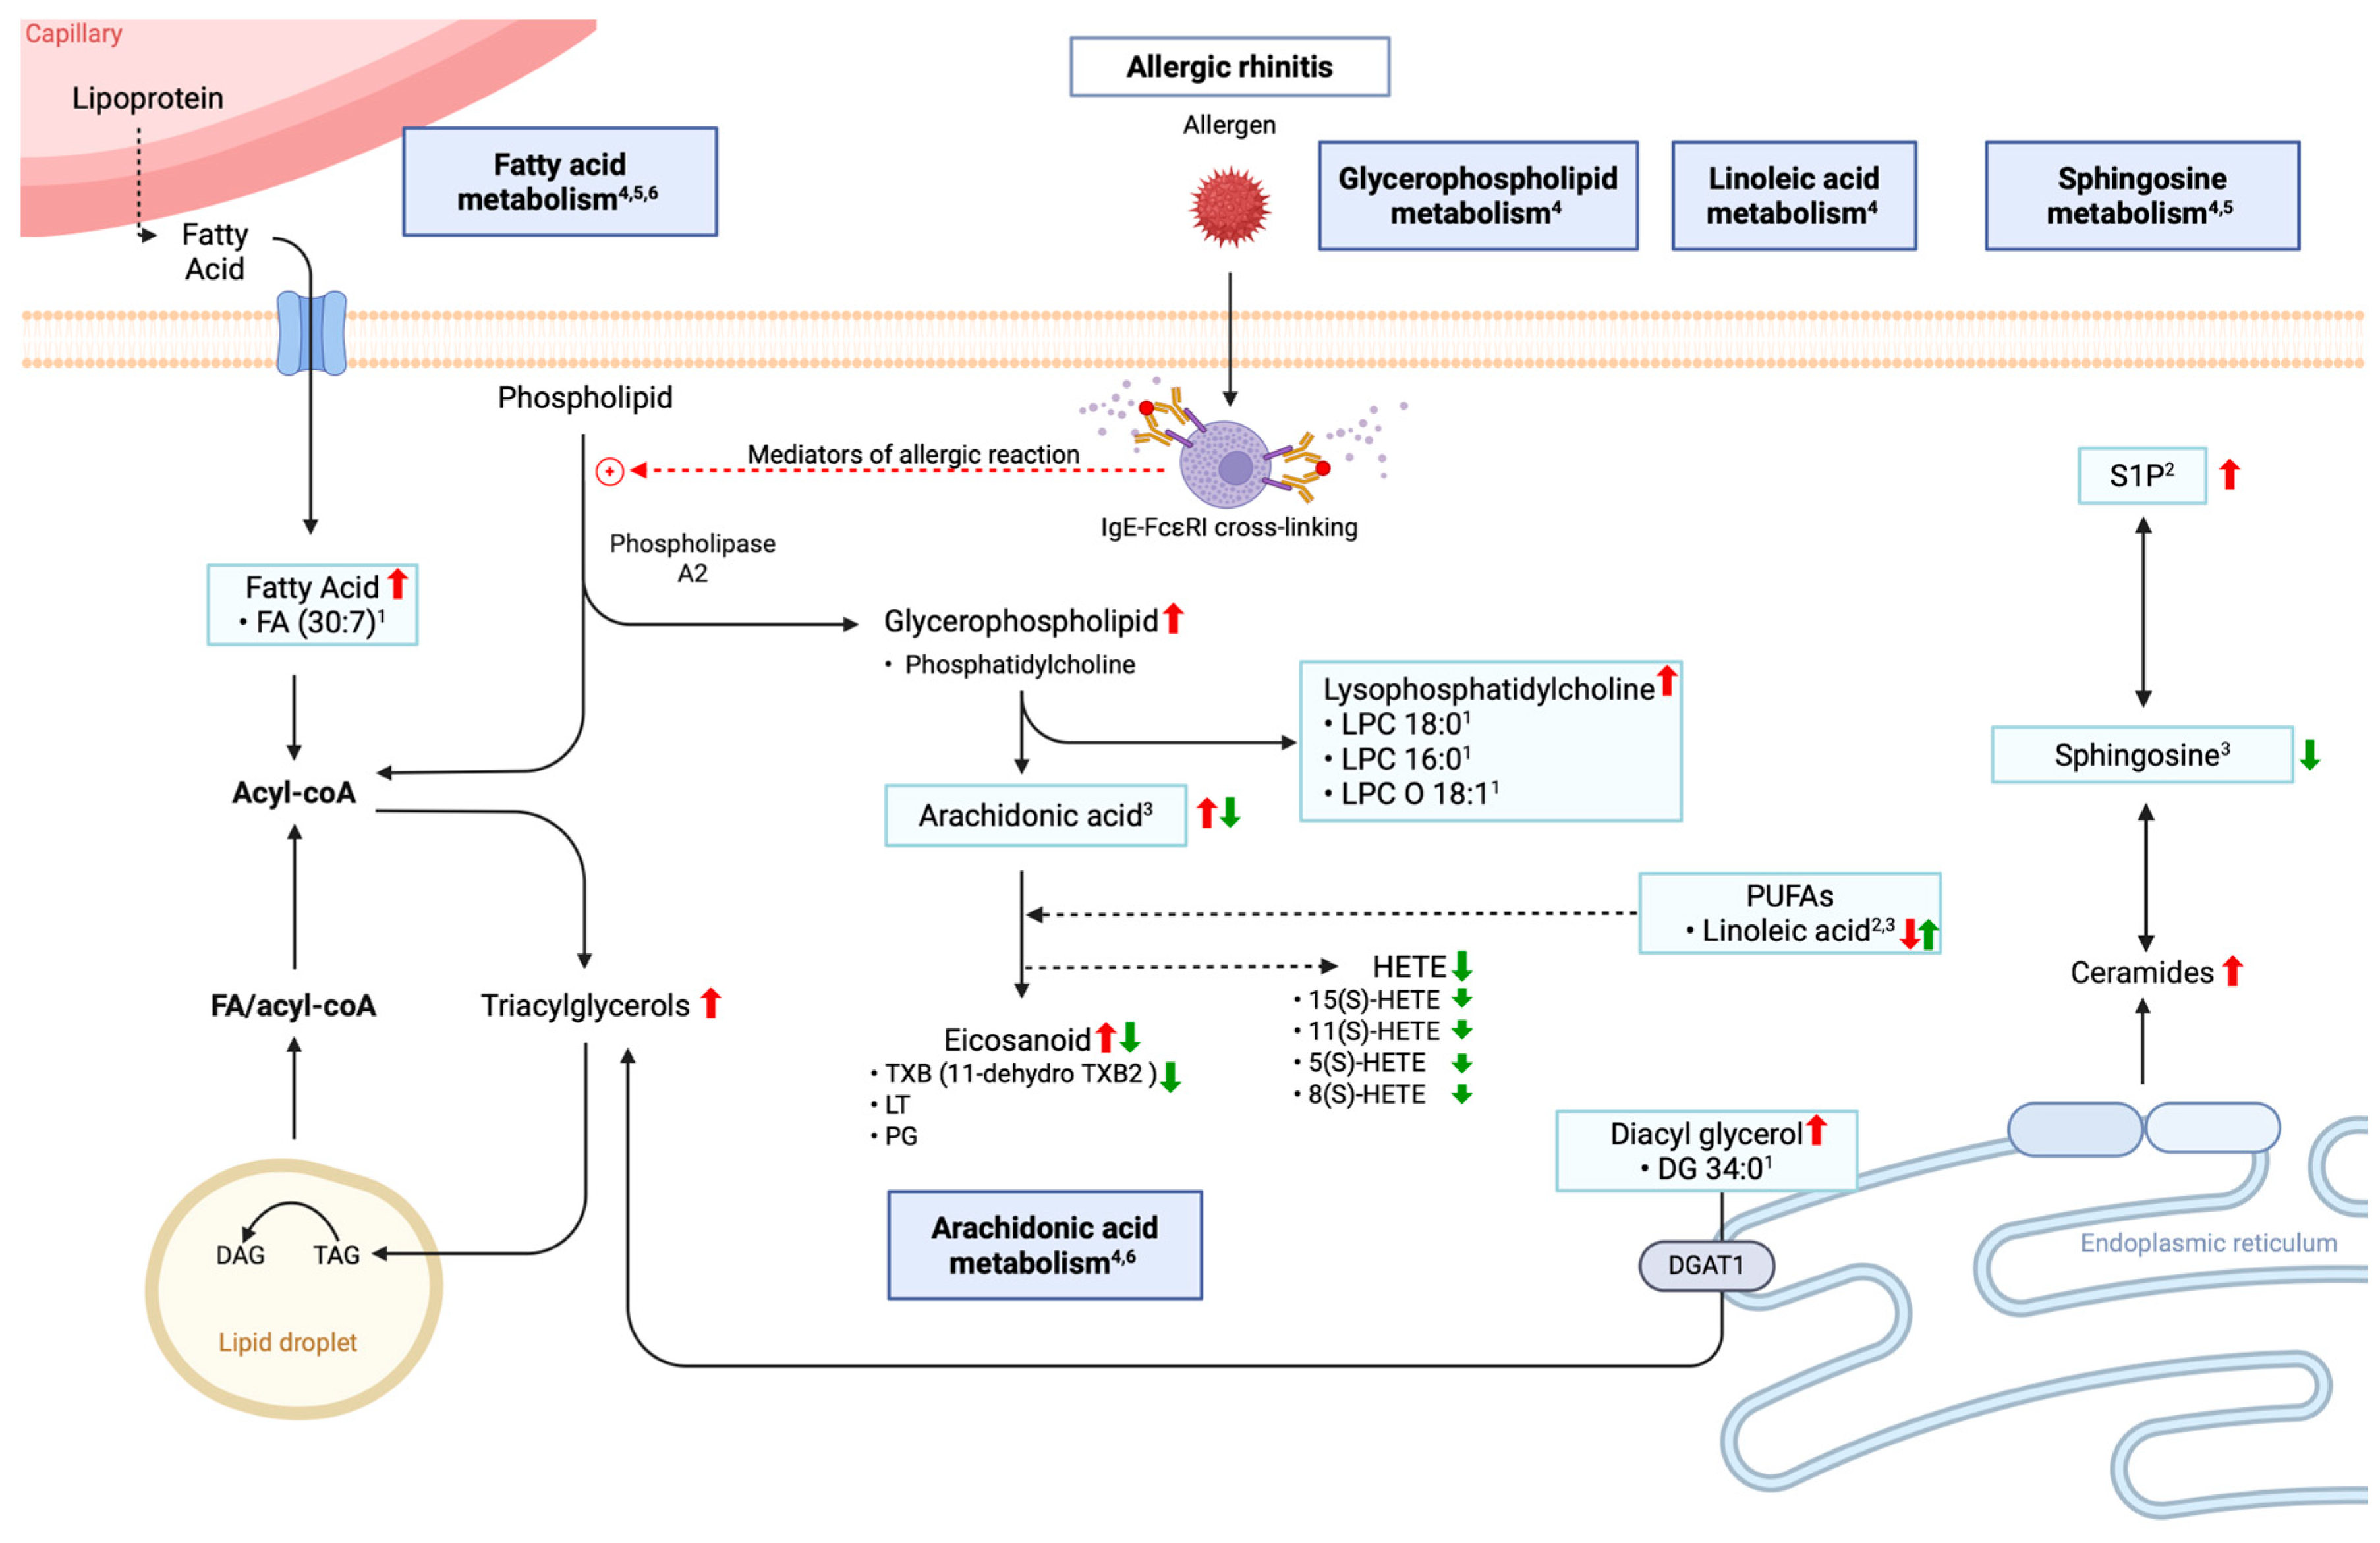
These alterations are comprehensively summarized in Table 1 and Table 2 and Figure 2 and Figure 3. Lipid metabolism and amino acid metabolism have been identified as the main systems involved in AR.

2.1. Alterations in Lipid Metabolism

  • Upregulation of arachidonic acid metabolism
Pathway analysis from humans identified AA and glycerophospholipid metabolism as pathways which were significantly altered in AR [11,13,14]. AA is stored as glycerophospholipids in cell membranes [21]. Upon stimulation (e.g., by cytokines or allergens), phospholipase A2 (PLA2) releases AA from membrane phospholipids [22]. Eicosanoids, which are derived from AA, play pivotal roles in inflammatory responses [23]. These proinflammatory lipid mediators are released from membrane phospholipids through AA metabolism [24]. Previous studies also reported elevated levels of glycerophospholipids and AA-derived eicosanoids—prostaglandins—in the serum of AR patients [13]. Alterations in several leukotrienes and thromboxanes, which are also AA-derived eicosanoids, were also observed in the serum of humans [13,14]. All of these findings suggest that the upregulation of AA metabolism plays a critical role in the promotion of inflammatory responses in AR.
  • Upregulation of phosphatidylcholine metabolism
Phosphatidylcholine (PC) and phosphatidylethanolamine (PE) are major membrane phospholipids whose metabolism generates bioactive intermediates such as lysophosphatidylcholine (LPC), lysophosphatidylethanolamine (LPE), and diacylglycerol (DAG), which play key roles in membrane remodeling, inflammation, and intracellular signaling [25]. Increases in LPEs and LPCs have been reported in the serum of a mice model of AR [9]. The capacity of LPE to activate mast cells, macrophages, and airway epithelial cells has been demonstrated [26], while the generation of 12-hydroxyeicosatetraenoic acid- phosphatidylethanolamines (12-HETE-PEs) has been observed in a T helper 2-dependent model of murine lung inflammation, in association with elevated IL-4 and IL-13 levels [27]. From clinical studies, patients with AR showed significantly elevated serum levels of PCs, LPCs, specifically LPC 18:0, LPC 16:0, and LPC(O) 18:1, DAGs species such as DAG 34:0, and PEs [11]. PCs, being among the most abundant phospholipids in membranes, likely reflect ongoing inflammatory processes when their levels are altered [28]. LPCs are known to modulate the effector functions of eosinophils [29]. They promote inflammation by enhancing the production of IL-33 (IL-33) [30,31]. One study demonstrated that LPCs induced key features of allergic airway diseases [30].
Additionally, associations between LPCs, DAGs, triacylglycerols (TGs) and FAs and the immunological markers IgE and IL-33 were revealed in the serum of AR patients [11]. The DAG signaling pathway has been shown to mitigate immune cell and smooth muscle cell dysfunction in asthma, with diacylglycerol kinase (DGK) enzymes contributing to the regulation of airway inflammation and hyperresponsiveness [32]. All of these findings suggest that the upregulation of PC, LPC, LPE and DAG metabolism exerts a key role in promoting inflammatory and allergic responses in AR.
  • Increased ceramide and sphingosine-1-phosphate levels
Elevated ceramide levels have been observed in murine mast cells and an AR mice model [7,9], while increased levels of sphingosine-1-phosphate (S1P) have been reported in AR patients [10]. Sphingomyelin (SM) is a major membrane sphingolipid. Upon inflammatory stimulation, acid sphingomyelinase is activated and then catalyzes the hydrolysis of SM into ceramides and phosphatidylcholines [33]. Ceramides are subclasses of phospholipids that play important roles in inflammatory processes [31]. They can be further metabolized by ceramidases into sphingosine, which is subsequently phosphorylated by sphingosine kinases to form S1P [34]. Consistent with findings in AR, ceramides have been shown to accumulate in the lungs and contribute to the development of asthma [35]. Similarly, S1P has been implicated in the pathogenesis of asthma [36]. Given these findings, ceramides and S1P appear to be closely associated with AR as a consequence of allergic inflammation.

2.2. Alterations in Amino Acid Metabolism

  • Increased arginine and proline levels
Elevated levels of arginine and proline were reported in the serum of an AR murine mast cell model [7]. Pathway analysis in the serum of humans was also linked to AR with dysregulation of arginine and proline metabolism [10]. Arginine, a semi-essential amino acid, plays a critical role in the urea cycle and serves as a precursor for several biologically active molecules, including nitric oxide (NO), creatine, polyamines, and urea [37,38]. Among these, NO is particularly relevant in the context of allergic disease, as it is a well-established biomarker of type 2 inflammation [39]. All of these findings suggest that increased arginine and proline levels in AR reflect heightened NO production and altered nitrogen handling, contributing to inflammatory signaling and immune dysregulation in the nasal mucosa.
  • Increased sarcosine and serine, but decreased glycine and creatine levels
Increased sarcosine [10], increased serine [7], and decreased creatine [12,13] were reported in the serum of AR patients. Additionally, three studies reported reduced glycine levels in AR patients, two from serum [12,13] and one from urine [17]. Glycine is recognized for its anti-inflammatory property in various disease models [40] and has been shown to inhibit acute allergic responses in mice [41]. The observed reductions in glycine levels suggested a depletion of anti-inflammatory capacity. Sarcosine, an intermediate metabolites in glycine and creatine biosynthesis, is metabolized into glycine via sarcosine dehydrogenase [42]. Serine is a non-essential amino acid that plays crucial roles in many biological processes [43]. Hence, elevated sarcosine and serine levels, alongside decreased glycine and creatine, suggest an impairment of metabolic conversion and a shift away from the glycine-mediated anti-inflammatory pathway in AR. Moreover, both glycine and serine are involved in glutathione synthesis, which is a potent antioxidant system [44]. In summary, altered levels of these amino acids are likely to be associated with AR via increased oxidative stress and inflammation.

2.3. Alterations in Nucleic Acid Metabolism

AR has been reported as being associated with pyrimidine [10] and purine [14] metabolism following pathway analysis. Cytidine, a metabolite involved in pyrimidine metabolism, was found to be elevated in the serum of AR patients [10]. Cytidine serves as a substrate for conversion into uridine via the enzyme cytidine deaminase [45]. Interestingly, this enzyme has been implicated in the pathophysiology of allergic conditions such as food allergy and asthma [46,47]. With regard to purine metabolism, elevated levels of hypoxanthine and uric acid were also observed in the serum of patients with AR [14]. While hypoxanthine is not commonly linked to allergic responses, higher levels of uric acid have been observed in asthmatic patients during acute exacerbation, when compared to asthmatic patients in remission and healthy individuals [48]. For these reasons, the changes in nucleic acid levels in AR are likely to be involved in allergic inflammatory pathways. Further research is needed to identify the relationships between nucleic acid metabolism, inflammation, and AR.

3. Metabolomes and Metabolic Pathways as Diagnostic and Severity Markers for Allergic Rhinitis

The diagnosis of AR is traditionally based on clinical symptoms. AR is often confirmed by the identification of sensitization to aeroallergens [49]. Even though additional diagnostic tools such as nasal cytology and nasal allergen challenge tests have been utilized in research, their applications in routine clinical practice remain limited due to their complexity and time requirement [50,51]. AR severity can be assessed through clinical evaluation and quality of life (QOL) using survey instruments and questionnaires, including the Visual Analog Scale (VAS) and the Rhinoconjunctivitis Quality of Life Questionnaire (RQLQ) [52]. Currently, there is no validated laboratory marker for the assessment of AR severity. For these reasons, metabolomics offers a promising and minimally invasive approach to support the diagnosis of AR and severity assessment, particularly if validated biomarkers are established.
Pathway analysis, correlation analysis, and receiver operating characteristic (ROC) analysis are powerful tools for the identification of potential metabolic biomarkers [53]. Integration of these analytical approaches can reveal key metabolites among candidate biomarkers in AR. To date, four studies have reported candidate metabolites with potential diagnostic value in AR [10,11,13,14]. Two of these also identified metabolites associated with disease severity [10,11]. A summary of the findings is provided in Table 3.

3.1. Lipid Metabolites

For the diagnosis of AR, pathway analysis has consistently identified four key lipid-related metabolic pathways, including (1) AA metabolism [10,11,13,14], (2) glycerophospholipid metabolism [10,11], (3) linoleic acid metabolism [11,13], and (4) sphingolipid metabolism [10]. Furthermore, one of these studies discovered five lipids with excellent diagnostic performance (area under the curve; AUC > 0.9), including increased fatty acid (FA) 30:7, LPC(O) 18:1, DAG 34:0, LPC 18:0, and LPC 16:0 [11].
For severity assessment, lipids again showed potential as candidate biomarkers. Specifically, increased FA, DAG, LPC, and TG levels showed a correlation with clinical severity, as indicated by increased serum IgE and IL-33 levels [11].
In AR, lipid metabolism plays a central role in driving inflammation, as previously mentioned. Together, the increases in these lipid molecules reflect the inflammatory state of AR and may serve as potential biomarkers for disease diagnosis and severity.
Another study [10] revealed an increase in S1P and a decrease in linoleic acid potentially served as severity-associated markers, as indicated by total nasal symptom score (TNSS) and VAS score with both achieving an AUC greater than 0.9. Linolenic acid, a common polyunsaturated fatty acid, plays an important role in the modulation of the immune responses in allergic and inflammatory diseases [54]. A previous study showed that the linolenic acid exerted immunosuppressive effects by reducing mast cell activation and secretion [55]. Consequently, linolenic acid might help in the prevention and treatment of various inflammatory conditions. S1P is a bioactive lipid molecule derived from sphingolipid metabolism and is involved in inflammatory processes [56]. S1P is also involved in the development of the asthma phenotype in patients allergic to house dust mites (HDM) [57]. Therefore, a decrease in linolenic acid and an increase in S1P levels may serve as potential biomarkers for the severity of AR via the modulation of inflammatory processes.

3.2. Other Metabolites

In addition to lipids, arginine and proline metabolism [10], purine [14] and pyrimidine [10] metabolism, as well as in caffeine and porphyrin metabolism [13,14] exerted diagnostic potential for AR according to pathway enrichment analysis.
Arginine and proline metabolism are closely linked through enzymatic pathways [58]. Arginine is essential for the urea cycle and acts as a precursor for NO [37,38], a key biomarker of type 2 inflammation associated with allergic disease [39]. Purine and pyrimidine nucleotides serve as key immune signaling molecules [59], and alterations in purine metabolism observed in asthma indicate enhanced purine turnover linked to chronic inflammation [60]. Caffeine, a structural analog of adenosine, functions as a non-selective adenosine receptor antagonist and is also linked to the development of asthma [61]. Interestingly, higher levels of paraxanthine, a primary metabolite of caffeine, in urine are associated with reduced asthma risk and improved pulmonary function in non-asthmatic adults, whereas elevated urine levels of caffeine and its metabolite theophylline are linked to unfavorable pulmonary function in those with asthma [62]. These findings highlight the potential of metabolites involved in purine, pyrimidine, and caffeine metabolism in diagnosing allergic diseases.
With regard to severity assessment, one study [10] revealed that increased sarcosine and cytidine potentially served as severity-associated markers, as indicated by TNSS and VAS scores. Sarcosine, a glycine derivative, is also associated with asthma, as shown by observed elevated serum sarcosine levels in asthma patients [63]. Cytidine, a pyrimidine precursor of cytidine triphosphate (CTP), is essential for nucleic acid and lipid metabolism, and dysregulation of pyrimidine metabolism has also been linked to asthma pathophysiology [64]. All of these results emphasized the roles of sarcosine and cytidine in determining the severity of allergic diseases.
Although all these findings are promising, further validation in large and well-characterized clinical cohorts are necessary to establish the utility of metabolomics as a tool for the routine diagnosis and severity assessment of AR.

4. Metabolome Alterations Following Allergen Immunotherapy in Allergic Rhinitis

In AIT, repeated administration of high doses of allergens through sublingual immunotherapy (SLIT) or subcutaneous immunotherapy (SCIT) modulates the immune response toward immune tolerance. During this process, dendritic cells induce naïve CD4+ T cells to differentiate into T-helper 1 (Th1) cells and regulatory T cell subsets, including Treg, Tr1, and Tr35 cells. Regulatory T cells subsequently produce inhibitory cytokines and immune-regulatory molecules, such as cytotoxic T-lymphocyte-associated protein 4 (CTLA-4), IL-10, IL-35 and transforming growth factor-β (TGF-β), which suppress T-helper 2 (Th2)-mediated allergic inflammation.
In addition, IL-10 and TGF-β promote B-cell differentiation into regulatory B cells (Bregs) and plasma cells, leading to increased production of allergen-specific immunoglobulin G (IgG), IgG4, and immunoglobulin A (IgA). Bregs further suppress IgE production by B cells. Allergen-specific IgG/IgG4 and IgA compete with IgE for allergen binding, thereby reducing mast cell and basophil activation and degranulation [4]. Overall, these immunologic mechanisms suppress the pathophysiology of AR.
Therefore, successful AIT may reverse or normalize metabolomic alterations associated with AR. However, the therapeutic response to AIT may vary depending on multiple factors, including host characteristics, route of allergen administration, allergen dose, allergen type, and duration of immunotherapy. The differences between SCIT and SLIT include a greater reduction in IgE levels and a more pronounced increase in IgG4 levels with SCIT compared with SLIT [65]. The metabolomic changes associated with AIT are discussed further in the following sections.
Five clinical studies reported a range of metabolites that were altered following AIT [66,67,68,69,70]. Grass pollens were used as allergens in three studies, Artemisia sieversiana for SCIT in two studies and Phleum pratense for SLIT in one study. HDM were also used as allergens in two studies, including one SLIT and one SCIT. The maintenance phase of AIT ranged from one to three years. All metabolome alterations following AIT in AR are comprehensively summarized in Table 4. Of these, lipid metabolism, amino acid metabolism, and glycolysis metabolism are the main processes involved.

4.1. Alterations in Lipid Metabolism

In three studies, following AIT, a reduction in serum AA level was reported [67,68,69], while decreases in serum HETEs, downstream metabolites of AA, were observed in one study [67]. Levels of AA and other polyunsaturated fatty acids (PUFAs), precursors for eicosanoids involved in AR symptomatology [71], were also significantly reduced in serum after AIT [67,68,69]. For these reasons, the decreases in AA and HETEs are likely to indicate a corresponding decrease in eicosanoid production. Pathway analysis also revealed that the AA metabolism pathway underwent significant modulation post-AIT [69].
Another study reported that serum sphingosine level was significantly lower in an AIT-effective group than that of an ineffective group following treatment [68]. Sphingosine is a bioactive lipid involved in sphingolipid metabolism that has been implicated in allergic inflammation. It has also been reported as being a relevant metabolite in other allergic conditions such as atopic dermatitis [72] and asthma [57]. All of these findings suggest that the lower level of sphingosine in the AIT-effective group is associated with the attenuation of allergic inflammation. However, further studies evaluating the correlations between sphingosine and inflammatory markers in AR patients treated with AIT is required.

4.2. Alterations in Amino Acid Metabolism

  • Decreased ornithine and creatinine levels
Reductions in serum ornithine and creatinine levels following AIT were observed [68]. These metabolites are downstream products of arginine metabolism [73], which plays a central role in the urea cycle and is closely linked to NO production [74]. NO serves as a key mediator of eosinophilic inflammation and is recognized as a biomarker of nasal inflammation in AR patients [75]. Hence, the decline in ornithine and creatinine levels post-AIT possibly reflects a downregulation of arginine metabolism and a corresponding decrease in NO production, suggesting a reduction in allergic inflammatory activity. This statement is supported by a previous study which showed that elevated levels of ornithine and creatinine were associated with exacerbation of asthma [63].
  • Increased taurine and decreased hypotaurine levels
Following AIT, an increase in the serum level of taurine and a decrease in serum hypotaurine was found in one study [66]. Taurine and hypotaurine are key metabolites in the sulfur-containing amino acid metabolic pathway. Hypotaurine is converted into taurine through the enzymatic activity of hypotaurine dehydrogenase [76]. Taurine is known to possess potent antioxidant, anti-inflammatory, and anti-apoptotic properties [77]. In a human mast cell model, taurine suppressed mRNA expression of TSLP and pro-inflammatory cytokines in a dose-dependent manner [78]. The observed metabolic shift, characterized by a decrease in hypotaurine and a corresponding increase in taurine, suggests an anti-inflammatory effect of AIT in AR patients. This alteration in sulfur amino acid metabolism has been supported by both pathway analysis and univariate statistical approaches [66].

4.3. Alterations in Glycolysis

A decrease in serum lactate level following AIT was exhibited in one study [68]. Lactate, a byproduct of glycolysis and pyruvate metabolism [79], is usually elevated in response to tissue hypoxia and inflammation [80]. Therefore, the reduction in lactate level following AIT is likely to reflect a decrease in inflammatory activity.

5. Metabolomes and Metabolic Pathways as Allergen Immunotherapy Response Markers for Allergic Rhinitis

The clinical effectiveness of AIT in AR patients is typically evaluated following a one-year treatment through symptom-based measures such as the TNSS, the RQLQ, and the VAS. A meta-analysis has revealed that significant clinical improvement or a reduction in medication use are surrogate markers of AIT response [81]. In cases where no clinical improvement is observed, the patient is considered unresponsive to AIT, and thus discontinuation of therapy is recommended [82]. Conversely, if a positive clinical response is noted, AIT is continued for a duration of 3 to 5 years [82]. Unfortunately, standardized laboratory-based methods for assessing AIT effectiveness remain limited. A blood-based metabolomics profile may offer a more objective and simplified approach for the monitoring of treatment response.
To identify candidate biomarkers associated with AIT responsiveness, pathway analysis, correlation analysis, univariate analysis, and ROC analysis have been performed in patients with AR [53]. To date, five studies have identified metabolites which are potential candidates associated with AIT efficacy [66,67,68,69,70]. A summary of these findings is presented in Table 5.

5.1. Lipid Metabolism

Pathway analysis showed that two lipid-related metabolic pathways, AA metabolism [69] and fatty acid metabolism [68], were associated with the therapeutic response to AIT. Since these pathways have also been implicated in AR diagnosis and severity, it is highly suggestive that AIT reverses the metabolic dysregulation characteristics of AR. Correlation analyses enabled the identification of several metabolites significantly associated with good response to AIT, including decreased 11-dehydrothromboxane B2 (11-dehydroTXB2), 11(S)-HETE, 5(S)-HETE, 8(S)-HETE, 15(S)-HETE, and 13-hydroxyoctadecadienoic acid (13-HODE). It has been shown that 11-dehydroTXB2, a stable metabolite of thromboxane A2 [83], HETEs, metabolites of AA [84] and 13-HODE, a lipid metabolite derived from linoleic acid [85], are associated with the inflammatory process. One study [68] utilized ROC analysis to evaluate the predictive value of metabolites for the efficacy of AIT. They reported that a decreased level of AA and sphingosine, along with increased linoleic acid, demonstrated predictive potential (AUC > 0.7). Eicosanoids derived from AA are central mediators of inflammation, generated from membrane phospholipids through AA metabolism [24]. Sphingosine itself is a component of cell membranes, but its derivative, S1P, is a critical lipid mediator involved in inflammation [56]. Therefore, it is likely that the decreases in these metabolites represent a good therapeutic response to AIT via the reduction in allergic inflammation.

5.2. Amino Acid Metabolism

Amino acids have also emerged as important biomarkers in predicting the efficacy of AIT. These amino acids included alanine, aspartate, and glutamate, as identified through pathway analysis. Moreover, pathway analysis has been used to demonstrate that aminoacyl-tRNA biosynthesis, arginine and proline metabolism, butanoate metabolism, nitrogen metabolism, phenylalanine, tyrosine and tryptophan biosynthesis, and also taurine and hypotaurine metabolism could reflect AIT responsiveness [70]. In addition, univariate analysis has specifically highlighted that a decreased level of hypotaurine and l-alanine, along with increased taurine indicate a good response to AIT [66,68,70].
Hypotaurine is converted to taurine by hypotaurine dehydrogenase, and taurine is subsequently metabolized to L-alanine [76]. Taurine exerts antioxidant, anti-inflammatory, and anti-apoptotic effects [77]. Therefore, the shift from hypotaurine to taurine after AIT may be mediated by these beneficial effects.
One study [68] used ROC analysis and found that a decrease in creatinine and ornithine was associated with AIT efficacy, demonstrating predictive utility (AUC > 0.7). Creatinine, a breakdown product of creatine phosphate, can reflect cellular energy metabolism and systemic inflammation [86]. Ornithine is a non-protein amino acid produced from arginine via arginase in the urea cycle [87]. In allergic inflammation, levels of L-ornithine are increased [88]. For these reasons, the reduction in creatinine and L-ornithine may be associated with a decrease in allergic inflammation, and hence these changes can serve as potential markers of AIT efficacy.

5.3. Other Metabolic Pathways

In addition to lipids and amino acids, other metabolic pathways are also shown to be AIT response markers as evidenced by pathway analysis. This included glycolysis, pyruvate metabolism, galactose metabolism, TCA cycle, and the pentose phosphate pathway [66,68,69,70]. ROC analysis was used to evidence that decreased lactate level was associated with a good response to AIT [68]. Lactate, produced from pyruvate during anaerobic glycolysis [89], is elevated in asthma [90]. Acting as an immune modulator, lactate can promote the differentiation of naive CD4+ T cells into inflammatory T-helper 17 (Th17) cells [91]. AIT may normalize lactate levels, suggesting its potential as a marker of a positive therapeutic response via the attenuation of inflammation.

6. Limitations and Future Direction

Although metabolomics techniques have advanced rapidly, clinical applications in AR and AIT remain in early stages and are largely confined to research settings. No single metabolite can demonstrate sufficient diagnostic, prognostic, and therapeutic monitoring utility across all aspects of AR, which include disease presence, severity, and responsiveness to AIT. Therefore, combining conventional biomarkers (e.g., skin prick tests, serum-specific IgE) with metabolomics profiling is likely to offer a more comprehensive and accurate approach. In addition, a major challenge in this field is the lack of standardization in metabolomics methodologies, which impairs reproducibility and limits the comparability of findings across studies. The inherent complexity and heterogeneity of AR phenotypes and AIT protocols also contribute to significant variability in study populations.
In an in vitro study [7], LPS-sensitized murine mast cells were investigated, whereas in vivo studies [8,9] used ovalbumin (OVA)-sensitized AR mouse models. These studies reported metabolite alterations following sensitization, including increases in fatty acids and lipid metabolites. In addition, pathway analysis demonstrated increased AA and sphingolipid metabolism in the murine mast cell model [7]. These findings were similar to those observed in human studies, as discussed in the following section. However, several limitations of non-clinical studies should be considered. First, the experimental models were sensitized with allergens such as OVA, whereas human AR is more commonly associated with sensitization to HDM [92]. Second, these studies lacked clinical correlations between metabolite alterations and AR severity. Finally, the number of non-clinical metabolomics studies in AR remains limited.
Samples used for metabolomic analyses in in vivo studies included serum and feces, whereas clinical studies analyzed serum, sputum, and urine samples. One study [17] reported that stool metabolites were strongly positively correlated with blood metabolites, while blood metabolites were negatively correlated with most urine metabolites. This may be explained by the absorption of dietary components into the bloodstream, whereas unabsorbed compounds and metabolic byproducts are excreted in the stool. In addition, the liver processes numerous metabolites and excretes them into bile before entering the gastrointestinal tract, resulting in parallel metabolic representations in both blood and fecal samples. In contrast, the kidneys regulate metabolite homeostasis by adjusting urinary excretion, which may lead to reduced metabolite concentrations in urine samples. Therefore, the interpretation of metabolite alterations should be performed cautiously, with consideration of the specific biological specimen analyzed.
Different metabolomic platforms, including liquid chromatography coupled with mass spectrometry (LC/MS), gas chromatography coupled with mass spectrometry (GC/MS), and nuclear magnetic resonance spectroscopy (NMR), have distinct analytical characteristics that may contribute to variability among studies. LC/MS provides high sensitivity and broad metabolite coverage [93], particularly for lipids and polar metabolites, whereas GC/MS is more suitable for volatile and thermally stable compounds, such as organic acids and amino acids, and often requires chemical derivatization before analysis [94]. In contrast, NMR offers high reproducibility and minimal sample preparation but has lower sensitivity compared with mass spectrometry-based techniques [95].
Additionally, studies can use either targeted or untargeted metabolomics. Targeted metabolomics focuses on the quantitative analysis of predefined metabolites with high specificity and sensitivity, while untargeted metabolomics aims to comprehensively identify a wide range of metabolites without prior selection, enabling the discovery of novel metabolic alterations [96]. These methodological differences may influence metabolite detection, quantification, and pathway interpretation across studies, and therefore should be considered when comparing metabolomic findings between studies in AR.
In clinical studies, there were differences in the study populations. For example, two studies were conducted in children [11,17], whereas the others included adult participants. Children usually exhibit more Th2-skewed immune responses [97], which are associated with IgE production and eosinophilic inflammation. Moreover, differences were also observed in sensitization patterns and the choice of allergens used for AIT, such as HDM and pollens. These variations may influence metabolomic profiles and treatment responses across studies.
Since AR is usually diagnosed clinically, simpler and more accessible tools, for example, allergen-specific IgE and skin tests, are typically preferred in routine clinical practice. Moreover, blood, urine, and fecal metabolomic profiles reflect systemic metabolic changes, making them susceptible to confounding by comorbid conditions such as infections, inflammation, or other allergic diseases. All of these aspects underscore the need for careful interpretation and clinical contextualization of metabolomics data.
Future research should aim to address these limitations through well-designed clinical and real-world studies. This includes efforts to correlate metabolome profiles with clinical assessments, both subjective and objective, in addition to immunologic markers and treatment outcomes. Additionally, studies should evaluate the metabolic effects of pharmacotherapies used in AR. In other words, the application of pharmacometabolomics to identify appropriate therapeutic agents and to predict patient responsiveness represents a promising approach which is in alignment with the principles of precision medicine. Comparative analyses of metabolomics signatures across different allergen sensitizations, such as house dust mites, animal dander, fungi, and pollen, are also warranted. Further investigations should also examine metabolic differences between AR and other allergic conditions, including asthma, food allergy, drug allergy, and urticaria, as well as in patients with multiple concurrent allergic diseases. Moreover, research should assess the metabolic effects associated with various routes of AIT administration, including sublingual, subcutaneous, and intralymphatic approaches. Robust meta-analyses in addition to both internal and external validation studies are essential to confirm and generalize metabolomics findings for clinical application. Importantly, future efforts should focus on the development of a standardized, clinically applicable metabolomics platform for diagnosis, stratifying severity, and monitoring the effectiveness of AIT in AR. Given the vast and complex nature of metabolomics data, the incorporation of artificial intelligence and machine learning tools are likely to be instrumental in managing, interpreting, and applying these data effectively.

7. Conclusions

AR is characterized by distinct metabolic alterations, as summarized in Figure 2 and Figure 3. AR is mainly associated with alterations in lipid metabolism, amino acid metabolism, glycolysis, TCA cycle, and nucleic acid metabolism. These include increases in AA and PC metabolism, elevated ceramide and S1P levels, higher levels of arginine, proline, sarcosine, and serine, and reduced glycine and creatine. Specific metabolites have been identified as potential biomarkers for AR. Indeed, FAs, DAGs, and LPCs are considered diagnostic markers, while S1P, linoleic acid, sarcosine, and cytidine exert potential as severity markers. AIT has been shown to modulate metabolic disturbances in AR, possibly contributing to the alleviation of clinical symptoms. Furthermore, specific metabolites, AA, linolenic acid, sphingosine, creatinine, ornithine, and lactic acid, can be potential biomarkers for assessing the efficacy of AIT in AR.

Author Contributions

Conceptualization, P.S., C.T., M.L.-A., S.C.C. and N.C.; data curation, P.S. and C.T.; writing—original draft preparation, P.S. and C.T.; writing—review and editing, C.T. and N.C.; visualization, P.S.; supervision, C.T., M.L.-A., S.C.C. and N.C. All authors have read and agreed to the published version of the manuscript.

Funding

This work was supported by the Mid-Career Research Grant from the National Research Council of Thailand and Chiang Mai University (N42A680478 to C.T.), the Distinguished Research Professor Grant from the National Research Council of Thailand (N42A690147 to N.C.), and a Chiang Mai University Center of Excellence Award (N.C.).

Data Availability Statement

No new data were created or analyzed in this study. Data sharing is not applicable to this article.

Conflicts of Interest

The authors declare no conflicts of interest.

Abbreviations

The following abbreviations are used in this manuscript:
12,13-EpOME 12,13-cis-Epoxyoctadecenoic acid
13(S)-HPODE 13(S)-Hydroperoxyoctadecadienoic acid
8S,15S-diHPETE 8S,15S-dihydroperoxy-5Z,9E,11Z,13E-eicosatetraenoic acid
9-HpETE 9-hydroperoxy-5,7E,11Z,14Z-eicosatetraenoic acid
9R,10S EpOME (9R,10S)-9,10-Epoxyoctadecenoic acid
9,10 DiHOME (Z)-9,10-Dihydroxyoctadec-12-enoic acid
Association
AA Arachidonic acid
ACar Acylcarnitines
AIT Allergen immunotherapy
AR Allergic rhinitis
AS Asthma
Ass Association
AUC Area under the curve
BregsRegulatory B cells
C Control
Cer Ceramide
CerP Ceramide 1 phosphate
CL Cardiolipin
COX Cyclooxygenase
CTLA-4Cytotoxic T-lymphocyte–associated protein
CTP Cytidine triphosphate
DAG Diacylglycerol
Der f Dermatophagoides farinae
Der p Dermatophagoides pteronyssinus
DG Diacylglycerol
DGK Diacylglycerol kinase
DHA Docosahexaenoic acid
DHAP Dihydroxyacetone phosphate
DM-SCIT Double-mite subcutaneous immunotherapy
EPA Eicosapentaenoic acid
FA Fatty acid
GC Gas chromatography
GC/MS Gas chromatography coupled with mass spectrometry
GCDCA Glycochenodeoxycholic acid
GPx Glutathione peroxidase
H2S Hydrogen sulfide
HDM House dust mite
HEPE Hydroxyeicosapentaenoic acid
HETE Hydroxyeicosatetraenoic acid
HHTrE Hydroxyheptadecatrienoic acid
HODE Hydroxyoctadecadienoic acid
HOTrE Hydroxyoctadecatrienoic acid
HPODE Hydroperoxylinoleic acid
IgA Immunoglobulin A
IgE Immunoglobulin E
IgG Immunoglobulin G
IL Interleukin
ILC2sInnate lymphoid cells
LC Liquid chromatography
LC/MS Liquid chromatography coupled with mass spectrometry
LC/MS/MS Liquid chromatography coupled with tandem mass spectrometry
Leu Leucine
LOX Lipoxygenase
LPC Lysophosphatidylcholines
LPC O Ether-linked lysophosphatidylcholine
LPE Lysophosphatidylethanolamines
LPI Lysophosphatidylinositols
LPS Lipopolysaccharides
LTD4 Leukotriene D4
LTE4 Leukotriene E4
MAR Mild allergic rhinitis
MS Mass spectrometry
MSAR Moderate–severe allergic rhinitis
NAE N-acetylethanolamine
NMR Nuclear magnetic resonance spectroscopy
NR Inhalant allergen-negative group
OVA Ovalbumin
PAF Platelet-activating factor
PC Phosphatidylcholine
PE Phosphatidylethanolamines
PG Prostaglandins
PGD2 Prostaglandin D2
PGE Prostaglandin E
PGE1 Prostaglandin E1
Phe Phenylalanine
PI Phosphatidylinositols
PR Inhalant allergen-positive group
PS Phosphatidylserine
PUFA Polyunsaturated fatty acid
RQLQ Rhinitis conjunctivitis quality of life questionnaire
ROC Receiver operating characteristic
S1P Sphingosine-1-phosphate
SCF Short-chain fatty acids
SM-SCIT Single-mite subcutaneous immunotherapy
SPF Specific pathogen-free
TCA Tricarboxylic acid
TCDCA Taurochenodeoxycholate
TG Triacylglycerol
TGF-β Transforming growth factor-β
Th1 T-helper 1
Th17 T-helper 17
Th2 T-helper 2
Trp Tryptophan
TSLPThymic stromal lymphopoietin
TSSS Total nasal symptom score
TXB2 Thromboxane B2
UCA Urocanic acid
VAS Visual analog scale
VIP Variable importance plot

References

  1. Burks, A.W.; Holgate, S.T.; O’Hehir, R.E.; Broide, D.H.; Bacharier, L.B.; Khurana Hershey, G.K.; Peebles, R.S. Middleton’s Allergy: Principles and Practice, 9th ed.; Elsevier: Edinburgh, UK, 2020. [Google Scholar]
  2. Rosenfield, L.; Keith, P.K.; Quirt, J.; Small, P.; Ellis, A.K. Allergic rhinitis. Allergy Asthma Clin. Immunol. 2024, 20, 74. [Google Scholar] [CrossRef] [PubMed]
  3. Lao-Araya, M.; Sompornrattanaphan, M.; Kanjanawasee, D.; Tantilipikorn, P. Allergen immunotherapy for respiratory allergies in clinical practice: A comprehensive review. Asian Pac. J. Allergy Immunol. 2022, 40, 283–294. [Google Scholar] [CrossRef] [PubMed]
  4. Shamji, M.H.; Layhadi, J.A.; Sharif, H.; Penagos, M.; Durham, S.R. Immunological Responses and Biomarkers for Allergen-Specific Immunotherapy Against Inhaled Allergens. J. Allergy Clin. Immunol. Pract. 2021, 9, 1769–1778. [Google Scholar] [PubMed]
  5. Shamji, M.H.; Durham, S.R. Mechanisms of allergen immunotherapy for inhaled allergens and predictive biomarkers. J. Allergy Clin. Immunol. 2017, 140, 1485–1498. [Google Scholar] [CrossRef]
  6. Clish, C.B. Metabolomics: An emerging but powerful tool for precision medicine. Cold Spring Harb. Mol. Case Stud. 2015, 1, a000588. [Google Scholar] [CrossRef]
  7. Patil, A.S.; Xu, Y. Comprehensive Metabolomics in Mouse Mast Cell Model of Allergic Rhinitis for Profiling, Modulation, Semiquantitative Analysis, and Pathway Analysis. Biomolecules 2025, 15, 109. [Google Scholar] [CrossRef]
  8. Chen, Z.; He, S.; Wei, Y.; Liu, Y.; Xu, Q.; Lin, X.; Chen, C.; Lin, W.; Wang, Y.; Li, L.; et al. Fecal and serum metabolomic signatures and gut microbiota characteristics of allergic rhinitis mice model. Front. Cell. Infect. Microbiol. 2023, 13, 1150043. [Google Scholar] [CrossRef]
  9. Zhang, Y.L.; Yu, P.C.; Liu, P. Using high-throughput metabolomics to discover perturbed metabolic pathways and biomarkers of allergic rhinitis as potential targets to reveal the effects and mechanism of geniposide. RSC Adv. 2019, 9, 17490–17500. [Google Scholar] [CrossRef]
  10. Xie, S.; Zhang, H.; Xie, Z.; Liu, Y.; Gao, K.; Zhang, J.; Xie, S.; Wang, F.; Fan, R.; Jiang, W. Identification of Novel Biomarkers for Evaluating Disease Severity in House-Dust-Mite-Induced Allergic Rhinitis by Serum Metabolomics. Dis. Markers 2021, 2021, 5558458. [Google Scholar] [CrossRef]
  11. Li, T.; Dou, Y.; Ji, J.; Chen, H.; Zhu, S.; Wang, M.; Xiong, Y.; Wang, Z.; Shan, J.; Qian, K.; et al. Lipidomics reveals the serum profiles of pediatric allergic rhinitis and its severity. Biomed. Chromatogr. 2024, 38, e5927. [Google Scholar] [CrossRef]
  12. Zhou, Y.J.; Li, L.S.; Sun, J.L.; Guan, K.; Wei, J.F. (1)H NMR-based metabolomic study of metabolic profiling for pollinosis. World Allergy Organ. J. 2019, 12, 100005. [Google Scholar] [CrossRef]
  13. Yuan, Y.; Wang, C.; Wang, G.; Guo, X.; Jiang, S.; Zuo, X.; Wang, X.; Hsu, A.C.; Qi, M.; Wang, F. Airway Microbiome and Serum Metabolomics Analysis Identify Differential Candidate Biomarkers in Allergic Rhinitis. Front. Immunol. 2021, 12, 771136. [Google Scholar] [CrossRef]
  14. Ma, G.-C.; Wang, T.-S.; Wang, J.; Ma, Z.-J.; Pu, S.-B. Serum metabolomics study of patients with allergic rhinitis. Biomed. Chromatogr. 2020, 34, e4739. [Google Scholar] [CrossRef] [PubMed]
  15. Yang, Y.; Cui, L.; Yu, P.; Guo, J.; Wang, J.; Wang, H.; Song, Z.; Zhai, Z.; Li, T.; Wang, G.; et al. Proteomics and metabolomics of sputum reveal the potential impact of allergic rhinitis on asthma. Allergy 2024, 79, 2277–2280. [Google Scholar] [CrossRef] [PubMed]
  16. Adamko, D.J.; Khamis, M.M.; Steacy, L.M.; Regush, S.; Bryce, R.; Ellis, A.K. Severity of allergic rhinitis assessed by using urine metabolomic profiling: Proof of concept. J. Allergy Clin. Immunol. 2018, 142, 687–689.e6. [Google Scholar] [CrossRef]
  17. Chiu, C.Y.; Chiang, M.H.; Kuo, C.N.; Cheng, M.L.; Lin, G. Multi-biofluid metabolomics analysis of allergic respiratory rhinitis and asthma in early childhood. World Allergy Organ. J. 2025, 18, 101013. [Google Scholar] [CrossRef]
  18. Bousquet, J.; Anto, J.M.; Bachert, C.; Baiardini, I.; Bosnic-Anticevich, S.; Walter Canonica, G.; Melén, E.; Palomares, O.; Scadding, G.K.; Togias, A.; et al. Allergic rhinitis. Nat. Rev. Dis. Prim. 2020, 6, 95. [Google Scholar] [CrossRef] [PubMed]
  19. Zhang, Y.; Liu, Y.; Sun, J.; Zhang, W.; Guo, Z.; Ma, Q. Arachidonic acid metabolism in health and disease. MedComm (2020) 2023, 4, e363. [Google Scholar] [CrossRef]
  20. Kabat, A.M.; Pearce, E.L.; Pearce, E.J. Metabolism in type 2 immune responses. Immunity 2023, 56, 723–741. [Google Scholar] [CrossRef]
  21. Capra, V.; Rovati, G.E.; Mangano, P.; Buccellati, C.; Murphy, R.C.; Sala, A. Transcellular biosynthesis of eicosanoid lipid mediators. Biochim. Biophys. Acta (BBA) -Mol. Cell Biol. Lipids 2015, 1851, 377–382. [Google Scholar] [CrossRef]
  22. Funk, C.D. Prostaglandins and Leukotrienes: Advances in Eicosanoid Biology. Science 2001, 294, 1871–1875. [Google Scholar] [CrossRef] [PubMed]
  23. Yamaguchi, A.; Botta, E.; Holinstat, M. Eicosanoids in inflammation in the blood and the vessel. Front. Pharmacol. 2022, 13, 997403. [Google Scholar] [CrossRef]
  24. Wang, B.; Wu, L.; Chen, J.; Dong, L.; Chen, C.; Wen, Z.; Hu, J.; Fleming, I.; Wang, D.W. Metabolism pathways of arachidonic acids: Mechanisms and potential therapeutic targets. Signal Transduct. Target. Ther. 2021, 6, 94. [Google Scholar] [CrossRef]
  25. Li, Z.; Vance, D.E. Phosphatidylcholine and choline homeostasis. J. Lipid Res. 2008, 49, 1187–1194. [Google Scholar] [CrossRef]
  26. Chen, L.-C.; Huang, S.-K.; Kuo, M.-L. The Evaluation of the Roles of Lysophosphatidylethanolamine (LPE) Generations in Bronchial Asthma. J. Allergy Clin. Immunol. 2023, 151, AB69. [Google Scholar] [CrossRef]
  27. Morgan, A.H.; Dioszeghy, V.; Maskrey, B.H.; Thomas, C.P.; Clark, S.R.; Mathie, S.A.; Lloyd, C.M.; Kühn, H.; Topley, N.; Coles, B.C.; et al. Phosphatidylethanolamine-esterified eicosanoids in the mouse: Tissue localization and inflammation-dependent formation in Th-2 disease. J. Biol. Chem. 2009, 284, 21185–21191. [Google Scholar] [CrossRef] [PubMed]
  28. van der Veen, J.N.; Kennelly, J.P.; Wan, S.; Vance, J.E.; Vance, D.E.; Jacobs, R.L. The critical role of phosphatidylcholine and phosphatidylethanolamine metabolism in health and disease. Biochim. Biophys. Acta (BBA) -Biomembr. 2017, 1859, 1558–1572. [Google Scholar] [CrossRef]
  29. Trieb, M.; Wolf, P.; Knuplez, E.; Weger, W.; Schuster, C.; Peinhaupt, M.; Holzer, M.; Trakaki, A.; Eichmann, T.; Lass, A.; et al. Abnormal composition and function of high-density lipoproteins in atopic dermatitis patients. Allergy 2019, 74, 398–402. [Google Scholar] [CrossRef]
  30. Bansal, P.; Gaur, S.N.; Arora, N. Lysophosphatidylcholine plays critical role in allergic airway disease manifestation. Sci. Rep. 2016, 6, 27430. [Google Scholar] [CrossRef] [PubMed]
  31. Goñi, F.M.; Alonso, A. Sphingomyelinases: Enzymology and membrane activity. FEBS Lett. 2002, 531, 38–46. [Google Scholar] [CrossRef]
  32. Kambayashi, T.; Deshpande, D.A. The role of diacylglycerol kinases in allergic airway disease. Curr. Opin. Pharmacol. 2020, 51, 50–58. [Google Scholar] [CrossRef]
  33. Jenkins, R.W.; Canals, D.; Hannun, Y.A. Roles and regulation of secretory and lysosomal acid sphingomyelinase. Cell. Signal. 2009, 21, 836–846. [Google Scholar] [CrossRef]
  34. Hannun, Y.A.; Obeid, L.M. Principles of bioactive lipid signalling: Lessons from sphingolipids. Nat. Rev. Mol. Cell Biol. 2008, 9, 139–150. [Google Scholar] [CrossRef]
  35. James, B.N.; Oyeniran, C.; Sturgill, J.L.; Newton, J.; Martin, R.K.; Bieberich, E.; Weigel, C.; Maczis, M.A.; Palladino, E.N.D.; Lownik, J.C.; et al. Ceramide in apoptosis and oxidative stress in allergic inflammation and asthma. J. Allergy Clin. Immunol. 2021, 147, 1936–1948.e9. [Google Scholar] [CrossRef]
  36. Díaz-Perales, A.; Escribese, M.M.; Garrido-Arandia, M.; Obeso, D.; Izquierdo-Alvarez, E.; Tome-Amat, J.; Barber, D. The Role of Sphingolipids in Allergic Disorders. Front. Allergy 2021, 2, 675557. [Google Scholar] [CrossRef] [PubMed]
  37. Luiking, Y.C.; Poeze, M.; Ramsay, G.; Deutz, N.E. Reduced citrulline production in sepsis is related to diminished de novo arginine and nitric oxide production. Am. J. Clin. Nutr. 2009, 89, 142–152. [Google Scholar] [CrossRef] [PubMed]
  38. Rosenthal, M.D.; Carrott, P.W.; Patel, J.; Kiraly, L.; Martindale, R.G. Parenteral or Enteral Arginine Supplementation Safety and Efficacy123. J. Nutr. 2016, 146, 2594S–2600S. [Google Scholar] [CrossRef] [PubMed]
  39. Maniscalco, M.; Fuschillo, S.; Mormile, I.; Detoraki, A.; Sarnelli, G.; Paulis, A.; Spadaro, G.; Cantone, E. Exhaled Nitric Oxide as Biomarker of Type 2 Diseases. Cells 2023, 12, 2518. [Google Scholar] [CrossRef]
  40. Grotz, M.R.; Pape, H.C.; van Griensven, M.; Stalp, M.; Rohde, F.; Bock, D.; Krettek, C. Glycine reduces the inflammatory response and organ damage in a two-hit sepsis model in rats. Shock 2001, 16, 116–121. [Google Scholar] [CrossRef]
  41. van Bergenhenegouwen, J.; Braber, S.; Loonstra, R.; Buurman, N.; Rutten, L.; Knipping, K.; Savelkoul, P.J.; Harthoorn, L.F.; Jahnsen, F.L.; Garssen, J.; et al. Oral exposure to the free amino acid glycine inhibits the acute allergic response in a model of cow’s milk allergy in mice. Nutr. Res. 2018, 58, 95–105. [Google Scholar] [CrossRef]
  42. Smith-Palmer, T. CLINICAL ANALYSIS|Sarcosine, Creatine, and Creatinine. In Encyclopedia of Analytical Science, 2nd ed.; Worsfold, P., Townshend, A., Poole, C., Eds.; Elsevier: Oxford, UK, 2005; pp. 166–174. [Google Scholar]
  43. Wu, D.; Zhang, K.; Khan, F.A.; Pandupuspitasari, N.S.; Guan, K.; Sun, F.; Huang, C. A comprehensive review on signaling attributes of serine and serine metabolism in health and disease. Int. J. Biol. Macromol. 2024, 260, 129607. [Google Scholar] [CrossRef] [PubMed]
  44. Anderson, M.E.; Stopper, A.R. Amino Acids|Glutathione. In Encyclopedia of Biological Chemistry III, 3rd ed.; Jez, J., Ed.; Elsevier: Oxford, UK, 2021; pp. 71–78. [Google Scholar]
  45. Moffatt, B.A.; Ashihara, H. Purine and pyrimidine nucleotide synthesis and metabolism. Arab. Book 2002, 1, e0018. [Google Scholar] [CrossRef]
  46. Li, Y.; Wang, Y.; Sun, N.; Yang, H.; Zhang, Q.; Zhang, X.; Huang, R.; Jia, X. Activation-induced cytidine deaminase plays crucial role in ovalbumin-induced food allergy and promoted by IL-21. Mol. Immunol. 2019, 114, 369–377. [Google Scholar] [CrossRef]
  47. Noguchi, E.; Shibasaki, M.; Inudou, M.; Kamioka, M.; Yokouchi, Y.; Yamakawa-Kobayashi, K.; Hamaguchi, H.; Matsui, A.; Arinami, T. Association between a new polymorphism in the activation-induced cytidine deaminase gene and atopic asthma and the regulation of total serum IgE levels. J. Allergy Clin. Immunol. 2001, 108, 382–386. [Google Scholar] [CrossRef]
  48. Li, L.; Wan, C.; Wen, F. An unexpected role for serum uric acid as a biomarker for severity of asthma exacerbation. Asian Pac. J. Allergy Immunol. 2014, 32, 93–99. [Google Scholar] [CrossRef]
  49. Bousquet, J.; Schünemann, H.J.; Togias, A.; Bachert, C.; Erhola, M.; Hellings, P.W.; Klimek, L.; Pfaar, O.; Wallace, D.; Ansotegui, I.; et al. Next-generation Allergic Rhinitis and Its Impact on Asthma (ARIA) guidelines for allergic rhinitis based on Grading of Recommendations Assessment, Development and Evaluation (GRADE) and real-world evidence. J. Allergy Clin. Immunol. 2020, 145, 70–80.e3, Correction in J. Allergy Clin. Immunol. 2022, 149, 2180. [Google Scholar] [CrossRef] [PubMed]
  50. Cho, S.H.; Nanda, A.; Keswani, A.; Adinoff, A.; Baroody, F.M.; Bernstein, J.A.; Gherasim, A.; Han, J.K.; Koepke, J.W.; Ledford, D.K.; et al. Nasal allergen challenge (NAC): Practical aspects and applications from an EU/US perspective-a Work Group Report of the AAAAI Rhinitis, Rhinosinusitis and Ocular Allergy Committee. J. Allergy Clin. Immunol. 2023, 151, 1215–1222.e4. [Google Scholar] [CrossRef] [PubMed]
  51. Jura-Szołtys, E.; Gawlik, R.; Branicka, O.; Stryjewska-Makuch, G.; Glück, J. Nasal cytology can predict clinical efficacy of subcutaneous immunotherapy in intermittent allergic rhinitis. Postep. Dermatol. Alergol. 2022, 39, 1110–1115. [Google Scholar] [CrossRef]
  52. Dykewicz, M.S.; Wallace, D.V.; Amrol, D.J.; Baroody, F.M.; Bernstein, J.A.; Craig, T.J.; Dinakar, C.; Ellis, A.K.; Finegold, I.; Golden, D.B.K.; et al. Rhinitis 2020: A practice parameter update. J. Allergy Clin. Immunol. 2020, 146, 721–767. [Google Scholar] [CrossRef]
  53. Wieder, C.; Frainay, C.; Poupin, N.; Rodríguez-Mier, P.; Vinson, F.; Cooke, J.; Lai, R.P.; Bundy, J.G.; Jourdan, F.; Ebbels, T. Pathway analysis in metabolomics: Recommendations for the use of over-representation analysis. PLoS Comput. Biol. 2021, 17, e1009105. [Google Scholar] [CrossRef]
  54. Yang, B.; Zhou, Y.; Wu, M.; Li, X.; Mai, K.; Ai, Q. ω-6 Polyunsaturated fatty acids (linoleic acid) activate both autophagy and antioxidation in a synergistic feedback loop via TOR-dependent and TOR-independent signaling pathways. Cell Death Dis. 2020, 11, 607. [Google Scholar] [CrossRef] [PubMed]
  55. Arita, M. Eosinophil polyunsaturated fatty acid metabolism and its potential control of inflammation and allergy. Allergol. Int. 2016, 65, S2–S5. [Google Scholar] [CrossRef] [PubMed]
  56. Aoki, M.; Aoki, H.; Ramanathan, R.; Hait, N.C.; Takabe, K. Sphingosine-1-Phosphate Signaling in Immune Cells and Inflammation: Roles and Therapeutic Potential. Mediat. Inflamm. 2016, 2016, 8606878, Correction in Mediat. Inflamm. 2016, 2016, 2856829. [Google Scholar] [CrossRef] [PubMed]
  57. Kowal, K.; Żebrowska, E.; Chabowski, A. Altered Sphingolipid Metabolism Is Associated With Asthma Phenotype in House Dust Mite-Allergic Patients. Allergy Asthma Immunol. Res. 2019, 11, 330–342. [Google Scholar] [CrossRef]
  58. Morris, S.M. Arginine Metabolism Revisited12. J. Nutr. 2016, 146, 2579S–2586S. [Google Scholar] [CrossRef]
  59. Idzko, M.; Ferrari, D.; Eltzschig, H.K. Nucleotide signalling during inflammation. Nature 2014, 509, 310–317. [Google Scholar] [CrossRef]
  60. Yu, M.; Cui, F.X.; Jia, H.M.; Zhou, C.; Yang, Y.; Zhang, H.W.; Ding, G.; Zou, Z.M. Aberrant purine metabolism in allergic asthma revealed by plasma metabolomics. J. Pharm. Biomed. Anal. 2016, 120, 181–189. [Google Scholar] [CrossRef]
  61. Jacobson, K.A.; Gao, Z.G.; Matricon, P.; Eddy, M.T.; Carlsson, J. Adenosine A(2A) receptor antagonists: From caffeine to selective non-xanthines. Br. J. Pharmacol. 2022, 179, 3496–3511. [Google Scholar] [CrossRef]
  62. Han, Y.-Y.; Forno, E.; Celedon, J. Urinary caffeine and caffeine metabolites and lung function in a nationwide study of U.S. adults. Eur. Respir. J. 2021, 58, OA1322. [Google Scholar] [CrossRef]
  63. Quan-Jun, Y.; Jian-Ping, Z.; Jian-Hua, Z.; Yong-Long, H.; Bo, X.; Jing-Xian, Z.; Bona, D.; Yuan, Z.; Cheng, G. Distinct Metabolic Profile of Inhaled Budesonide and Salbutamol in Asthmatic Children during Acute Exacerbation. Basic Clin. Pharmacol. Toxicol. 2017, 120, 303–311. [Google Scholar] [CrossRef]
  64. Kelly, R.S.; Sordillo, J.E.; Lasky-Su, J.; Dahlin, A.; Perng, W.; Rifas-Shiman, S.L.; Weiss, S.T.; Gold, D.R.; Litonjua, A.A.; Hivert, M.F.; et al. Plasma metabolite profiles in children with current asthma. Clin. Exp. Allergy 2018, 48, 1297–1304. [Google Scholar] [CrossRef]
  65. Akdis, C.A.; Akdis, M. Mechanisms of allergen-specific immunotherapy and immune tolerance to allergens. World Allergy Organ. J. 2015, 8, 17. [Google Scholar] [CrossRef]
  66. Yu, R.L.; Pan, C.; Ma, T.T.; Wang, X.Y.; Shi, H.Y.; Zhuang, Y.; Yan, W.J.; Liu, J.G.; Cao, M.D.; Sun, J.L.; et al. Prediction of clinical efficacy of subcutaneous immunotherapy for Artemisia sieversiana pollen allergic rhinitis by serum metabolomics. J. Formos. Med. Assoc. 2022, 121, 2465–2480. [Google Scholar] [CrossRef]
  67. Zheng, P.; Yan, G.; Zhang, Y.; Huang, H.; Luo, W.; Xue, M.; Li, N.; Wu, J.L.; Sun, B. Metabolomics Reveals Process of Allergic Rhinitis Patients with Single- and Double-Species Mite Subcutaneous Immunotherapy. Metabolites 2021, 11, 613. [Google Scholar] [CrossRef]
  68. Xie, S.; Jiang, S.; Zhang, H.; Wang, F.; Liu, Y.; She, Y.; Jing, Q.; Gao, K.; Fan, R.; Xie, S.; et al. Prediction of sublingual immunotherapy efficacy in allergic rhinitis by serum metabolomics analysis. Int. Immunopharmacol. 2021, 90, 107211. [Google Scholar] [CrossRef]
  69. Barker-Tejeda, T.C.; Bazire, R.; Obeso, D.; Mera-Berriatua, L.; Rosace, D.; Vazquez-Cortes, S.; Ramos, T.; Rico, M.D.P.; Chivato, T.; Barbas, C.; et al. Exploring novel systemic biomarker approaches in grass-pollen sublingual immunotherapy using omics. Allergy 2021, 76, 1199–1212. [Google Scholar] [CrossRef]
  70. Shi, H.-Y.; Pan, C.; Ma, T.-T.; Chen, Y.-L.; Yan, W.-J.; Liu, J.-G.; Cao, M.-D.; Huang, H.-D.; Wang, D.-Y.; Wang, X.-Y.; et al. Clinical Efficacy Evaluation of 1-Year Subcutaneous Immunotherapy for Artemisia sieversiana Pollen Allergic Rhinitis by Serum Metabolomics. Front. Pharmacol. 2020, 11, 305. [Google Scholar] [CrossRef]
  71. Brown, M.S.; Peters, S.P.; Adkinson, N.F., Jr.; Proud, D.; Kagey-Sobotka, A.; Norman, P.S.; Lichtenstein, L.M.; Naclerio, R.M. Arachidonic acid metabolites during nasal challenge. Arch. Otolaryngol. Head Neck Surg. 1987, 113, 179–183. [Google Scholar] [CrossRef]
  72. Toncic, R.J.; Jakasa, I.; Hadzavdic, S.L.; Goorden, S.M.; Ghauharali-van der Vlugt, K.J.; Stet, F.S.; Balic, A.; Petkovic, M.; Pavicic, B.; Zuzul, K.; et al. Altered Levels of Sphingosine, Sphinganine and Their Ceramides in Atopic Dermatitis Are Related to Skin Barrier Function, Disease Severity and Local Cytokine Milieu. Int. J. Mol. Sci. 2020, 21, 1958. [Google Scholar] [CrossRef]
  73. Morris, S.M. Arginine Metabolism: Boundaries of Our Knowledge123. J. Nutr. 2007, 137, 1602S–1609S. [Google Scholar] [CrossRef]
  74. Komoda, T.; Matsunaga, T. Chapter 4—Metabolic Pathways in the Human Body. In Biochemistry for Medical Professionals; Komoda, T., Matsunaga, T., Eds.; Academic Press: Boston, MA, USA, 2015; pp. 25–63. [Google Scholar]
  75. Wang, B.; Wu, Z.; Wang, F.; Yin, Z.; Shi, L.; Liu, Y. Nasal nitric oxide testing for allergic rhinitis patients: Systematic review and meta-analysis. Immun. Inflamm. Dis. 2021, 9, 635–648. [Google Scholar]
  76. Kohlmeier, M. Chapter 8—Amino Acids and Nitrogen Compounds. In Nutrient Metabolism, 2nd ed.; Kohlmeier, M., Ed.; Academic Press: San Diego, CA, USA, 2015; pp. 265–477. [Google Scholar]
  77. Serim, I.; Demirel, H.H.; Zemheri-Navruz, F.; Ince, S. Taurine exhibits antioxidant, anti-inflammatory, and antiapoptotic effects against pyraclostrobin exposure in rats. Toxicol. Res. 2024, 13, tfae120. [Google Scholar] [CrossRef]
  78. Nam, S.-Y.; Kim, H.-M.; Jeong, H.-J. The potential protective role of taurine against experimental allergic inflammation. Life Sci. 2017, 184, 18–24. [Google Scholar] [CrossRef]
  79. Li, X.; Yang, Y.; Zhang, B.; Lin, X.; Fu, X.; An, Y.; Zou, Y.; Wang, J.-X.; Wang, Z.; Yu, T. Lactate metabolism in human health and disease. Signal Transduct. Target. Ther. 2022, 7, 305, Correction in Signal Transduct. Target. Ther. 2022, 7, 372. [Google Scholar] [CrossRef]
  80. Fang, Y.; Li, Z.; Yang, L.; Li, W.; Wang, Y.; Kong, Z.; Miao, J.; Chen, Y.; Bian, Y.; Zeng, L. Emerging roles of lactate in acute and chronic inflammation. Cell Commun. Signal. 2024, 22, 276. [Google Scholar] [CrossRef]
  81. Phinyo, P.; Krikeerati, T.; Wongyikul, P.; Lao-Araya, M.; Thongngarm, T. House dust mite allergen immunotherapy for monosensitized versus polysensitized patients with allergic rhinitis: A systematic review and meta-analysis. Asian Pac. J. Allergy Immunol. 2022, 40, 337–352. [Google Scholar] [CrossRef]
  82. Roberts, G.; Pfaar, O.; Akdis, C.A.; Ansotegui, I.J.; Durham, S.R.; Gerth van Wijk, R.; Halken, S.; Larenas-Linnemann, D.; Pawankar, R.; Pitsios, C.; et al. EAACI Guidelines on Allergen Immunotherapy: Allergic rhinoconjunctivitis. Allergy 2018, 73, 765–798. [Google Scholar] [CrossRef]
  83. Catella, F.; Healy, D.; Lawson, J.A.; FitzGerald, G.A. 11-Dehydrothromboxane B2: A quantitative index of thromboxane A2 formation in the human circulation. Proc. Natl. Acad. Sci. USA 1986, 83, 5861–5865. [Google Scholar]
  84. Sonnweber, T.; Pizzini, A.; Nairz, M.; Weiss, G.; Tancevski, I. Arachidonic Acid Metabolites in Cardiovascular and Metabolic Diseases. Int. J. Mol. Sci. 2018, 19, 3285. [Google Scholar] [CrossRef]
  85. Vangaveti, V.; Baune, B.T.; Kennedy, R.L. Hydroxyoctadecadienoic acids: Novel regulators of macrophage differentiation and atherogenesis. Ther. Adv. Endocrinol. Metab. 2010, 1, 51–60. [Google Scholar] [CrossRef]
  86. Kreider, R.B.; Stout, J.R. Creatine in Health and Disease. Nutrients 2021, 13, 447. [Google Scholar] [CrossRef]
  87. Sivashanmugam, M.; Jaidev, J.; Umashankar, V.; Sulochana, K.N. Ornithine and its role in metabolic diseases: An appraisal. Biomed. Pharmacother. 2017, 86, 185–194. [Google Scholar] [CrossRef]
  88. Kraj, L.; Krawiec, M.; Koter, M.; Graboń, W.; Kraj, G.; Chołojczyk, M.; Kulus, M.; Barańczyk-Kuźma, A. Altered L-arginine metabolism in children with controlled asthma. Allergy Asthma Proc. 2014, 35, 80–83. [Google Scholar] [CrossRef]
  89. Wells, G.D.; Selvadurai, H.; Tein, I. Bioenergetic provision of energy for muscular activity. Paediatr. Respir. Rev. 2009, 10, 83–90. [Google Scholar] [CrossRef]
  90. Goretzki, A.; Zimmermann, J.; Rainer, H.; Lin, Y.J.; Schülke, S. Immune Metabolism in TH2 Responses: New Opportunities to Improve Allergy Treatment—Disease-Specific Findings (Part 1). Curr. Allergy Asthma Rep. 2023, 23, 29–40. [Google Scholar] [CrossRef]
  91. Caslin, H.L.; Abebayehu, D.; Pinette, J.A.; Ryan, J.J. Lactate Is a Metabolic Mediator That Shapes Immune Cell Fate and Function. Front. Physiol. 2021, 12, 688485. [Google Scholar] [CrossRef]
  92. Tham, E.H.; Lee, A.J.; Bever, H.V. Aeroallergen sensitization and allergic disease phenotypes in Asia. Asian Pac. J. Allergy Immunol. 2016, 34, 181–189, Erratum in Asian Pac. J. Allergy Immunol. 2017, 35, 66. [Google Scholar] [CrossRef]
  93. Roca, M.; Alcoriza, M.I.; Garcia-Cañaveras, J.C.; Lahoz, A. Reviewing the metabolome coverage provided by LC-MS: Focus on sample preparation and chromatography-A tutorial. Anal. Chim. Acta 2021, 1147, 38–55. [Google Scholar] [CrossRef]
  94. Fiehn, O. Metabolomics by Gas Chromatography-Mass Spectrometry: Combined Targeted and Untargeted Profiling. Curr. Protoc. Mol. Biol. 2016, 114, 30.4.1–30.4.32. [Google Scholar] [CrossRef]
  95. Nagana Gowda, G.A.; Raftery, D. NMR-Based Metabolomics. Adv. Exp. Med. Biol. 2021, 1280, 19–37. [Google Scholar]
  96. Roberts, L.D.; Souza, A.L.; Gerszten, R.E.; Clish, C.B. Targeted metabolomics. Curr. Protoc. Mol. Biol. 2012, 98, 30.2.1–30.2.24. [Google Scholar] [CrossRef]
  97. Zhang, Y.; Wu, Y.; Wang, Y.; Zhou, H. Group 2 innate lymphoid cells (ILC2s) in childhood allergic diseases: A review of the mechanisms and therapeutic advances. Cytokine 2026, 198, 157101. [Google Scholar] [CrossRef]
Figure 1. Narrative review flow diagram.
Ijms 27 05064 g001
Figure 2. Changes in lipid metabolism in AR and post-AIT; Red arrows represent changes in metabolites in AR patients, whereas green arrows represent metabolite changes post-AIT; 1 AUC > 0.9 for AR diagnosis; 2 AUC > 0.9 for AR severity; 3 AUC > 0.7 for AIT effectiveness; 4 Associated pathways for AR diagnosis; 5 Associated pathways for AR severity; 6 Associated pathways for AIT effectiveness; DAG: Diacylglycerol; FA: Fatty acid; HETE: Hydroxyeicosatetraenoic acid; LPC: Lysophosphatidylcholines; LT: Leukotriene; S1P: Sphingosine-1-phosphate; PG: Prostaglandin; PUFA: Polyunsaturated Fatty Acid; TAG: Triacylglycerol; TXB2: Thromboxane B2. Created with BioRender.com.
Ijms 27 05064 g002
Figure 3. Changes in amino acid metabolism in AR and post-AIT; Red arrows represent metabolite changes in AR patients, whereas green arrows represent metabolite changes post-AIT; 2 AUC > 0.9 for AR severity; 3 AUC > 0.7 for AIT effectiveness; 4 Associated pathways for AR diagnosis; 6 Associated pathways for AIT effectiveness; H2S: Hydrogen Sulfide; TCA: tricarboxylic acid. Created with BioRender.com.
Ijms 27 05064 g003
Table 1. Metabolome alterations in allergic rhinitis: Evidence from preclinical studies.
Study PopulationSensitizationMethod and SampleCategories of Metabolites/Metabolic PathwaysChanges in MetabolitesImpacted Pathway from Pathway AnalysisInterpretationCitation
IncreaseDecrease
In vitro study
Murine mast cellsLPS
(10 μg/mL for 4 h)
Untargeted and targeted
LC/MS in mast cell
Amino acids, peptides, and their related-metabolitesGlutathione
Oxiglutatione
L-arginine
L-asparagine
L-glutamine
L-phenylalanine
L-proline
L-serine
L-valine
L-histidinePhenylalanine
Tyrosine
Tryptophan
Histidine
Arachidonic acid
Sphingolipid
Glycine
Serine
Threonine
AR was associated with increased arachidonic acid and sphingolipid metabolism, whereas histidine metabolism was decreased[7]
Fatty acids and fatty acyls8S,15S-diHPETE
9-HpETE
Dinoprost
Epoprostenol
Arachidonic acid
LeukotrienesLeukotriene A4
Leukotriene D4
Leukotriene E4
Leukotriene B3
Leukotriene B4
Leukotriene B5
Thromboxanes Thromboxane A2
Thromboxane A3
Thromboxane B2
SphingolipidsCerP(d18:1/20:0)
Cer(d18:1/16:0)
Cer(d18:1/14:0)
Glycolysis and sugarsDHAP(18:0)Aminofructose 6-phosphate
OthersEthyl pyruvate
Histamine
Retinoic acid
Lipoxin C4
In vivo study
AR mice OVA
(40 μg OVA injection on day 0, 7, 14 and 21)
Untargeted LC-MS/MS in serum and fecesSerum AR was associated with decreased glycolysis and TCA cycle metabolism in serum, but increased amino acid, glycolysis, and TCA cycle metabolism in feces. However, alpha-linolenic acid levels were consistently decreased in both the serum and feces of AR mice.[8]
Amino acids, peptides, and their related-metabolitesL-tryptophanL-alanineSerum
TCA cycle
Bile secretion
Central carbon
Feces
TCA cycle
Fatty acids and fatty acyls3-phenylpropanoic acid
Myristoleic acid
9,10 DiHOME
2-hydroxy-butanoic acid
Alpha-linolenic acid
Arachidonic acid
Docosahexaenoic acid
12(R)-HETE
Glycolysis and sugars D-mannose
Sedoheptulose
D-lyxose
Nucleic acids2 Deoxyuridine
Thymidine
Xanthosine
TCA cycle Dihydroxyacetone
Pyruvaldehyde
Myo-inositol
D-allose
L-malic acid
Bile AcidsTaurochenodeoxycholate
Cholic acid
Deoxycholic acid
OthersUrocanic acidDL-lactate
Phosphorylcholine
Feces
Amino acids, peptides, and their related-metabolitesL-alanine
Dimethylglycine
N Acetyl DL-methionine
Pantothenic acid
Fatty acids and fatty acylsIsobutyric acid
Propionic acid
(S)-2-hydroxyglutaric acid
Citraconic acid
15 Keto PGE1, 3-phenylpropanoic acid
Docosahexaenoic acid
2-oxoadipic acid
Linolenic acid
9R,10S EpOME
Glycolysis and sugarsD-mannose
D-ribose
D-(+)-melibiose
Adynerin
Glyceric acid
Galacturonic acid
D-threitol
Nucleic acidsPurine
Xanthosine
Ribothymidine
Guanosine
Oxypurinol
TCA cycleAlphaketoglutate
Dihydroxyacetone
Bile acids Deoxycholic acid
Other organic acidsAcamprosate
OthersHomoveratric acid
Urocanic acid
AR miceOVA
(20 μg OVA injection on day 0, 2, 4, 6, 8, 10 and 12)
Untargeted LC/MS in serumAmino acids, peptides, and their related-metabolitesL-phenylalanine
L-arginine
Aspartyl-serine
D-tryptophan
Homocysteine
D-glutamine
D-asparagine
AR was associated with phenylalanine, tyrosine and tryptophan, phenylalanine and arachidonic acid metabolism detected in serum.[9]
Fatty acids and fatty acylsPalmitic amide
Arachidonic acid
Glycolysis and sugars Acetylglycine
PhospholipidsLPE (0:0/20:0)
LPC (15:0)
SphingolipidsCer (d18:0/18:0)
Nucleic acidsUric acid Uridine
Adenine
OthersCorticosterone
8S,15S-diHPETE, 8S,15S-dihydroperoxy-5Z,9E,11Z,13E-eicosatetraenoic acid; 9-HpETE, 9-hydroperoxy-5,7E,11Z,14Z-eicosatetraenoic acid; 9(10)-EpOME, 9,10-epoxy-12-cis-octadecenoic acid; 9R,10S EpOME, (9R,10S)-9,10-Epoxyoctadecenoic acid; AR, allergic rhinitis; C, control; Cer, Ceramide; CerP, Ceramide 1 phosphate; DHAP, dihydroxyacetonephosphate; HETE: hydroxyeicosatetraenoic acid; LC, liquid chromatography; LC/MS: Liquid Chromatography coupled with mass spectrometry; LC/MS/MS: Liquid chromatography coupled with tandem mass spectrometry; LPS, lipopolysaccharide; LPE: Lysophosphatidylethanolamines; LPC: Lysophosphatidylcholine; MS, mass spectrometry; OVA, ovalbumin; PC: Phosphatidylcholine; PE: Phosphatidylethanolamines; PGE, Prostaglandin E; PGE1, Prostaglandin E1; TCA, Tricarboxylic acid cycle.
Table 2. Metabolome alterations in allergic rhinitis: Evidence from clinical studies.
Study PopulationSensitizationMethod and SampleCategories of Metabolites/Metabolic PathwaysChanges in MetabolitesOther FindingsInterpretationCitation
IncreaseDecrease
C: 28.5 ± 8.5 (29)
vs.
MAR 1: 28.2 ± 9.6 (30)
vs.
MSAR 1: 30:4 ± 8.4 (42)
HDMUntargeted LC/MS in serumMAR 1 vs. C AR was associated with the increase in phospholipid and sphingolipid metabolism detected in serum, while levels of sarcosine, S1P, cytidine and linoleic acid detected in serum were associated with its severity.[10]
Amino acids, peptides, and their related-metabolitesSarcosine 4
5′-methylthioadenosine
5-methoxyindoleacetate
Creatinine
L-methionine
Fatty acids and fatty acylsPalmitic acidTrans-vaccenic acid
Arachidic acid
PhospholipidsTriethanolamine
SphingolipidsS1P 4
MSAR 1 vs. C
Amino acids, peptides, and their related-metabolites2-oxoadipic acid
Betaine
Sarcosine 4
1,3-diaminopropane
Fatty acids and fatty acylsCis-9-palmitoleic acidLinoleic acid 4
PhospholipidsPhosphorylcholine
SphingolipidsS1P 4
Nucleic acidsCytidine 4
Bile acids Taurocholic acid
MSAR 1 vs. MAR 1
Amino acids, peptides, and their related-metabolitesBetaine
Sarcosine 4
Pyroglutamic acid
Fatty acids and fatty acyls Linoleic acid 4
Palmitoleic
Trans-vaccenic acid
SphingolipidsS1P
Nucleic acidsCytidine 4
OthersD-glucurono-6,3-lactoneCoumarin
C: 8.77 ± 2.50 (44)
vs.
PR: 7.84 ± 3.33 (43)
vs.
NR: 7.91 ± 3.22 (32)
Inhalant allergenUntargeted LC/MS in serumAR vs. C AR and its severity were associated with an increase in lipid metabolism detected in serum.[11]
Fatty acids and fatty acylsFA (20:4), (30:7) 2
NAE (22:5)
PhospholipidsLPC (18:0) 2, (16:0) 2, (20:1)
LPC(O) (18:2), (18:1) 2, (18:0), (16:1), (16:0)
PE (36:4), (38:6)
LPE (16:0)
PS (38:4)
Other lipidsTG (56:2), (54:8), (54:4), (52:5), (60:3), (58:3), (58:2), (56:1), (54:7)
DAG (38:5), (36:5), (36:3), (36:2), (36:1), (34:0) 2,3, (38:6), (36:4), (34:2), (34:1)
CL (62:2) 3
NR vs. PR
Other lipidsDAG (34:0), (32:0), (36:0), (42:6)
CL (62:6)
Pollen season
vs.
Remission
Pollen allergenUntargeted 1H NMR in serumAmino acids, peptides, and their related-metabolitesN-acetylglutamineIsoleucine
Leucine
Valine
Allothreonine
Alanine
Methionine
Glutamine
Lysine
Glycine
L-tyrosine
Histidine
Phenylalanine
Creatine
Creatinine
AR and its severity were mainly associated with alterations in amino acid and lipid metabolism detected in serum.[12]
Fatty acids and fatty acyls 3-hydroxybutyric acid
Glycolysis Lactate
OthersIsopropanolAcetate
O-acetyl-choline
C: 34.8 ± 3.2 (15)
vs.
AR: 39.8 ± 2.7 (28)
Seasonal allergenUntargeted LC/MS in serumAmino acids, peptides, and their related-metabolites L-tryptophanRespiratory microbiomes

Serum metabolome levels
AR was associated with alterations in linoleic acid, arachidonic acid, and caffeine metabolism detected in serum, which might be mediated by the alterations in respiratory microbiomes.[13]
Linoleic acid metabolismLinoleic acid9,10-epoxyoctadecenoic acid
12,13-EpOME
Other fatty acids and fatty acylsOleic acid
Docosahexaenoic acid
Glycolysis and sugars D-glucose
Phospholipids Glycero phosphocholine
PA (P-16:0/18:2(9Z,12Z))
Arachidonic acid metabolismProstaglandin E2
Prostaglandin H2
Prostaglandin D2
Thromboxane A2
20-hydroxy-leukotriene B4
Nucleic acidsDeoxyuridineInosine
Bile acids Chenodeoxycholic acid
Taurochenodesoxycholic acid
Caffeine metabolism Paraxanthine
Theobromine
OthersBilirubin
6-thioxanthine 5′-
monophosphate
Coproporphyrin
Glycine conjugate
Pregnenolone sulfate
Dehydroepiandrosteronesulfate
Presqualene diphosphate
C: 42.52 ± 6.44 (28)
vs.
AR: 45.13 ± 7.85 (28)
AeroallergenTargeted LC/MS in serumAmino acids, peptides, and their related-metabolites N-succinyl-L-diaminopimelic acid AR was associated with alterations in porphyrin-chlorophyll, arachidonic acid, and purine metabolism detected in serum.[14]
Fatty acids and fatty acyls15(S)-HETE
Hexadecanoic acid
13(S)-HPODE
Phospholipids Leukotriene D4
Nucleic acidsHypoxanthine
Urate
OthersBilirubinStercobilinogen
Chlorophyll B
C: 36.93 ± 3.50 (14)
vs
AR: 41.21 ± 1.85 (14)
AeroallergenUntargeted
LC in sputum
Amino acids, peptides, and their related-metabolitesErgothioneine
N-arachidonoyl-l-alanine
Epoxomicin
L-tryptophan
AR was mainly associated with alterations in amino acid, fatty acid, lipid, nucleic acid, TCA cycle, and bile acid metabolism detected in sputum.[15]
Fatty acids and
fatty acyls
1,3-diaminopropane acetol
13,14-dihydro-15-ketoprostaglandin d1
Other lipidsManoalide
(-)-perillyl alcohol
Lupenone
Zerumbone
Hyperforin
10-deacetylbaccatin III
Nucleic acidsS-methyl-5′-thioadenosine
Thymine
Barbituric acid
Inosine
TCA cyclePolygodialSuccinate
Other organic acids Didodecyl 3,3′’-dithiodipropionate
Spiculisporic acid
Bile acidsChenodeoxycholic acid
OthersZinniol
Echimidine
Acebutolol
Scutellarein,DI 4-hydroxy-3-methoxymandelic acid
Guanidine
3-methylbenzyl alcohol
Procyanidin A2
Phenytoin
Aminophenazone
AR: 41.4 ± 10.2 (41)Ragweed1H NMR in urineAfter allergen challenge AR and its severity were associated with alterations in amino acid, fatty acid, glycolysis, nucleic acid, TCA cycle,
and organic acid metabolism detected in urine.
[16]
Amino acids, peptides, and their related-metabolitesGlycinePyroglutamate
Fatty acids and fatty acylsGlycolic acid
Glycolysis and sugarsTartrateXylose
Nucleic acids Hypoxanthine
TCA cycle Succinate
Other organic acidsFormate
Trans-aconitate
1-methylnicotinamide
C: 4.9 ± 0.8 (24)
vs.
AR: 4.9 ± 0.5 (26)
Der p and Der f1H NMR
in stool, blood and urine
Blood Stool
IgE level

Blood
Isovaleric acid
Levels of urine alanine, N,N-dimethylglycine, and chlophedianol, along with levels of blood isovaleric acid, ethanol, and acetylcarnitine were associated with AR.[17]
Amino acid and peptidesPhenylalanine
Fatty acids and fatty acylsIsovaleric acid
Urine
Amino acids, peptides, and their related-metabolites N,N Dimethylglycine
Alanine
OthersChlophedianol
1 MAR and MSAR were categorized according to ARIA criteria; 2 ROC curves of the differential lipids (AR vs. C) with an AUC > 0.9; 3 NR > C and NR > PR; 4 Area under the curve (AUC) value higher than 0.9 for AR severity; 12,13-EpOME, 12,13-cis-Epoxyoctadecenoic acid; 13(S)-HPODE,13(S)-Hydroperoxyoctadecadienoic Acid; ∝, Association; AR, allergic rhinitis; AS, Asthma; AUC, area under the curve; C, control; CL: cardiolipin; DAG: diacglycerol; EPA: eicosapentaenoic acid; FA: fatty acids; HDM, House dust mite; HETE, hydroxyeicosatetraenoic acid; IgE, Immunoglobulin E; IL, Interleukin, LC: Liquid chromatography; LC/MS: Liquid chromatography coupled with mass spectrometry; LPI: Lysophosphatidylinositols; LPC: Lysophosphatidylcholines; LPC(O): ether-linked lysophosphatidylcholine; LPE: Lysophosphatidylethanolamines; MAR, Mild allergic rhinitis; MSAR, moderate–severe allergic rhinitis; MS, mass spectrometry; NMR, nuclear magnetic resonance; NAE: N-acetylethanolamine; NR, Inhalant allergen-negative group; PAF: Platelet-activating; PE: Phosphatidylethanolamines; PS: Phosphatidylserine; VAS, visual analog scale; PR, Inhalant allergen-positive group; S1P, sphingosine-1-phosphate; TCA, Tricarboxylic acid cycle; TG: triacylglycerol; TNSS, total nasal symptom score.
Table 3. Metabolomes and metabolic pathways as diagnostic and severity markers for allergic rhinitis.
MetaboliteDiagnosis of ARSeverity of ARCitation
Pathway AnalysisROC Analysis (AUC > 0.9)Pathway AnalysisCorrelation AnalysisROC Analysis (AUC > 0.9)
LipidFatty acid
Glycerophospholipid
Sphingolipid
Fatty acid
Sphingolipid
Increased S1P
Decreased Linoleic acid
[10] 1
Glycerophospholipid
Linoleic acid
Alpha- Linoleic acid
Glycerolipid
Arachidonic acid
Increased FA 30:7
Increased LPC(O) 18:1
Increased DAG 34:0
Increased LPC 18:0
Increased LPC 16:0
Increased DAG
Increased LPC
Increased TG
Increased FA
[11] 2
Linoleic acid
Arachidonic acid
[13]
Arachidonic acid [14]
Amino acid and peptideArginine and proline Increased Sarcosine[10] 1
Nucleic
acids
Pyrimidine Increased Cytidine[10] 1
Purine [14]
OthersCaffeine [13]
Porphyrin
Chlorophyll
[14]
Combined multiple metabolites Combined 3
Isovaleric acid
Ethanol
Acetylcarnitine
Urine alanine
Urine N,N-dimethylglycine,
Urine chlophedianol
[17]
1 Severity of AR based on total nasal symptom score and visual analog scale; 2 Severity of AR based on serum IgE and IL-33 level; 3 AUC > 0.8; DAG: Diacylglycerol; FA: Fatty acid; LPC: Lysophosphatidylcholines; LPC O: Ether-linked lysophosphatidylcholine; TG: Triacylglycerol.
Table 4. Metabolome alterations in allergic rhinitis after allergen immunotherapy: Evidence from clinical studies.
Study PopulationSensitizationAllergen ImmunotherapyMethod and SampleCategories of Metabolites/Metabolic PathwaysChanges in MetabolitesInterpretationCitation
IncreaseDecrease
Ineffective group 1: 32.10 ± 14.77
(10)
vs.
Effective group 2: 27.30 ± 12.40
(33)
Artemisia sieversiana pollenAllergen extracts:
0.5 mL of standardized Artemisia sieversiana allergen extracts (1.75 mg/5 mL)
Route:
SCIT
Maintenance schedule:
Twice a week for 1 year
Untargeted LC/MS and GC/MS in serumEffective group vs. Ineffective groupAlterations in taurine- hypotaurine, pentose-glucuronate, pentose phosphate pathway, alanine, aspartate, and glutamate metabolism detected in serum were associated with SCIT, in which serum hypotaurine, taurine, and l-alanine levels were the robustest markers.[66]
Amino acids, peptides, and their related-metabolites
  • L-prolinamide
  • Homocitrulline
  • DL-norvaline
  • Cysteinylglycine
  • L-alanine
  • L-norvaline
  • L-threo-beta-hydroxy aspartic acid
Fatty acids and fatty acyls
  • Indole-3-acetic acid
  • 3-hydroxypyruvate
  • Palmitoleic acid
  • Acar (18:2), (18:1)
  • 5-aminovaleric acid
  • Succinic acid semialdehyde
  • ACar (8:1), (22:6), (12:1), (14:2), (14:1), (16:1), (20:4), (18:2), (16:0)
Glycolysis and sugars
  • Glyceric acid
  • Xylitol
  • Maltose
  • D-ribulose
  • Gluconic acid
  • Deoxy-galactose
Phospholipids
  • PI (36:4), (36:2), (38:4), (36:5e), (34:0)
  • PC (16:0e), (18:0e), (20:5e), (18:2e), (20:4e), (17:0e)
  • LPC (20:5), (18:2), (18:1), (18:0)
  • PI (36:3), (36:2)
  • PE (18:0), (19:0), (20:0), (38:6), (40:8e), (36:4), (34:2), (36:5e), (34:3e), (36:2), (36:4e), (36:2), (40:6e), (36:2e), (36:3e)
  • LPE (18:2), (18:1), (18:0)
  • PC (18:0e), (16:1e) (18:2e), (16:0e), (18:1e)
  • LPC (18:2), (18:0), (16:0)
Nucleic acids
  • Uridine,
  • 2′-deoxyadenosine (3TMS)
  • Xanthosin
  • Phenobarbital
  • Cyclobarbital
TCA cycle
  • D-fructofuranose 6-phosphate
  • Inositol-1-phosphate, myo-
Other organic acids
  • Taurine
  • Hypotaurine,
  • L-3,4-dihydroxymandelic acid
  • Ferulic acid cis
Others
  • D-glucarate
  • Homogentisic acid
  • Alpha-tocopherol
  • P-cymene
  • Hydroxylamine
  • Dopamine
  • Pyrogallols
  • 2-methylHippuric acid
SM-SCIT: 11.00 (IQR 2.5) (63)
vs.
DM-SCIT: 10.50 (IQR 6.3) (62)
Der p and Der fAllergen extracts 3:
SM-SCIT Der p VS
DM-SCIT: Der p:Der f = 1:1
Route:
SCIT
Maintenance schedule:
36–42 weeks
Targeted LC/MS in serumPost SM-SCIT vs. BaselineAlterations in omega-6-related arachidonic acid and linoleic acid metabolism detected in serum were associated with treatment response of SCIT.[67]
Arachidonic acid
  • 15(S)-HETE
  • 5(S)-HETE
  • 12(S)-HEPE
Linoleic acid
  • 9(S)-HPODE
  • 13-HODE
Post DM-SCIT vs. Baseline
Arachidonic acid
  • 15(S)-HETE
  • 11(S)-HETE
  • 8(S)-HETE
  • 5(S)-HETE
  • 12(S)-HEPE
  • 5(S)-HEPE
Linoleic acid
  • 13-HODE
Alpha-Linoleic acid
  • EPA
  • Alpha-linolenic acid
Effective group vs. Ineffective group (VIP > 2)
Ineffective group: 32.7 ± 8.3
(29)
vs.
Effective group 4: 30.30 ± 9.3
(39)
Der f ± Der pAllergen extracts:
100 μL daily of standardized allergen
Der f drops (1000 μg/mL)
Route:
SLIT drop
Maintenance schedule:
3 years
Targeted LC/MSAmino acids, peptides, and their related-metabolites
  • L-phenylalanine
  • Nitrotyrosine
  • Ornithine 5
  • Glycine
The alterations in glycolysis, pyruvate-arginine-proline, and fatty acid metabolism detected in serum were associated with efficacy of SLIT.[68]
Fatty acids and fatty acyls
  • Linolenic acid 5
  • Arachidonic acid 5
  • Creatinine 5
Phospholipids
  • Sphingosine 5
Nucleic acids
  • Flucytosine
  • Xanthine
Other organic acids
  • Lactic acid 5
  • Urea
Placebo group: 36 ± 10 (14)
vs.
Active group: 36 ± 10 (8)
Monosensitization
(10)
vs.
Polysensitization
(12)
Grass-pollen
(Phleum pratense)
Allergen extracts: GRAZAX® (Phleum pratense, 75,000SQ-T tablets)
Route:
SLIT
Maintenance schedule:
2 years
Untargeted LC/MS and GC/MS in serumActive vs. Placebo T2Lysophospholipid, bile acid, and fatty acid metabolism detected in serum were altered after SLIT.[69]
Amino acids, peptides, and their related-metabolites
  • Tyramine
  • Phe-Phe
Fatty acids and fatty acyls
  • C 22:6 (DHA)
  • C 18:0 (Stearic Acid)
Phospholipids
  • LPC (18:2), (20:4)
  • LPC (12:0)
  • PC (O-15:0/20:4)
Bile acids
  • Glycochenodeoxycholic
  • Acid 3-glucuronide
  • Taurocholic Acid 3-sulfate
  • Ursodeoxycholic Acid
Others
  • Thymol Sulfate
  • P-cresol
  • Hydrogen sulfite
Poli vs. Mono T0
Amino acids, peptides, and their related-metabolites
  • Trp-Leu
Fatty acids and fatty acyls
  • Arachidonic Acid
  • Adrenic Acid
  • Linoleic Acid
  • Linolenic Acid
  • Tetradecanedioic Acid
Phospholipids
  • Lyso-PAF C:16
  • Lyso-PAF C:18
  • LPC (16:1)
  • PC (18:1/13:0)
  • PE (14:0/12:0)
  • PS (24:1/22:4)
Other organic acids
  • Citric Acid
Bile acids
  • Glycochenodeoxy cholic acid 3-sulfate
Poli-Active vs. Mono-Active T2
Amino acids, peptides, and their related-metabolites
  • Trans-4-hydroxy-l-proline
Bile acids
  • Deoxycholic acid 3-glucuronide
Others
  • Benzoic Acid
  • 3-keto-sphingosine
  • Levoglucosan
  • Erythritol
Ineffective group 1: 32.10 ± 14.77
(10)
vs.
Effective group 2: 27.30 ± 12.40
(33)
Artemisia sieversianaAllergen extracts: standardized Artemisia sieversiana (1.75 mg/5mL)
Route: SCIT
Maintenance schedule:
1 year
Untargeted LC/MS and GC/MS in serumPre vs. post treatment SCIT was associated with the alterations in amino acid, fatty acid, glycolysis,
phospholipid, nucleic acid and
organic acid
metabolism detected in serum, in which serum L-tyrosine level was the most robust marker.
[70]
(Effective group)
Amino acids, peptides, and their related-metabolites
  • DL-threo-b-hydroxyaspartic acid
  • L-pyroglutamic acid
  • L-tyrosine
  • L-valine
Fatty acids and fatty acyls
  • ACar(8:1), (22:6), (14:2), (20:4)
  • Gamma-linolenic acid
  • Succinic semialdehyde
  • 5-aminovaleric acid
Glycolysis and sugars
  • D-ribulose
Phospholipids
  • PI (36:4), (34:1), (38:4), (36:2)
  • PE (38:6), (38:7e), (36:4), (38:6e), (34:2), (36:5e), (40:8e), (36:4e), (38:4), (34:3e), (40:7e), (38:5e), (36:2), (38:5e), (36:3e), (36:2e)
  • LPE (18:2), (18:0)
  • LPC (16:0)
  • PC (18:2e), (20:4e)
Nucleic acids
  • 3-methyladenine
Other organic acids
  • Hypotaurine
  • Ferulic acid
Others
  • P-cymene
  • 4-methylbenzoic acid
1 Therapeutic index ≤25% admitted to the ineffective group.; 2 Therapeutic index ≥66% admitted to the effective group.; 3 No mention about the exact dose; 4 Patient obtained at least 30% reduction in symptom and medication score (SMS) compared to baseline; 5 Area under the curve (AUC) value of each metabolite should be higher than 0.7 for predicting AIT effectiveness; ACar, Acylcarnitines; AR, allergic rhinitis; CL, Cardiolipin; COX, Cyclooxygenase; Der f, Dermatophagoides farina; Der p, Dermatophagoides pteronyssinus; DAG, diacylglycerol; DHA, Docosahexaenoic acid; DM-SCIT, Double-mite subcutaneous immunotherapy; EPA, Eicosapentaenoic acid; FA, Fatty acids; GCDCA, Glycochenodeoxycholic Acid; GC/MS: Gas chromatography coupled with mass spectrometry; GPx, Glutathione peroxidase; HETE, Hydroxyeicosatetraenoic acid; HEPE, Hydroxyeicosapentaenoic acid; HHTrE, Hydroxyheptadecatrienoic acid; HPODE, Hydroperoxylinoleic acid; HODE, Hydroxyoctadeca- dienoic acid; HOTrE, Hydroxyoctadecatrienoic acid; LC/MS, Liquid chromatography coupled with mass spectrometry; Leu, Leucine; LOX, Lipoxygenase; LPI, Lysophosphatidylinositols; LPC, Lysophosphatidylcholines; LPC(O), Ether-linked lysophosphatidylcholine; LPE, Lysophosphatidylethanolamines; MS, Mass spectrometry; NAE, N-acetylethanolamine; OVA, Ovalbumin; PAF, Platelet-activating factor; PC, Phosphatidylcholine; PE, Phosphatidylethanolamines; Phe, phenylalanine; PI, Phosphatidylinositols; PS, Phosphatidylserine; SCFAs, Short-chain fatty acids; SM-SCIT, Single-mite subcutaneous immunotherapy; SMS, symptom and medication score; SPF, Specific pathogen-free; TCDCA, Taurochenodeoxycholate; Trp, Tryptophan; UCA, Urocanic acid; VIP, Variable importance plot; ROC, Receiver operating characteristic; RQLQ, Rhinitis conjunctivitis quality of life questionnaire; TG, Triacylglycerol.
Table 5. Metabolomes and metabolic pathways as allergen immunotherapy response markers for allergic rhinitis.
MetabolitesEffectiveness of Allergen ImmunotherapyCitation
Pathway AnalysisCorrelation/Univariate AnalysisROC Analysis (AUC > 0.7) for Effective Group
Lipids
  • Decreased 11-dehydroTXB2
  • Decreased 11(S)-HETE
  • Decreased 13-HODE
  • Decreased 15(S)-HETE
  • Decreased 5(S)-HETE
  • Decreased 8(S)-HETE
[67] 2
  • Fatty acid
  • Decreased arachidonic acid
  • Increased linolenic acid
  • Decreased sphingosine
[68] 3
  • Arachidonic acid
[69] 4
Amino acids, peptides, and their related-
metabolites
  • Alanine, aspartate and glutamate
  • Taurine and hypotaurine
  • Decreased hypotaurine
  • Decreased L-alanine
  • Increased taurine
[66] 1
  • Arginine and proline
  • Decreased creatinine
  • Decreased ornithine
[68] 3
  • Alanine, aspartate and glutamate
  • Aminoacyl tRNA
  • Arginine and proline
  • Butanoate
  • Nitrogen
  • Phenylalanine, tyrosine and tryptophan
  • Taurine and hypotaurine
[70] 1
Glycolysis
  • Glycolysis
  • Decreased lactate
[68] 3
  • Glycolysis
[69,70] 1,4
Pentose phosphate
pathway
  • Pentose phosphate pathway
[66,70] 1
1 Efficacy of SCIT based on therapeutic index (≥66%); 2 Efficacy of SCIT based on rhinitis conjunctivitis quality of life questionnaire; 3 Efficacy of SCIT based on symptom and medication score (≥30% reduction); 4 Efficacy of SCIT based on reduction in mast cells and phagocytes; HETE: Hydroxyeicosatetraenoic acid; HODE: Hydroxyoctadecadienoic acid; TXB2: Thromboxane B2.
Disclaimer/Publisher’s Note: The statements, opinions and data contained in all publications are solely those of the individual author(s) and contributor(s) and not of MDPI and/or the editor(s). MDPI and/or the editor(s) disclaim responsibility for any injury to people or property resulting from any ideas, methods, instructions or products referred to in the content.