1. Introduction
The preclinical development of new active pharmaceutical ingredients has long been associated with large-scale animal studies. With the advent of novel cell-based technologies, animal use in preclinical studies can now be reduced, and is even no longer necessary for registration of novel drugs in the USA, according to the FDA Modernization Act 2.0 [
1]. Moreover, novel cell-based technologies enable more cost-efficient pharmaceutical development and, in some cases, even better translational value from pre-clinical to clinical studies [
2,
3]. One such novel technology is organs-on-a-chip (OOC), which are distinguished from other cell culture models by the incorporation of culture media flow and establishment of complex intercellular communication in a 3D extracellular matrix [
3].
The exposure of cells to flow of culture medium can significantly change cell behavior compared to static conditions. This is especially important for in vitro studies of the vasculature and microvasculature to mimic in vivo conditions where endothelial cells are continuously exposed to shear stress [
4,
5,
6]. OOC systems have therefore been increasingly used to establish models of endothelial barrier (dys)function in disease [
5,
7], migration of neutrophils [
8], inflammation [
9,
10], and atherosclerosis [
11,
12].
The vascular endothelium is crucial for maintaining multiple body functions, such as hemostasis, vascular tone, and leukocyte migration, via endocrine, paracrine, and autocrine pathways. Endothelial dysfunction can lead to an imbalance in the production of vasodilatory and vasoconstrictive mediators, resulting in reduced vasodilatory capability of blood vessels, predominantly due to the decrease in nitric oxide (NO) availability [
13,
14]. One of the main causes of endothelial dysfunction and endothelium activation is the imbalance between reactive oxygen species (ROS) and antioxidants. ROS can influence the onset of endothelial dysfunction via many pathways, including the reduction in NO availability. This can be a consequence of direct reactions between ROS and NO, for example the reaction of the superoxide anion (O
2•
−), with NO to form peroxynitrite. Alternatively, ROS can disrupt the synthesis of NO through activation of inflammatory pathways mediated by TNF-α, which can lead to decreased endothelial nitric oxide synthase (eNOS) activity [
15]. Importantly, shear stress and oxidative stress are intimately interconnected in vascular pathophysiology. Laminar shear stress enhances antioxidant defenses through Nrf2-mediated upregulation of phase II detoxifying enzymes and antioxidant proteins [
16]. In contrast, disturbed blood flow increases ROS production through NADPH oxidase (NOX) activation and endothelial mitochondrial dysfunction while simultaneously impairing antioxidant systems [
17]. This mechanistic crosstalk suggests that to accurately model endothelial oxidative stress responses we need to incorporate physiologically relevant flow conditions.
High levels of oxidative stress also play a key role in ischemia-reperfusion injury. During ischemia, ischemic damage to endothelial cells and surrounding tissue is directly proportional to the duration of ischemia. However, the reperfusion injury is caused by the restoration of blood flow. It causes endothelial and tissue damage with a condition of extreme oxidative stress, caused by an influx of neutrophils which produce inflammatory cytokines, free radicals, and vasoactive substances [
18,
19]. This leads to microvascular damage, which decreases the barrier function of the endothelium and enables the extravasation of blood components and immune cells [
18,
19,
20].
Various endothelial cell types have already been cultured in microfluidic devices, including human umbilical vein endothelial cells (HUVECs), human coronary artery endothelial cells (HCAECs), bovine aortic endothelial cells (BAECs), and immortalized cell lines such as EA.hy926 [
5,
9,
11,
12,
21]. While primary endothelial cells offer greater physiological relevance, immortalized cell lines such as EA.hy926 provide advantages of consistency, reproducibility, and reduced donor-to-donor variability, making them a valuable tool for standardized assay development and screening applications [
22]. The EA.hy926 cell line, derived from fusion of HUVECs with the human lung carcinoma cell line A549, has become a widely used model for endothelial research due to its retention of endothelial characteristics (expression of von Willebrand factor, CD31, VE-cadherin, eNOS) combined with indefinite proliferative capacity [
22,
23].
Currently available endothelium-on-chip models were developed to study (i) endothelial barrier function and permeability [
24]; (ii) leukocyte adhesion and transmigration [
9]; (iii) angiogenesis and vascular network formation [
25]; and (iv) disease modeling including atherosclerosis, thrombosis, and vascular inflammation [
5,
11,
26]. However, relatively few studies have systematically investigated endothelial responses to oxidative stress under flow conditions in vitro, despite the clear mechanistic rationale for such an approach.
Thus, we aimed to investigate the effects of severe oxidative stress on the endothelium and to develop an endothelium-on-a-chip model for in vitro evaluation of acute oxidative injury. The aim was not to design a new chip architecture, but to develop and document a reproducible, accessible endothelial OOC assay for acute oxidative injury under flow using commercially available components. The OOC model was based on the human endothelial cell line EA.hy926, which was chosen due to its being one of the most studied endothelial cell lines, while offering good repeatability and robustness for method development [
22,
23,
27]. In this study we highlighted the importance of collagen-coating in the preparation of an endothelium-on-a-chip model, developed a method for the determination of cell viability in an OOC, and established two different in vitro models of acute oxidative injury, one based on application of H
2O
2 and the other on application of free radical generator AAPH. Together, these experiments provide a methodological framework for the study of acute endothelial injury and screening of potential protective effects of novel pharmacological approaches.
3. Discussion
In our study, we developed an endothelium-on-a-chip model, which enables culturing of endothelial cells under conditions of flow. It also supports cell-viability-based as well as image-analysis-based evaluation of acute oxidant-induced endothelial injury. Rather than attempting to reproduce the full complexity of ischemia–reperfusion injury, we aimed to establish a technically accessible endothelial platform that incorporates controlled medium flow and the ability to induce acute oxidative injury. This would allow us to compare endothelial responses under static and flow conditions. From this perspective, the current model should primarily be viewed as a methodological framework for studying acute endothelial injury under conditions that are relevant to reoxygenation and that mimic certain aspects of reperfusion-associated oxidative injury. We developed a human endothelium-on-a-chip platform that integrates physiologically relevant fluid flow with acute oxidative injury modeling. Our principal findings demonstrate the following: (i) EA.hy926 endothelial cells can be cultured and maintained under continuous perfusion at low physiological levels of shear stress (0.08–0.89 Pa); (ii) flow conditions increased cellular sensitivity to oxidative injury induced by both H2O2 and AAPH, as reflected by 26–28% decrease in IC50 values compared to static conditions; and (iii) the model is suitable for screening antioxidant compounds, as demonstrated by quercetin pretreatment.
3.1. Establishment of a Medium-Flow-Compatible Endothelial Microfluidic Platform
Collagen coating of microfluidic chip channels was applied because collagen is an important component of the vascular extracellular matrix in the arteries and can promote endothelial cell attachment and spreading on artificial surfaces [
30,
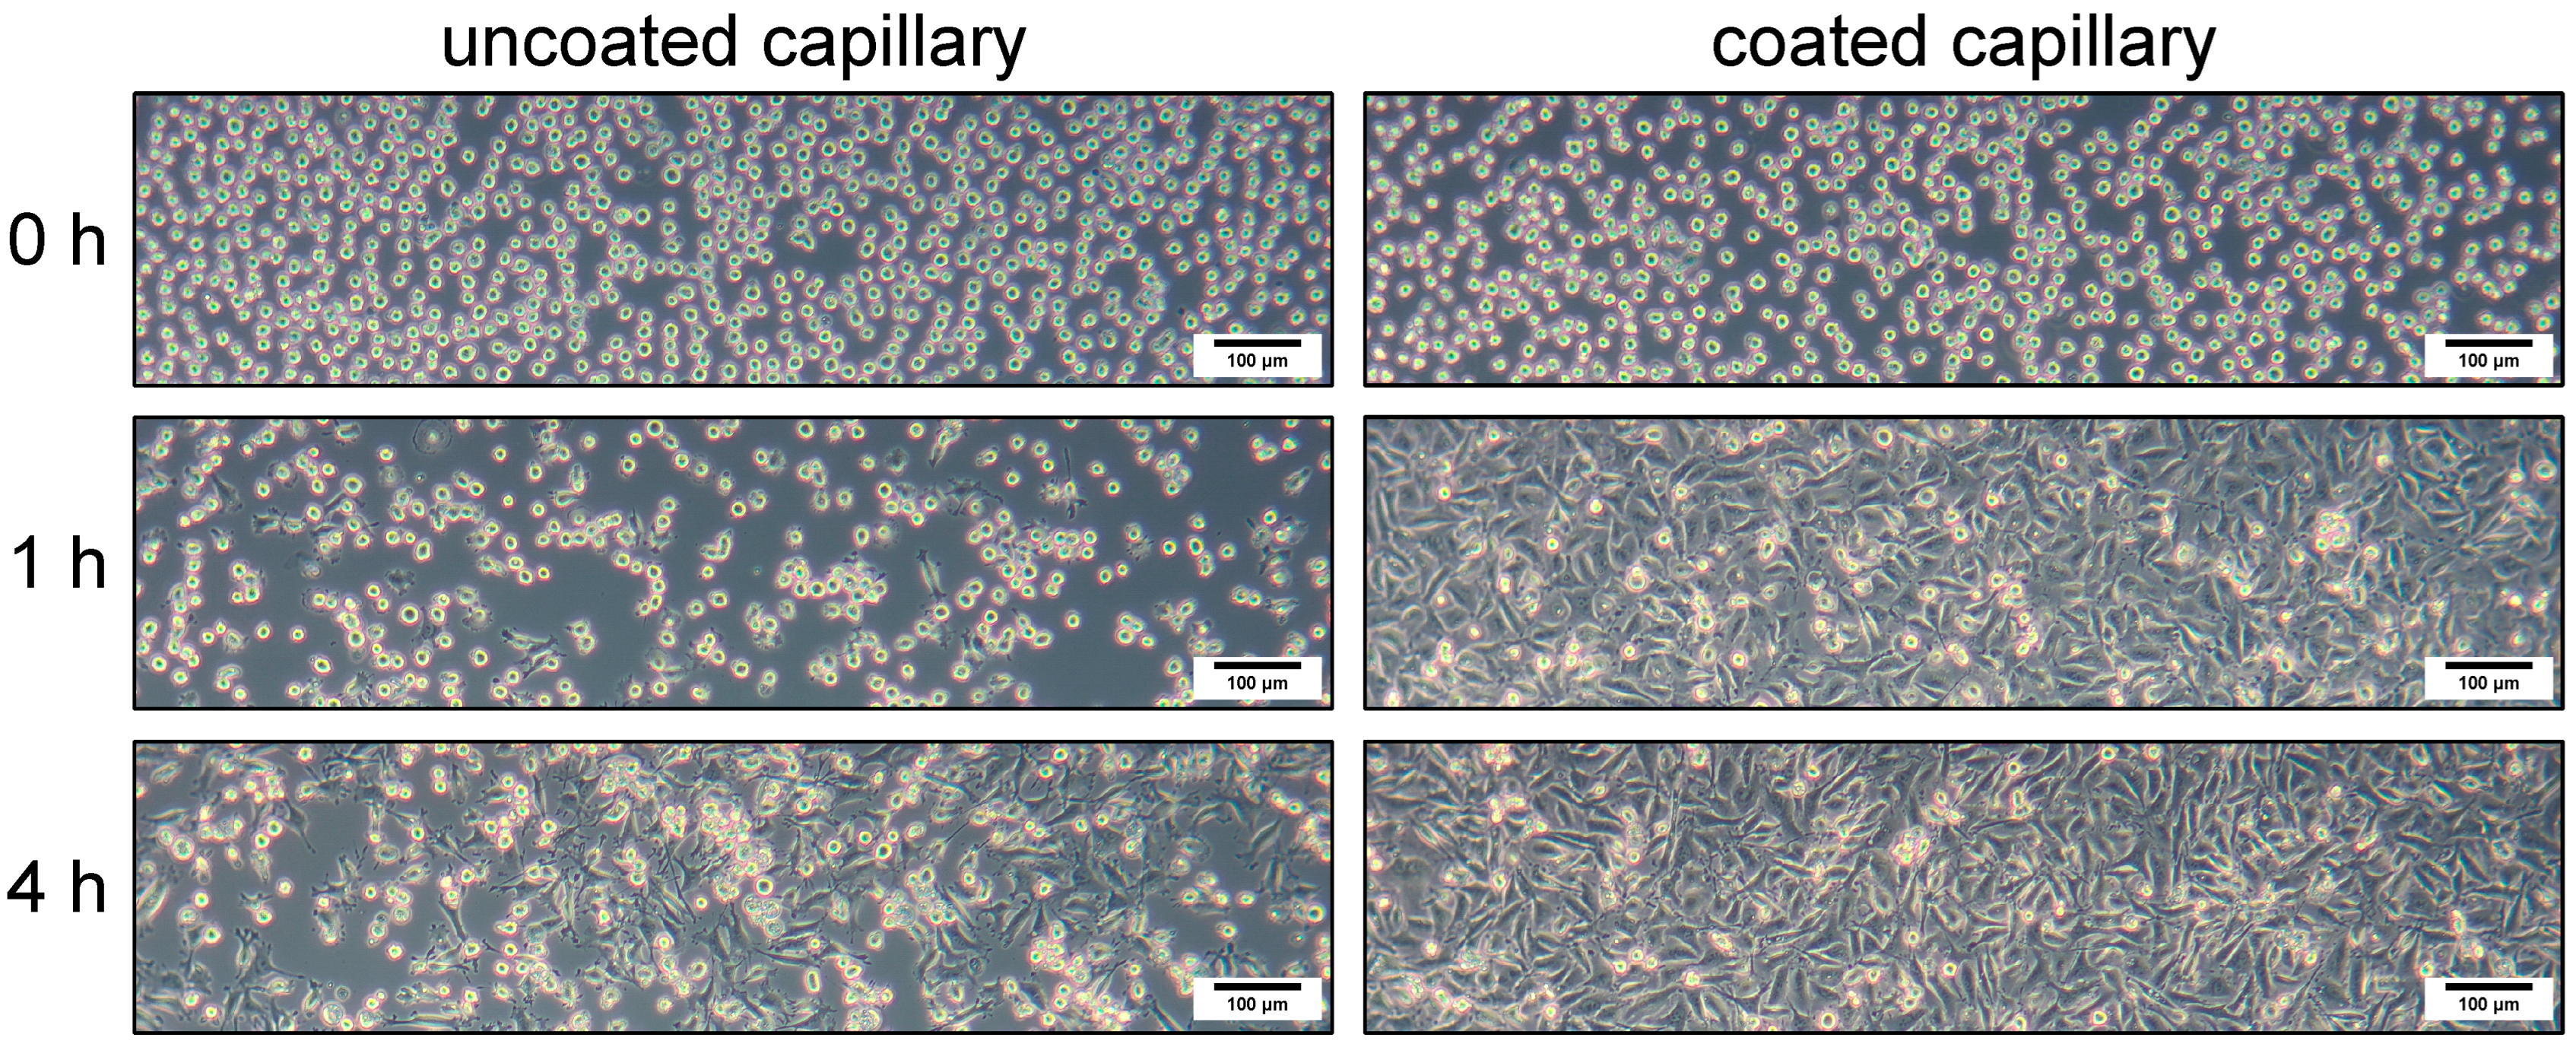
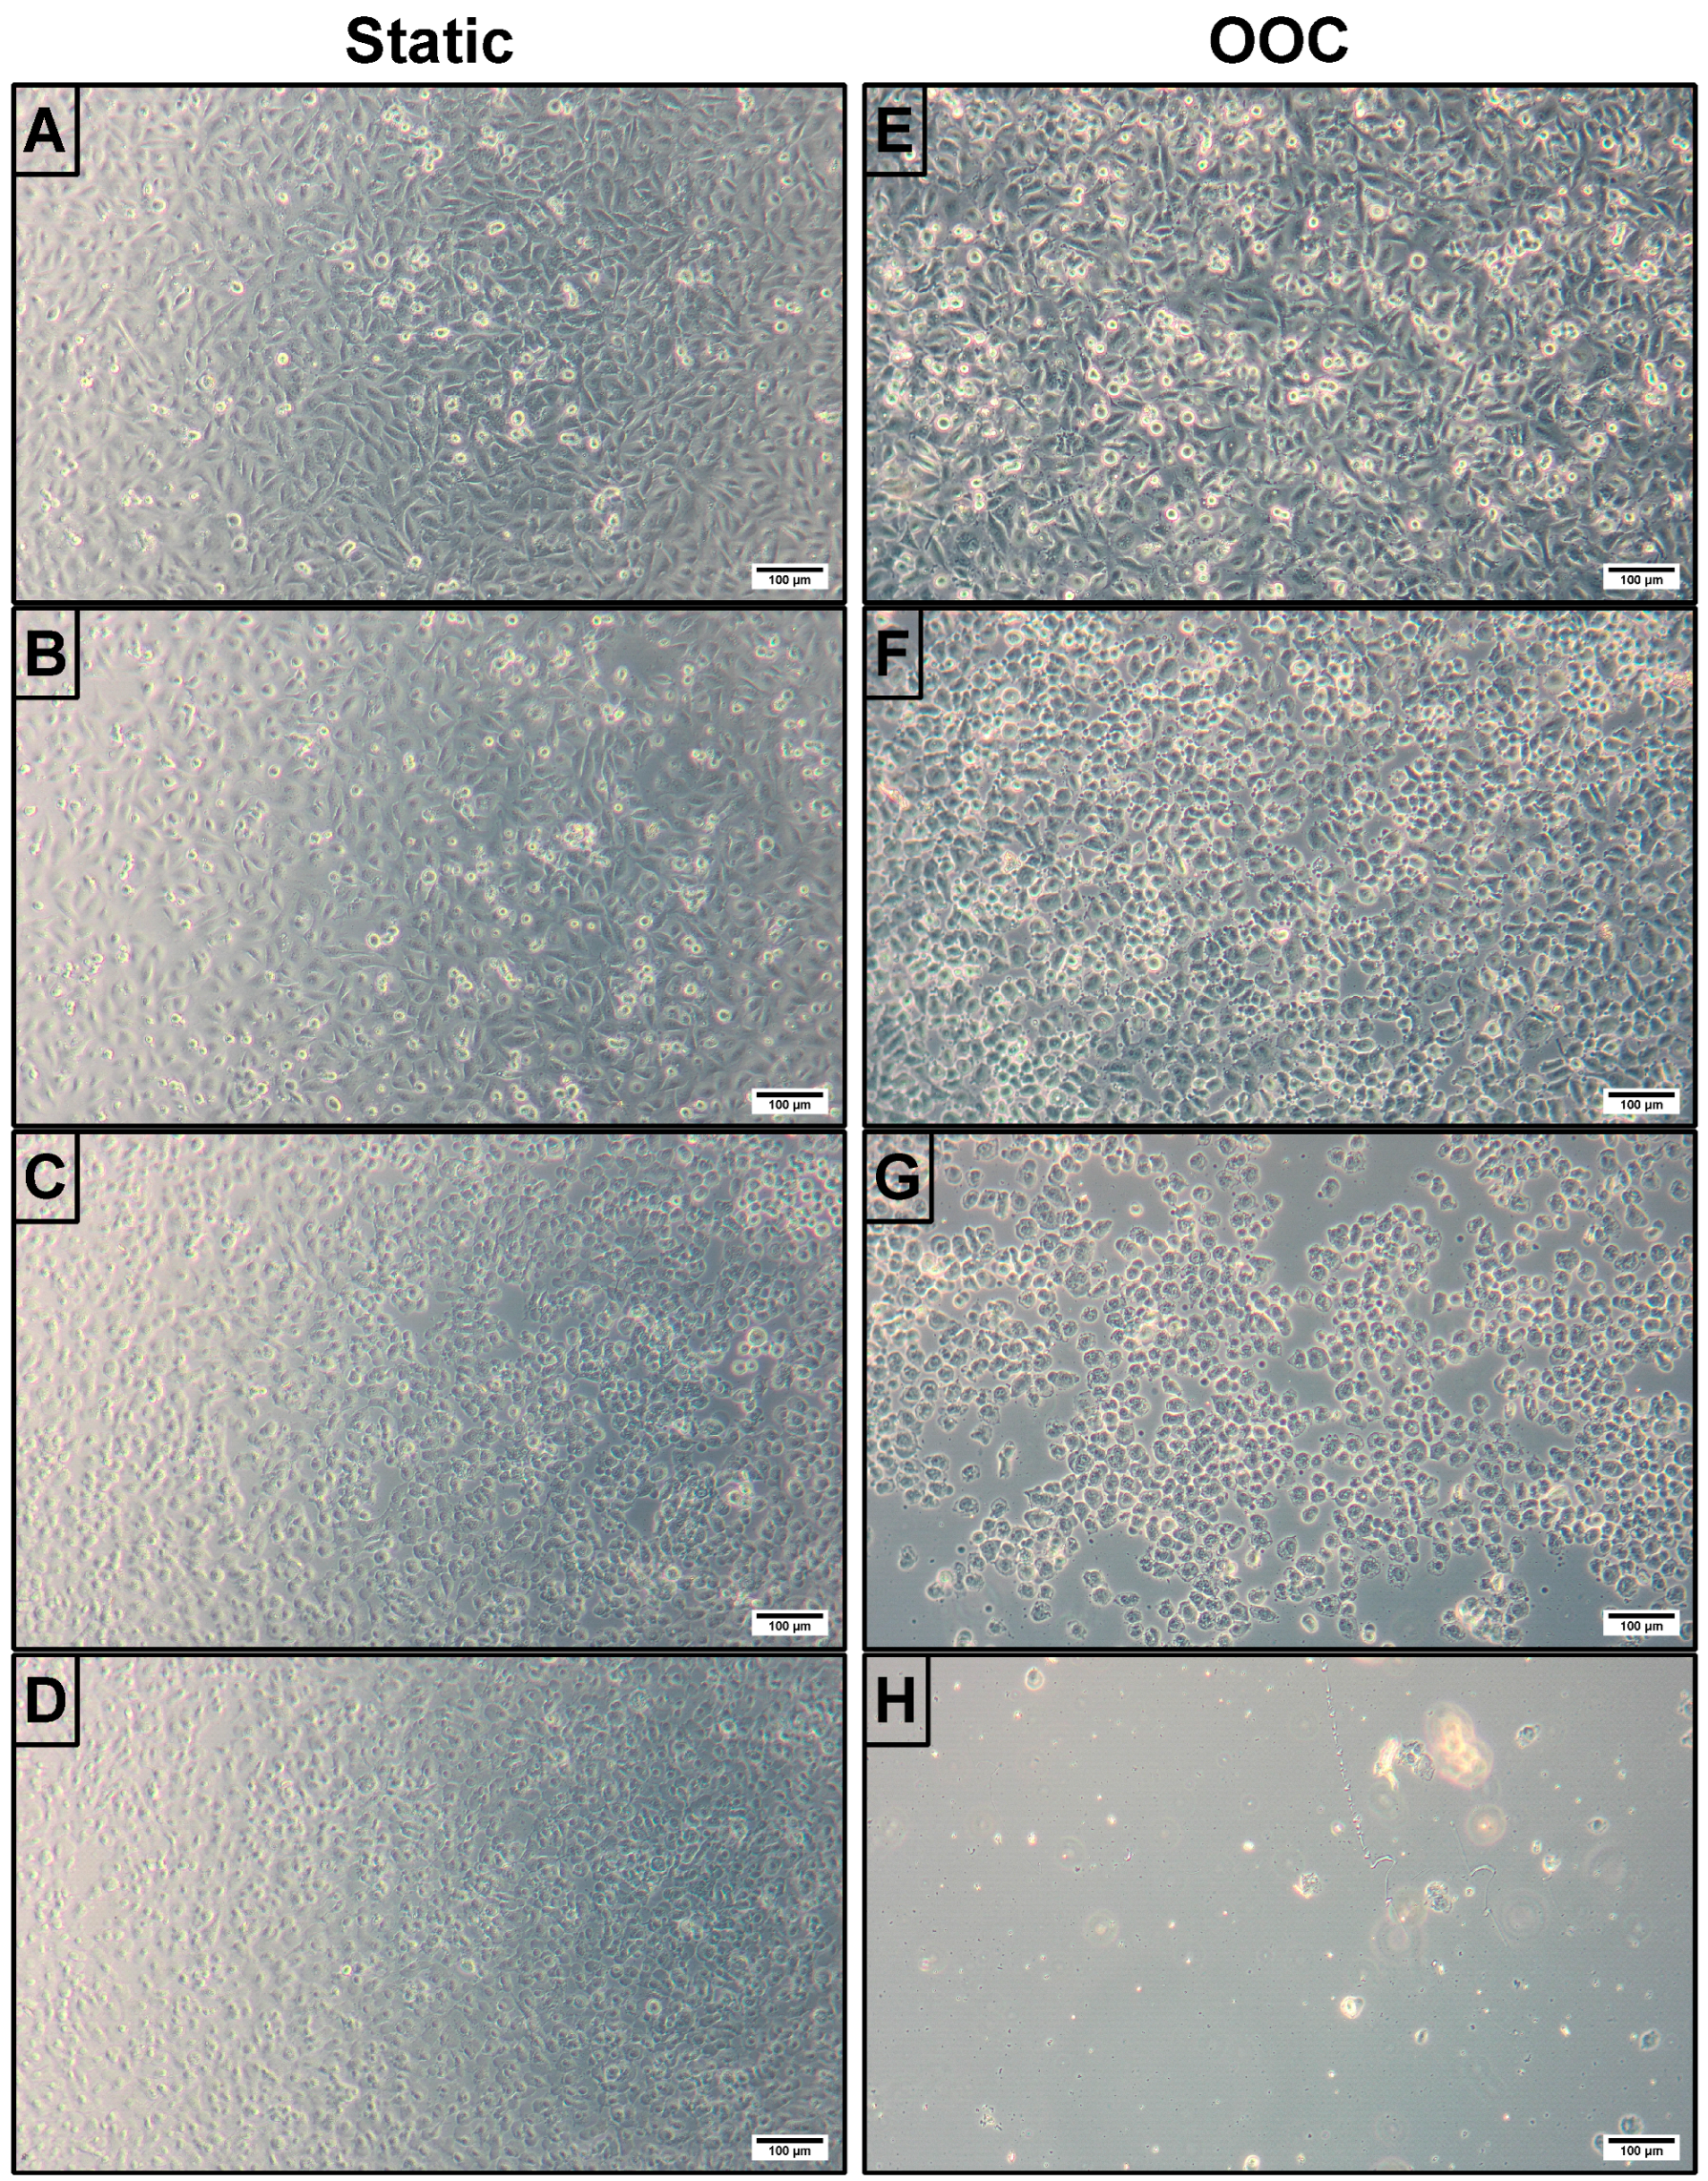
31]. The use of collagen coating reduced the time required for cells to attach to the surface from over 4 h on an uncoated channel surface to 1 h on the collagen coated channel surface (
Figure 1). The extracellular matrix affects integrin activation, leading to the activation of various intracellular signaling pathways [
32]. It is therefore crucial for mimicking the conditions in the vasculature in vivo.
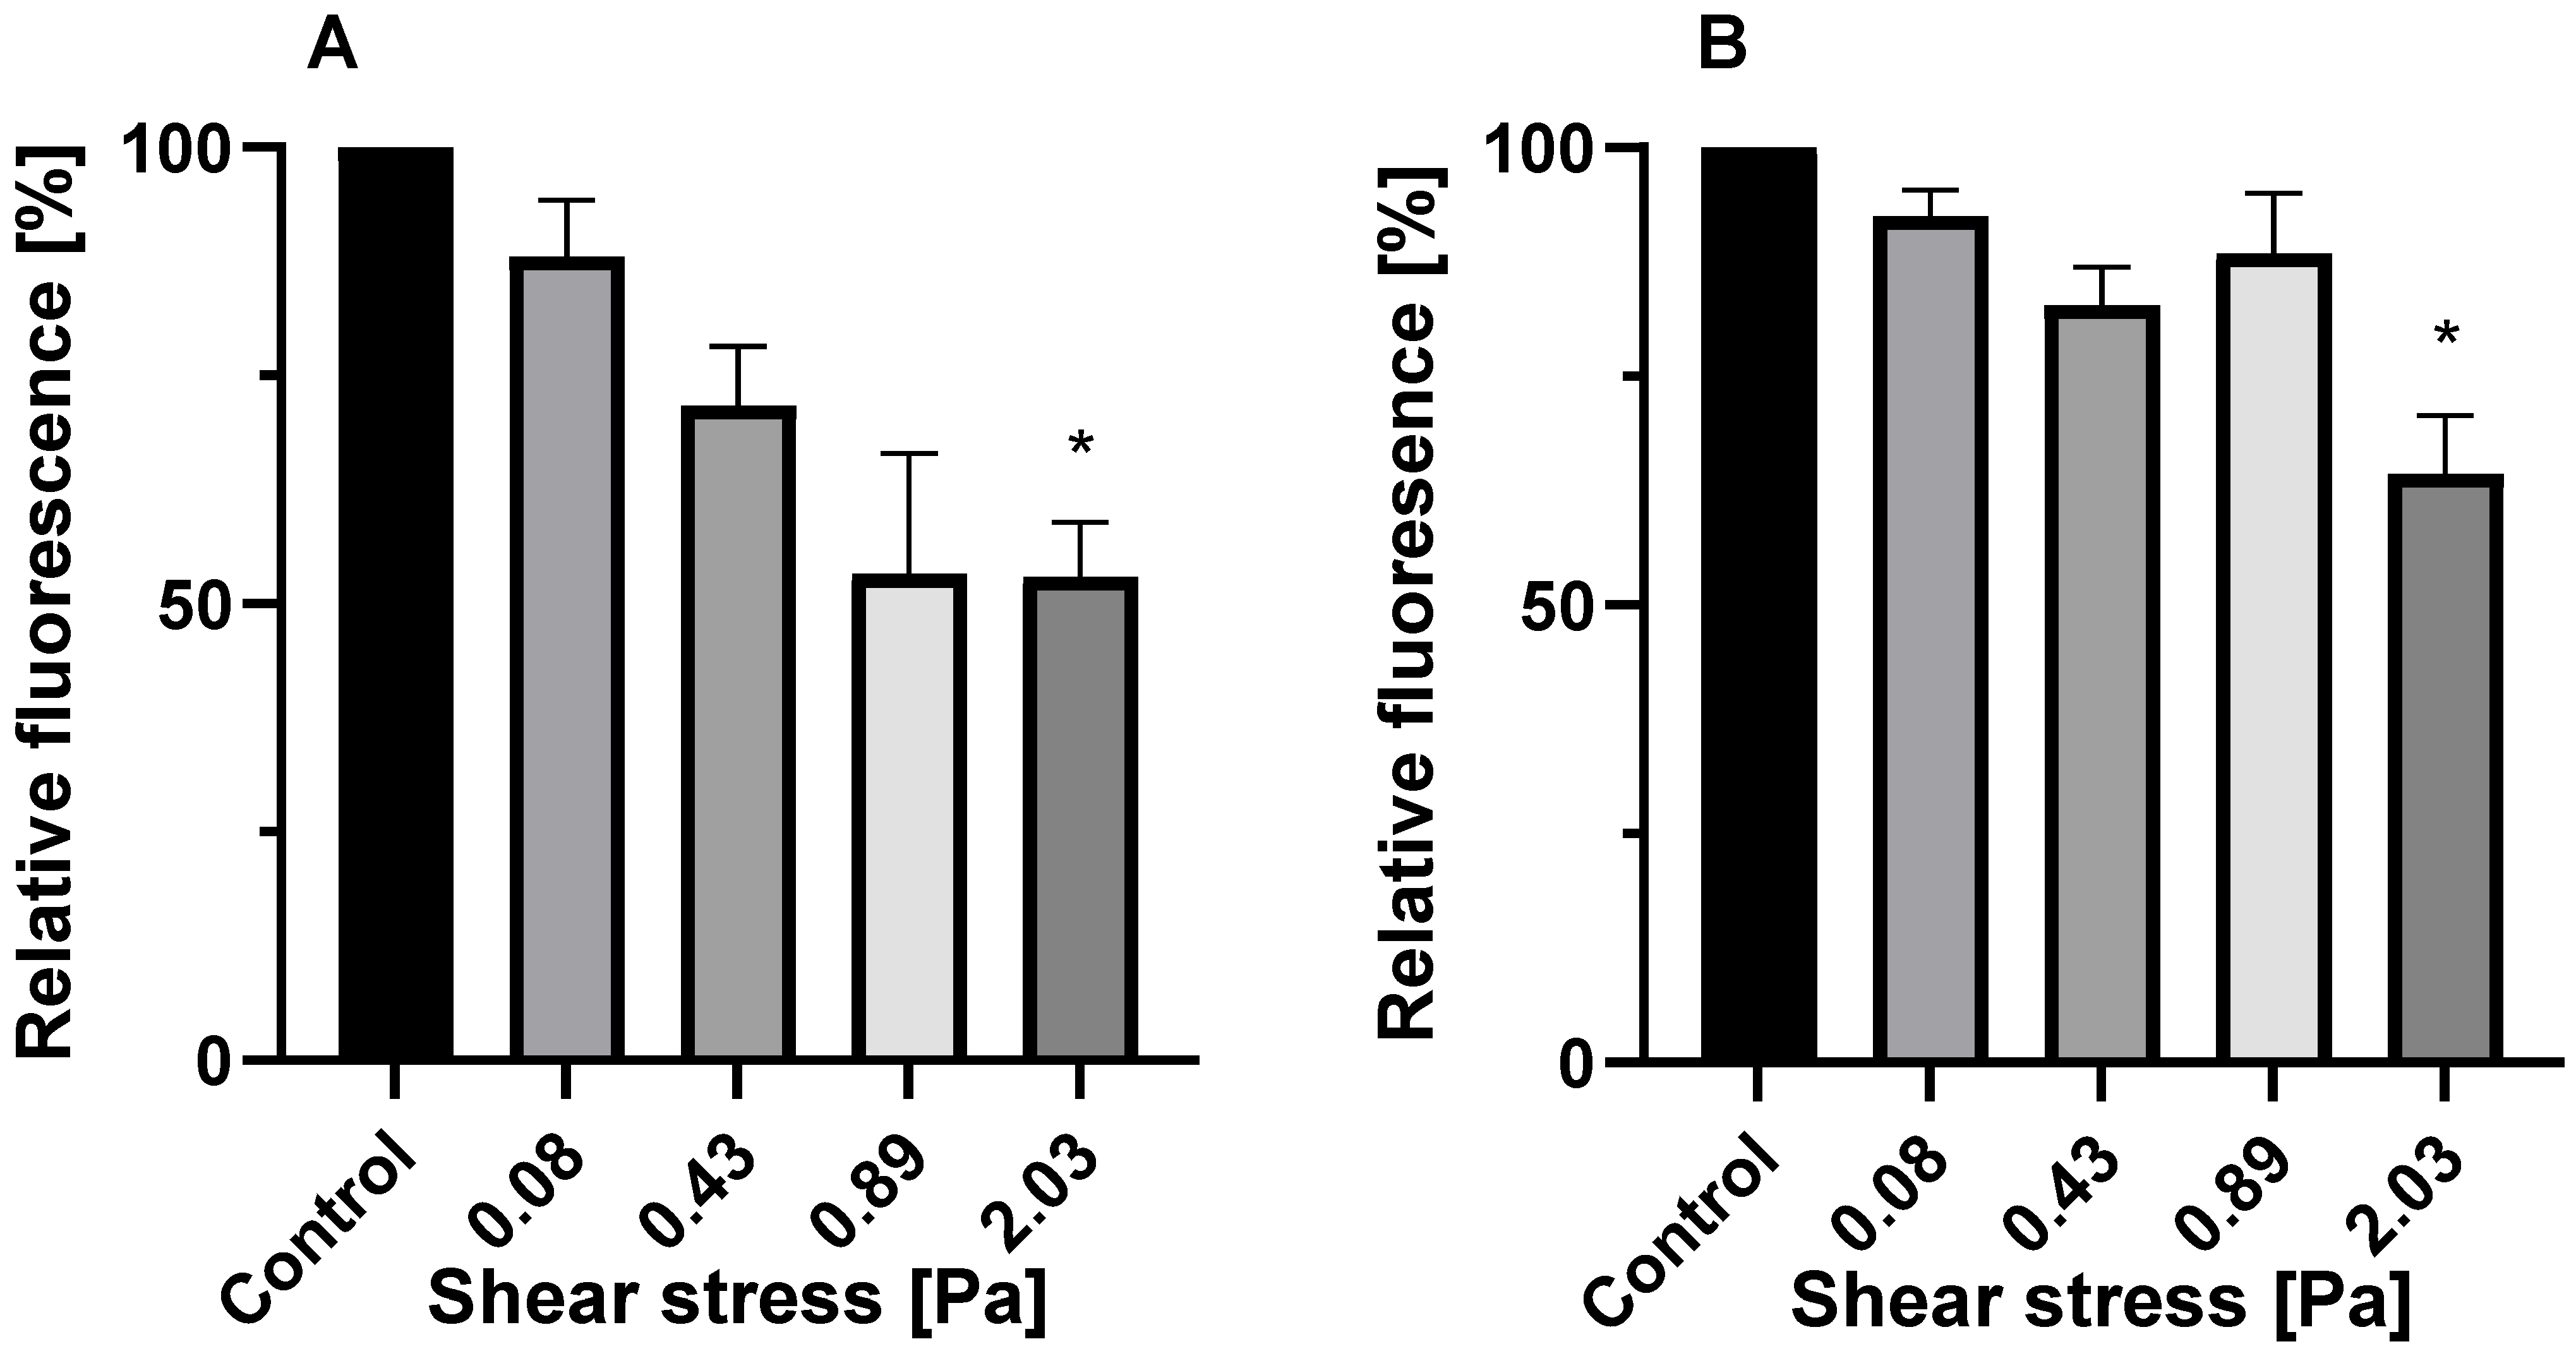
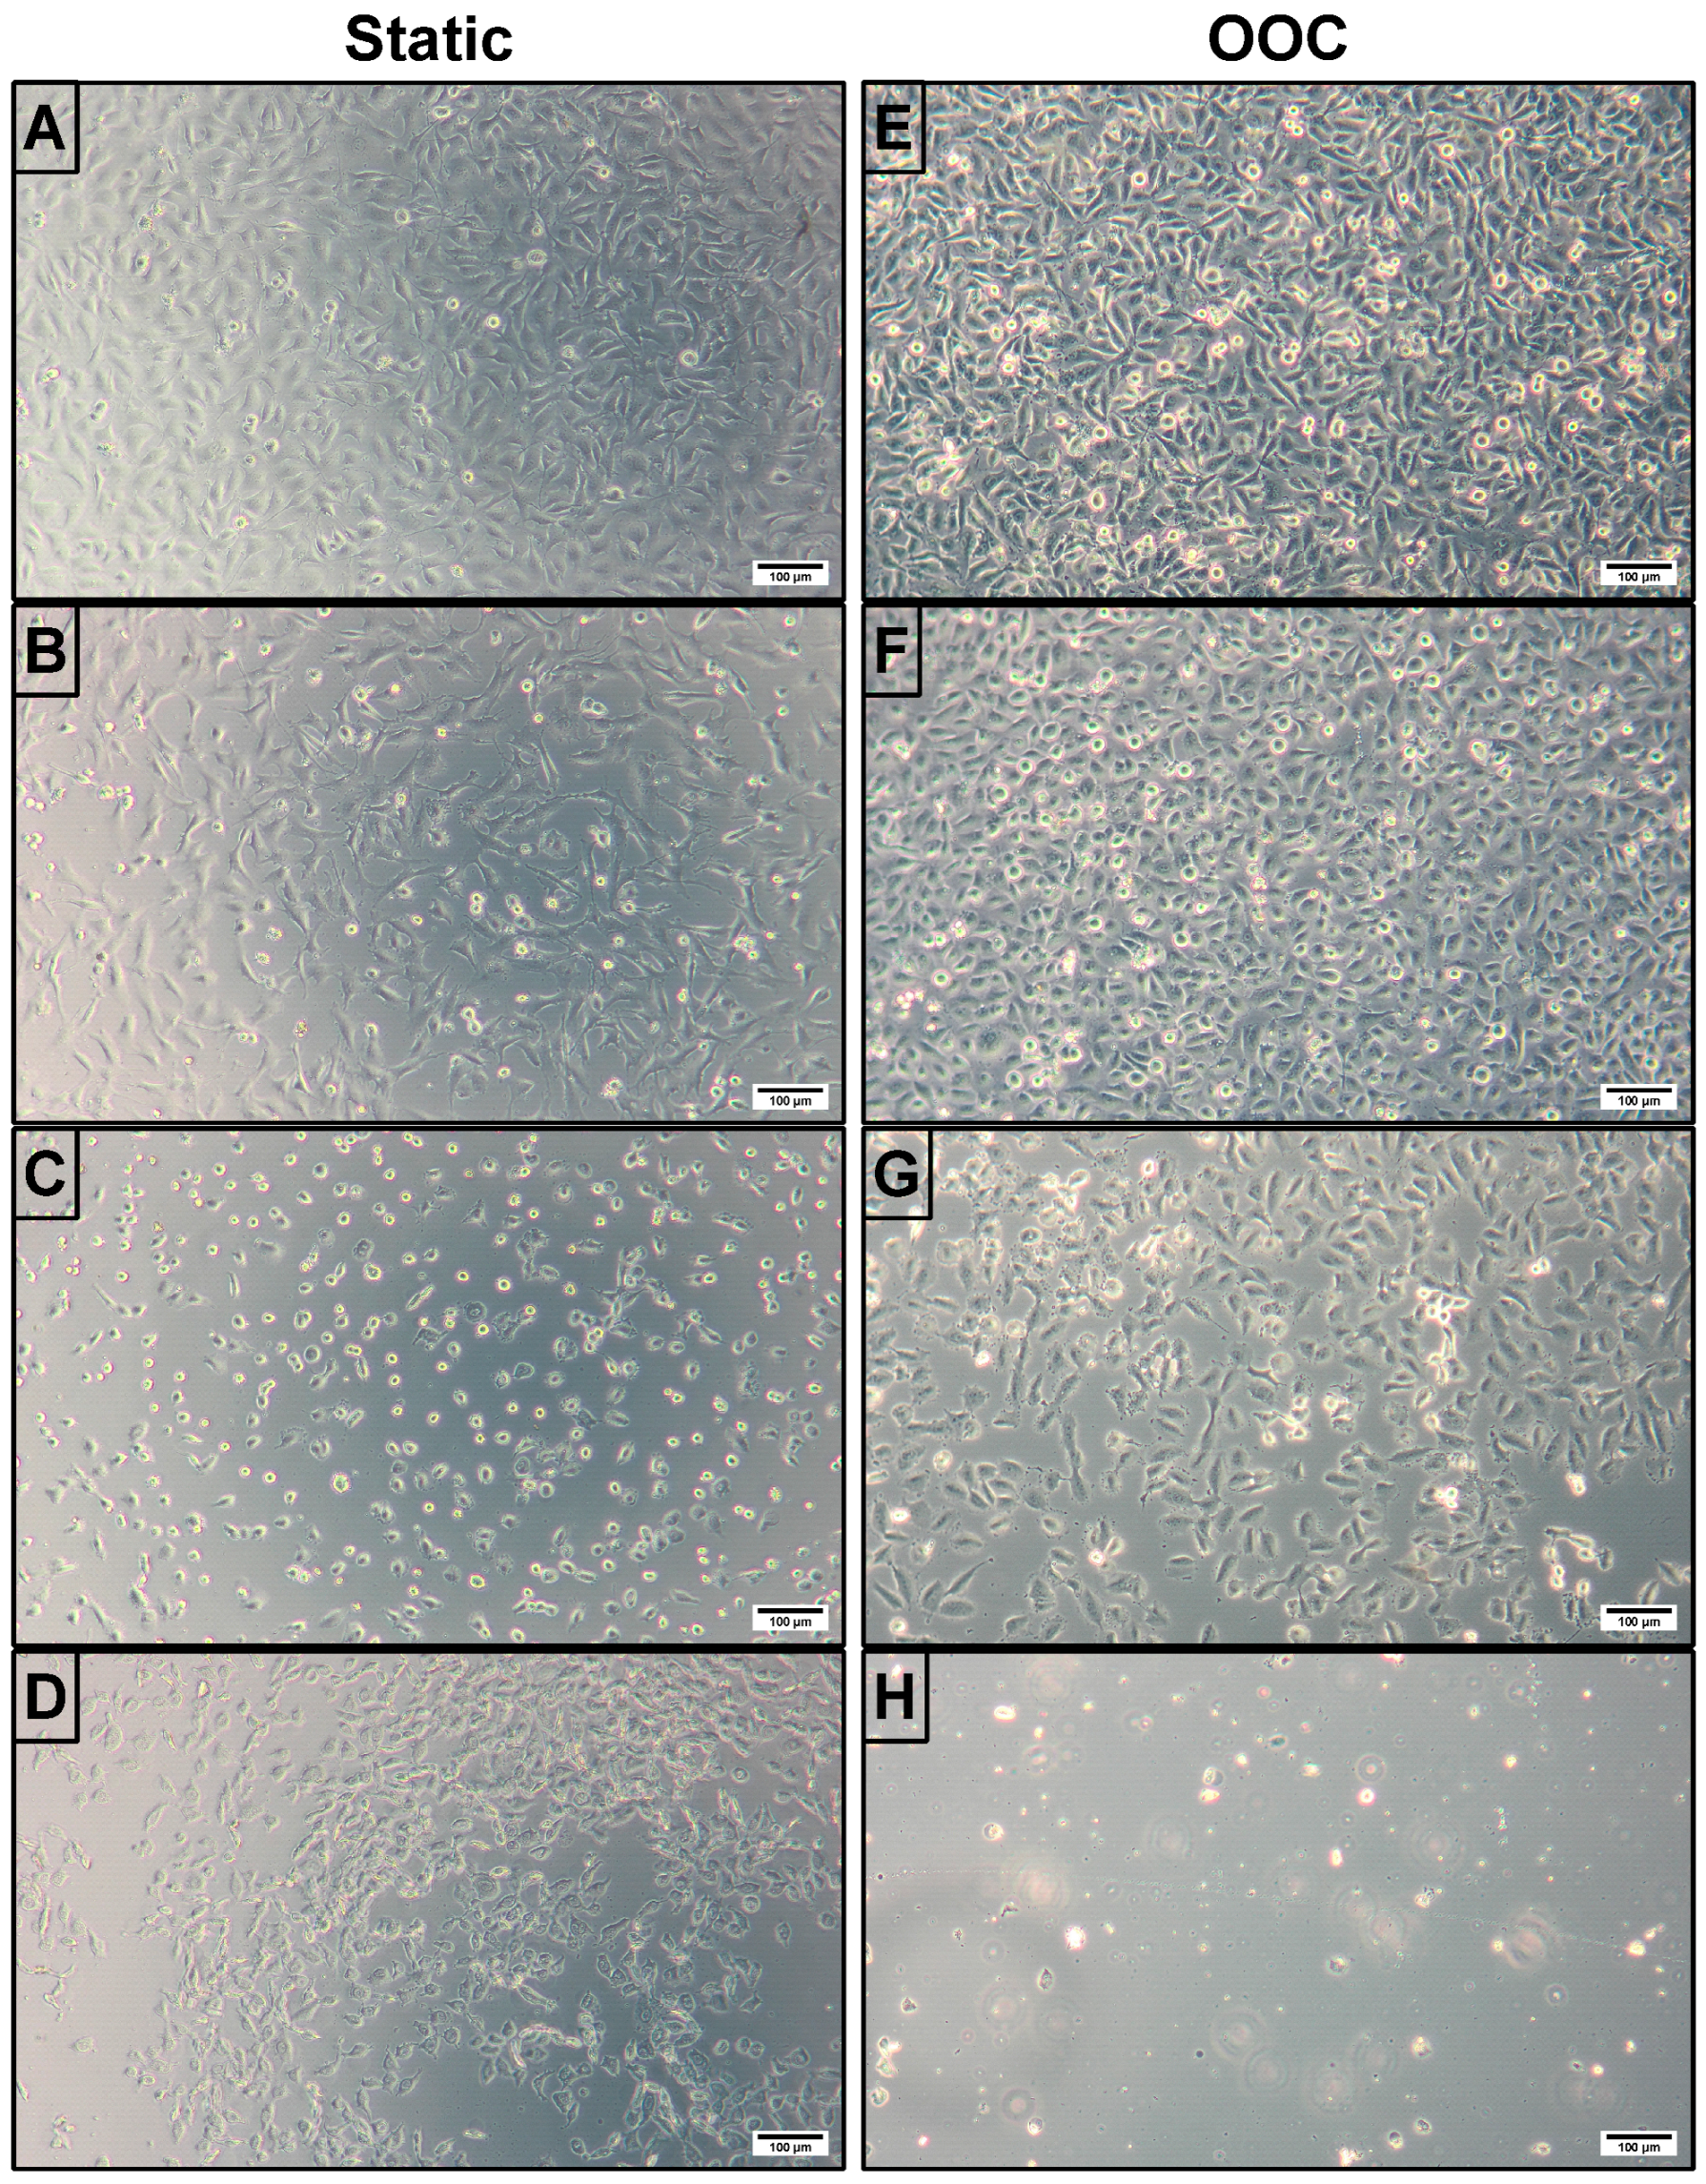
Collagen coating also improved cell adhesion in our model when subjected to increasing shear stress. We were able to expose endothelial cells to shear stresses of up to 0.89 Pa without loss of cell viability, while the higher shear stress of 2.03 Pa led to cell detachment and loss of cells from the collagen-coated OOC (
Figure 2). Thus, our OOC is suitable to model the shear stress exhibited in vivo in veins and parts of aorta, while further optimization of cell adhesion in the OOC model would be required to mimic the higher shear stress encountered in arterioles [
33,
34]. Other OOC models recreating an endothelial dysfunction microenvironment report shear stress of 0.3–0.9 Pa in the whole length of a rectangular channel, with a peak of to 1.27 Pa locally on a channel bifurcation [
11,
12]. This is similar to the capabilities of our model, which can achieve shear stress up to 0.89 Pa. Accordingly, the present system appears suitable for studying endothelial responses under low-to-moderate shear stress. However, it does not yet fully reproduce the higher hemodynamic loads present in all vascular beds.
3.2. Establishment of Acute Oxidative Injury Conditions in the Model
Our endothelial model aimed to establish acute oxidant-induced injury similar to the oxidative burden experienced in acute ischemic-reperfusion injury. Thus, we focused on the incubation of endothelial cells with higher concentrations of H
2O
2 or AAPH for shorter periods than are generally used in the published studies [
27,
35,
36,
37]. We used H
2O
2 as a direct oxidant (also mimicking endogenous source of oxidative stress) with pleiotropic cellular effects, while we also used AAPH as a synthetic source of alkoxyl and alkyl peroxyl radicals [
38].
Our results in static conditions using shorter incubation periods compared to the published studies fit well with literature data when the differences in exposure time and cell type are taken into account. We obtained an IC
50 value of 16.2 mM for H
2O
2 after 30 min incubation in static conditions, which is significantly higher than the 300 µM reported as a 24 h value of IC
50 for human umbilical cord vascular endothelial cells (HUVEC) [
37]. However, this difference is expected, because substantially higher oxidant concentrations are generally required for short acute exposures than for prolonged incubations. In addition, another study did not determine the IC
50 value of H
2O
2 but showed that incubating the EA.hy926 cells with 0.5 mM H
2O
2 for 24 h led to an approximately 40% decrease in cell viability. This establishes the need for much higher concentrations over shorter incubation periods, as well as demonstrates a lower susceptibility of EA.hy926 cells to oxidative stress compared to HUVECs [
36].
The change in cell morphology visible in
Figure 5C is different from that observed by Seto et. al. [
36]. While the cells in their experiments detached from the well surface, visible as white circles with a darker spot under a phase contrast microscope, the cells in our study likely underwent necrotic cell death due to higher concentrations of H
2O
2 used. This is evident from their uneven shapes and disconnected cell membranes (
Figure 5C,D) [
39]. Similar results were obtained with AAPH, where very high concentrations of AAPH were required to decrease cell viability by 50% in 3 h. The obtained IC
50 value of 100.7 mM after 3 h incubation is significantly higher than the IC
50 of 5 mM reported for HUVEC cells after 48 h of incubation [
40], and 2.5 mM for human microvascular endothelial cells after 24 h incubation [
41]. This is in line with our 24 h results for AAPH-induced cytotoxicity, where we obtained the IC
50 of 10.2 mM. Our result is possibly higher due to the use of hybridoma cells instead of primary HUVEC cells [
40,
41].
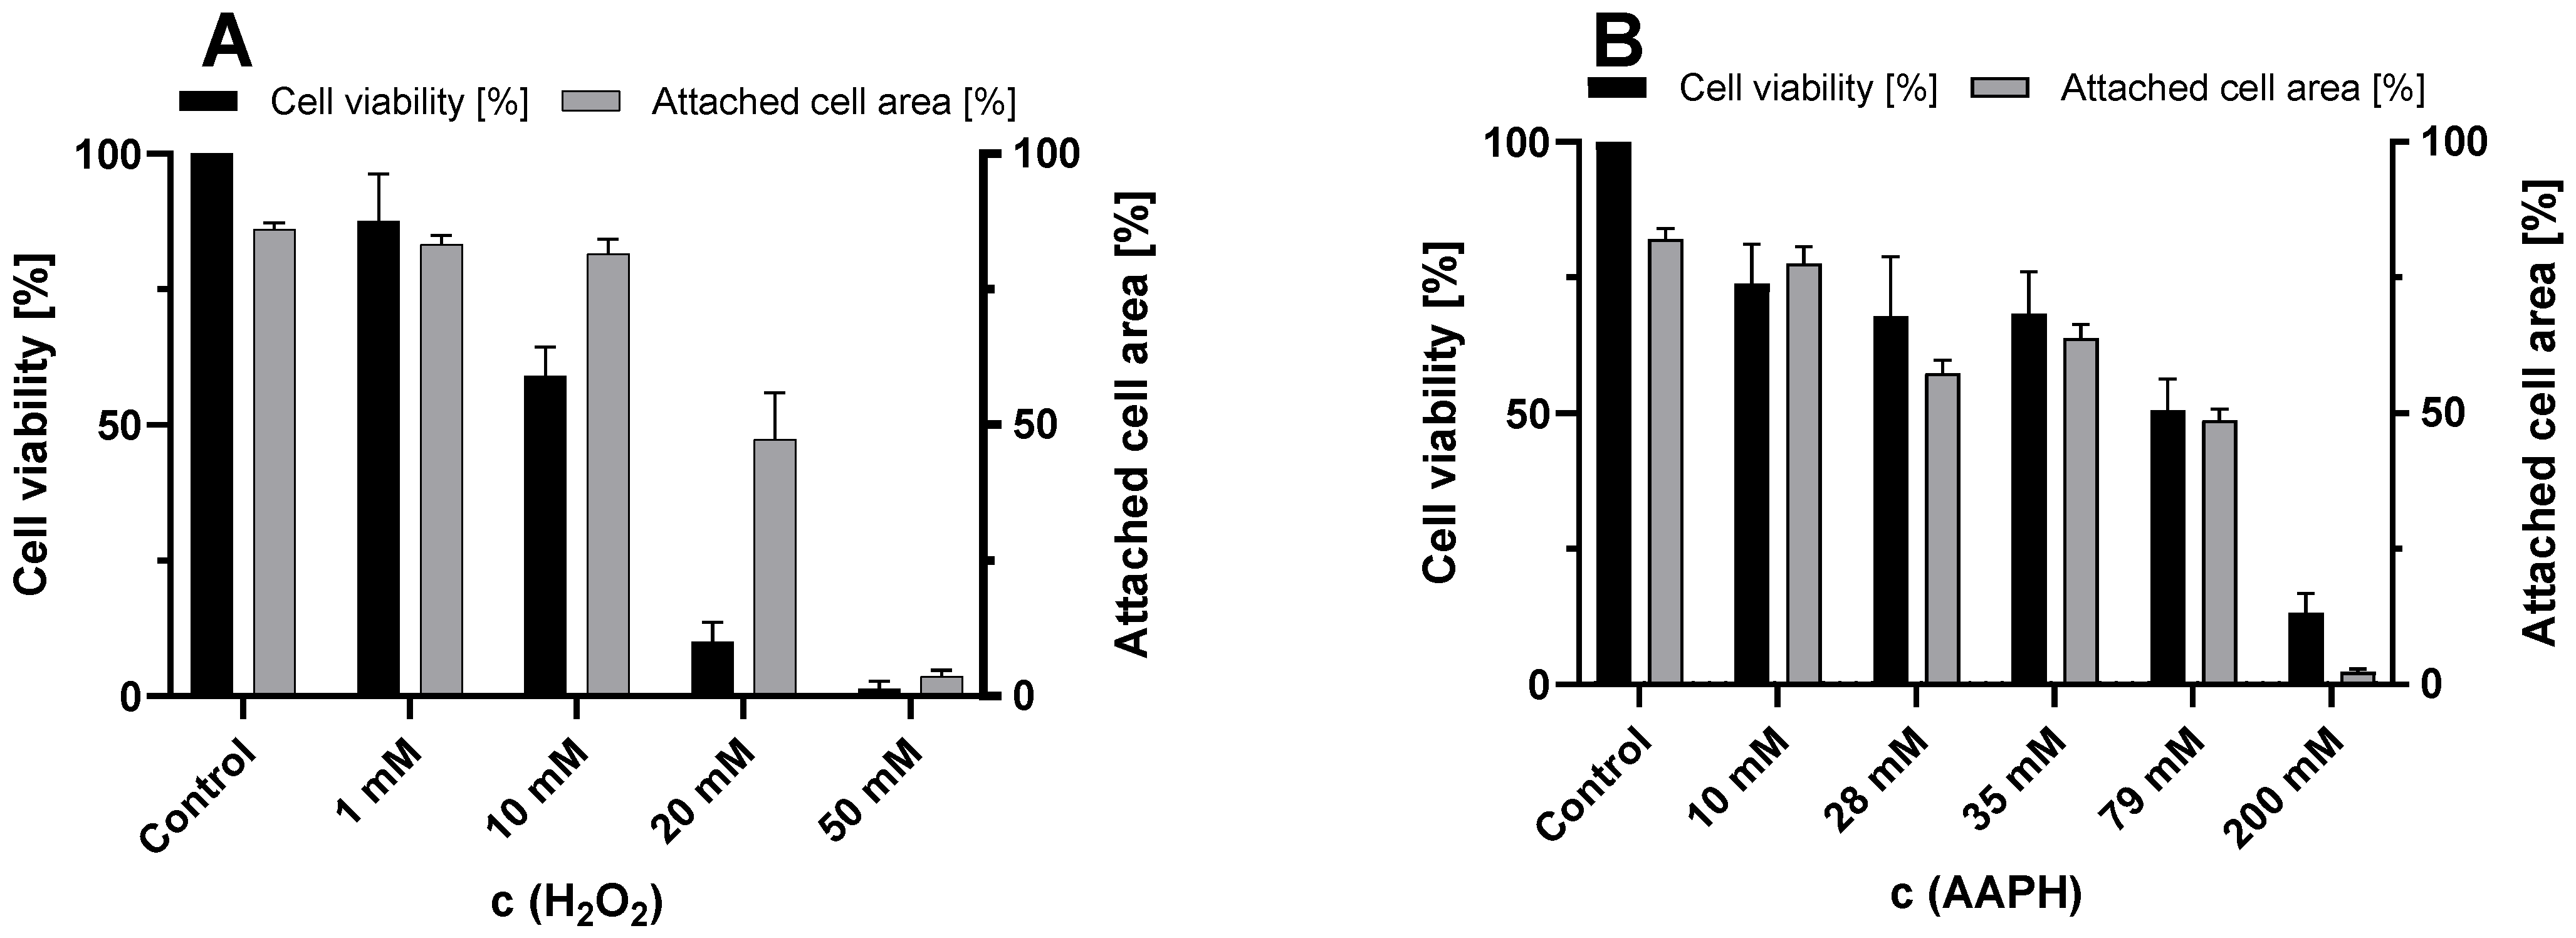
Our image-derived attached cell area analysis provides an additional label-free experimental parameter, which correlates well with resazurin-based cell viability measurements. For AAPH-treated cells, attached cell area and resazurin-based viability showed relatively good agreement. In contrast, for H2O2-treated cells the correlation was weaker, likely because H2O2 induced more pronounced cell morphological alterations before detachment. This indicates that attached cell area can provide useful and independent non-invasive measurement of cell status, but should be interpreted with caution when changes in cell morphology are substantial.
3.3. Effect of Culture Medium Flow on the Apparent Cell Response to Oxidative Injury
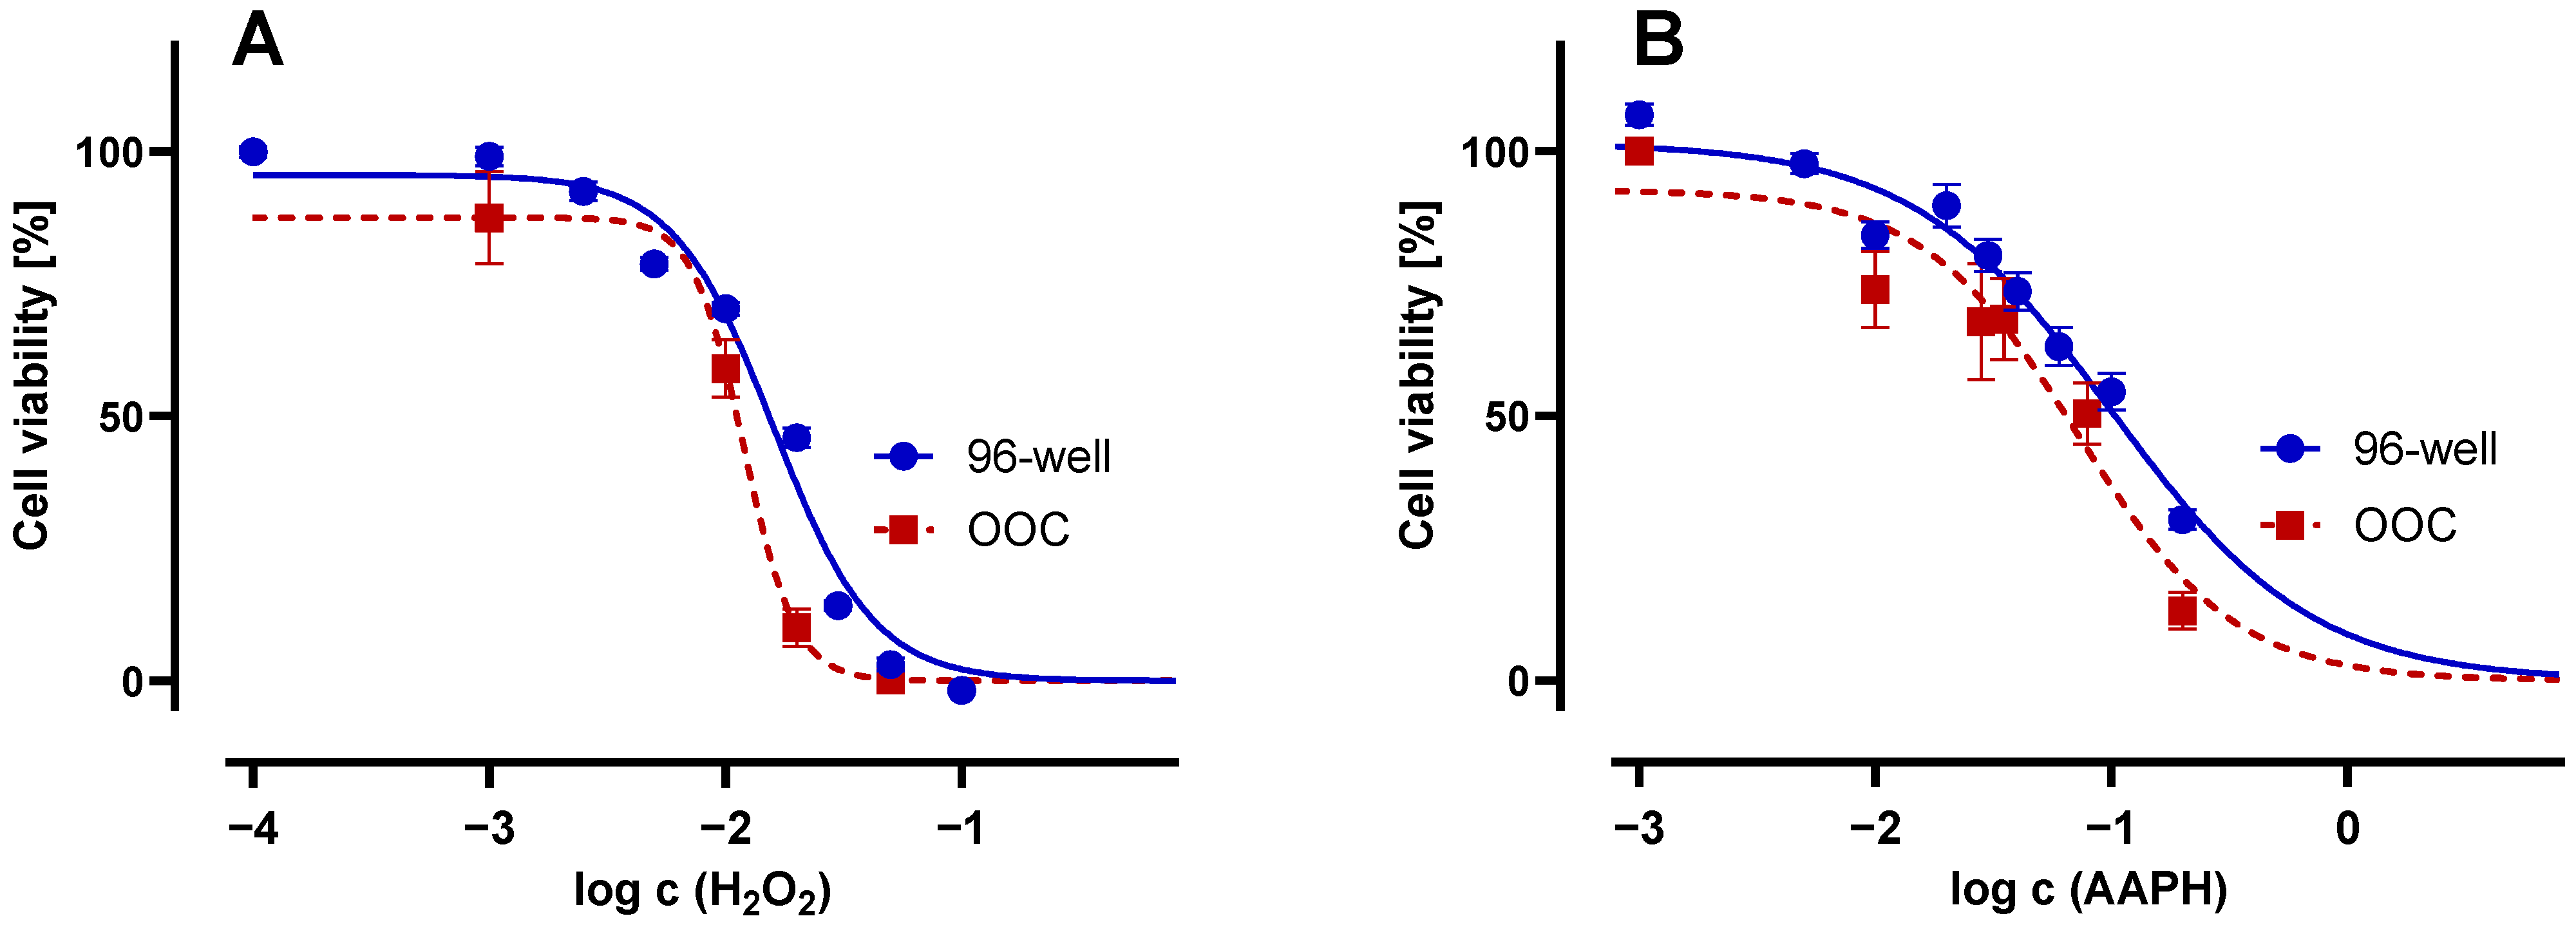
A key finding of the present study was that both H
2O
2 and AAPH produced lower apparent IC
50 values under flow than under static conditions (
Figure 4). While it has been shown that flow conditions impact the behavior of the endothelium in vitro [
25], we combined shear stress with high levels of oxidative stress to mimic conditions following ischemic-reperfusion injury in vivo with the focus on oxidative stress. We observed a greater decrease in cell viability under flow conditions for cells that were exposed to both sources of oxidative stress. Importantly, this observation should be interpreted cautiously. The stronger response observed under flow conditions does not necessarily reflect only greater intracellular susceptibility to oxidative injury, but also enhanced detachment and washout of injured cells caused by flow. To elaborate further, this could be attributed to cell damage resulting from oxidative stress, due to which cells still preserve some metabolic activity, and thus metabolize resazurin in static conditions. However, the damage to molecules, required for cell adhesion to the surface, leads to cells being carried away with flow of culture medium under flow conditions, as is evident in micrographs (
Figure 5 and
Figure 6).
From a methodological perspective, this distinction is important, because it suggests that OOC endothelial models reveal an additional dimension of injury related to adhesion failure and cell loss under flow, rather than simply reproducing static oxidative injury results under perfusion. The presented platform may therefore be particularly useful for studying acute endothelial injury in settings where structural retention of the endothelial layer is biologically relevant.
3.4. Applicability of the Endothelial OOC Model
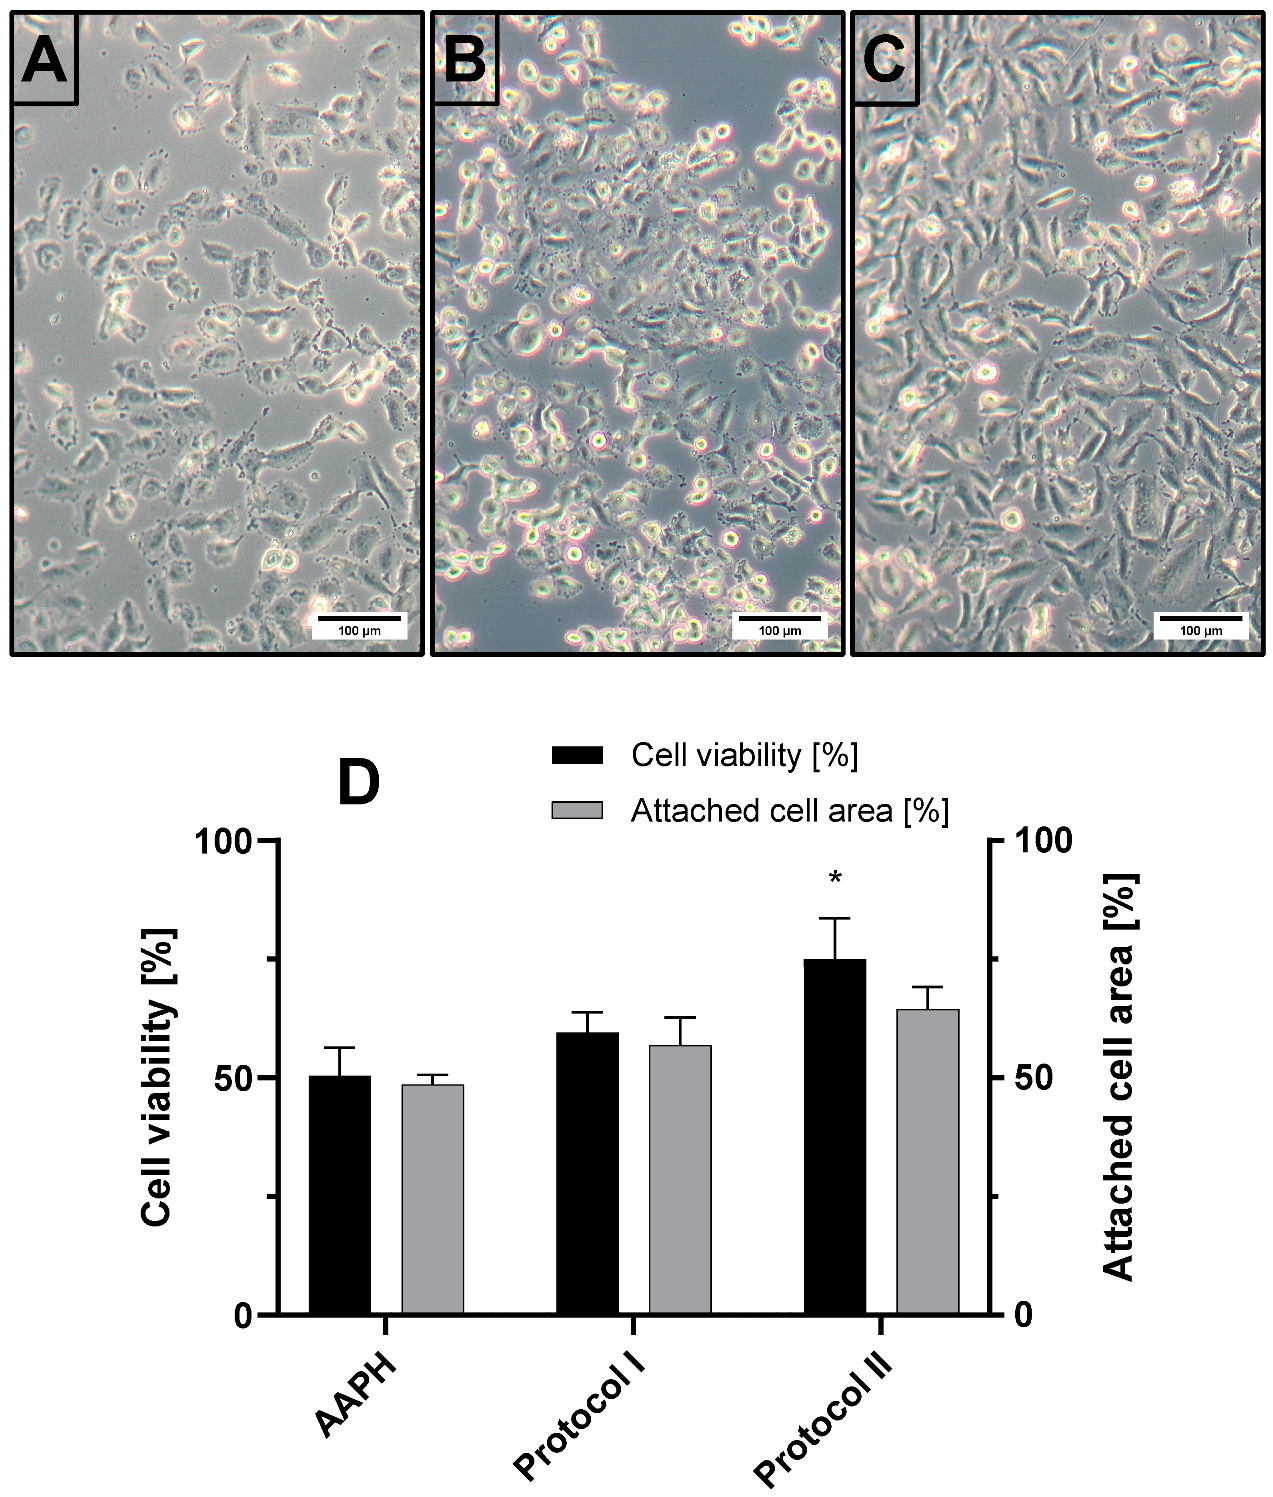
Improved cell viability following quercetin pretreatment shows that our model of oxidative stress damage can detect the modulation of oxidant-induced endothelial injury under flow conditions (
Figure 8). It can also be used to evaluate antioxidants in conditions, which are more biorelevant than static cultures. In contrast, simultaneous exposure to quercetin and AAPH resulted in only a minimal and non-significant effect. This suggests that pretreatment may be required for intracellular accumulation or preconditioning before protection becomes detectable. In the context of the present study, quercetin should therefore be regarded primarily as a proof-of-applicability intervention rather than as the focus of a detailed pharmacological analysis. Broader validation of the model for antioxidant screening will require testing of additional compounds, concentration ranges, and orthogonal functional endpoints.
Several limitations of the present study should also be acknowledged. Firstly, the model is based on the immortalized EA.hy926 cell line, which is ideal for methodological development due to its high reproducibility and robustness, but does not fully replicate the phenotype or functional diversity of human primary endothelial cells. Secondly, the lower IC
50 values observed under flow conditions should be interpreted as a combination of decreased metabolic activity, loss of cell adhesion, and washout of cells from the channel. Therefore, our model does not distinguish between true intracellular sensitization and loss of adhesion as a mechanical readout of injury. Also, our system currently models only the acute oxidative injury rather than the entire process of ischemia, reperfusion, leukocyte recruitment, cytokine signaling, and barrier failure that occurs in vivo during acute ischemic events. Moreover, we concluded that the primary endpoints of the current study should be retained cell viability, cell morphology, and attached cell area. Therefore, the model does not yet directly address intracellular ROS generation, nitric oxide (NO) signaling, endothelial barrier permeability, or inflammatory activation. Furthermore, the shear stress range achievable in the present configuration remains limited to relatively low values, while the concentrations of oxidants are significantly higher than those in vivo. Finally, our system is limited by low-throughput, and could benefit from better scalability, which is becoming more common in OOC models [
42].
Future work should therefore extend the platform to include primary endothelial cells, broader shear stress ranges, and additional functional readouts, such as barrier integrity, ROS-sensitive signaling, NO-concentration measurements, and characterization of inflammatory markers. Nevertheless, the present model provides a practical basis for the study of acute endothelial oxidative injury under controlled flow conditions and may be useful for the primary screening of novel pharmacological approaches or direct/indirect antioxidants in future investigations of protective interventions.
4. Materials and Methods
4.1. Chemicals
All materials used were of reagent grade and obtained from commercial sources. Hydrogen peroxide (Hydrogenii peroxidum 3%) was from Lekarne Ljubljana (Ljubljana, Slovenia), quercetin from Biosynth (Bratislava, Slovakia). Dimethylsulfoxide (DMSO) and 2,2′-azobis(2-amidinopropane) dihydrochloride (AAPH) were procured from Sigma Aldrich (St. Louis, MO, USA).
Dulbecco’s phosphate buffered saline (PBS), Dulbecco’s modified Eagle medium—low glucose (DMEM), L-glutamine (200 mM), Penicillin-Streptomycin (10,000 I.U/mL penicillin and 10 mg/mL streptomycin), 4-(2-hydroxyethyl)-1-piperazineethanesulfonic acid (HEPES), and the Type I rat tail collagen were from Sigma-Aldrich (St. Louis, MO, USA), while TrypLE™ Express, fetal bovine serum (FBS), and CO2 independent medium were from Gibco (Grand Island, NY, USA). AlamarBlue™ (resazurin) was obtained from Thermo-Fischer scientific (Waltham, MA, USA).
4.2. Cell Culture
Human endothelial cell line EA.hy926 (American Type Culture Collection, Rockville, MD, USA), was maintained in standard two-dimensional culture conditions in DMEM supplemented with 10% (v/v) FBS, 2 mM L-glutamine, 100 IU/mL penicillin and 100 µg/mL streptomycin. The cells were cultured in a humidified atmosphere with 5% CO2 at 37 °C. The cells were subcultured twice per week, when they reached 80–90% confluence.
4.3. Cell Imaging
The cells were photographed by phase-contrast microscopy (ZEISS Axiocam 208 color, Carl Zeiss Microscopy GmbH, Jena, Germany) after the measurement of cell viability at 40× and 100× magnification (ZEISS Primovert, Carl Zeiss Microscopy GmbH, Jena, Germany). Images were captured with automatic white-balance and brightness adjustment functions integrated in the camera software.
4.4. Image Analysis
The phase-contrast images were cropped from the top-left corner to 3500 × 2160 px in Fiji (version 2.16.0/1.54p), to remove the scale bar (custom macro provided as
Supplementary File S2), then imported in Ilastik [
29] (version 1.4.1), where a pixel classification model was trained using four classes. Classes corresponded to (1) background, defined as regions where no cells or debris were present, (2) attached cells, (3) detached cells, and (4) cell debris. The model was trained on images of control cells acquired before the experiment, where background, attached cells, and detached cells were marked, as well as the last image in a series of experiments, where the background and cell debris were marked (
Supplementary Figure S2). Training was performed with all features selected and a brush size of 1, to improve model performance. The training data and images used for analysis are available in
Supplementary Materials.
Quantitative image analysis was performed only for experiments conducted under flow conditions, because flow removed detached cells from the channel and allowed more reliable quantification of the attached cell area. Under static conditions, detached and dead cells remained within the field of view and interfered with accurate discrimination between attached and non-attached cells.
The images were then again imported in Fiji for image segmentation and determination of the attached cell area (class 2). An image of .h5 format was imported into Fiji using the Ilastik plugin, and the class corresponding to attached cells was thresholded against all other classes. The total attached cell area and part of the total image area were measured and exported in a .csv file. This workflow was automated using a macro (provided as
Supplementary File S3).
4.5. Cell Seeding in Microfluidic Chip and Process Optimization
The Be-Flow Standard microfluidic chip (BeOnChip, Zaragoza, Spain) was coated with 0.1 mg/mL collagen, which was prepared from 3.9 mg/mL rat tail collagen type I by dilution with PBS. The collagen solution was kept cool until it was applied to the microfluidic chip. A cool collagen solution (100 µL, 0.1 mg/mL) was applied to the inlet of a capillary. This was followed by incubation (1 h, 37 °C, humid atmosphere) and washing of the capillary with PBS (4 × 100 µL). For OOC experiments cell suspensions were prepared in CO2-independent medium supplemented with 10% (v/v) FBS, 2 mM L-glutamine, 100 IU/mL penicillin and 100 µg/mL streptomycin and seeded into the BeFlow microfluidic chip. Optimization of the cell seeding concentration was performed to reach over 90% confluence upon cell attachment (complete channel coverage). The cell suspensions were seeded in concentrations from 2 × 10⁶ to 10 × 106 cells/mL, and an analysis of micrographs followed after a 1 h incubation in a CO2-free incubator (37 °C) to determine cell confluence.
The time required for cell adhesion and necessity of collagen coating was determined on two-channel Be-flow chips, with one capillary coated with collagen while the other was left uncoated as control. The collagen coating was performed following the above protocol. Cells were seeded into both channels at 1.0 × 10
5 cells/channel (corresponding to 3.3 × 10
6 cells/mL, 30 µL per channel and an initial seeding density of 1.46 × 10
5 cells/cm
2) and incubated in a CO
2 free incubator (37 °C, humid atmosphere). The cell adhesion time was approximated from cell images taken in 1 h intervals after cell seeding, while the adhesion strength was evaluated by the exposure of cells to flow rates corresponding to the shear stress of 0.08, 0.43, 0.89, and 2.03 Pa for 60 min. Shear stress in the rectangular channel was calculated according to Equation (1):
where
τ represents shear stress in Pa,
η represents dynamic viscosity,
Q represents flow rate,
h represents the height of the channel, and
w represents channel width. The calculation was performed for DMEM with 10% added serum and a viscosity of 0.930 mPas [
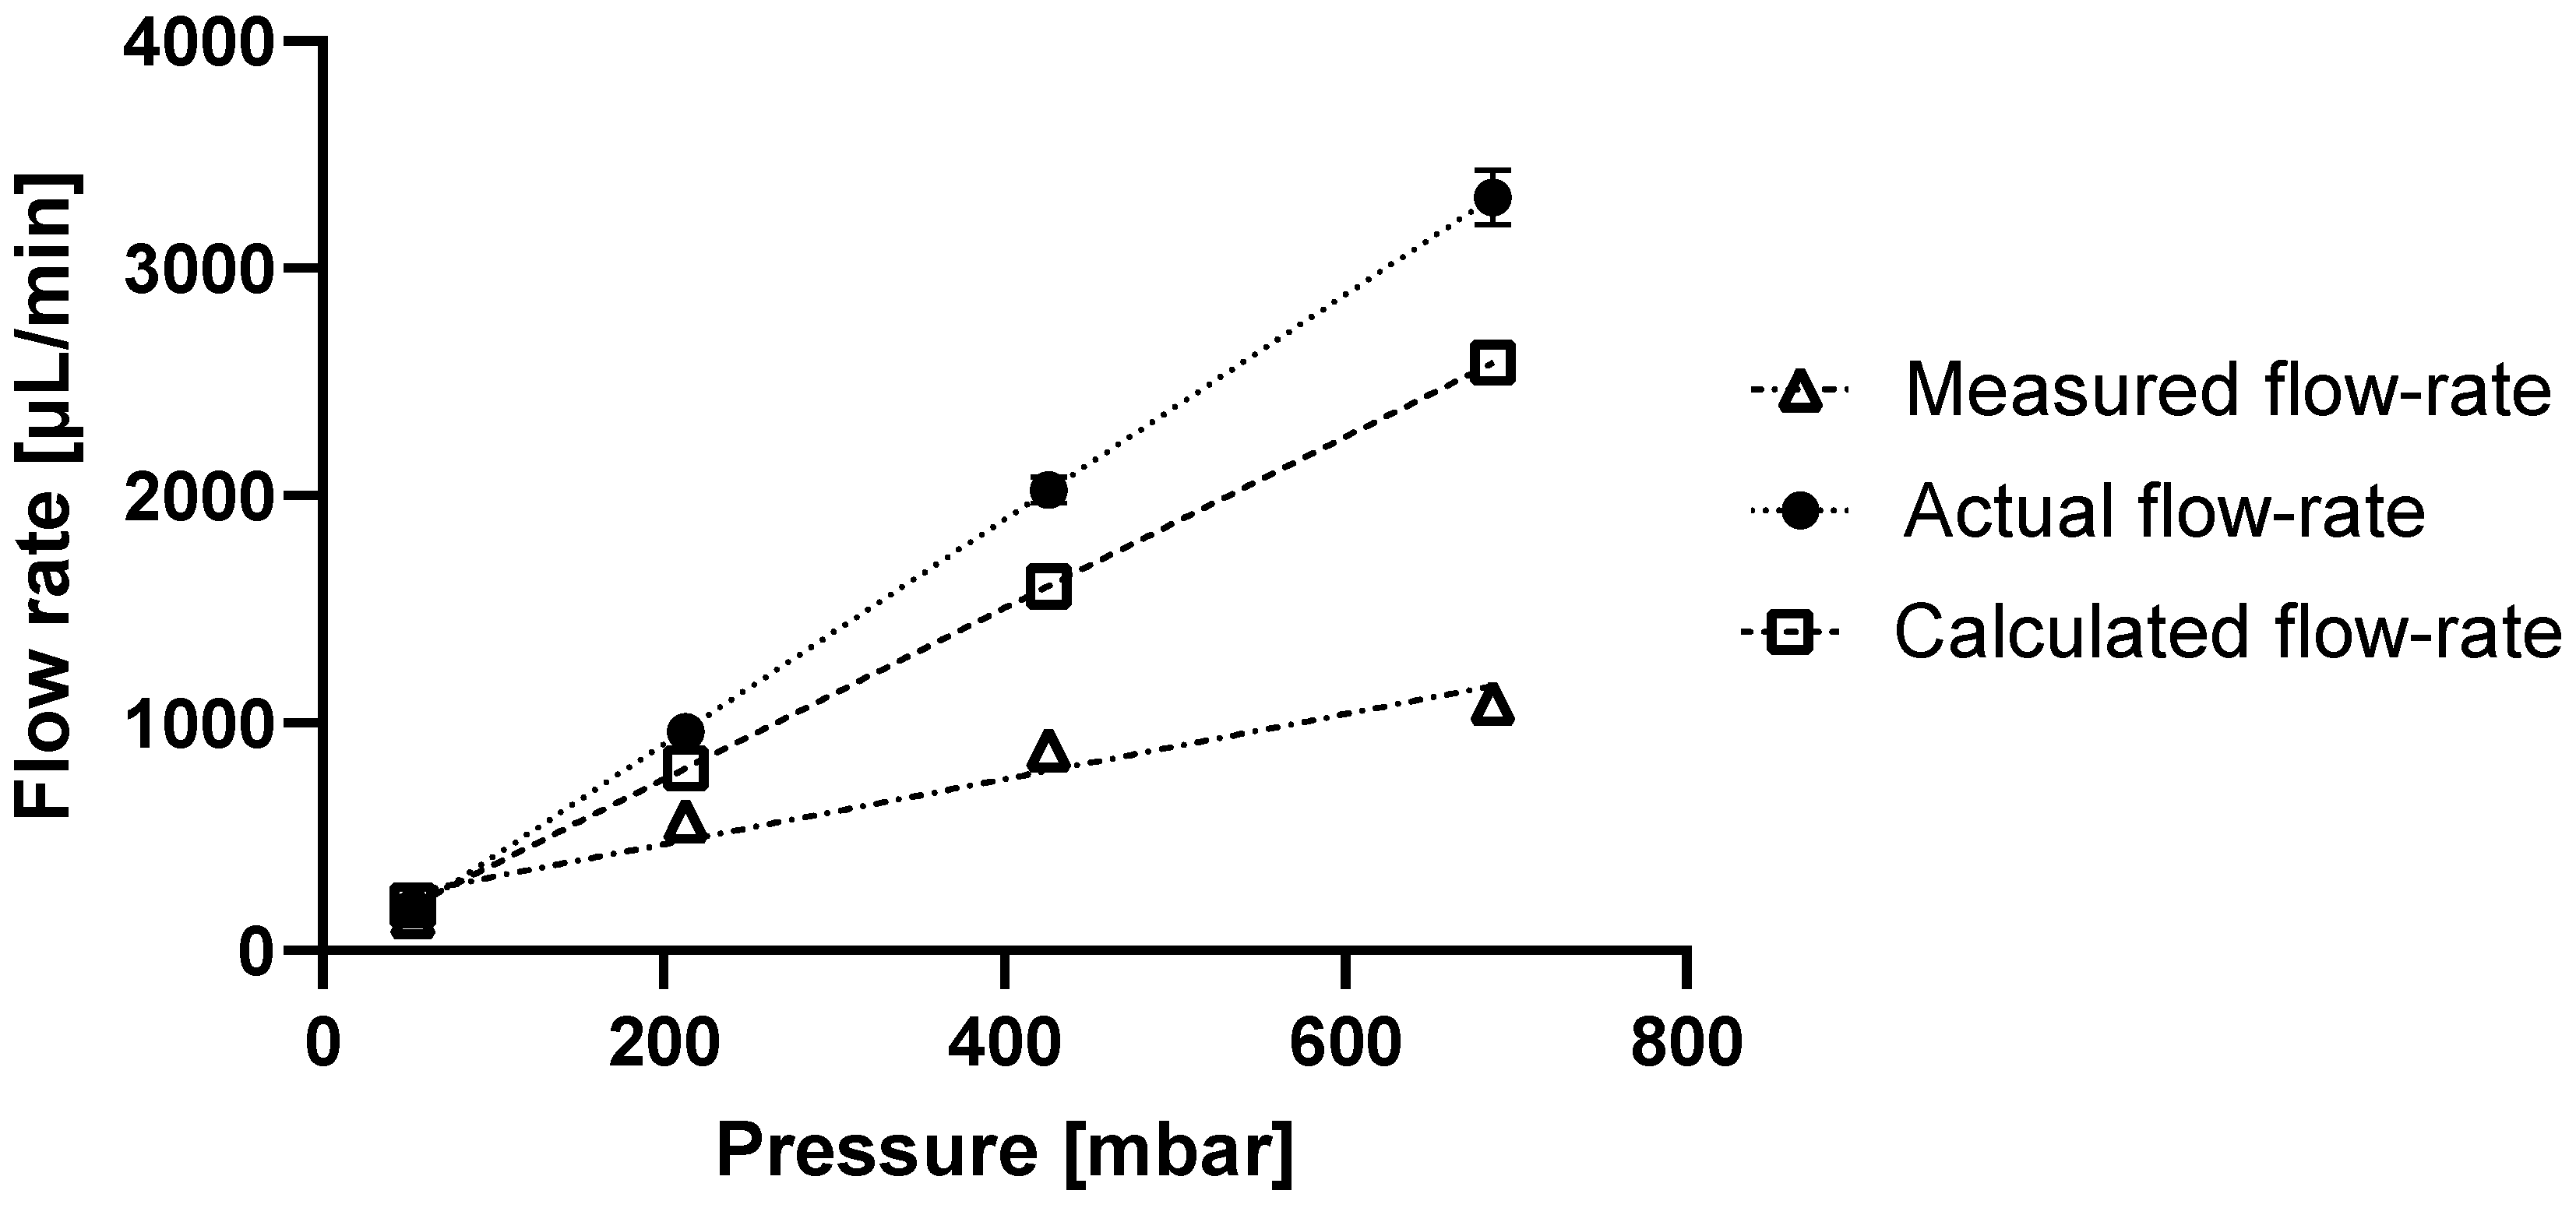
43]. Following each increase in flow rate, the resazurin cell viability assay was performed, and cells were imaged as described above. Flow rate was determined from system pressure by the use of a shear stress calculator for the system with 270 cm of tubing with an internal diameter of 0.508 mm [
44].
4.6. Cell Viability Determination
Cell viability in static conditions was determined by a resazurin assay. Following an experiment, the spent culture medium was removed, and the cells were washed once with 100 µL of PBS, followed by an addition of fresh medium containing 10% (
v/
v) alamarBlue
TM (Waltham, MA, USA). Cell viability was determined after two hours of incubation by determination of fluorescence at 590 nm with excitation at 560 nm using a fluorescent filter in a plate reader (Tecan Spark
®, Männedorf, Switzerland). Blank was represented as culture medium with 10% (
v/
v) alamarBlue
TM without cells, while control was represented by cells incubated in culture medium without treatment. Cell viability was calculated as presented in Equation (2):
where
Fsample represents the sample fluorescence,
Fblank represents the fluorescence background, and
Fcontrol represents the fluorescence of control.
Cell viability in microfluidic experiments was determined and calculated differently than that in static conditions. After incubation under flow conditions, the OOC was disconnected from the microfluidic apparatus, with both capillaries washed with an excess of culture medium containing 10% (
v/
v) of alamarBlue
TM to remove spent culture medium. Then, all medium in the wells, except that present directly in the capillary, was removed and the OOC was incubated in static conditions (37 °C, 30 min). After 30 min of incubation, 25 µL of the reagent were transferred from the capillary to a 96-well plate and mixed with 25 µL of PBS. Cell viability was determined by measurement of fluorescence at 590 nm with excitation at 560 nm using a fluorescent filter in a plate reader (Tecan Spark
®, Switzerland). Blank was prepared for each timepoint by mixing 25 µL of 10% (
v/
v) solution of alamarBlue
TM with 25 µL of PBS. The cell viability was calculated according to Equation (3):
where
Fsample represents the sample fluorescence,
Fsample−blank represents the blank measured with the sample,
F0 represents the cell viability of the same chip measured before an experiment, and
F0−blank represents the blank before the experiment.
4.7. Microfluidic Cell Culture
All microfluidic experiments were done using a Fluigent pressure-based pump system (Paris, France), which consisted of a pressure generator (FPLG+), two units of FlowEZ
TM, and two 2-Switches controlled by OxyGEN software (version 2.3.2.0). The flow was measured and regulated by a Flow unit L sensor. Flow rate validation was performed prior to an OOC experiment and after the conclusion of the experiment. The flow validation experiments were performed gravimetrically, setting a specific flow for a defined period, while collecting the efflux into a weighted Eppendorf tube. A recirculation setup, which enabled unidirectional flow of CO
2 independent medium in the endothelial OOC, was used to perform microfluidic experiments (Schematic and picture available in
Supplementary Materials Figure S3).
After cell seeding as described above, the OOC was incubated in static conditions to allow cell adhesion (3 h, 37 °C). The OOC was then connected to the microfluidic recirculation loop with a set flow of 100 µL/min (corresponding to a shear stress of 0.044 Pa) overnight.
4.8. Determination of Oxidative Stress in Static Conditions
Endothelial cells EA.hy926 were seeded on the central 60 wells of 96-well plates (1.5 × 10⁴ cells/well) containing 100 µL of complete DMEM and grown for 48 h to reach confluence. Then, the cells were washed with PBS, followed by the addition of H2O2 or AAPH in complete CO2-independent medium.
For H2O2 experiments, cells were incubated with H2O2 for 30 min in the following concentrations: 0 (control), 0.1, 1, 2.5, 5, 10, 20, 30, 50, and 100 mM. After the incubation, the H2O2-containing medium was removed and replaced with fresh CO2 independent medium containing 10% (v/v) alamarBlueTM reagent (Thermo-Fischer Scientific, Waltham, MA, USA); cell viability was determined as described above.
For AAPH experiments, cells were incubated with AAPH for 3 h as well as 24 h in the following concentrations: 0 (control), 0.1, 0.5, 1, 5, 10, 20, 30, 40, 60, 100, and 200 mM. After the incubation, the AAPH-containing medium was removed and replaced with fresh CO2 independent medium containing 10% (v/v) alamarBlueTM reagent, and cell viability was determined as described above.
To control for changes in osmolarity, in a separate set of experiments sodium chloride was added to cell culture medium at concentrations of 5 mM, 25 mM, and 100 mM, corresponding to an increase in osmolarity of 10 mOsm/L, 50 mOsm/L, and 200 mOsm/L.
4.9. Determination of Oxidative Stress Under Flow Conditions
Cells were seeded in OOC channels at a concentration of 3.3 × 10⁶ cells/mL, which was the cell seeding concentration used in all oxidative-stress-related OOC experiments. After 1 h of static incubation, we exposed the cells to flow conditions overnight (100 µL/min, corresponding to the shear stress of 0.044 Pa).
Following overnight incubation under flow conditions, the OOC was disconnected from the recirculation loop and the medium inside the capillaries was replaced by a 10% (
v/
v) solution of the alamarBlue™ reagent in CO
2 independent medium (control measurement). The reagent was incubated in static conditions for 30 min, after which 25 µL were removed from each capillary and transferred to a 96-well plate and diluted with 25 µL of PBS. The fluorescence was measured at 590 nm with excitation at 560 nm using a plate reader. Cells were imaged after each time point by phase-contrast microscopy as described above in
Section 4.3.
Following the control measurement, the microfluidic OOC was attached back in the recirculation loop with CO2 independent medium containing H2O2 in the lowest concentration (1 mM). The H2O2 solution was circulated for 30 min (100 µL/min, corresponding to the shear stress of 0.044 Pa), after which the OOC was disconnected, and the cell viability was determined. This protocol was repeated on the same cells in concentrations of 1, 10, 20, and 50 mM of H2O2. A similar protocol was employed for the incubation of cells with AAPH, with each concentration being recirculated for 3 h instead of 30 min with three subsequent AAPH concentrations evaluated in three groups (10, 50, and 200 mM; 28, 79, and 200 mM or 35, 80, and 200 mM). Concentrations were refined during assay calibration to include low injury, near IC50 injury, and near-complete injury.
The applicability of the OOC model was further evaluated using quercetin as a model antioxidant by two different protocols. In protocol I (simultaneous approach), a 1.5 µM solution of quercetin was prepared in a 79 mM solution of AAPH in CO2 independent medium (corresponding to a preliminary IC50 value under flow conditions). Following the control measurement, this solution was recirculated for 3 h. In protocol II (pre-treatment approach), a separate solution of 1.5 µM quercetin was prepared in CO2 independent medium, which was recirculated for 30 min prior to the 3 h of recirculation with 79 mM AAPH, followed by the determination of cell viability.
4.10. Statistical Analysis
Data are presented as mean ± SEM. The number of independent biological replicates (n) is indicated in the corresponding figure legends. Statistical analysis was performed using GraphPad Prism version 11.0 (GraphPad Software, San Diego, CA, USA). Differences were considered statistically significant at p < 0.05.
For comparison of cell viability across multiple shear-stress conditions within the same experimental series compared to the control group, one-way repeated-measures analysis of variance (ANOVA) followed by Dunnett’s post hoc multiple-comparison test was used.
For concentration–response experiments with H2O2 and AAPH, we determined IC50 values by nonlinear regression using a four-parameter logistic model (Hill equation). Curve fitting was performed separately for static and flow conditions.
For experiments evaluating the protective activity of quercetin on AAPH-induced injury in our OOC model, statistical comparisons between treatment groups were performed using one-way ANOVA followed by Dunnett’s post hoc multiple-comparison test, using the AAPH-treated group as the reference group.