1. Introduction
Myalgic encephalomyelitis (ME) is a complex, multisystem, and disabling disorder characterized by persistent, unexplained fatigue, post-exertional malaise (PEM), and a constellation of cognitive, autonomic, and neurological impairments [
1,
2,
3]. PEM, the clinical hallmark of ME, is defined as a delayed and disproportionate exacerbation of symptoms following minimal physical or mental exertion, often persisting for days to weeks [
4]. Despite its substantial socio-economic burden and profound impact on quality of life, the underlying pathophysiological mechanisms of ME remain poorly defined, and the disease lacks both validated molecular diagnostic tools and effective disease-modifying therapies [
5].
Accumulating evidence implicates disrupted energy metabolism and mitochondrial dysfunction as central features of ME pathogenesis. Patients consistently demonstrate reduced oxidative phosphorylation capacity and impaired cellular bioenergetic responses, which may underlie their diminished resilience to metabolic stress [
6,
7,
8]. Within this context, irisin, a 112-amino acid myokine derived from the proteolytic cleavage of fibronectin type III domain-containing protein 5 (FNDC5), has emerged as a key regulator of metabolic homeostasis. Induced by peroxisome proliferator-activated receptor gamma coactivator 1-alpha (PGC1-α) during exercise, irisin promotes the browning of white adipose tissue, enhances mitochondrial thermogenesis, and facilitates glucose uptake [
9,
10]. Given that irisin expression is closely linked to physical activity and exercise-induced metabolic adaptation, reduced physical activity levels commonly observed in ME patients may also contribute, at least in part, to lower circulating irisin levels. In addition, irisin has demonstrated neuroprotective and anti-fatigue effects in several neurological conditions [
11,
12,
13]; however, its role and signaling integrity in ME remain unexplored.
While irisin represents a critical adaptive metabolic signal, parallel pathways associated with vascular and inflammatory dysfunction may counteract these beneficial effects. Specifically, the matricellular protein thrombospondin-1 (TSP-1) is reported to be elevated in ME patient cohorts [
14], reflecting underlying platelet hyperactivation and endothelial dysfunction. As a multifunctional glycoprotein, TSP-1 inhibits nitric oxide (NO) signaling and angiogenesis, potentially exacerbating tissue hypoxia and metabolic dysregulation [
15]. Crucially, TSP-1 engages multiple cell-surface receptors, including integrin-associated pathways [
16], which are also implicated in mediating irisin signaling, particularly within the αV integrin family [
17,
18]. In addition, extracellular heat shock protein 90 alpha (HSP90α) has emerged as an important regulator of integrin activation and receptor-mediated signaling. Unlike the predominantly intracellular HSP90β isoform, HSP90α can be secreted into the extracellular environment, where it modulates ligand–receptor interactions and stress-response signaling pathways. Previous studies have demonstrated that extracellular HSP90α participates in the regulation of αv integrin-dependent signaling complexes, providing a mechanistic rationale to investigate its potential involvement in irisin-mediated metabolic signaling [
19,
20,
21]. This shared receptor interface raises the possibility of competitive or reciprocal modulation between these pathways [
16,
17,
18]. However, despite the recognized roles of irisin in metabolic adaptation and TSP-1 in chronic disease pathology, their functional interaction remains poorly understood and has not been investigated in the context of ME. In particular, it remains unclear whether elevated TSP-1 may antagonize irisin signaling by interfering with receptor engagement and downstream metabolic responses.
This knowledge gap is particularly relevant to the pathophysiological paradox observed in ME, in which physical exertion fails to elicit adaptive metabolic responses and instead precipitates symptom exacerbation [
22]. The present study aims to define the functional role of irisin in ME pathogenesis and elucidate the molecular mechanisms underlying its impaired signaling. We hypothesized that elevated TSP-1 acts as a molecular inhibitor of irisin signaling by interfering with αvβ5 integrin binding and disrupting its critical interaction with the chaperone protein HSP90α. To test this hypothesis, we employed a cross-sectional clinical design combined with cellular dielectric spectroscopy (CDS) to characterize, in real time, the dynamic interactions between irisin and TSP-1. By elucidating the irisin–TSP-1 signaling axis, this study aims to provide a comprehensive mechanistic framework for PEM and to identify specific therapeutic targets for restoring metabolic homeostasis in ME.
3. Discussion
This study provides a novel molecular framework for understanding the energy metabolism dysfunction and PEM that characterize ME. By combining clinical data with bioimpedance assays, we suggest dysregulation of the irisin–TSP-1 axis. Our findings suggest that the metabolic impairment observed in ME is not solely attributable to reduced irisin production, but rather reflects a complex biochemical antagonism in which elevated TSP-1 may act as a functional inhibitor of irisin-mediated signaling.
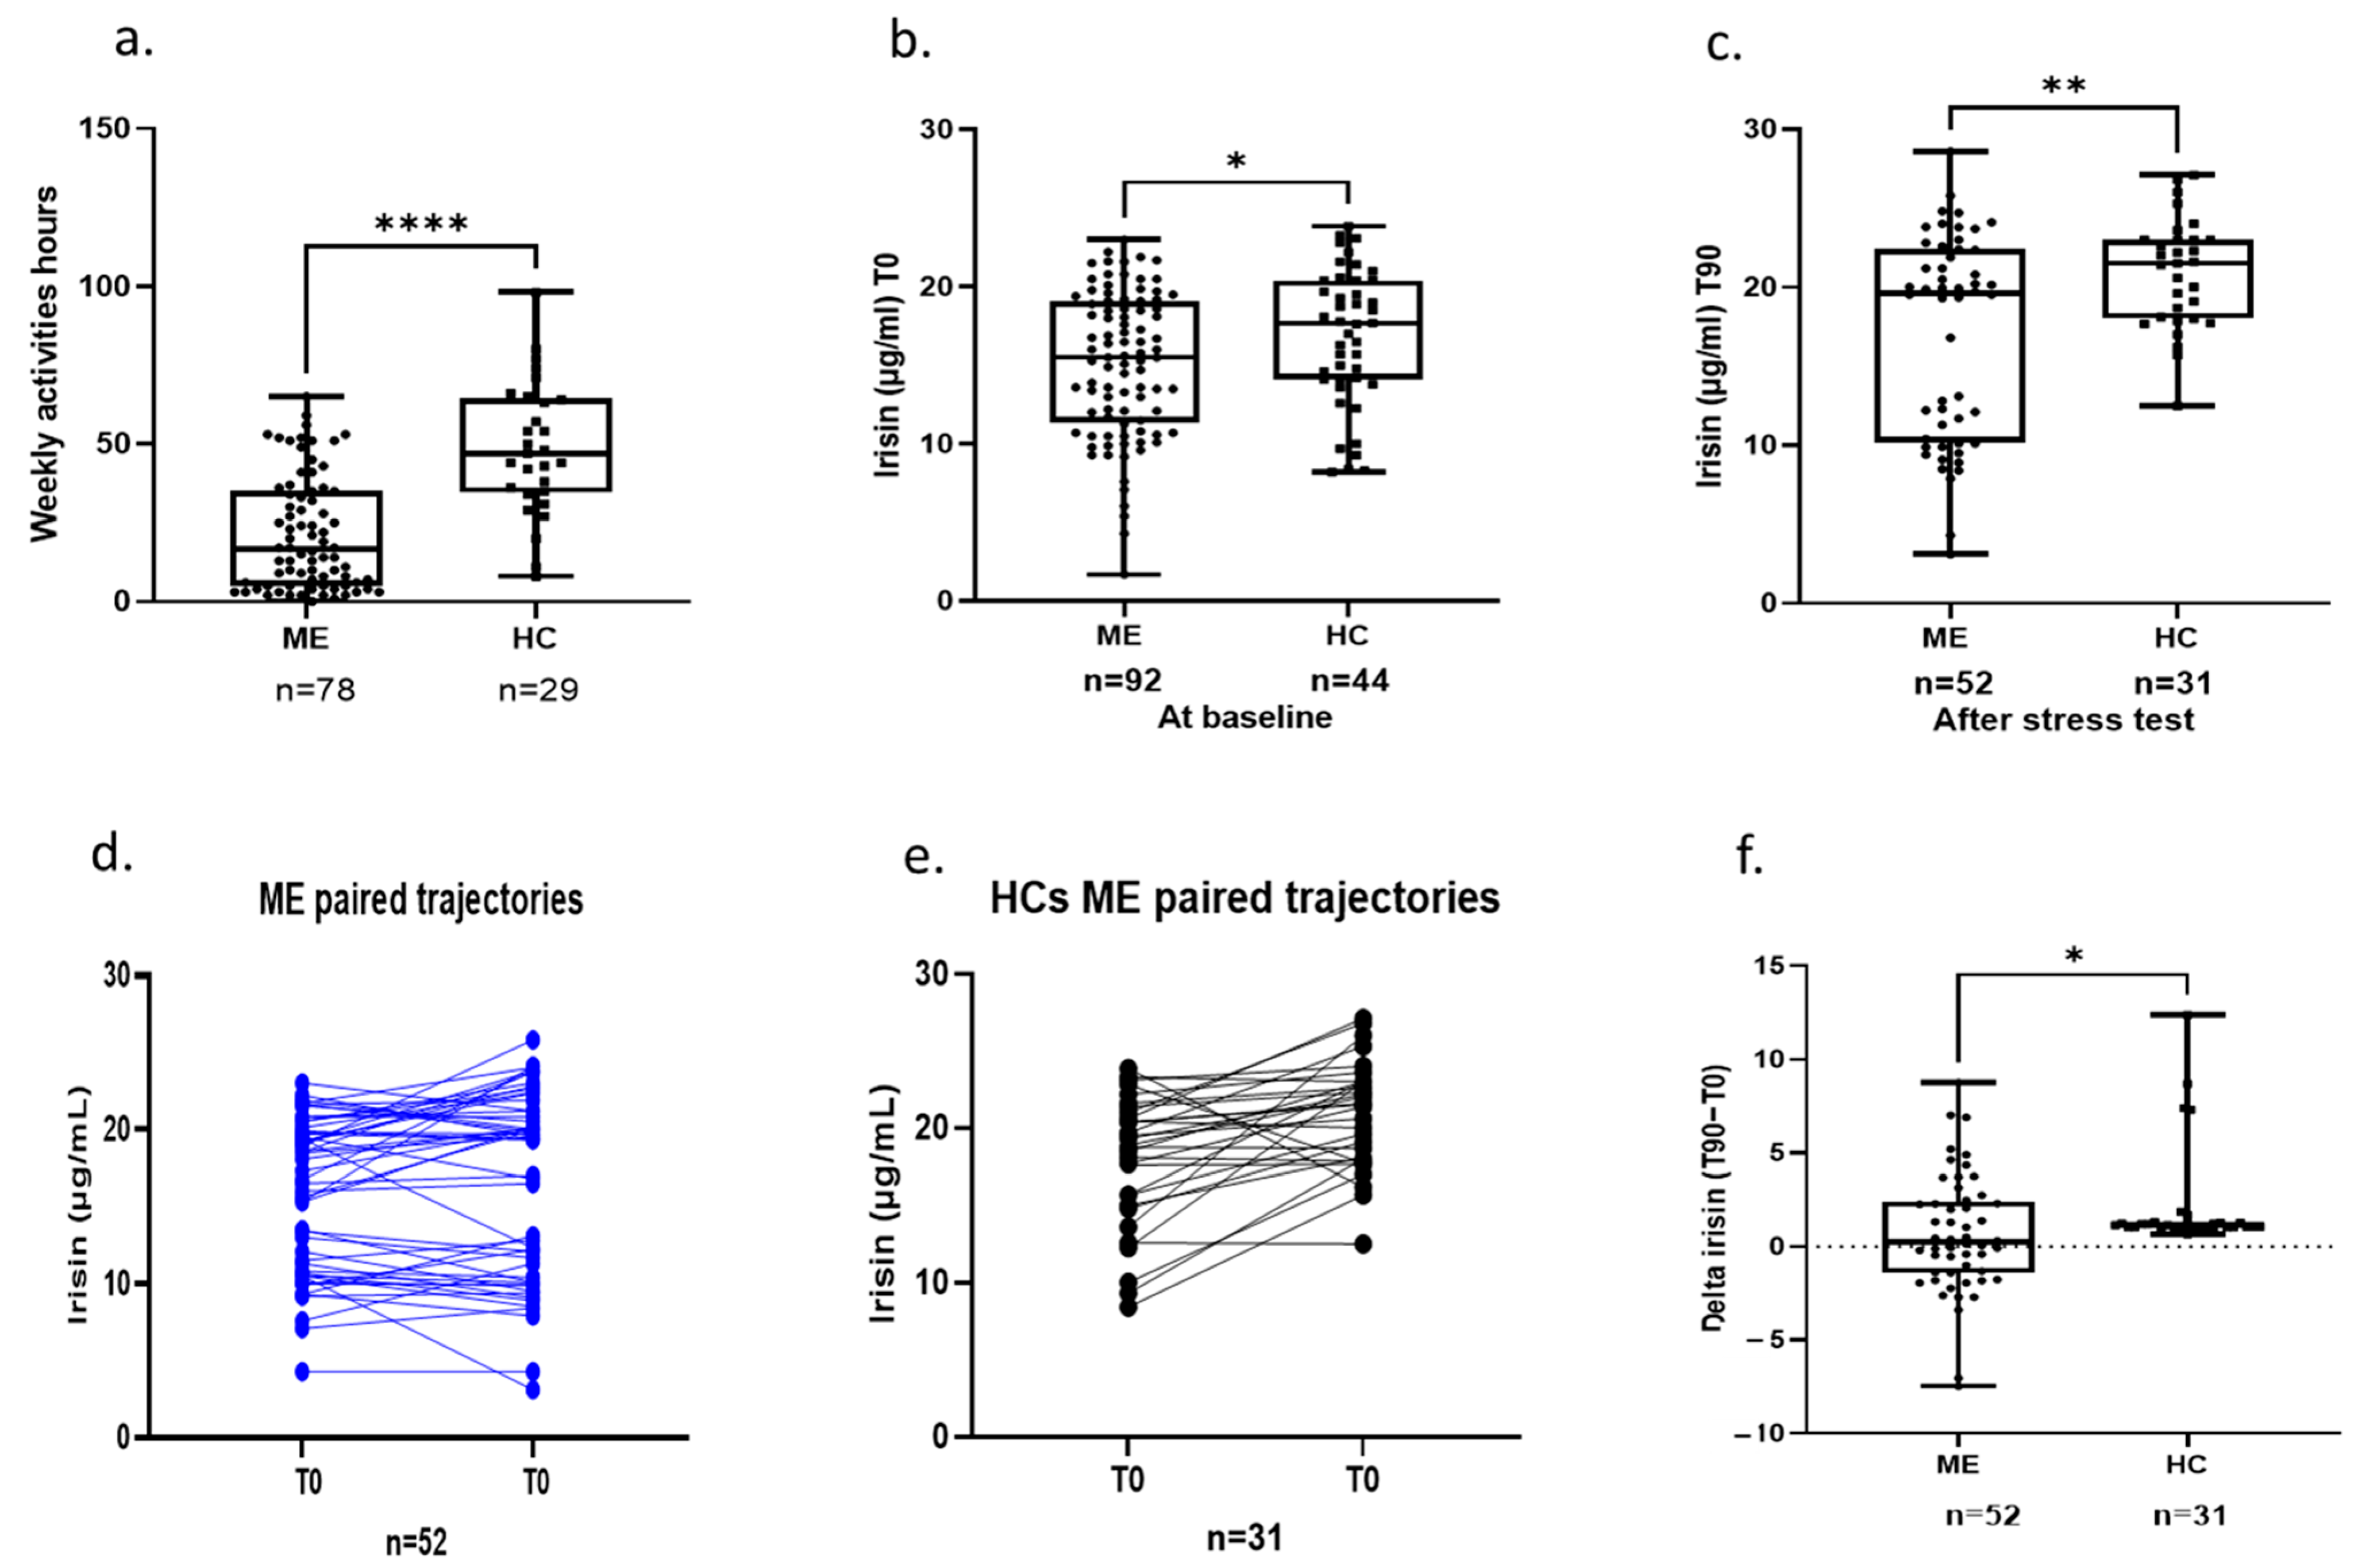
At the clinical level, ME patients exhibited significantly lower baseline circulating irisin levels compared with healthy controls. Given irisin’s established role in promoting mitochondrial oxidative capacity and glucose metabolism, this reduction is consistent with prior evidence of impaired pyruvate dehydrogenase activity and systemic bioenergetic dysfunction in ME [
7]. More importantly, we observed a marked decoupling between irisin dynamics and physical exertion. Whereas healthy individuals demonstrate a robust increase in circulating irisin following physiological stress or exercise, ME patients display a blunted response that fails to meet the metabolic demands of physiological stress. This impaired responsiveness provides a potential molecular correlate of PEM, in which exertion fails to trigger adaptive metabolic recovery. Given the established exercise-dependent regulation of FNDC5/irisin expression, reduced physical activity levels commonly observed in ME patients may contribute, at least in part, to lower circulating irisin levels. However, the persistence of impaired irisin responsiveness following the standardized mechanical stress challenge, together with the observed dysregulation of the irisin–TSP-1 axis and the functional findings demonstratingTSP-1-mediated antagonism of irisin signaling within an HSP90α-sensitive and αvβ5-dependent context, supports the presence of broader intrinsic abnormalities affecting metabolic adaptation pathways in ME.
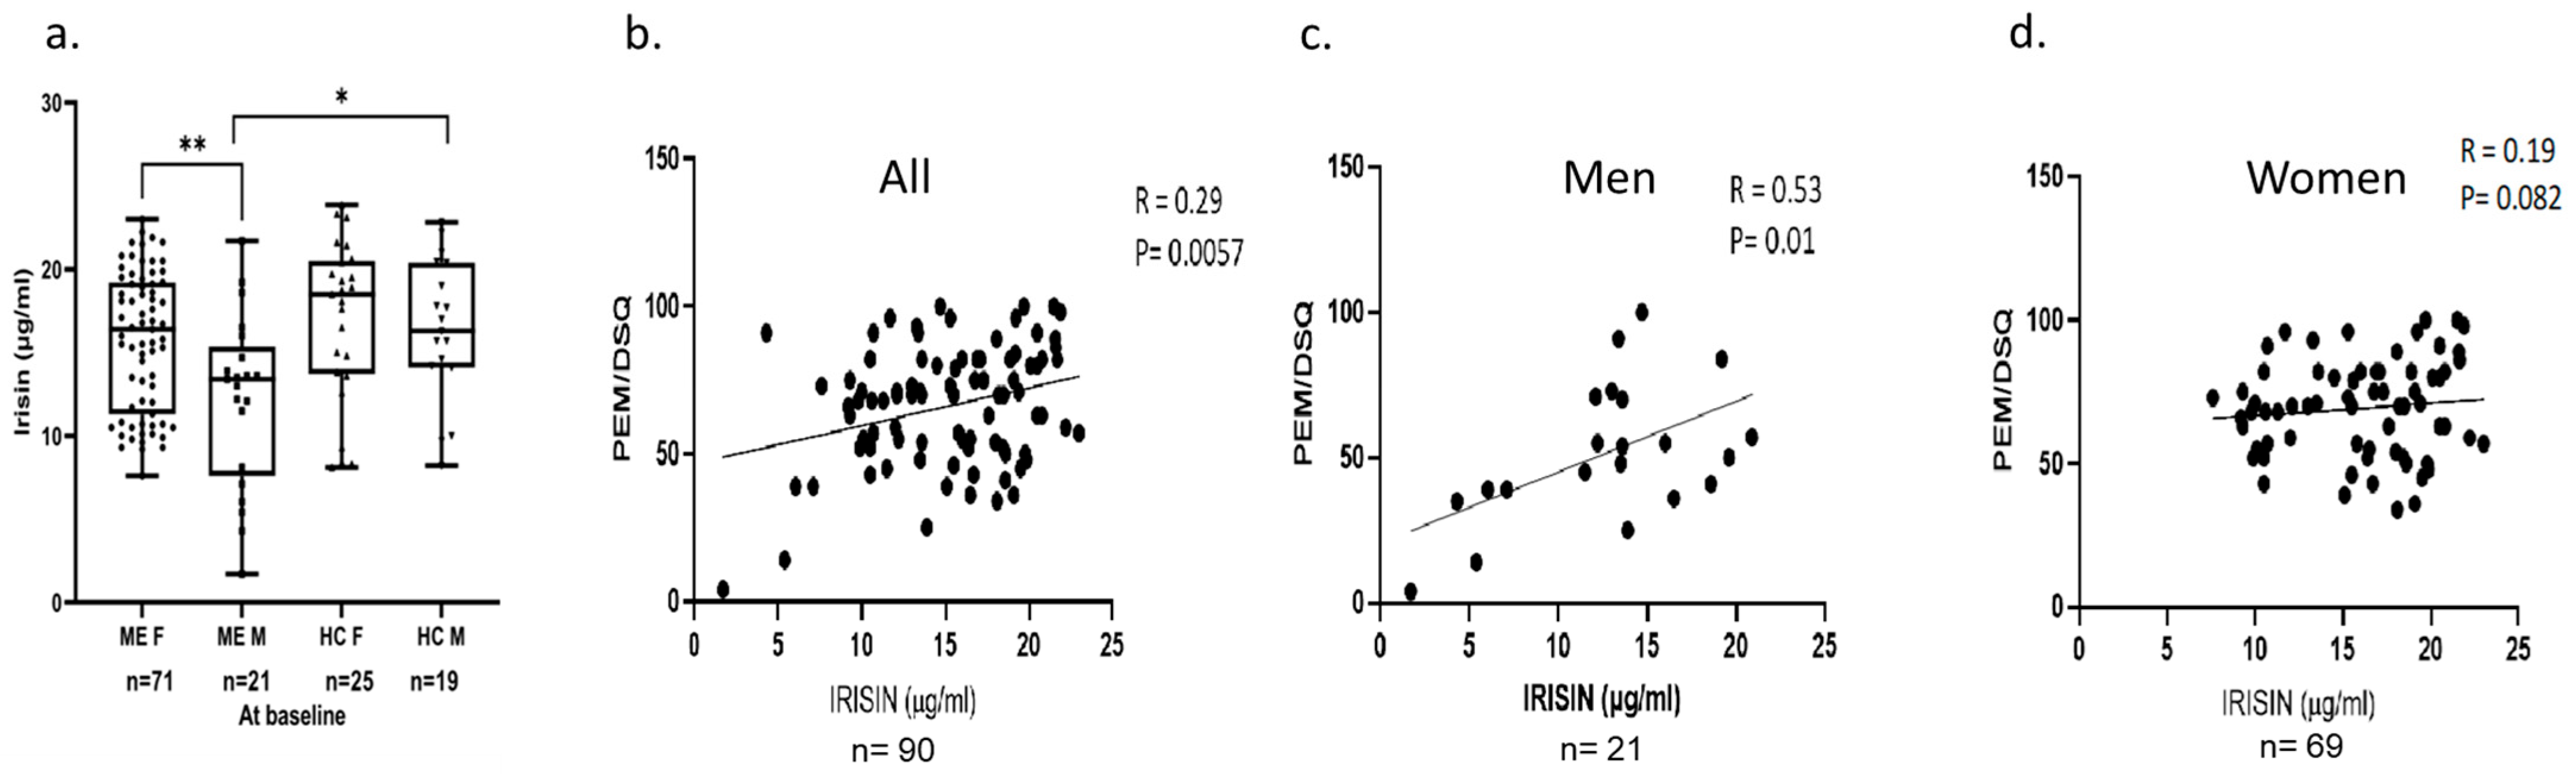
Furthermore, sex-specific differences in baseline irisin levels and their relationship with symptom severity point to biologically distinct mechanisms in ME. In male patients, higher baseline irisin levels were strongly associated with greater PEM severity, a relationship not observed in females. This sex-dependent pattern suggests that the contribution of irisin to symptom exacerbation differs by sex, potentially reflecting underlying differences in immune and metabolic regulation. However, given the smaller number of male participants, these sex-stratified correlations should be interpreted cautiously and require validation in larger independent cohorts. Accordingly, these findings should presently be considered exploratory and hypothesis-generating rather than definitive evidence of sex-specific biological mechanisms. While irisin has been extensively studied as an exercise-induced myokine involved in energy homeostasis, thermogenesis, and metabolic adaptation, its role in ME and, more broadly, in pathological responses to exertion remains largely unexplored. To our knowledge, no prior studies have examined the interplay between irisin and TSP-1 or assessed how this axis may influence receptor-mediated signaling pathways relevant to symptom exacerbation. In this context, our findings identify a previously unrecognized irisin–TSP-1 signaling axis and suggest that its dysregulation contributes to impaired metabolic adaptation in ME. Collectively, these results extend current understanding of irisin biology beyond physiological exercise responses and highlight a novel, potentially sex-dependent mechanism that may underlie heterogeneity in disease severity and progression [
23,
24,
25].
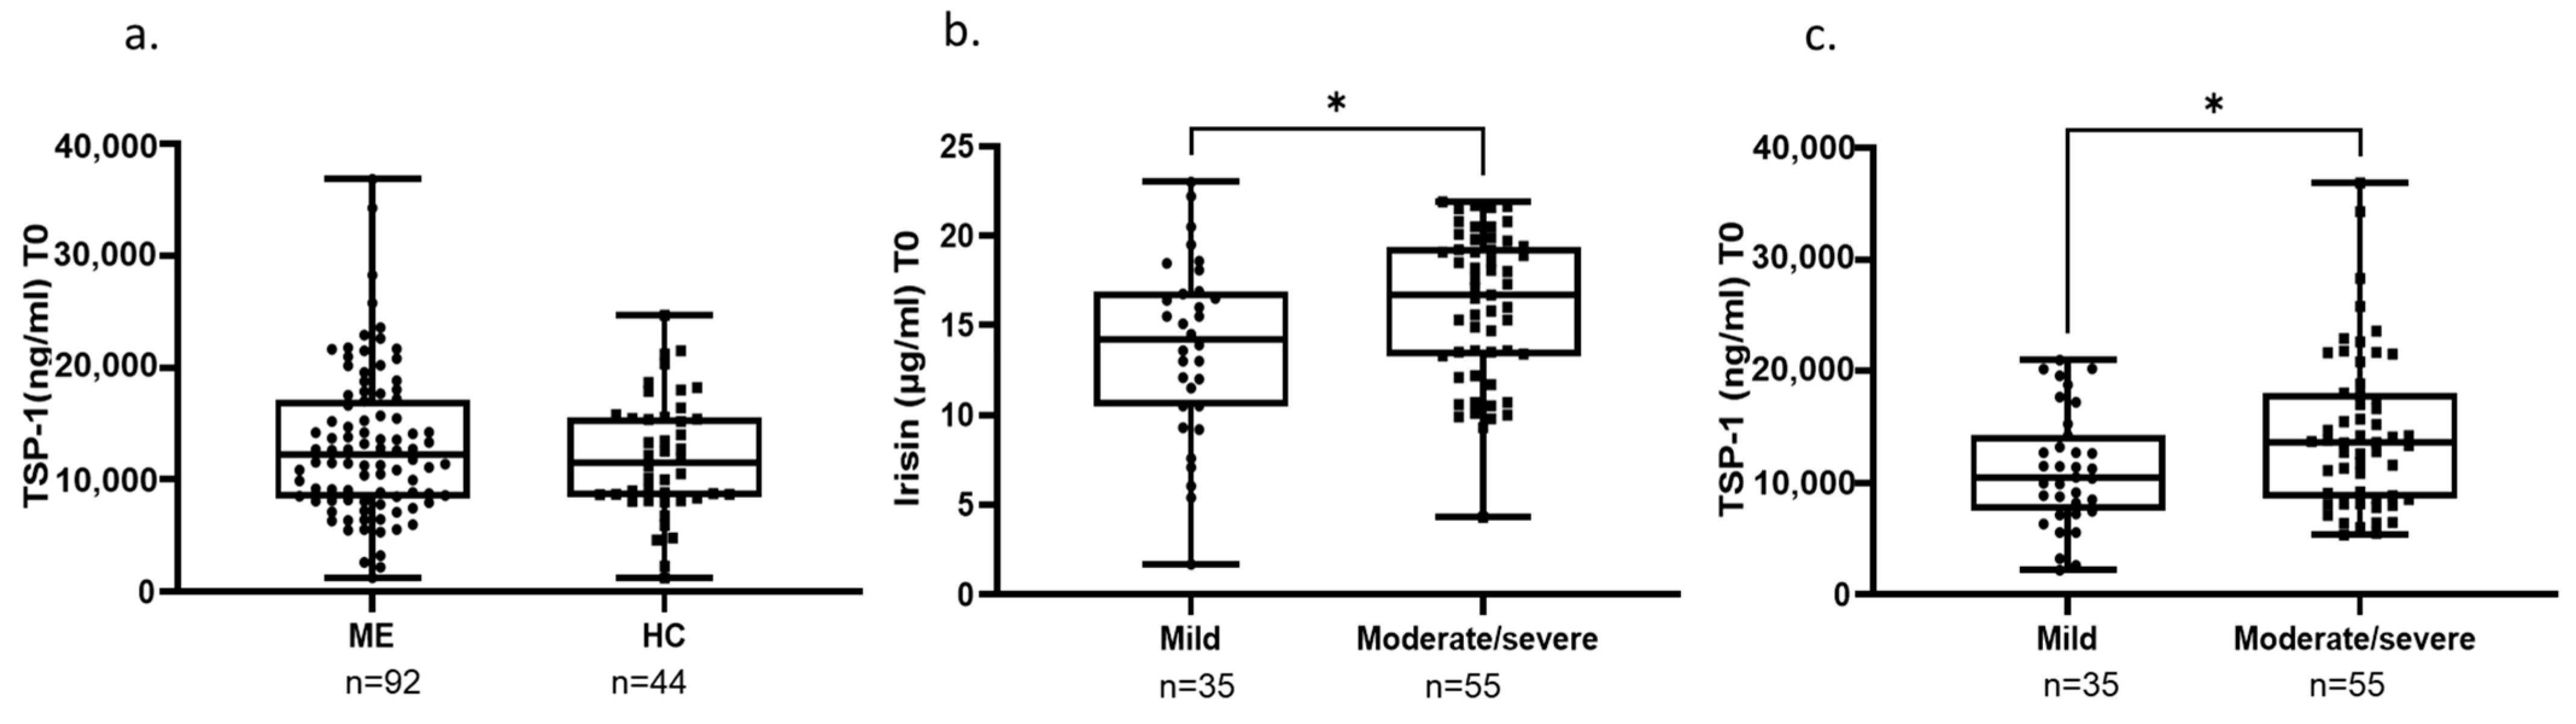
Importantly, these findings support the concept that fatigue and PEM represent distinct, though overlapping, pathophysiological dimensions of ME. While PEM appears to be influenced by sex-specific biological factors, fatigue severity is independently associated with circulating irisin levels, indicating partially divergent underlying mechanisms. Stratification by disease severity revealed a paradoxical pattern: patients with moderate-to-severe fatigue exhibited higher baseline irisin levels than those with milder disease. This observation is consistent with a compensatory yet ineffective metabolic response, in which increased myokine production fails to translate into functional signaling. The robustness of this relationship is supported by multivariable regression analysis, which identified baseline irisin as an independent predictor of fatigue severity after adjustment for age, sex, BMI, and disease duration.
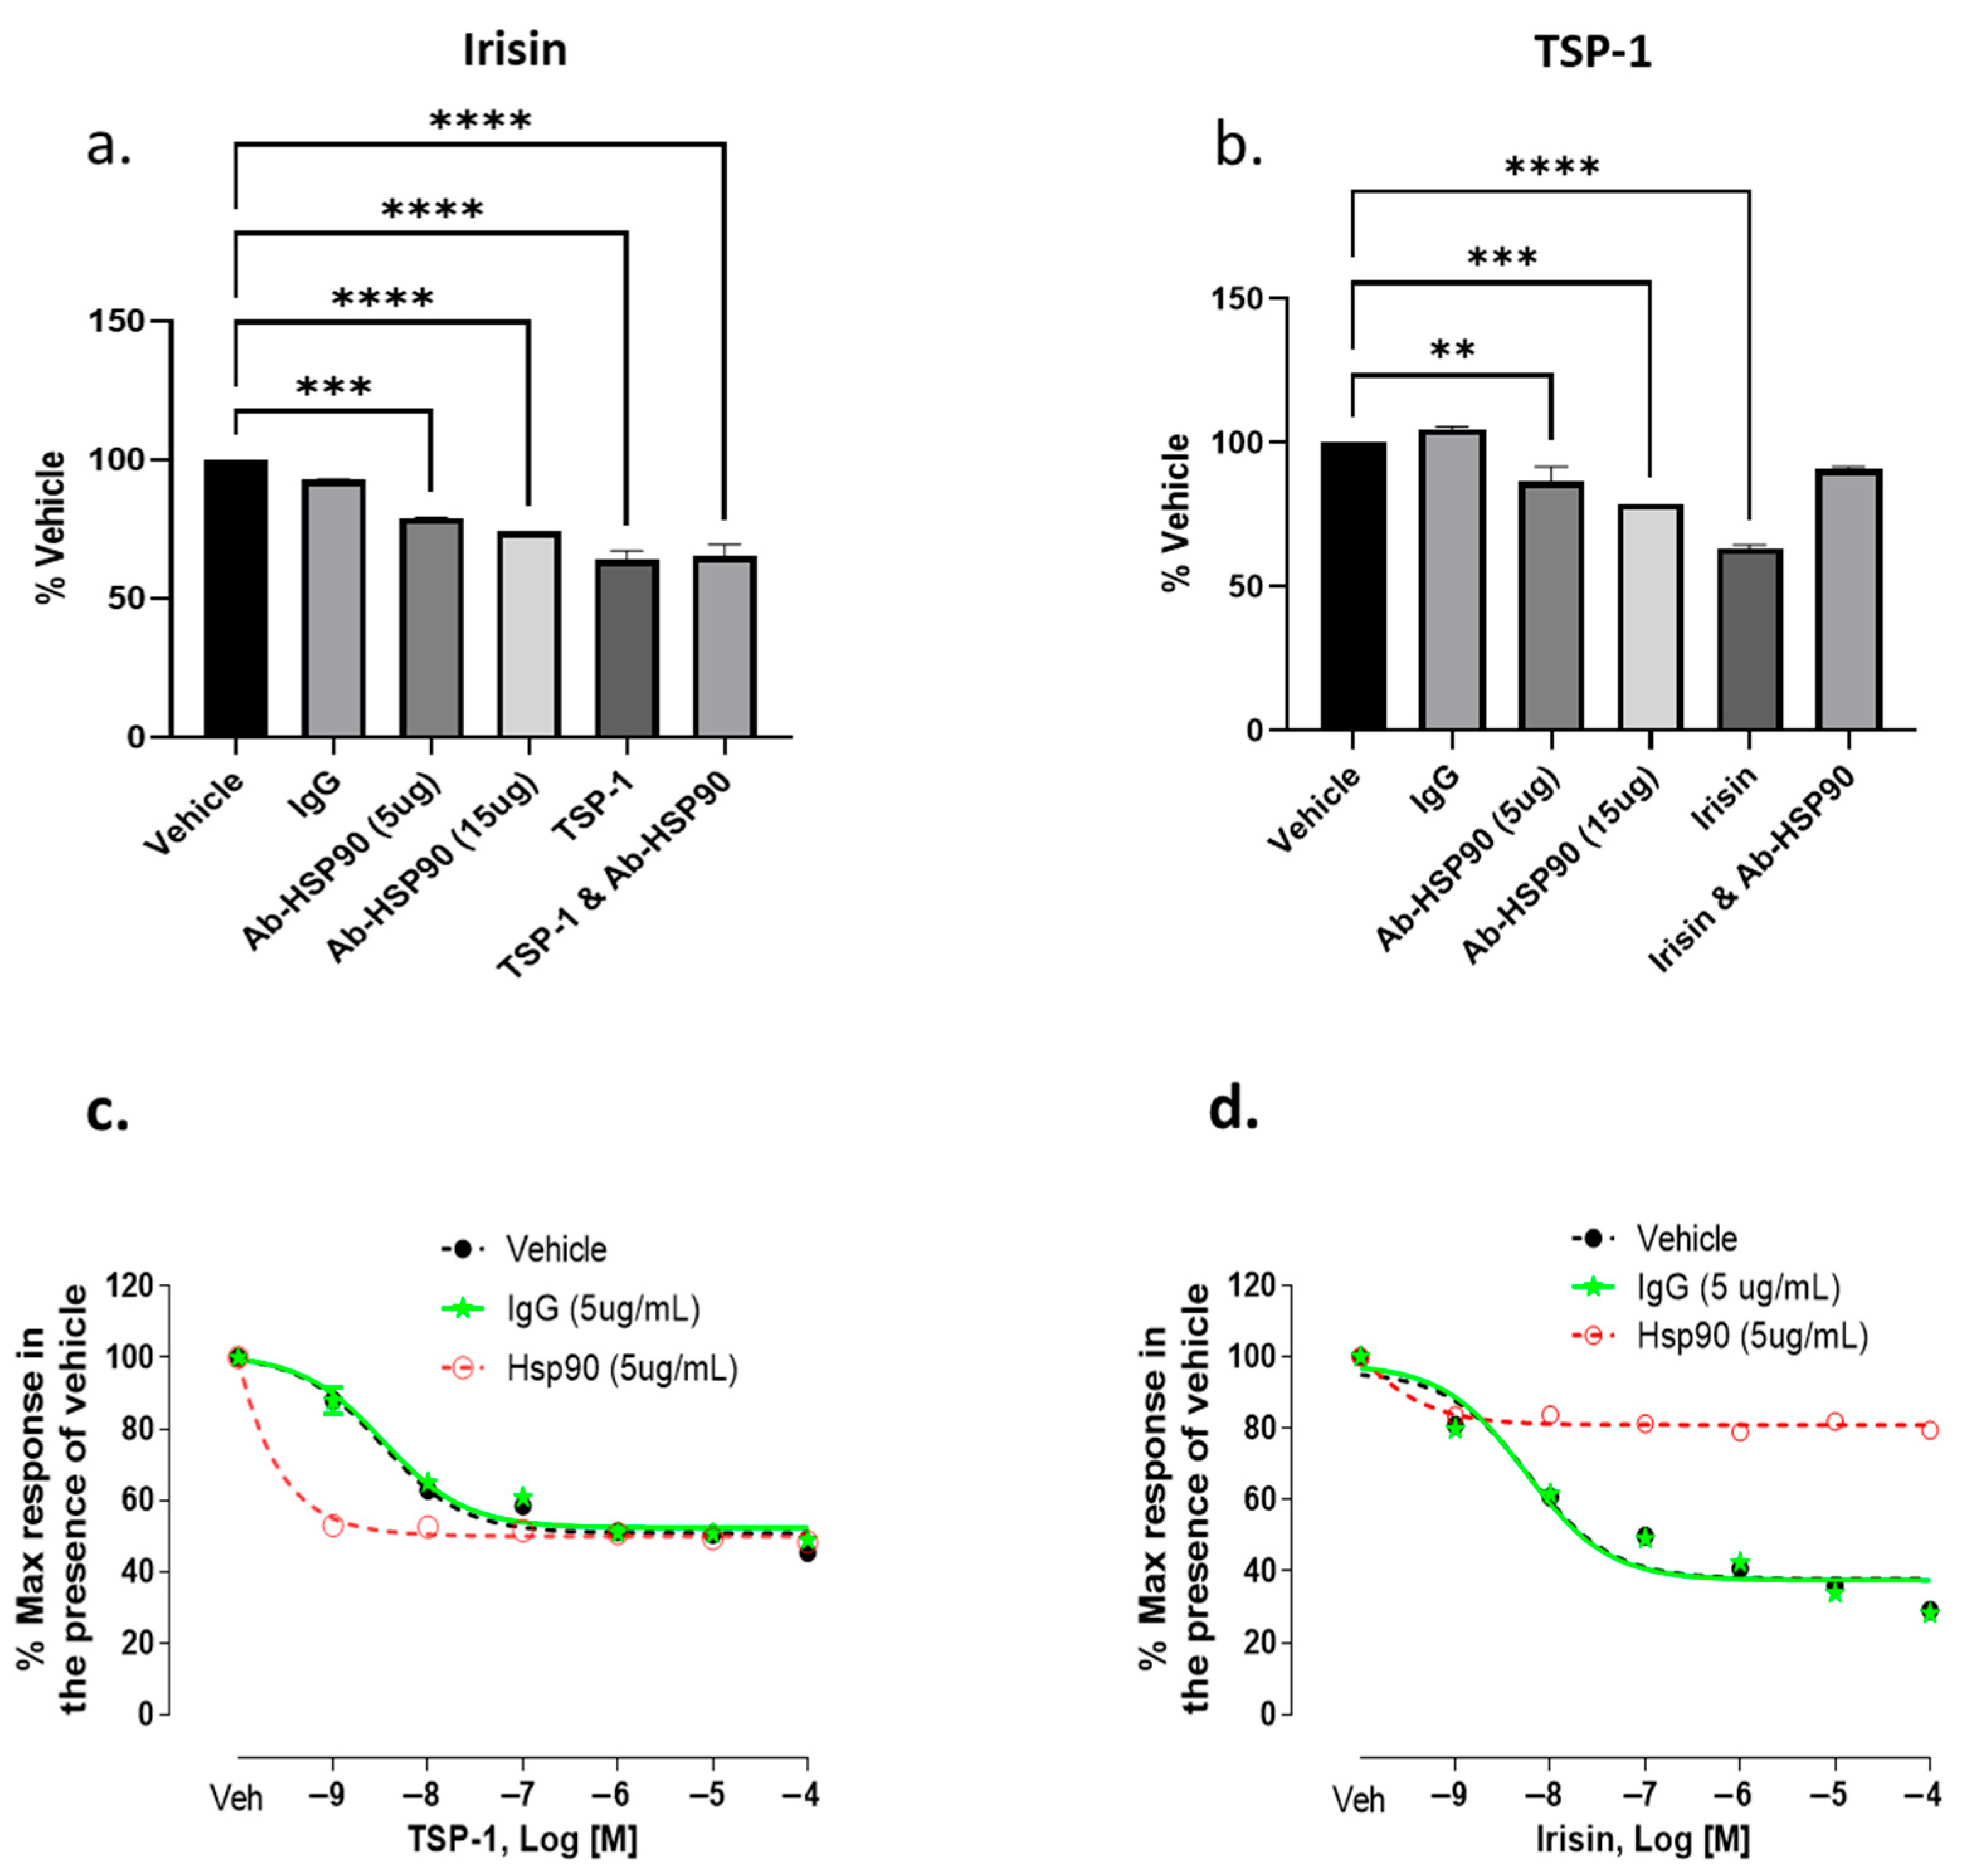
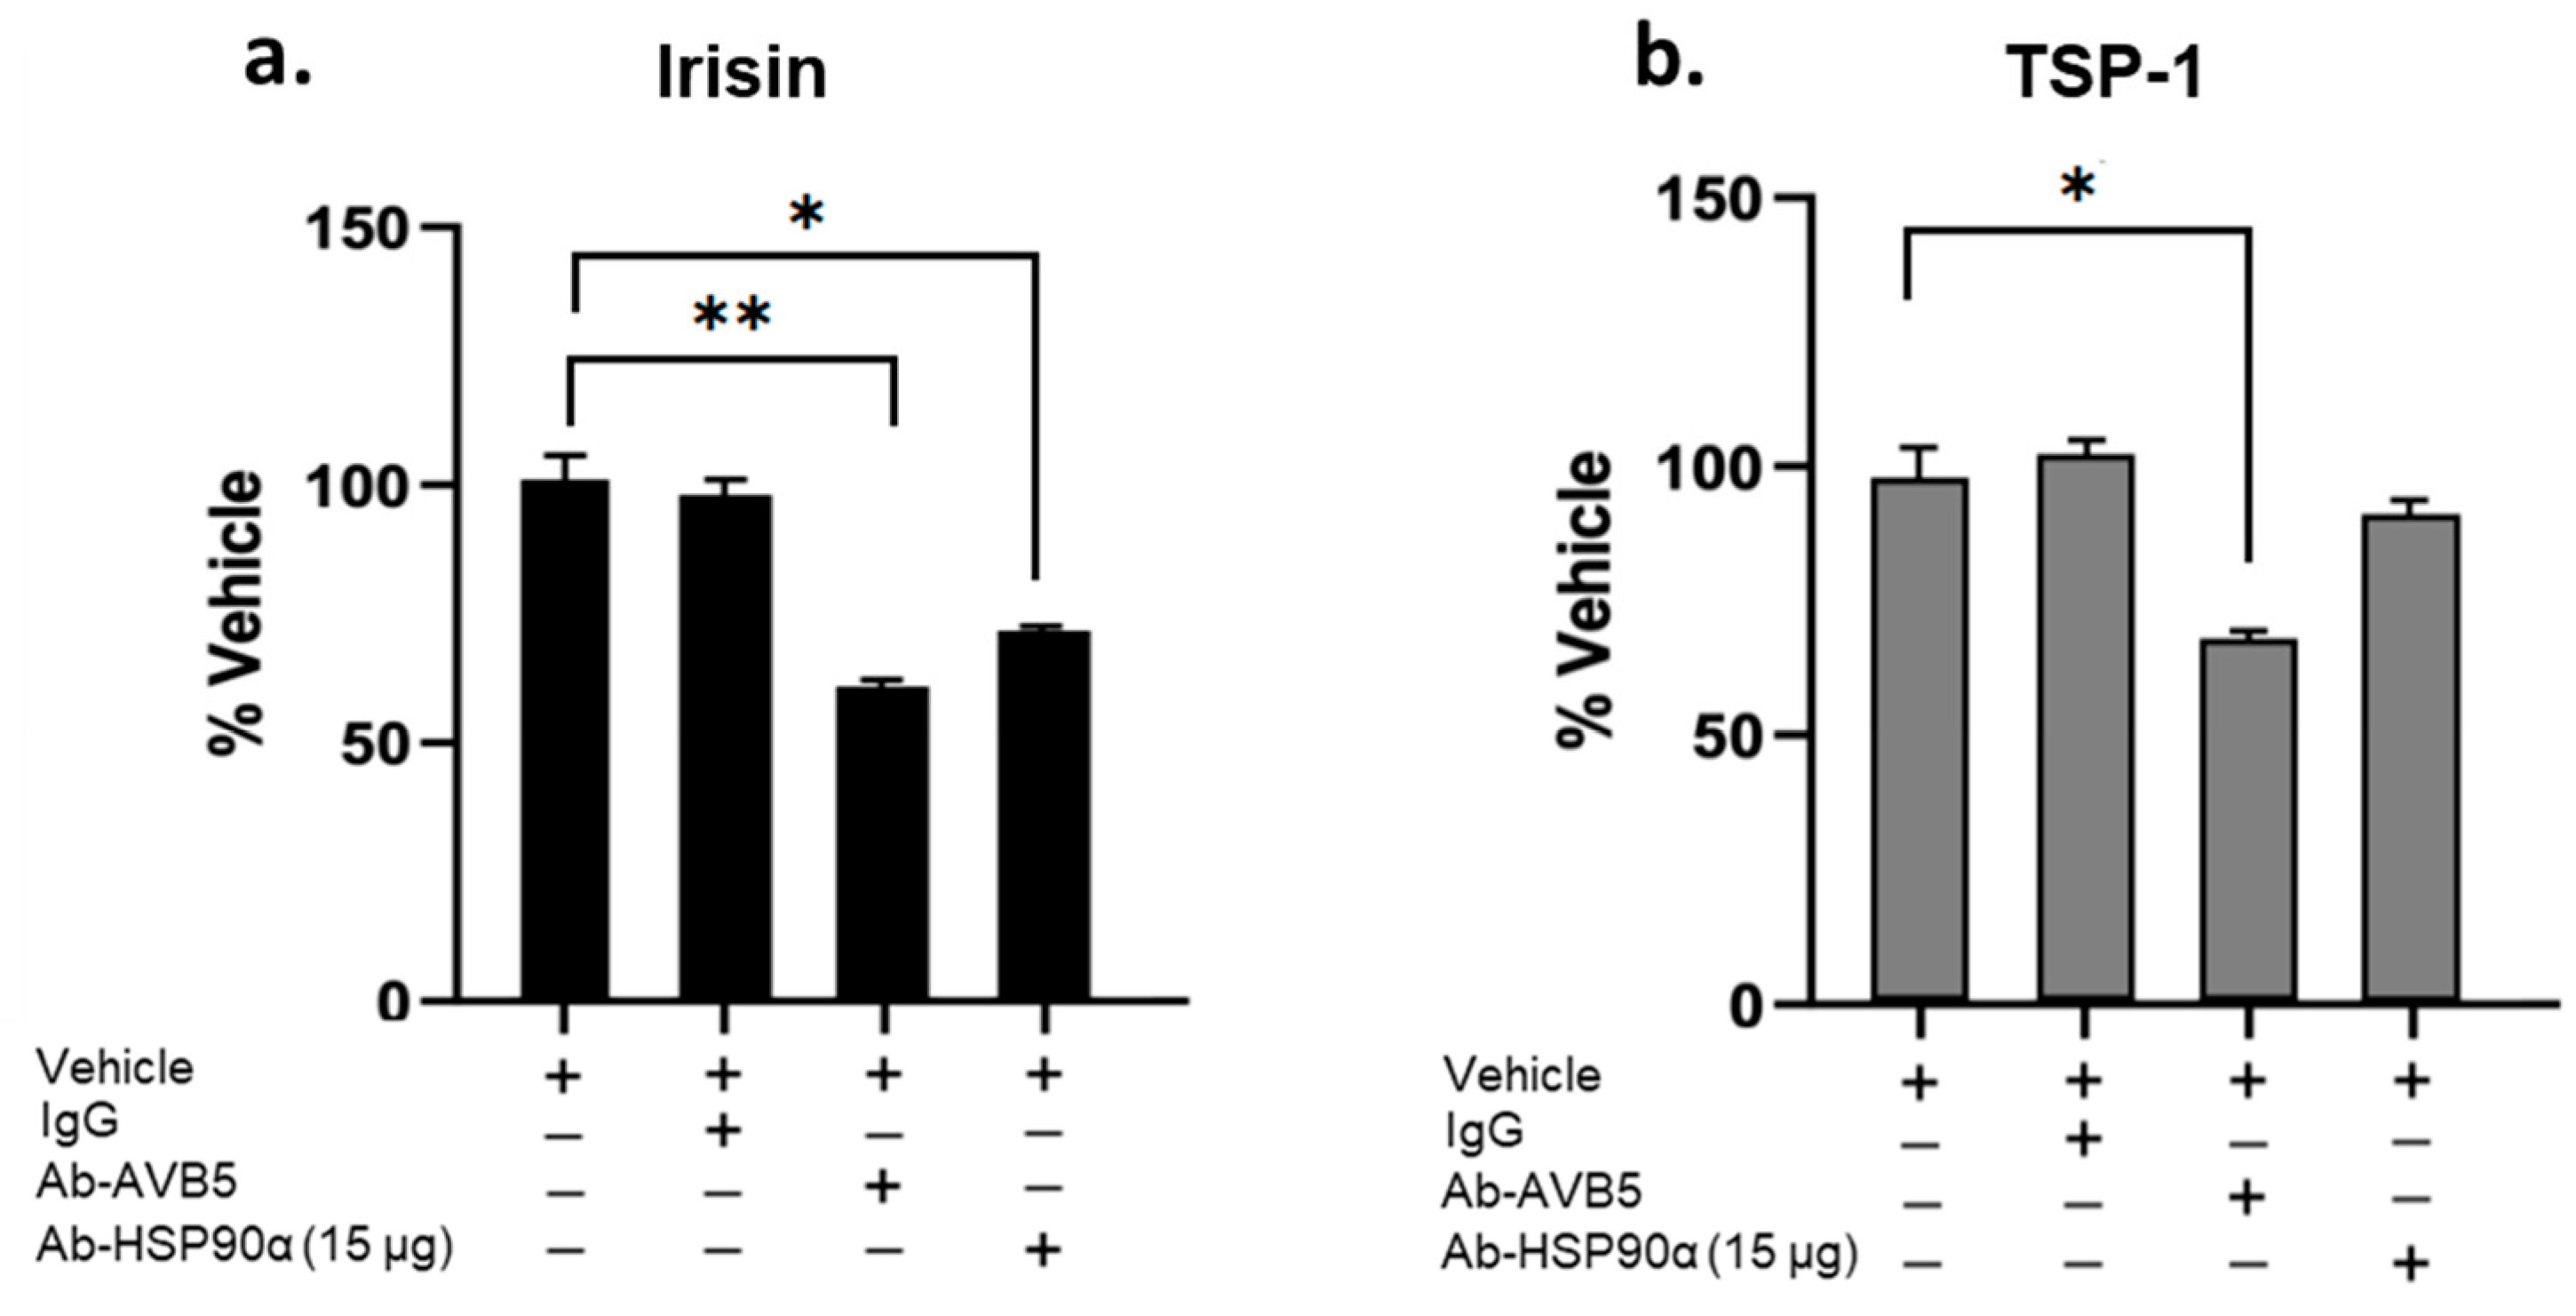
Mechanistically, this apparent disconnect between circulating irisin levels and functional signaling is explained by the antagonistic interaction between irisin and TSP-1 at the cell surface. CDS analyses demonstrate that TSP-1 inhibits irisin-induced signaling in a concentration-dependent manner within a context sensitive to αvβ5 blockade and HSP90α inhibition. In contrast, irisin signaling requires both αvβ5 engagement and the availability of HSP90α, consistent with the role of extracellular HSP90α in supporting receptor-mediated metabolic signaling [
19]. Notably, TSP-1 retains its inhibitory activity even when these regulatory components are disrupted, highlighting its signaling dominance. In line with these mechanistic findings, increases in circulating TSP-1 were associated with disease burden rather than diagnostic status, although overall TSP-1 levels were comparable between ME patients and healthy controls, individuals with more severe fatigue exhibited significantly elevated levels of this antagonist. This imbalance is consistent with chronic platelet and endothelial activation reported in ME [
26], where elevated matricellular proteins contribute to a pro-inflammatory milieu that suppresses adaptive metabolic responses [
27]. Importantly, neutralization of HSP90α abolishes irisin’s ability to counteract TSP-1, effectively eliminating its protective effects and locking cells into a state of metabolic inactivity, as previously described in PEM models [
7,
28]. Together, these results support a model in which increasing disease severity is associated with a shift toward signaling resistance, in which elevated TSP-1 functionally overrides compensatory increases in irisin. In addition to TSP-1–mediated antagonism, emerging evidence suggests that alterations in the extracellular receptor landscape may further contribute to this state of signaling resistance. Recent work by Moezzi et al. reported elevated circulating levels of soluble low-density lipoprotein receptor-related protein 1 (LRP1/CD91) in a subset of ME patients [
4], consistent with increased receptor shedding and extracellular remodeling. While membrane-bound LRP1 is a known receptor for extracellular HSP90α and participates in receptor-mediated signaling, its soluble form retains ligand-binding capacity and may act as a decoy by sequestering extracellular signaling partners. Although direct interactions between soluble LRP1 and irisin or HSP90α have not yet been demonstrated, increased circulating LRP1 could plausibly alter the availability or spatial organization of signaling complexes at the cell surface. In this context, elevated soluble LRP1 may further destabilize irisin-dependent signaling by perturbing HSP90α-integrin interactions or broader extracellular chaperone networks, thereby reinforcing the shift toward signaling resistance observed in ME.
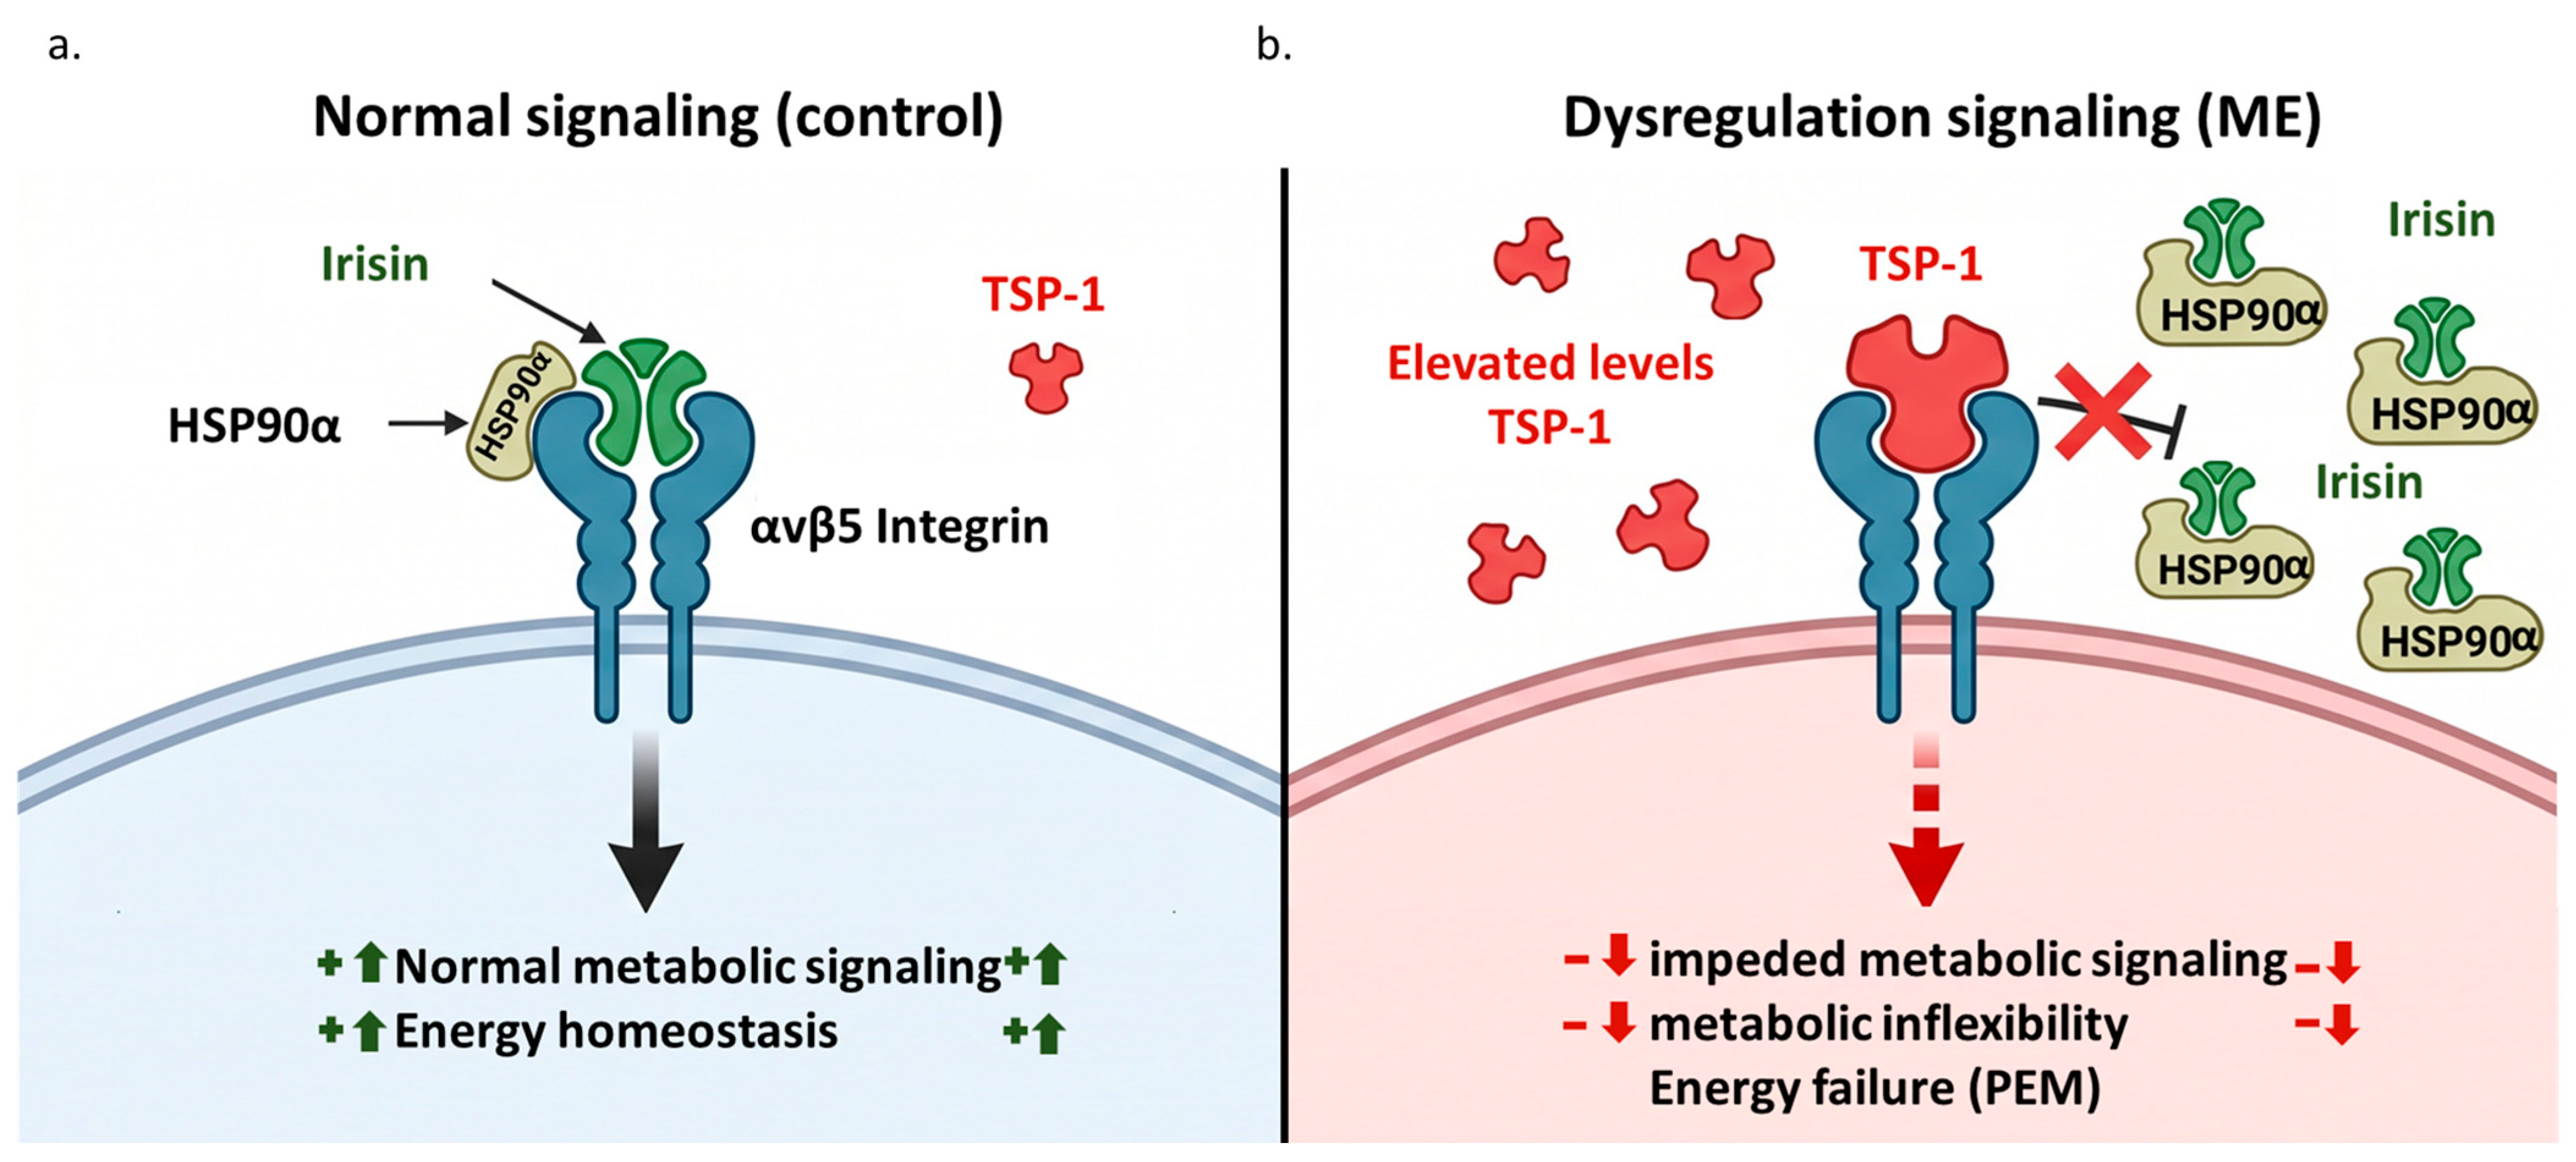
From a broader physiological perspective, the dysregulated irisin–TSP-1 axis may help explain the paradoxical response to exertion observed in ME. Under normal conditions, exercise induces irisin, which supports mitochondrial biogenesis, enhances oxidative phosphorylation, and promotes glucose uptake [
29]. As illustrated in
Figure 6, irisin signaling is proposed to involve mechanisms sensitive to both αvβ5 and HSP90α to support this energy homeostasis. However, our findings suggest that elevated TSP-1, particularly in more severe cases, may disrupt this adaptive response by interfering with irisin signaling at or upstream of the receptor level. This model is consistent with the clinical paradox observed in our cohort, where patients with moderate-to-severe fatigue exhibit higher baseline irisin levels that fail to alleviate symptoms, potentially due to concurrent TSP-1–mediated signaling interference. As a result, cells may exhibit a reduced capacity to adapt efficiently to metabolic stress, leading to decreased bioenergetic flexibility and delayed recovery following exertion. Given the established role of irisin in supporting mitochondrial respiration and metabolic flexibility [
30], persistent TSP-1-mediated inhibition of irisin signaling could potentially contribute to impaired oxidative phosphorylation and altered metabolic adaptability under physiological stress conditions [
31]. Future studies combining Seahorse metabolic flux analyses with modulation of the irisin–TSP-1 axis in PBMCs, skeletal muscle-derived cells, or patient-derived cellular systems will help determine whether this signaling dysregulation contributes to impaired mitochondrial respiration or altered extracellular acidification responses in ME. In addition, TSP-1 impairs NO signaling and vascular function, which may contribute to tissue hypoxia and abnormal perfusion [
32]. These effects likely further aggravate metabolic dysfunction during and after exertion. Importantly, irisin signaling depends on both αvβ5 integrin engagement and HSP90α availability, revealing a key vulnerability in this pathway. Disruption of HSP90α- and αvβ5-sensitive signaling pathways not only weakens essential metabolic signaling but also allows TSP-1 activity to proceed unchecked. This shifts the cellular environment toward a pro-inflammatory and metabolically restrictive state. Together, these mechanisms provide a plausible basis for a state of impaired metabolic adaptability in ME [
22,
33], in which adaptive responses fail to activate despite increased physiological demand, sustaining a cycle of energy deficit and symptom worsening.
From a translational perspective, the irisin–TSP-1 axis represents a promising therapeutic target. Strategies that reduce TSP-1 levels, block its receptor interactions, or restore NO signaling could help relieve this inhibitory molecular brake. At the same time, approaches aimed at stabilizing or enhancing HSP90α-dependent irisin signaling such as small-molecule chaperones or protease inhibitors, may restore metabolic responsiveness to stress. Ultimately, these interventions could help re-establish the link between physical activity and adaptive energy metabolism, improving clinical outcomes and quality of life in ME. In parallel, our findings support the potential use of irisin–TSP-1 profiling as a stratification tool to identify metabolic endophenotypes in ME, thereby guiding precision medicine approaches and patient-tailored therapeutic strategies.
This study has several strengths. The integration of clinical phenotyping with real-time functional assays provides a dynamic understanding of disease mechanisms beyond static biomarker measurements. The use of CDS enabled direct characterization of ligand–receptor interactions, revealing a dynamic antagonism between irisin and TSP-1. In addition, the study is based on a well-characterized cohort diagnosed according to the Canadian Consensus Criteria, ensuring clinical relevance to hallmark features such as PEM. The inclusion of a standardized mechanical stress challenge further enabled the identification of impaired irisin responsiveness under physiologically relevant conditions. Importantly, multivariable regression analyses and appropriate statistical corrections for multiple testing strengthened the robustness of the findings by demonstrating that the association between irisin and fatigue severity is independent of key confounding variables. Furthermore, sex-stratified analyses revealed biologically relevant differences in the relationship between irisin signaling and symptom severity, highlighting potential sex-specific mechanisms in ME. However, several limitations should be acknowledged. In particular, the relatively small number of male participants limits the ability to formally assess sex-specific interaction effects. Future studies involving larger and more sex-balanced cohorts will, therefore, be important to better define the relationship between sex, irisin signaling, symptom severity, and metabolic dysfunction in ME. The cross-sectional design limits causal inference regarding the relationship between circulating irisin levels and disease progression. While Jurkat cells provide a controlled model for studying receptor-level interactions, they may not fully recapitulate the tissue-specific complexity of skeletal muscle, vascular endothelium, or central nervous system signaling in ME. Additionally, although the entire cohort was assessed at baseline, only a subset completed the mechanical stress challenge, which may limit the generalizability of the findings on exertional responses. Furthermore, the precise structural mechanisms underlying TSP-1 interference with the irisin–αvβ5–HSP90α complex remain to be elucidated. In addition, the present study did not evaluate upstream transcriptional regulators of FNDC5/irisin expression, including PGC1α, PPARα, or PPARγ, nor did it assess potential epigenetic regulation of the FNDC5 locus. Future studies integrating transcriptional, proteomic, and epigenetic approaches, including ChIP-based analyses, will be important to determine whether altered upstream regulatory mechanisms contribute to impaired irisin biology in ME. Such studies will also help clarify whether the observed dysregulation reflects altered gene expression, defective metabolic adaptation, or downstream signaling resistance mechanisms. Future studies incorporating longitudinal designs, primary human cell systems, and multi-omics approaches will be essential to validate these findings and further define the therapeutic potential of targeting the irisin–TSP-1 axis.
4. Materials and Methods
4.1. Study Population and Clinical Characterization
This study was designed as a cross-sectional analysis to investigate the molecular interplay between irisin and TSP-1 in the pathophysiology of ME. A total of 136 participants were recruited, comprising 92 ME patients and 44 sedentary HCs. All ME patients were diagnosed according to the CCC, which emphasizes the presence of hallmark symptoms such as PEM, persistent fatigue, cognitive dysfunction, and sleep disturbances [
34]. HCs were sedentary individuals with no history of chronic fatigue or related disorders, matched to the ME cohort for age, sex, and BMI to ensure comparability. Written informed consent was obtained from all participants, and all procedures were approved by the Institutional Review Board of CHU Sainte-Justine (Comité D’Éthique du CHU Sainte-Justine, Project #4047). All experiments were performed in accordance with relevant guidelines and human ethics regulations.
Inclusion criteria for ME patients included a confirmed diagnosis according to CCC and an age range of 18 to 75 years. HCs were required to maintain a sedentary lifestyle. They were excluded if they reported any chronic conditions with symptoms resembling ME or a family history of ME or related conditions like fibromyalgia. Participants in both groups were excluded if they were pregnant or breastfeeding at the time of the study. Detailed clinical histories, including medication use, comorbidities, and prior medical conditions, were systematically collected by trained nursing staff at the time of the clinical visit using standardized questionnaires. Reported comorbidities within the ME cohort included cardiovascular/autonomic, endocrine/metabolic, gastrointestinal/hepatic, respiratory/allergic, neurological/neuropsychiatric, and autoimmune/inflammatory disorders, including fibromyalgia. Medication exposure included antihypertensive agents, corticosteroids, hormone-related therapies, antidepressants, gastrointestinal medications, analgesics, gabapentinoids, vitamin supplementation, and sleep-related medications. Because several of these medication classes have previously been associated with modulation of inflammatory, vascular, metabolic, or fibrotic pathways related to TSP-1 biology, subgroup analyses were performed to evaluate their potential influence on circulating TSP-1 levels. Furthermore, the study utilized a repeated-measures within-subject design based on a standardized physiological provocation maneuver with paired baseline and post-stress sampling. This approach minimizes the influence of stable inter-individual confounding variables, including illness duration, baseline physiological variability, and polypharmacy.
Clinical assessments were conducted using validated questionnaires to quantify symptom burden and functional status. SF-36 was used to evaluate physical and mental health components, while DSQ captured specific symptoms, including PEM, sleep disturbances, autonomic dysfunction, and cognitive impairments. Weekly physical activity levels were estimated by asking participants to report the number of hours spent in physical activity during the preceding week, using DSQ question 89.
Disease severity within the ME cohort was rigorously evaluated and stratified using the MFI-20, which measures dimensions of fatigue, including general fatigue, physical fatigue, reduced activity, reduced motivation, and mental fatigue [
2,
35]. For the purpose of level stratification, patients were categorized based on their total MFI-20 scores: 51–75 indicated mild fatigue, and 76–100 indicated moderate-to-severe fatigue. Additionally, the severity of PEM was specifically quantified using the validated DSQ-PEM subscale [
1]. This multi-tiered assessment enabled correlation of circulating markers with both the subjective intensity of fatigue and the hallmark physiological response to exertion characteristic of the disease.
4.2. Post-Exertional Stress Challenge and Mechanical Stimulation Protocol
To evaluate the dynamic physiological response to exertion, a subset of the recruited cohort underwent a standardized 90 min mechanical stimulation protocol designed to mimic the physiological stress of physical activity [
1]. While baseline venous blood samples were collected from the entire study population (92 ME patients and 44 HCs), the longitudinal post-exertional stress challenge and subsequent blood collection at T90 were completed by 52 ME patients and 31 HCs. This standardized protocol involved applying intermittent pneumatic compression to the upper arm with a device calibrated to deliver cyclic pressure variations (frequency: 0.006 Hz; pressure range: 0–4 psi). This specific frequency and pressure were selected to stimulate hemodynamic and vascular responses that partially recapitulate the physiological effects of physical exertion. Importantly, this model was designed to reproduce key circulatory and mechanotransductive components of exercise while minimizing confounding factors such as systemic metabolic exhaustion, excessive cardiovascular strain, and variability in physical performance. This approach is particularly relevant in ME populations, where conventional exercise testing may exacerbate symptoms and introduce significant inter-individual variability. Moreover, the use of a low-burden, non-exertional stimulation paradigm facilitates participation of patients with higher symptom severity who may otherwise be underrepresented in exercise-based studies.
4.3. Blood Collection and Plasma Preparation
Blood samples were collected in EDTA-coated tubes at both baseline (T0) and immediately after the application of the stress test (T90). This longitudinal design enabled precise calculation of the delta irisin (∆T90–T0), representing the absolute change in circulating irisin concentration and serving as a primary indicator of the systemic capacity to modulate myokine signaling under stress. Immediately following collection, samples were centrifuged at 216× g for 10 min at room temperature to separate the plasma fraction. Plasma aliquots were harvested and stored at −80 °C to preserve molecular stability until the time of determination. Following the initial plasma separation step, samples underwent an additional centrifugation at 10,000× g for 10 min at 4 °C prior to TSP-1 ELISA quantification, in accordance with the manufacturer’s recommendations, to minimize residual platelet contamination and cellular debris.
4.4. Quantification of Circulating Irisin and TSP-1
Circulating levels of irisin and TSP-1 were quantified in plasma samples using commercially available enzyme-linked immunosorbent assay (ELISA) kits according to the manufacturers’ instructions. Plasma irisin was measured using the Human irisin ELISA kit (MyBioSource, San Diego, CA, USA), while plasma TSP-1 levels were determined using the Quantikine sandwich ELISA immunoassay (R&D Systems, Minneapolis, MN, USA). All assays were performed in duplicate to ensure analytical reproducibility. Plasma samples were diluted to the desired concentration (typically 1:10 for irisin and 1:100 for TSP-1) to ensure that measured values fell within the linear range of the standard curve. Optical density (OD) was measured at 450 nm using a DTX880 Multimode Detector (Beckman Coulter, Brea, CA, USA). Absolute concentrations of irisin (µg/mL) and TSP-1 (ng/mL) were determined by interpolating OD values against standard curves generated using a four-parameter logistic (4-PL) regression model. All plasma samples were processed under standardized conditions and stored at −80 °C until analysis. Samples were aliquoted immediately after processing to minimize repeated freeze–thaw cycles, and all biomarker measurements were performed using first-thaw aliquots whenever possible. Duplicate measurements were performed for all samples, and only values within the linear range of the standard curves were included in the analysis. According to the manufacturers’ specifications, the intra-assay and inter-assay coefficients of variation were <10% and <12%, respectively, for both ELISAs.
4.5. Functional Signaling Analysis via Cellular Dielectric Spectroscopy (CDS)
Functional molecular interactions and receptor dynamics were assessed using a label-free, real-time microfluidic bioimpedance platform (CellKey™, MDS Sciex, San Francisco, CA, USA), as previously described [
33]. Jurkat cells (human immortalized T lymphocytes) were selected as the cellular model due to their well-characterized signaling responses and their suitability for real-time bioimpedance-based analysis of receptor-mediated signaling dynamics. While this model enables controlled interrogation of ligand–receptor interactions, it may not fully recapitulate the tissue-specific complexity of skeletal muscle, vascular, or neuronal systems relevant to ME. Cells were cultured in RPMI-1640 medium (Wisent, Saint-Bruno, QC, Canada) supplemented with 10% fetal bovine serum (FBS), 1% penicillin–streptomycin, and 1% L-glutamine (Thermo Fisher Scientific, Waltham, MA, USA). Cell density and viability were assessed prior to each experiment using a CytoSmart cell counter (Corning Inc., Corning, NY, USA), with a minimum viability threshold of 80%.
CellKey™ 96-well microplates were preconditioned with 5 µL of unsupplemented RPMI and centrifuged at 216× g for 3 min to ensure uniform liquid distribution. Cells were seeded at a density of 2.5 × 10⁴ cells per well and incubated overnight at 37 °C in a humidified atmosphere containing 5% CO2. For dose–response analyses, cells were stimulated with recombinant human irisin (MyBioSource) or recombinant TSP-1 (R&D Systems) across a concentration range of 10−9 to 10−5 M. To assess reciprocal antagonism and signaling crosstalk, co-treatment experiments were performed in which cells were pretreated with one ligand (e.g., 10−6 M TSP-1) for 30 min prior to stimulation with the second ligand (e.g., 10−6 M irisin). To evaluate pathway specificity, cells were pre-incubated for 60 min with neutralizing antibodies targeting either HSP90α or αvβ5 integrin (Thermo Fisher Scientific; R&D Systems) before ligand stimulation. Isotype-matched IgG antibodies were used as negative controls to account for non-specific antibody effects. Vehicle-treated cells (culture medium alone) were included as baseline controls, and all responses were normalized to vehicle conditions. Receptor specificity was further supported by the selective attenuation of irisin-induced responses following αvβ5 or HSP90α blockade, while TSP-1 responses remained comparatively less affected under the same conditions. Real-time changes in bioimpedance, reflecting integrated cellular responses, were recorded for 15 min post-stimulation. Data were analyzed in kinetic mode, normalized to untreated controls, and expressed as a percentage of the maximal response to enable standardized comparisons across conditions. All experiments were conducted in triplicate to ensure reproducibility and analytical robustness.
4.6. Statistical Analysis
All statistical analyses were performed using GraphPad Prism (v9.0, GraphPad Software, La Jolla, CA, USA). Data normality was assessed using the Shapiro–Wilk test. Normality testing was performed separately for subgroup analyses prior to the application of parametric statistical tests, and non-parametric alternatives were considered when distribution assumptions were not met. Homogeneity of variance between groups was also evaluated prior to applying parametric independent t-tests and ANOVA analyses. Continuous variables are presented as mean ± standard error of the mean (SEM) for normally distributed data, or as median with interquartile range (IQR) for non-normally distributed data. Between-group comparisons of circulating molecular markers (ME vs. healthy controls) were conducted using unpaired two-tailed Student’s t-tests. Within-group longitudinal changes in irisin levels during the mechanical stress challenge (baseline T0 vs. post-stress T90) were assessed using paired two-tailed t-tests. The exertional response was further quantified as Δirisin (T90–T0) and compared between groups using unpaired t-tests. The total MFI-20 score was used as the dependent variable, with baseline irisin, age, sex, BMI, and disease duration included as covariates to assess the independent association between circulating irisin levels and fatigue severity. Only participants with complete datasets for all variables included in the regression model were retained for the final multivariable analysis. Effect sizes for group comparisons were calculated using Cohen’s d. For functional CDS experiments, concentration–response relationships were modeled using nonlinear regression (four-parameter logistic model). Differences between experimental conditions (e.g., vehicle vs. antibody blockade) and interactions between irisin and TSP-1 were evaluated using analysis of variance (ANOVA), followed by Tukey’s post hoc multiple comparisons tests. Associations between circulating irisin levels, symptom severity (DSQ-PEM), and physical activity were assessed using Pearson or Spearman correlation coefficients, as appropriate based on data distribution. To account for multiple testing in correlation analyses, p-values were adjusted using the Benjamini–Hochberg false discovery rate (FDR) correction. For analyses involving multiple comparisons, including correlation analyses and subgroup evaluations, p-values were corrected using the Benjamini–Hochberg procedure to control the false discovery rate. Both raw and FDR-adjusted p-values are reported where applicable. Sex-stratified analyses were conducted as exploratory (post hoc) analyses. Outlier analysis was formally conducted using the ROUT method (Q = 1%); no outliers were identified, and all data points were retained in the final analyses. All statistical tests were two-tailed, and significance was set a priori at p < 0.05. Exact p-values are reported where possible. Statistical significance in figures is denoted as follows: p < 0.05, p < 0.01, p < 0.001, and p < 0.0001.




 ,
,