Article

Fermentation Process Optimization for High 2-Phenylethanol Aroma Whisky

by
Kadireya Tuerxun
,
Zhuoling Ding
,
Xueqing Luo
and
Shishui Zhou
*
School of Biology and Biological Engineering, South China University of Technology, Guangzhou 510006, China
*
Author to whom correspondence should be addressed.
Int. J. Mol. Sci. 2026, 27(11), 4759; https://doi.org/10.3390/ijms27114759
Submission received: 27 March 2026 / Revised: 7 May 2026 / Accepted: 12 May 2026 / Published: 25 May 2026

Abstract

2-Phenylethanol (2-PE) is a key aromatic alcohol contributing to the rose-like odor in brewed wines, primarily synthesized by yeast metabolism with a typical yield of less than 100 mg/L. To enhance the 2-PE content in brewed wines, this study used CRISPR-Cas9 gene editing technology to delete the ARO8 gene (encoding aromatic transaminase I) in Saccharomyces cerevisiae SY. The single-factor experiments were performed to optimize the fermentation process, and the 2-PE content in the brewed wine was measured by high-performance liquid chromatography. The results demonstrated that the 2-PE content in whisky fermented by the SY-A8 was 0.73 g/L, increasing 23.73% compared to SY. The fermentation conditions of SY-A8 were optimized through single-factor experiments and the Box–Behnken design. The optimal conditions were a sugar concentration of 46.30 g/L, a fermentation time of 6 days, and an L-phenylalanine concentration of 1.43 g/L. The high 2-phenylethanol aroma whisky was brewed with a higher 2-phenylethanol content of 3.68 g/L in a 1 L fermenter at the optimal conditions. In conclusion, the modification of Saccharomyces cerevisiae by CRISPR-Cas9 gene editing combined with fermentation process optimization provides an effective technical strategy for improving the 2-PE content in whisky, thereby providing a research perspective for the flavor enhancement of whisky and other brewed wines.

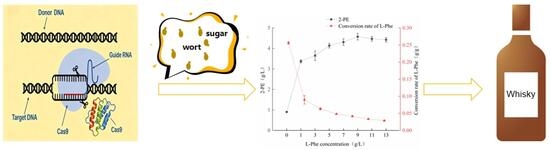
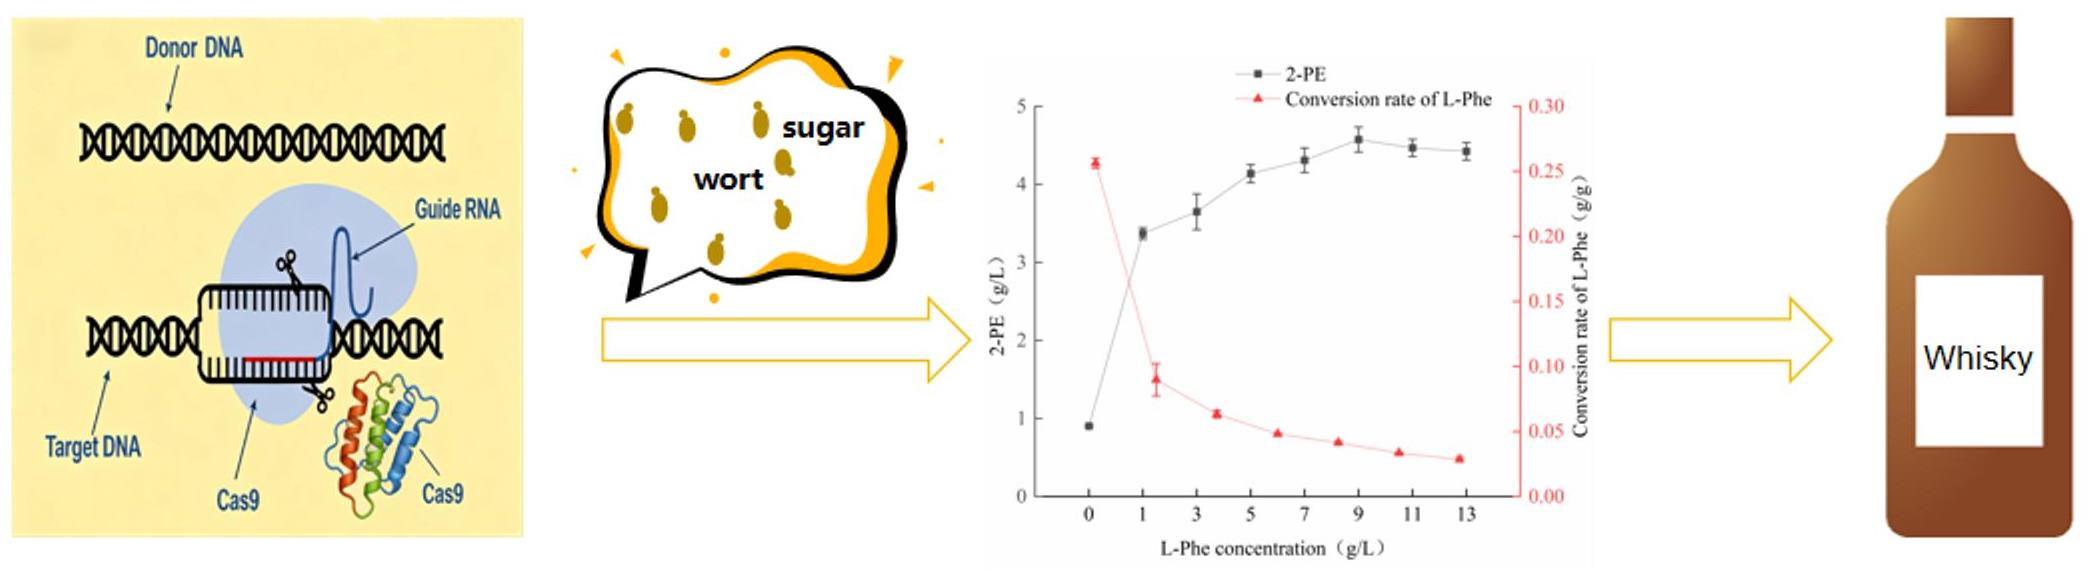
Graphical Abstract

1. Introduction

2-phenylethanol (2-PE) is an aromatic alcohol with a characteristic rose-like odor that commonly exists in the essential oils of various plants, including rose and jasmine [1]. In addition to its role as a natural fragrance, 2-PE exhibits diverse biological activities. Studies have demonstrated that 2-PE possesses significant antimicrobial activity, effectively inhibiting the growth of Gram-negative bacteria, cocci, bacilli, and fungi [2]. 2-PE has been explored as a potential alternative to traditional chemical preservatives, particularly its application in fruit preservation [3]. In the pharmaceutical field, 2-PE serves as a precursor for the synthesis of various drugs, such as phenethyl acetate (a component of neurological medications) and certain cardiovascular agents [2]. In the food industry, 2-PE is widely used as a flavoring agent in beverages, confectionery, baked goods, and dairy products, imparting a rose-like aroma to these products [4]. In the personal care industry, 2-PE is a common fragrance ingredient in perfumes, cosmetics, soaps, and skin care products [4]. Given the broad range of applications described above, the development of efficient and cost-effective strategies for high-yield 2-PE production holds significant scientific value and commercial potential. In fermented beverages, 2-PE is also a key flavor compound in a variety of fermented products, including wine, beer, and bread. So, it is one of the key factors in determining the aromatic quality of brewed wine and fermented foods [5].
As a key aroma compound in brewed wine, 2-PE is highly valued for its rose-like odor [6]. However, its content in fermented beverages is generally low, typically below 0.1 g/L in distilled spirits (50% vol) [7,8]. Whisky, a typical distilled spirit, exhibits similarly low 2-PE content. The fermentation stage critically influences flavor development, as yeast produces a wide range of volatile compounds, including 2-PE, that shape the spirit’s sensory profile [7]. Consequently, enhancing 2-PE synthesis during whisky fermentation is key to improving its aromatic quality [9]. In whisky production, S. cerevisiae is selected as the preferred yeast strain due to its higher ethanol tolerance and better adaptability compared to other yeasts, such as Candida, Kluyveromyces [10,11,12,13]. Owing to these advantages, S. cerevisiae is regarded as a preferred microbial host strain for 2-PE production.
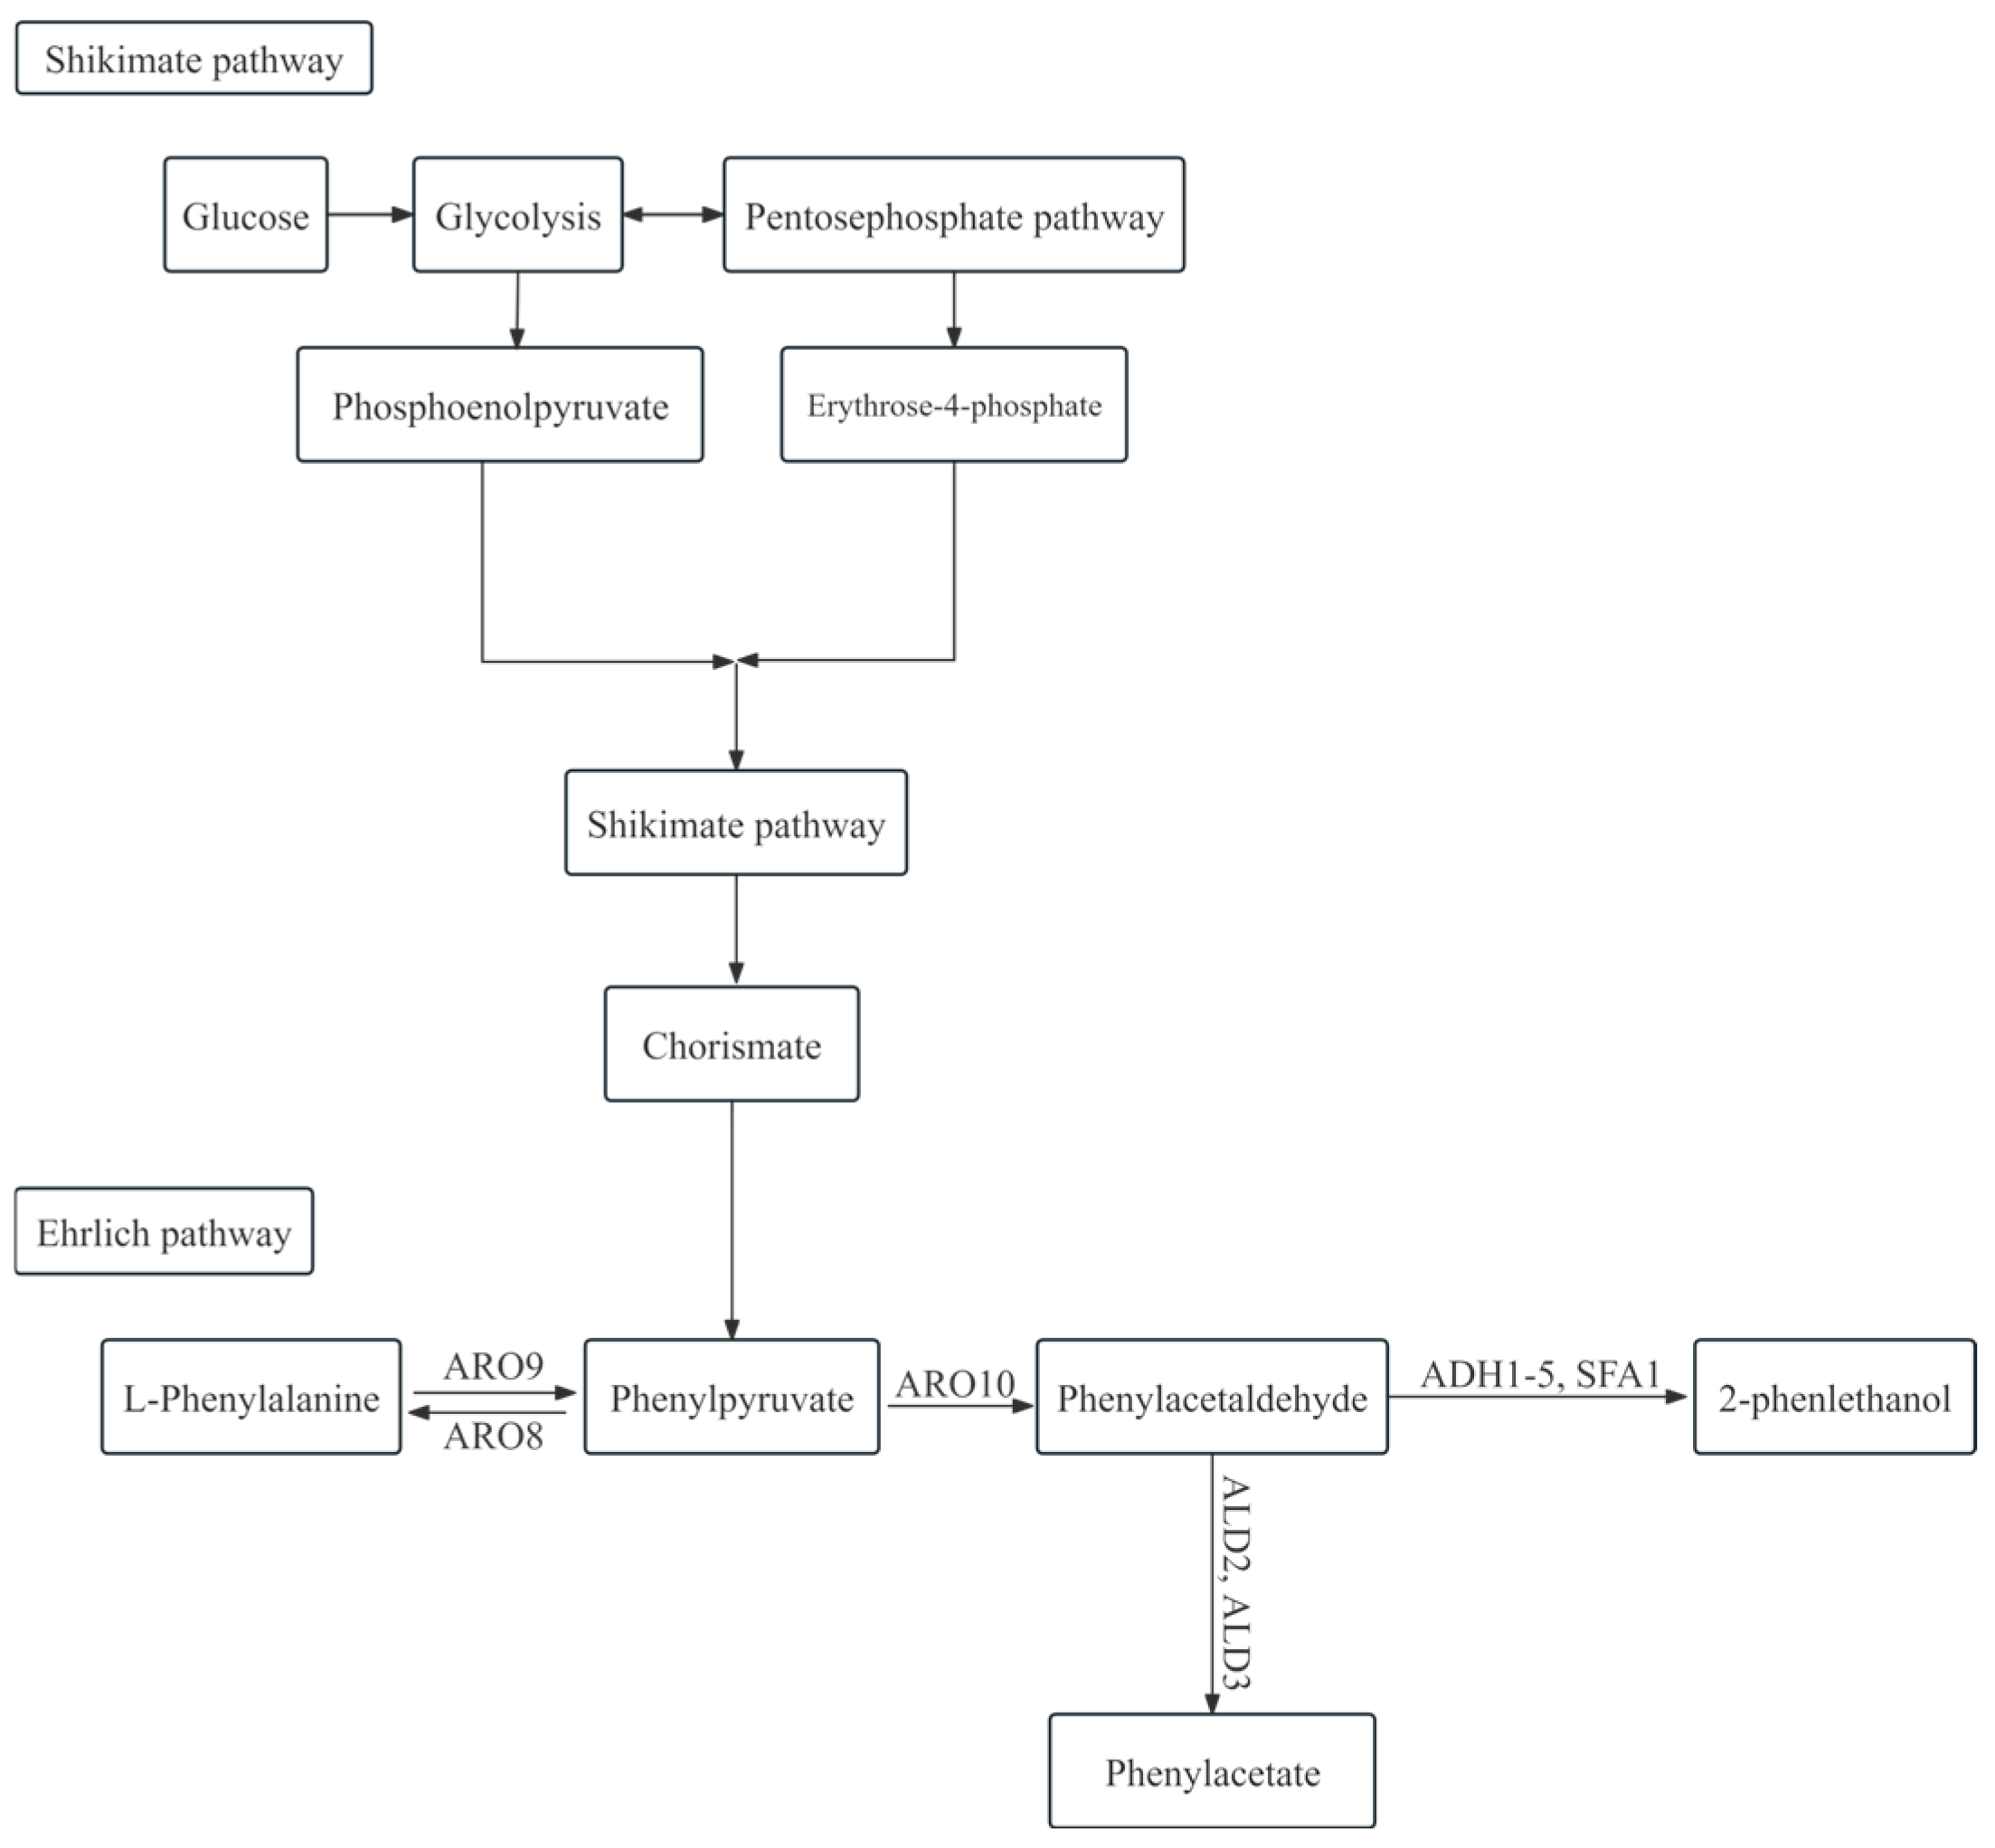
2-PE is primarily synthesized via the shikimate pathway and the Ehrlich pathway in S. cerevisiae [14,15]. In the shikimate pathway, phosphoenolpyruvate (PEP) derived from glycolysis and erythrose 4-phosphate (E4P) derived from the pentose phosphate pathway are initially condensed to form 3-deoxy-D-arabino-heptulosonate-7-phosphate (DAHP). DAHP is then converted to phenylpyruvate through a series of enzymatic steps. Subsequently, phenylpyruvate is converted to 2-PE via decarboxylation and reduction [15,16], as shown in Figure 1. Although the shikimate pathway is widely present in microorganisms, it has low 2-PE yields with a lengthy metabolic route, numerous side branches, and multiple inhibitory effects [17]. In the Ehrlich pathway, L-phenylalanine (L-Phe) is transaminated to phenylpyruvate, then decarboxylated, obtaining phenylacetaldehyde, and finally reduced to 2-PE [4,18]. The research was focused on the Ehrlich pathway of biosynthesizing 2-PE due to its relatively high conversion efficiency and simple metabolic route [19,20].
In the Ehrlich pathway, the conversion of L-Phe to phenylpyruvate, catalyzed by Aro8 and Aro9, is the key step in the biosynthesis of 2-PE. Phenylpyruvate is then converted to phenylacetaldehyde by Aro10 [18,21,22], and phenylacetaldehyde is finally reduced to 2-PE by alcohol dehydrogenases (ADH1, ADH2, ADH3, ADH4, and ADH5) or formaldehyde dehydrogenase (SFA1) [23,24]. Liang et al. [25] demonstrated that overexpression of the ARO10 gene in S. cerevisiae increased 2-PE yield by 16.3% compared to the wild-type strain. Kim et al. [20] constructed an engineered S. cerevisiae by deleting ALD3 and overexpressing ARO9 and ARO10 to ferment 4.8 g/L 2-PE in a medium with 10 g/L L-Phe as the sole nitrogen source. A previous study reported that knockout of the ARO8 gene altered the intracellular amino acid pool, consequently upregulating ARO10 expression and enabling yeast to produce 2-PE in a glucose-based synthetic medium with ammonium sulfate as the sole nitrogen source [26]. Although most studies have focused on genetic improvement of S. cerevisiae for enhancing 2-PE synthesis, their application in distilled liquor has yet to be investigated.
The present study aimed to enhance 2-PE synthesis in S. cerevisiae through genetic improvement and to further increase 2-PE content in brewed wine by optimizing fermentation conditions. The SY-A8 strain with the ARO8 gene deletion was successfully constructed via CRISPR-Cas9 in this study. Subsequently, the fermentation process was optimized to increase 2-PE content in whisky. These findings provide a technical basis for improving the aromatic quality of whisky.

2. Results

2.1. Construction of Recombinant S. cerevisiae Strains

Construction of ARO8 Gene Knockout Strain and PCR Validation

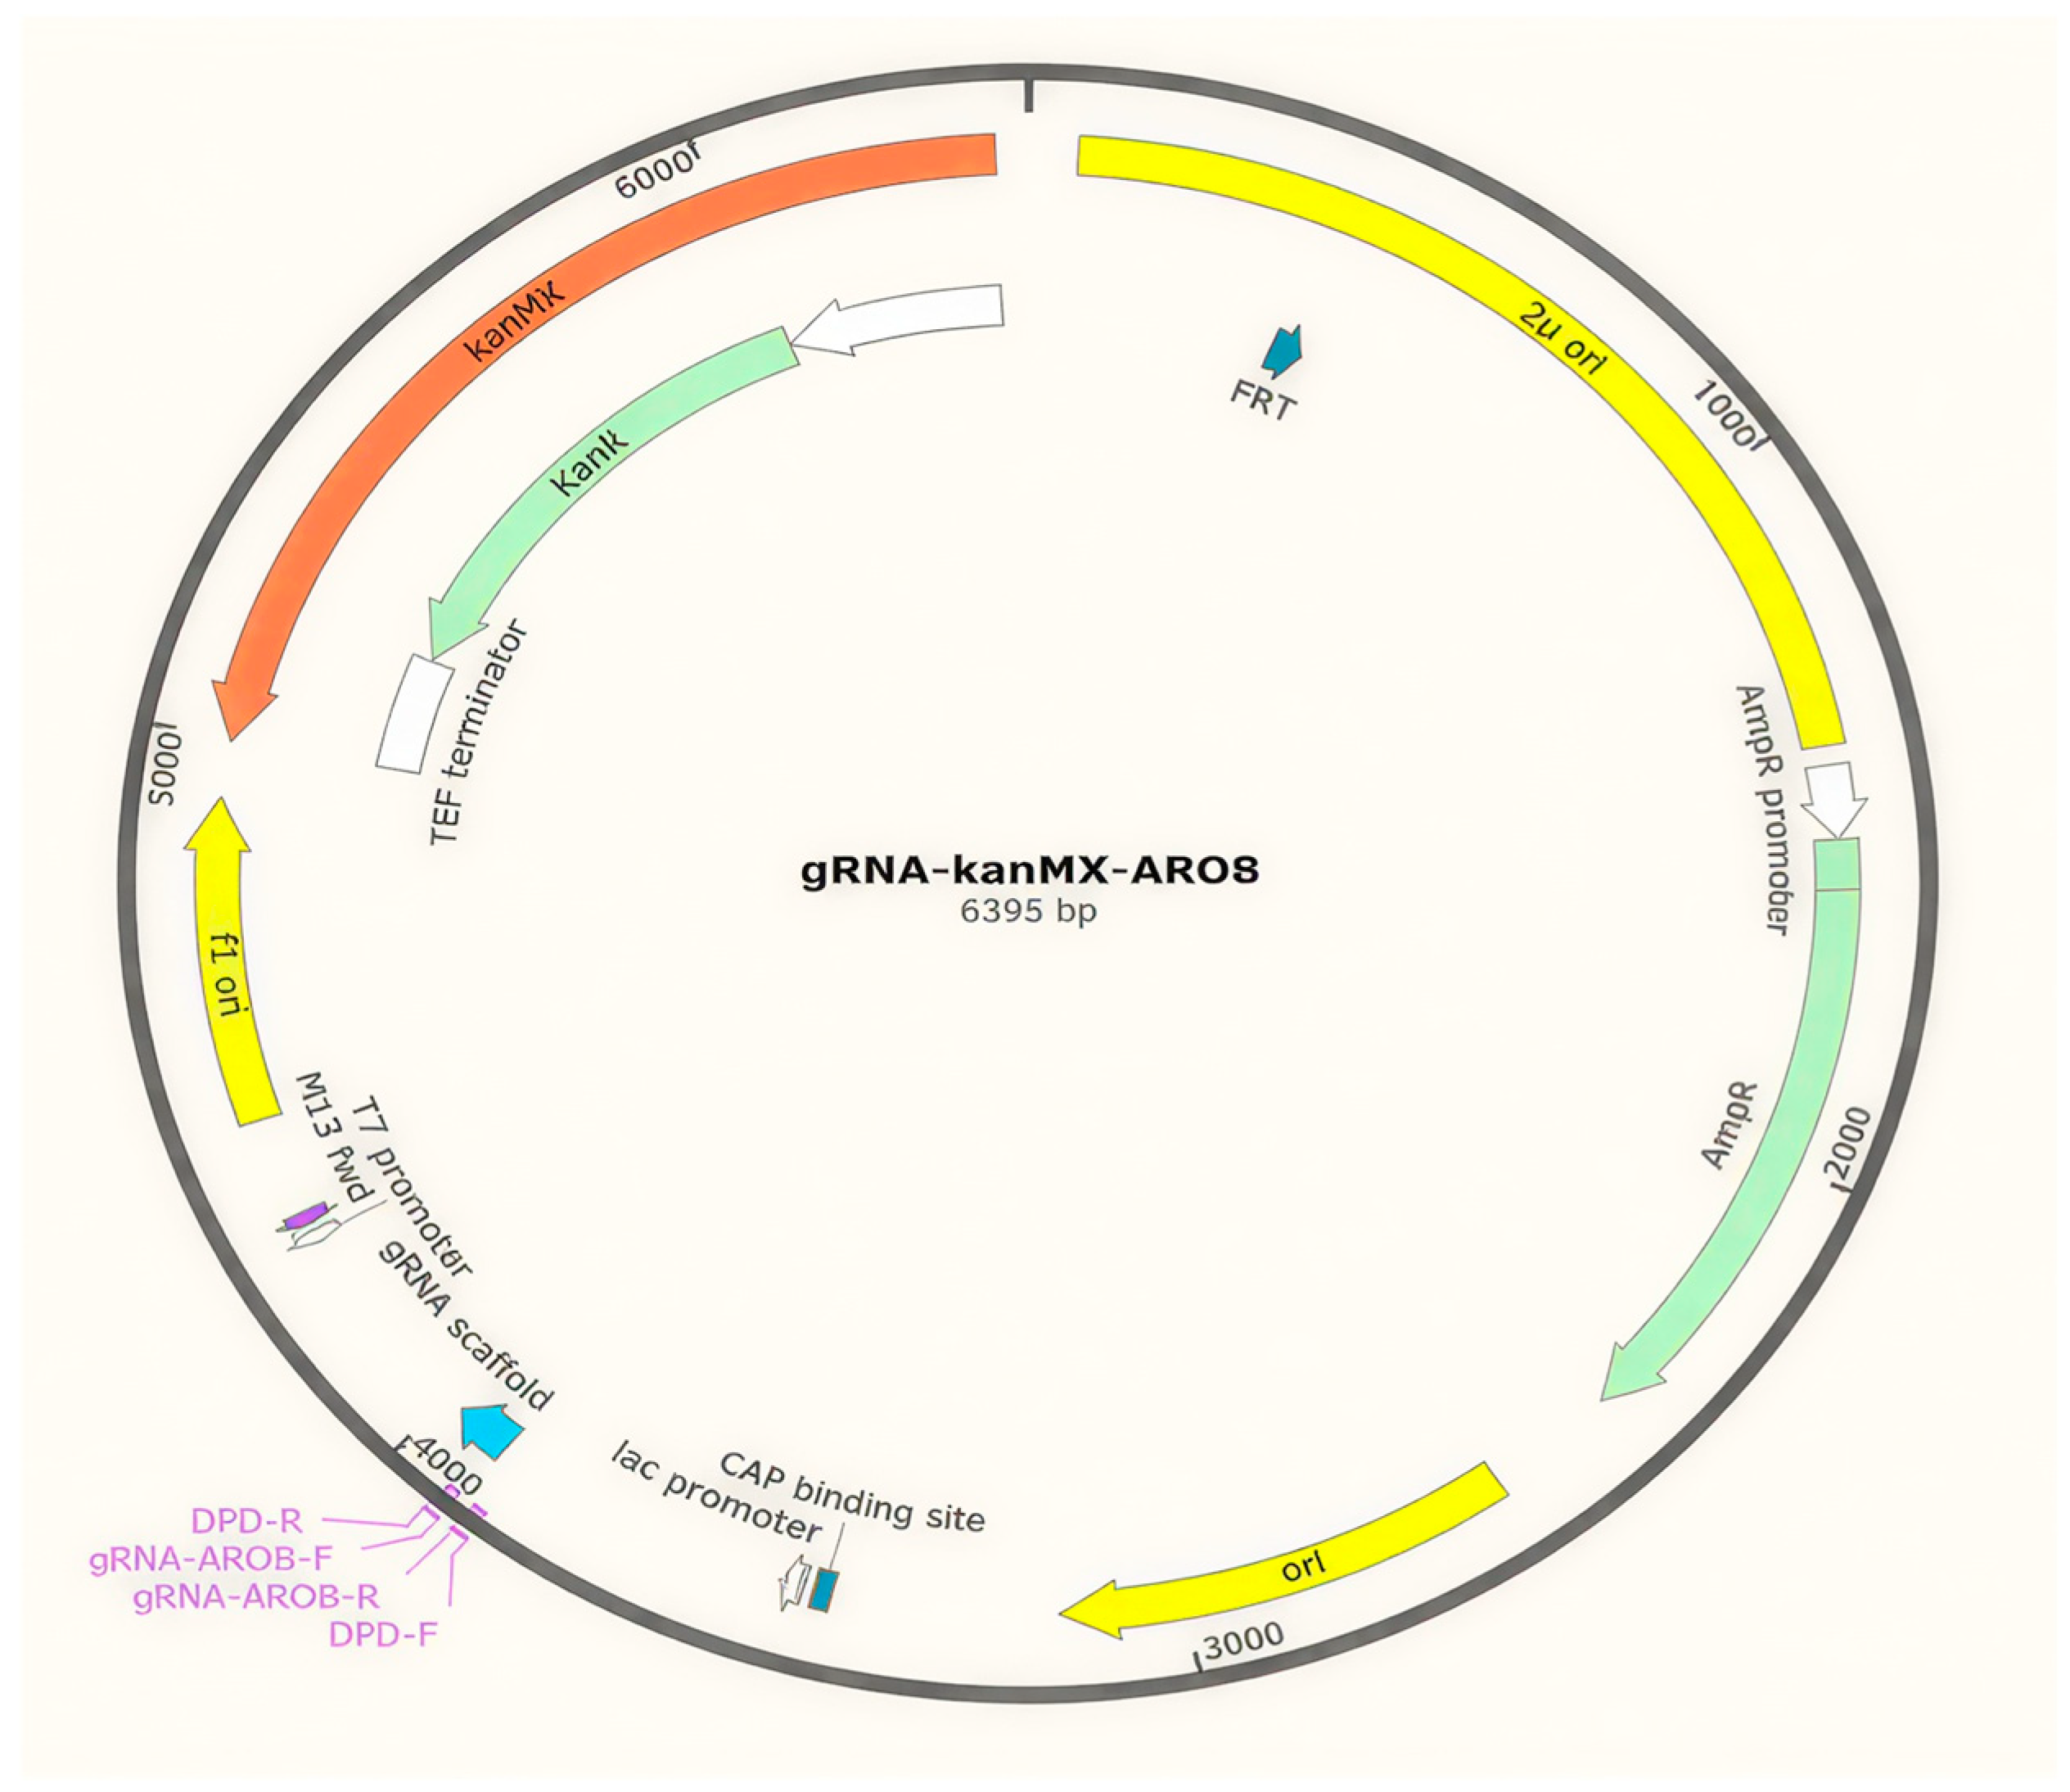
The recombinant plasmid p426-gRNA-ARO8-kanMX (6395 bp) contained the following key components: a pUC-derived origin of replication (ori) for propagation in E. coli; an ampicillin resistance gene (AmpR) for bacterial selection; a kanamycin resistance cassette (kanMX) for selection in S. cerevisiae; the S. cerevisiae SNR52 promoter driving expression of the single guide RNA (sgRNA); a 20-nucleotide guide sequence (5′-CATTGCAGACCATAGAAAGG-3′) targeting the ARO8 gene; the sgRNA scaffold for Cas9 binding; and a terminator sequence for transcriptional termination. The schematic representation of the plasmid is shown in Figure 2.
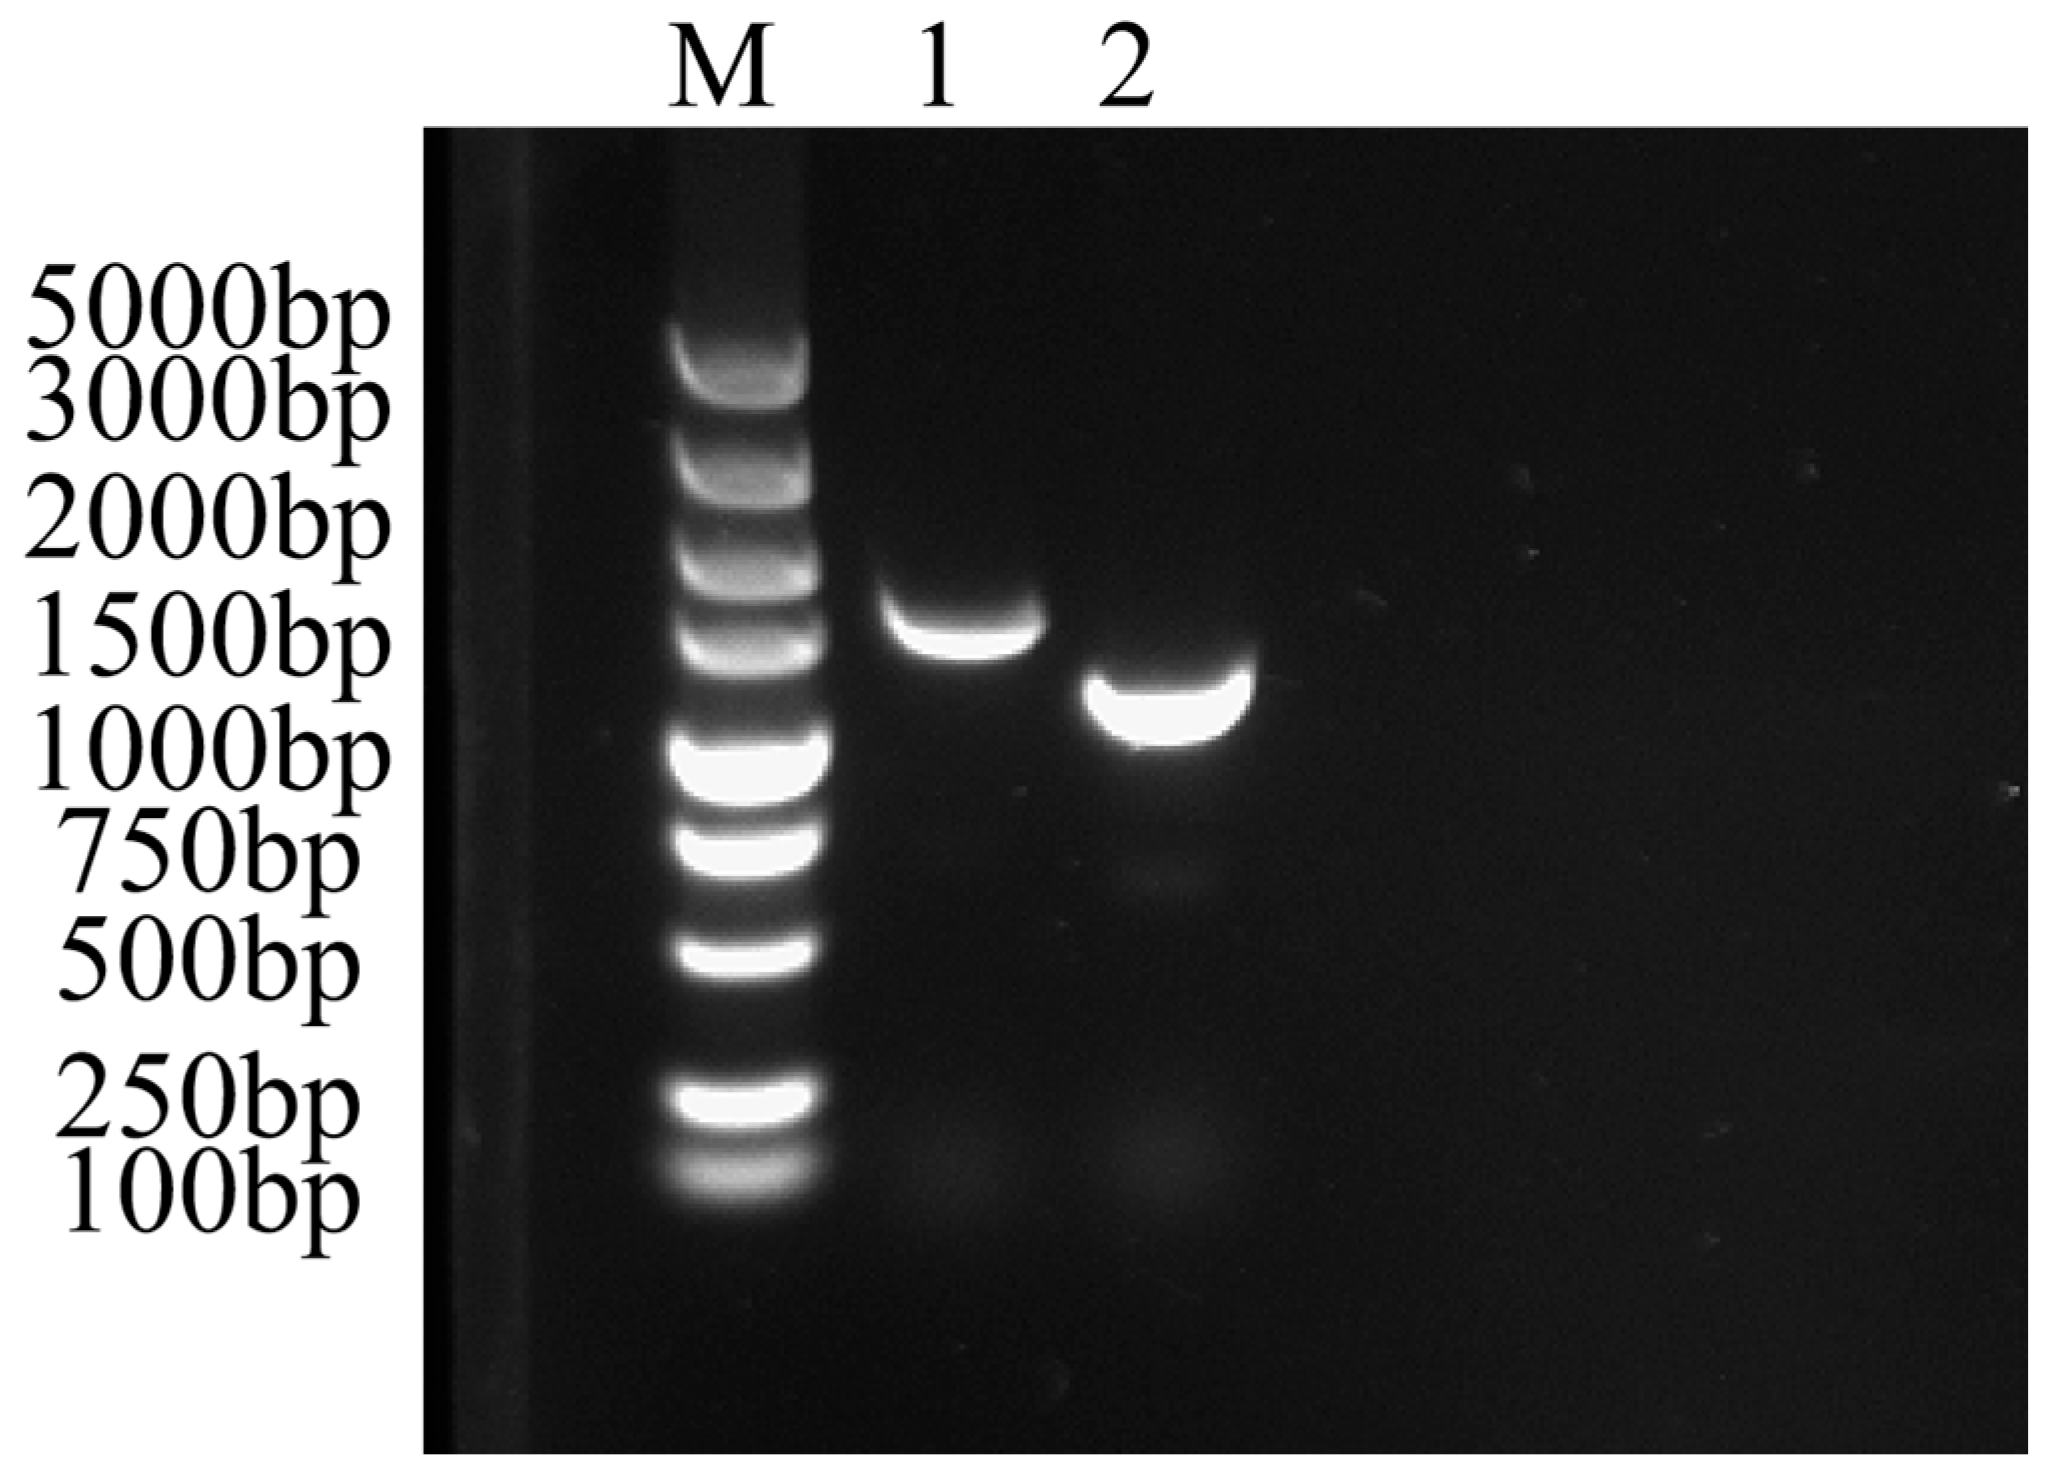
Subsequently, electroporation was performed using the recombinant plasmid and donor DNA. Then, the recombinant strain was validated by PCR with primers ARO8-YZ-F and ARO8-YZ-R, as shown in Figure 3. The ARO8 gene in SY-A8 was successful knockout of the 1130 bp (a 500 bp knockout) compared to 1630 bp (SY).

2.2. Effect of ARO8 Gene Knockout on 2-PE

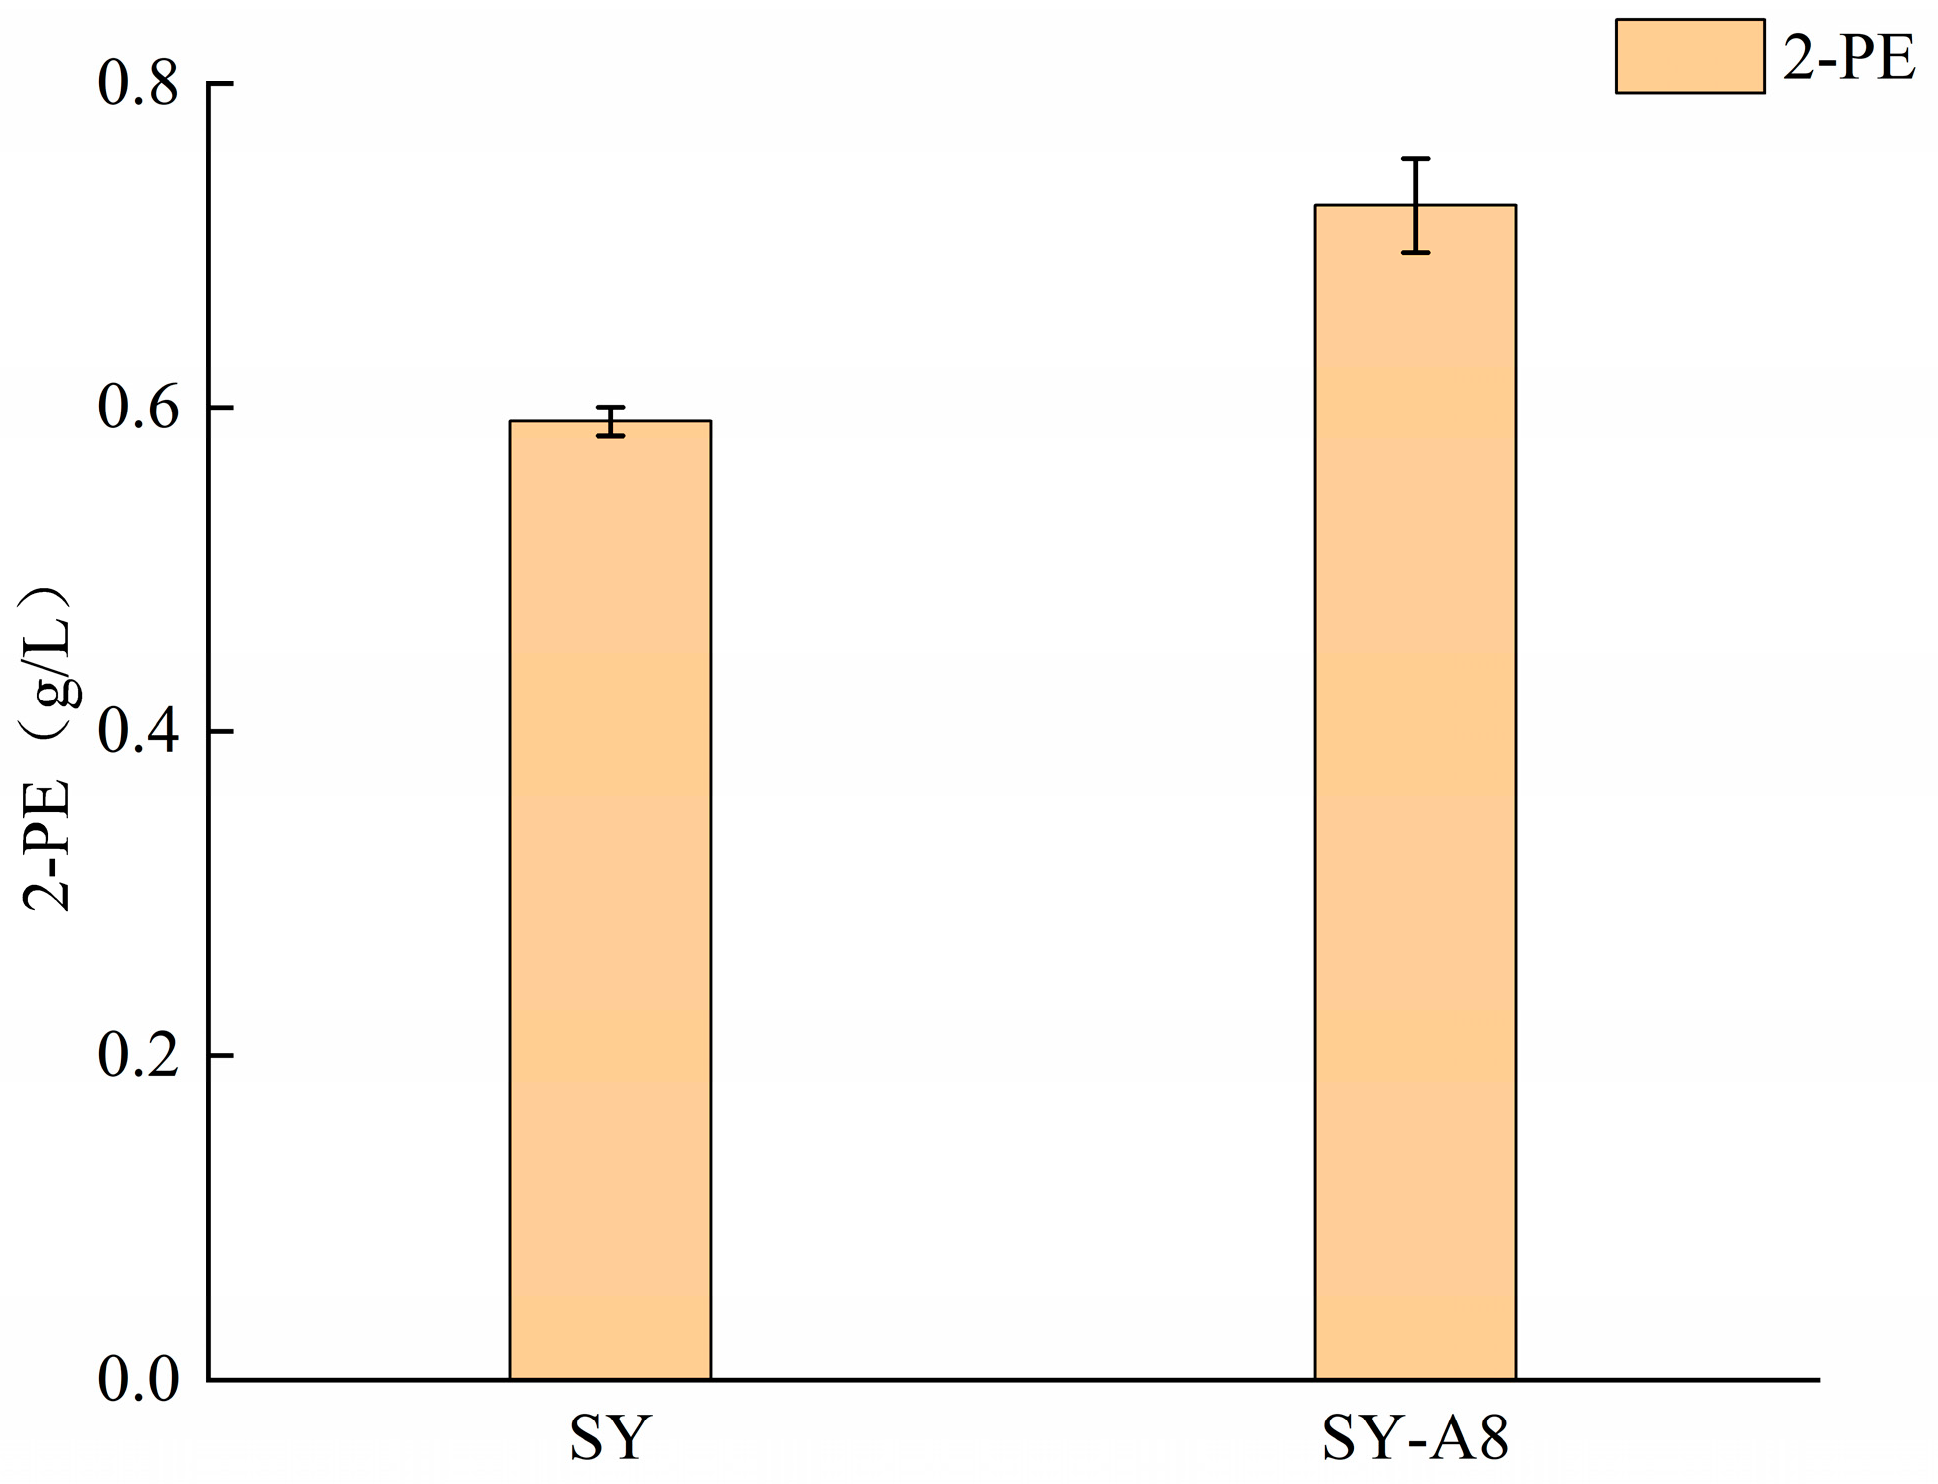
To evaluate the effect of ARO8 knockout on 2-PE production, the content of 2-PE in whisky fermented by the SY and SY-A8 was measured by liquid chromatograph, and the results are shown in Figure 4. The alcohol contents and the corresponding 2-PE contents of whisky fermented by the original strain SY and the recombinant strain SY-A8 are presented in Tables S1 and S2, respectively. The 2-PE content produced by the SY-A8 was 0.73 g/L, an increase of 23.73% compared to the SY (0.59 g/L). The results indicate that the ARO8 knockout strain effectively increased 2-PE content in whisky. Therefore, the recombinant strain SY-A8 can be used as the experimental strain for subsequent fermentation process optimization.

2.3. Relative Expression Levels of ARO8

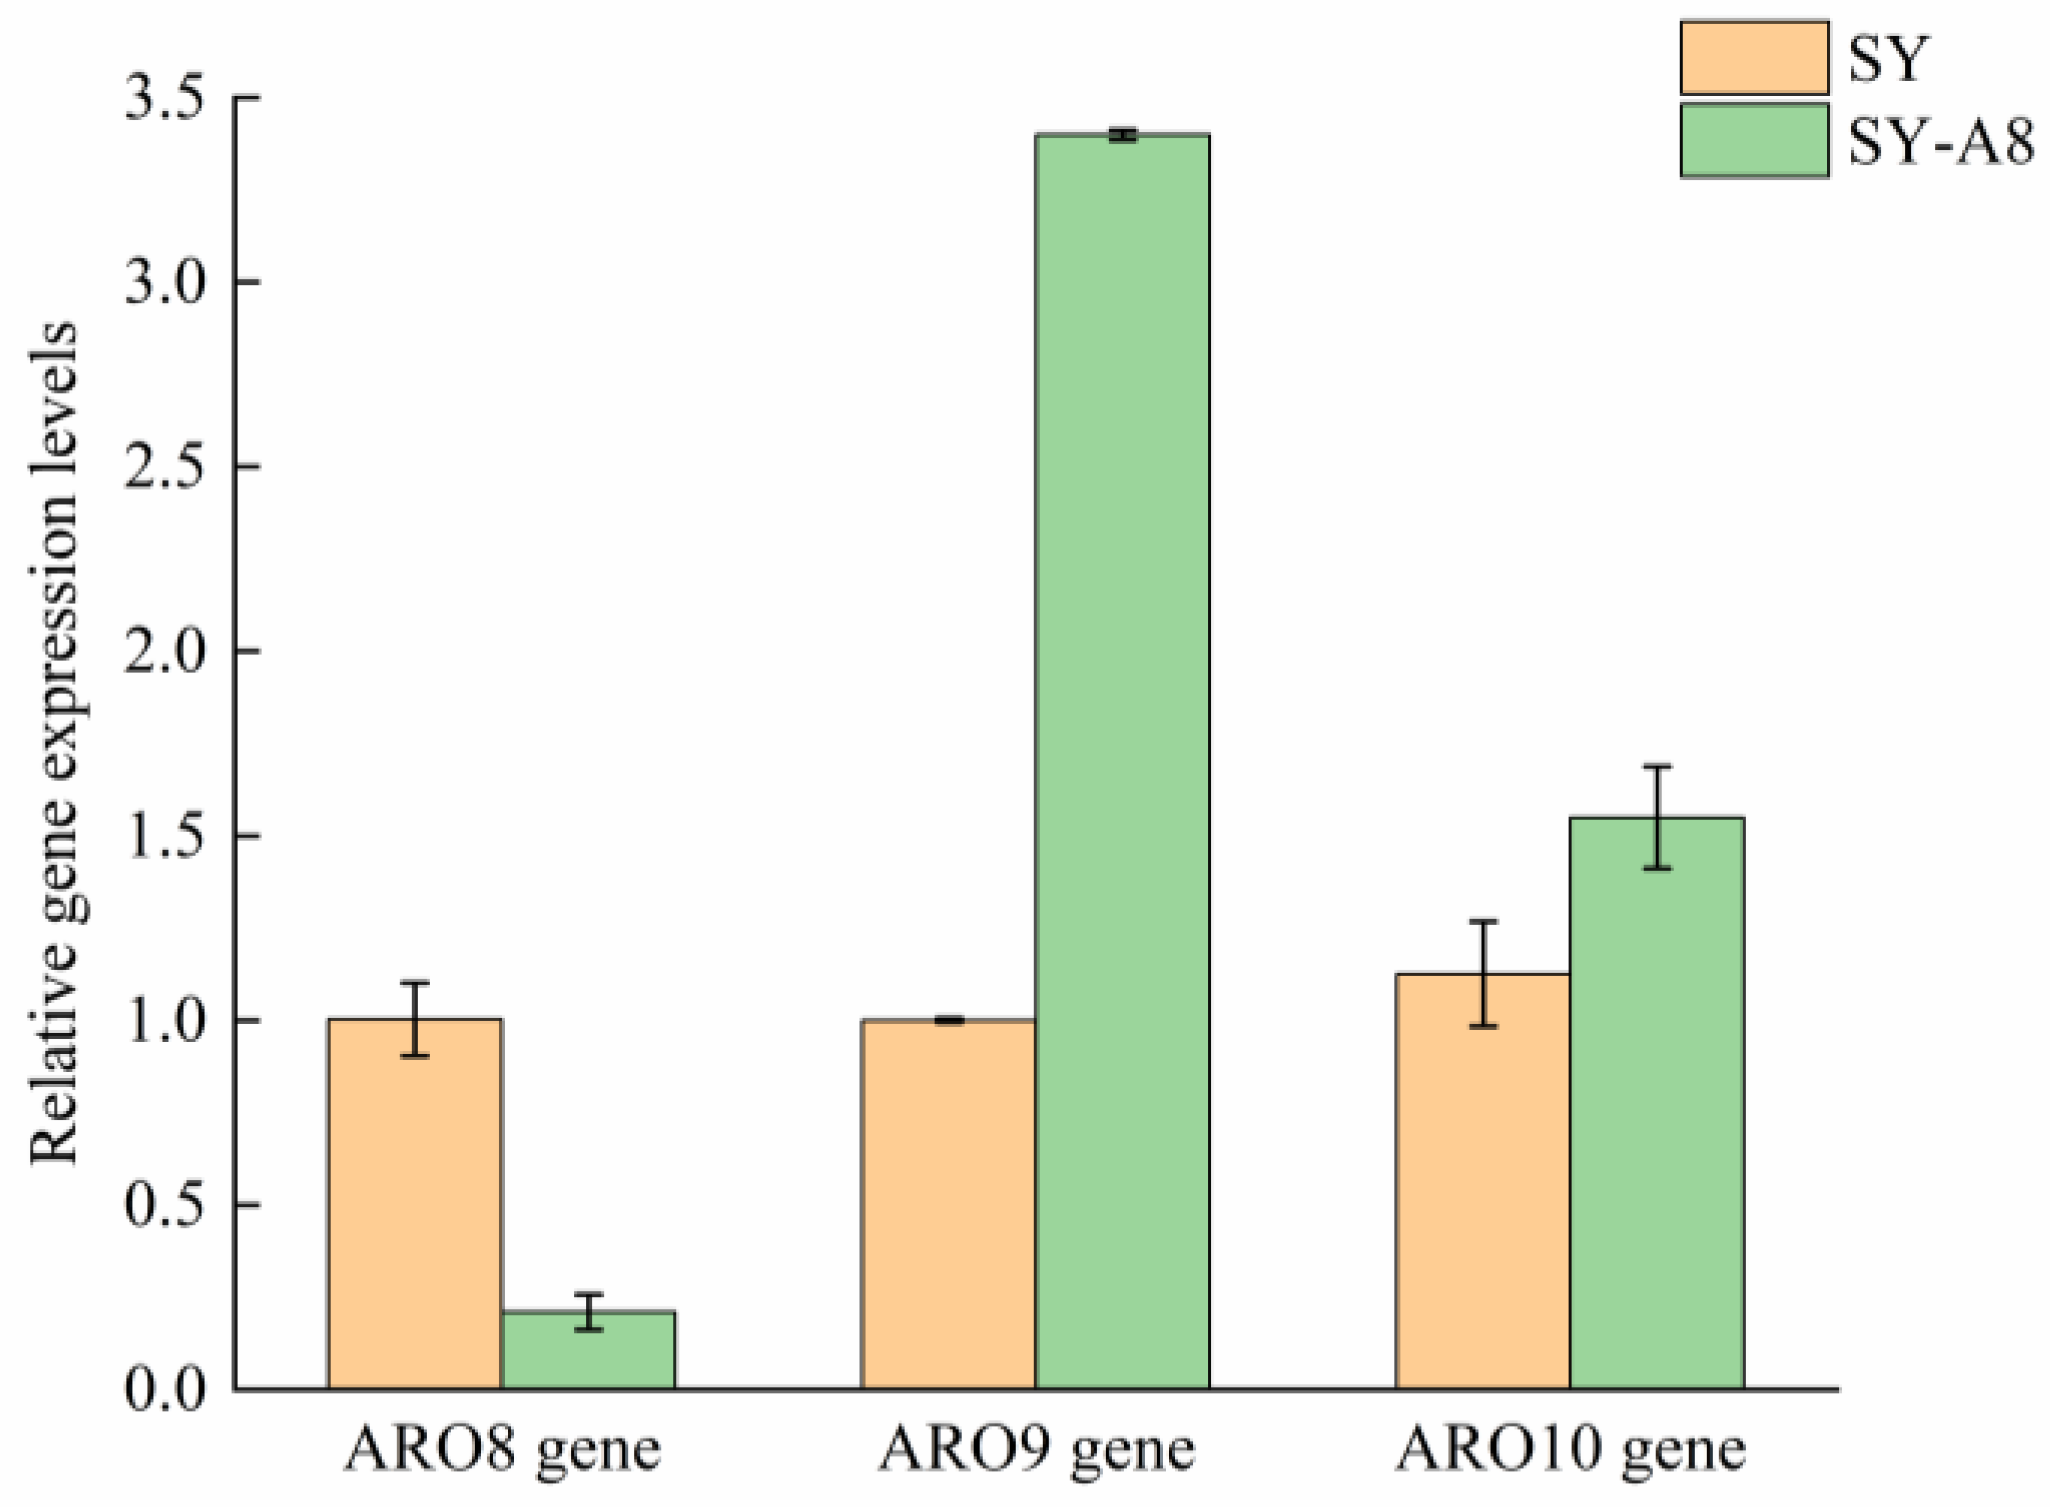
To confirm the transcriptional knockout of the ARO8 gene, total RNA was isolated from the SY and SY-A8 strains, and cDNA was synthesized via reverse transcription. Subsequently, the relative expression levels of ARO8 were determined by qPCR using the primers ARO8-F/ARO8-R, ARO9-F/ARO9-R, and ARO10-F/ARO10-R with the cDNA as a template. As shown in Figure 5, the ARO8 gene in the SY-A8 strain was successfully knocked out, as evidenced by its markedly reduced expression level.
To further investigate whether the deletion of ARO8 affects other key genes in the Ehrlich pathway, the expression levels of ARO9 and ARO10 in the SY-A8 strain were also examined. Both genes were found to be upregulated. Given that ARO9 and ARO10 encode key enzymes in the 2-PE biosynthetic pathway, their increased expression likely plays a crucial role in enhancing 2-PE yield.

2.4. Plasmid Loss Verification

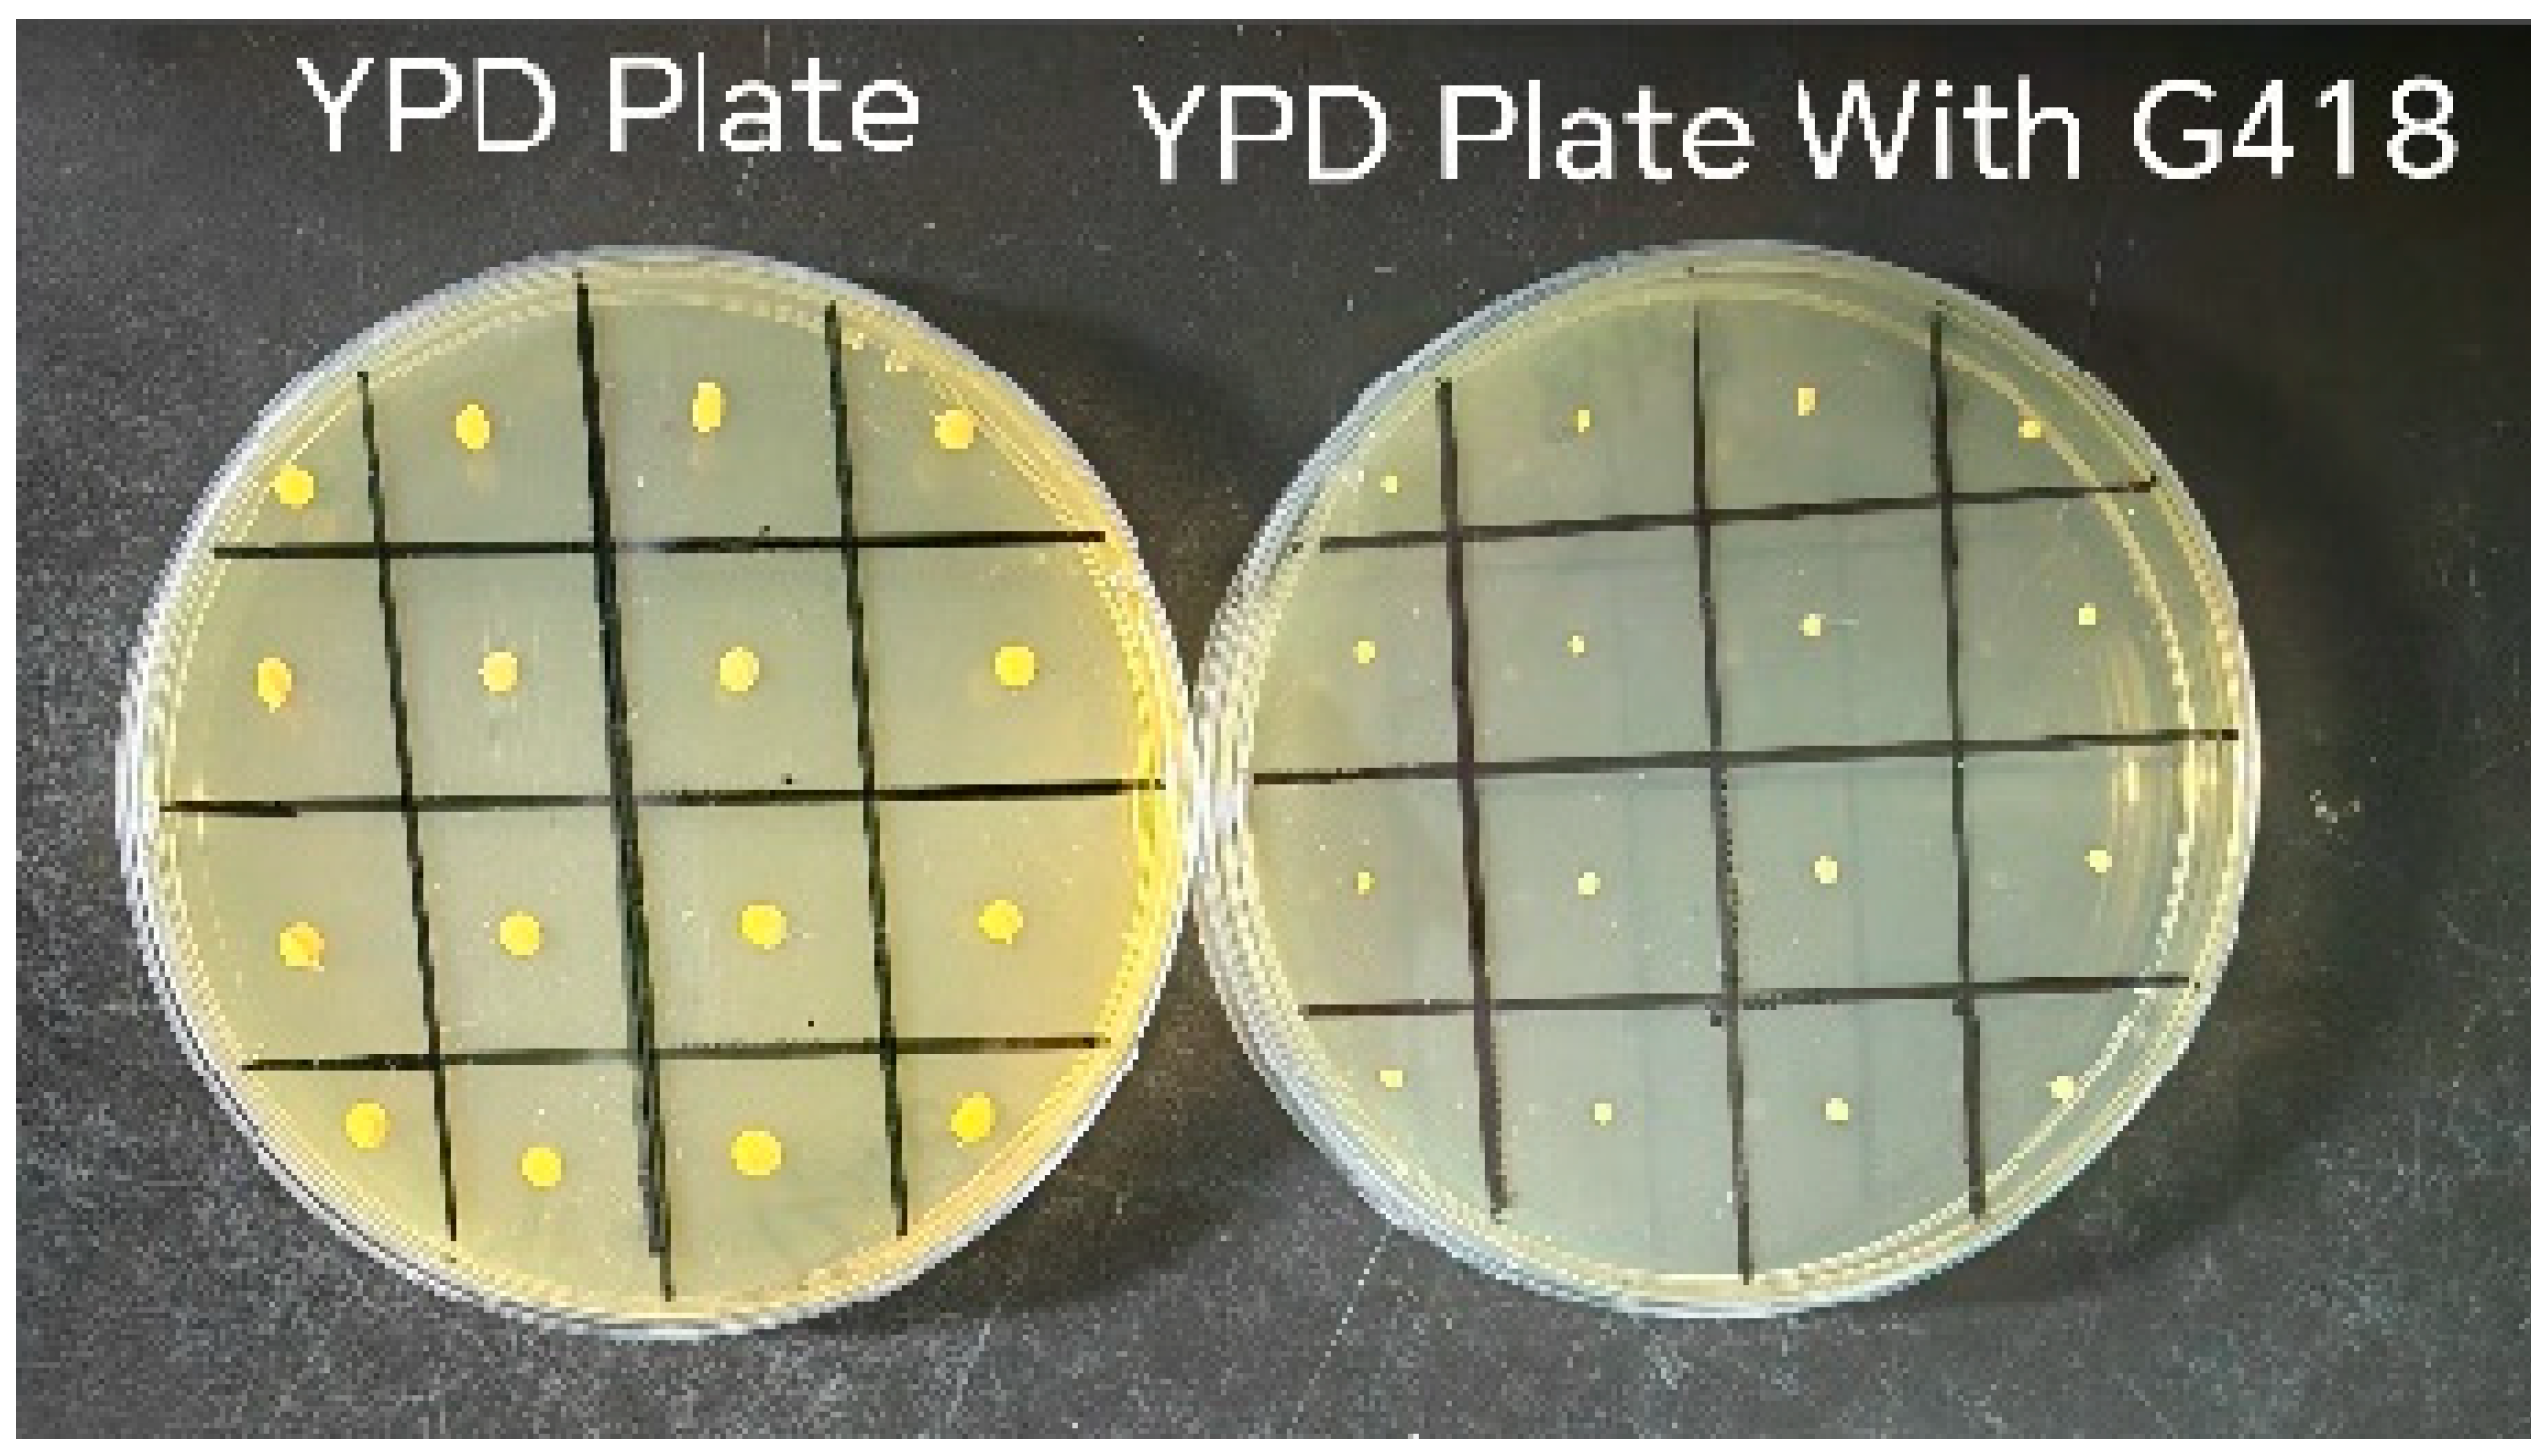
The SY-A8 with the lost plasmid was screened by the photocopy plate method and is shown in Figure 6. The plasmid-depleted strain normally grew on the antibiotic-free plates, but slowly grew on the G418 sulfate plates. It indicates that the plasmid p426-gRNA.ARO8-kanMX has been successfully removed from the SY-A8.

2.5. Effect of ARO8 Gene Knockout on S. cerevisiae Growth

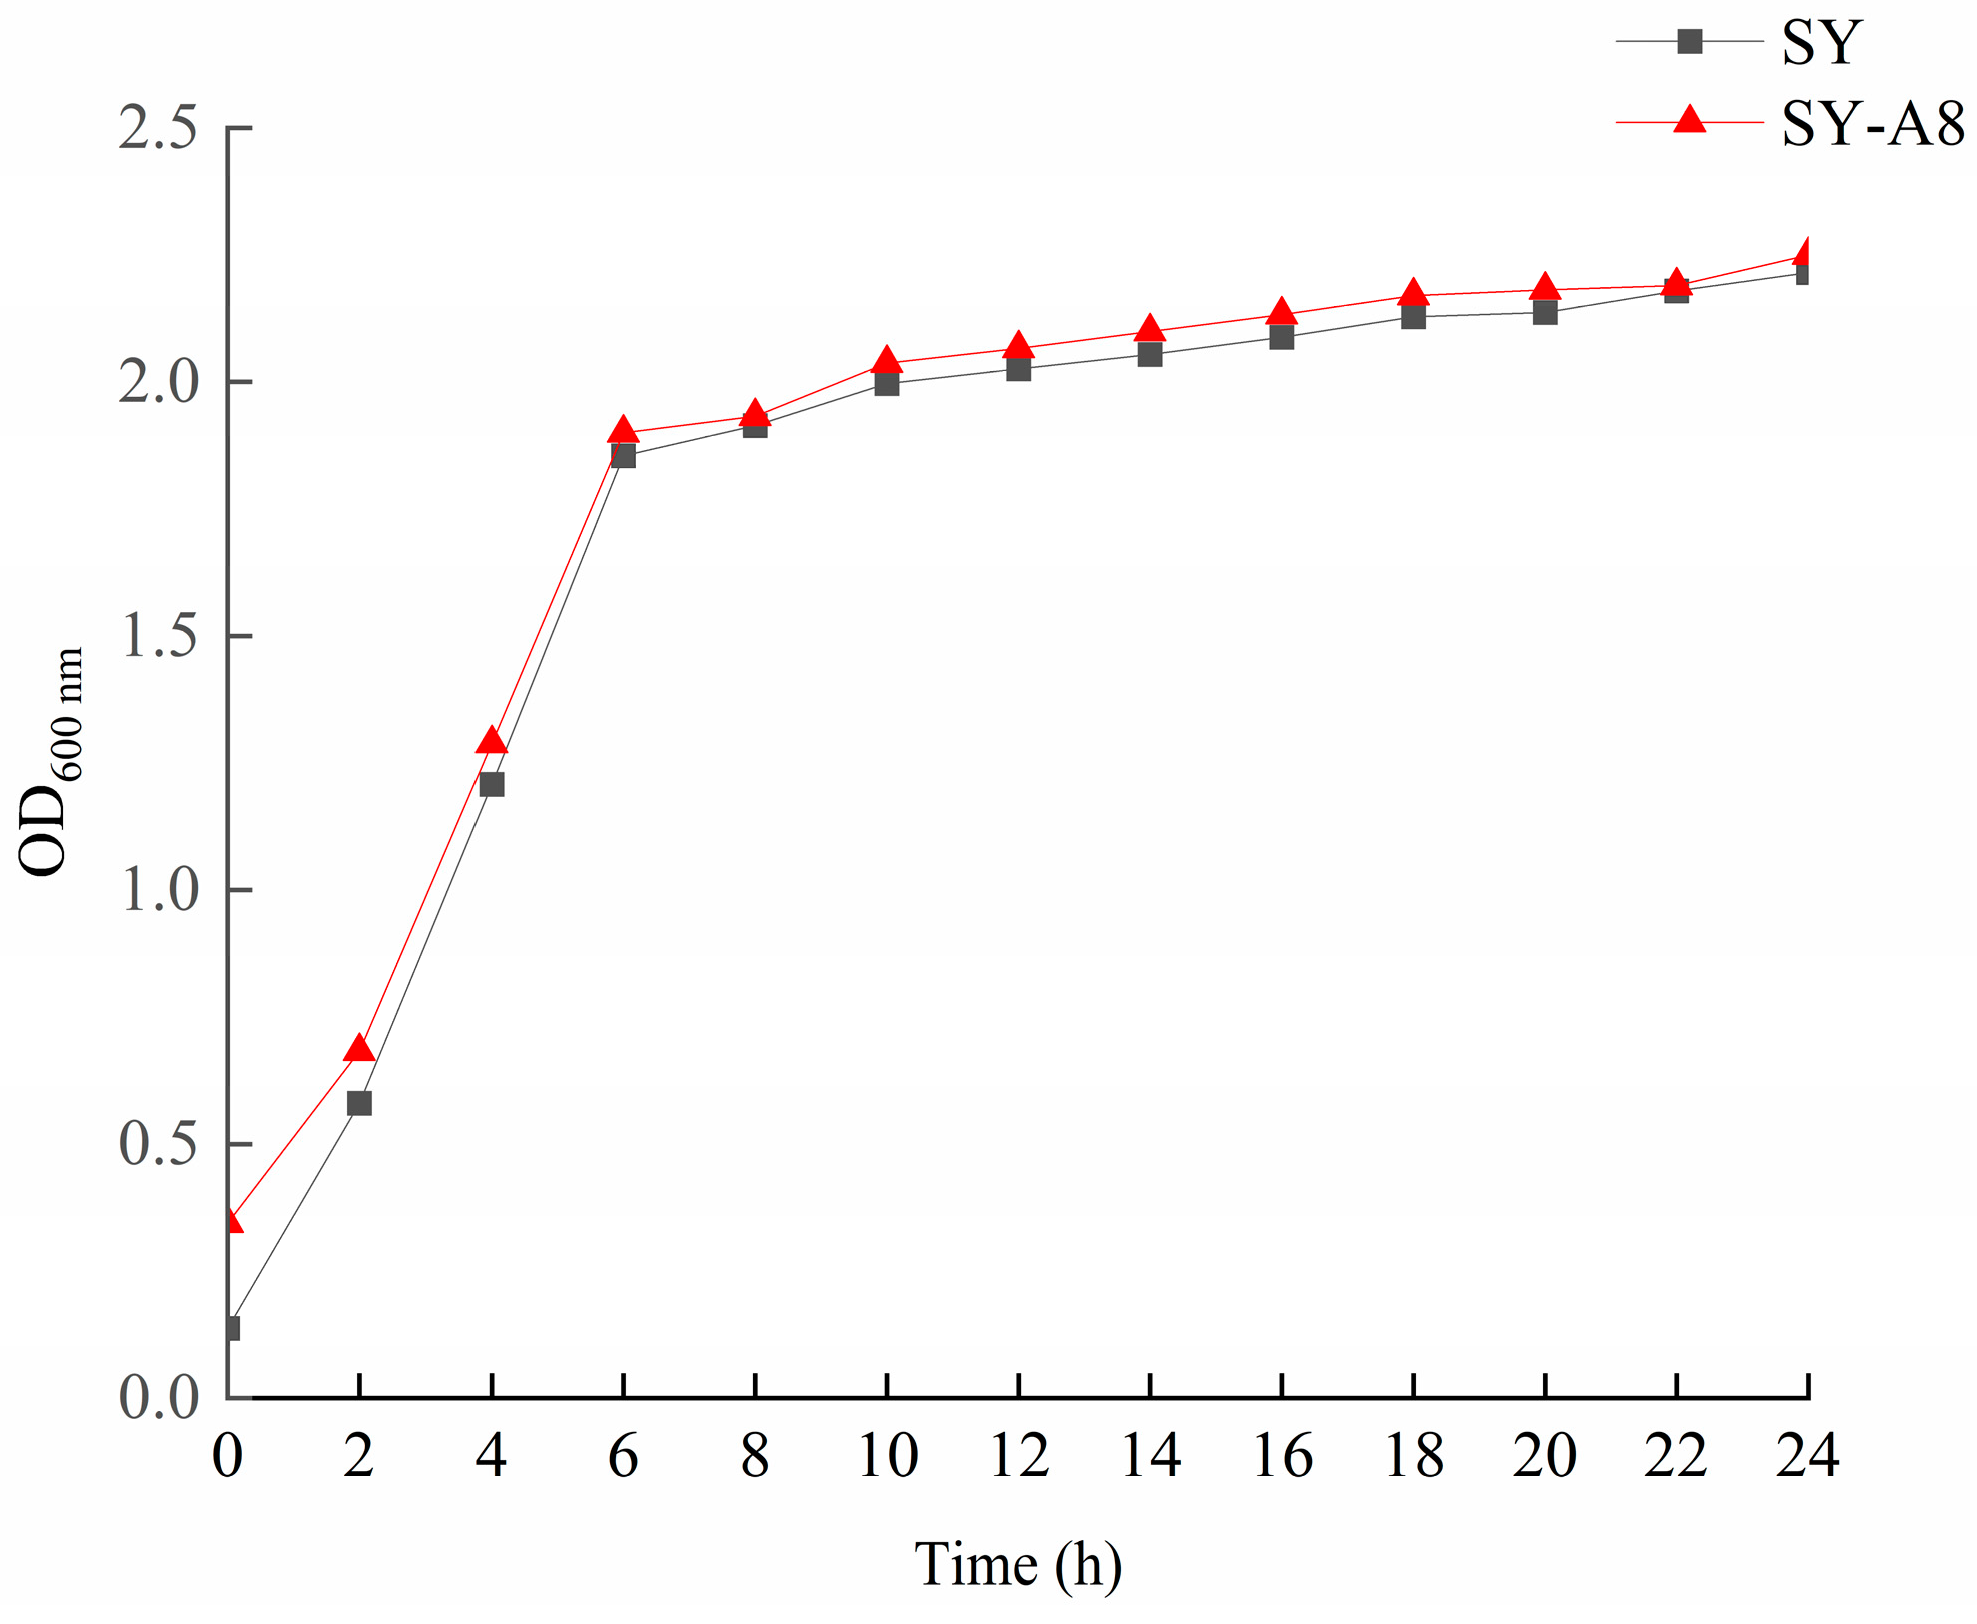
The growth curves of the original strain SY and recombinant strain SY-A8 are shown in Figure 7. The two strains exhibited similar growth rates, indicating that deletion of the ARO8 gene does not affect S. cerevisiae growth.

2.6. Single-Factor Experiment Results

Through preliminary fermentation screening, the recombinant strain SY-A8, which exhibited the highest 2-PE yield, was selected for subsequent fermentation condition optimization. Single-factor experiments were performed to evaluate the effects of inoculum size, wort pH, sugar concentration, fermentation time, and L-Phe concentration on 2-PE production. The results are presented below.

2.6.1. Effect of Different Inoculum Size on 2-PE in Whisky

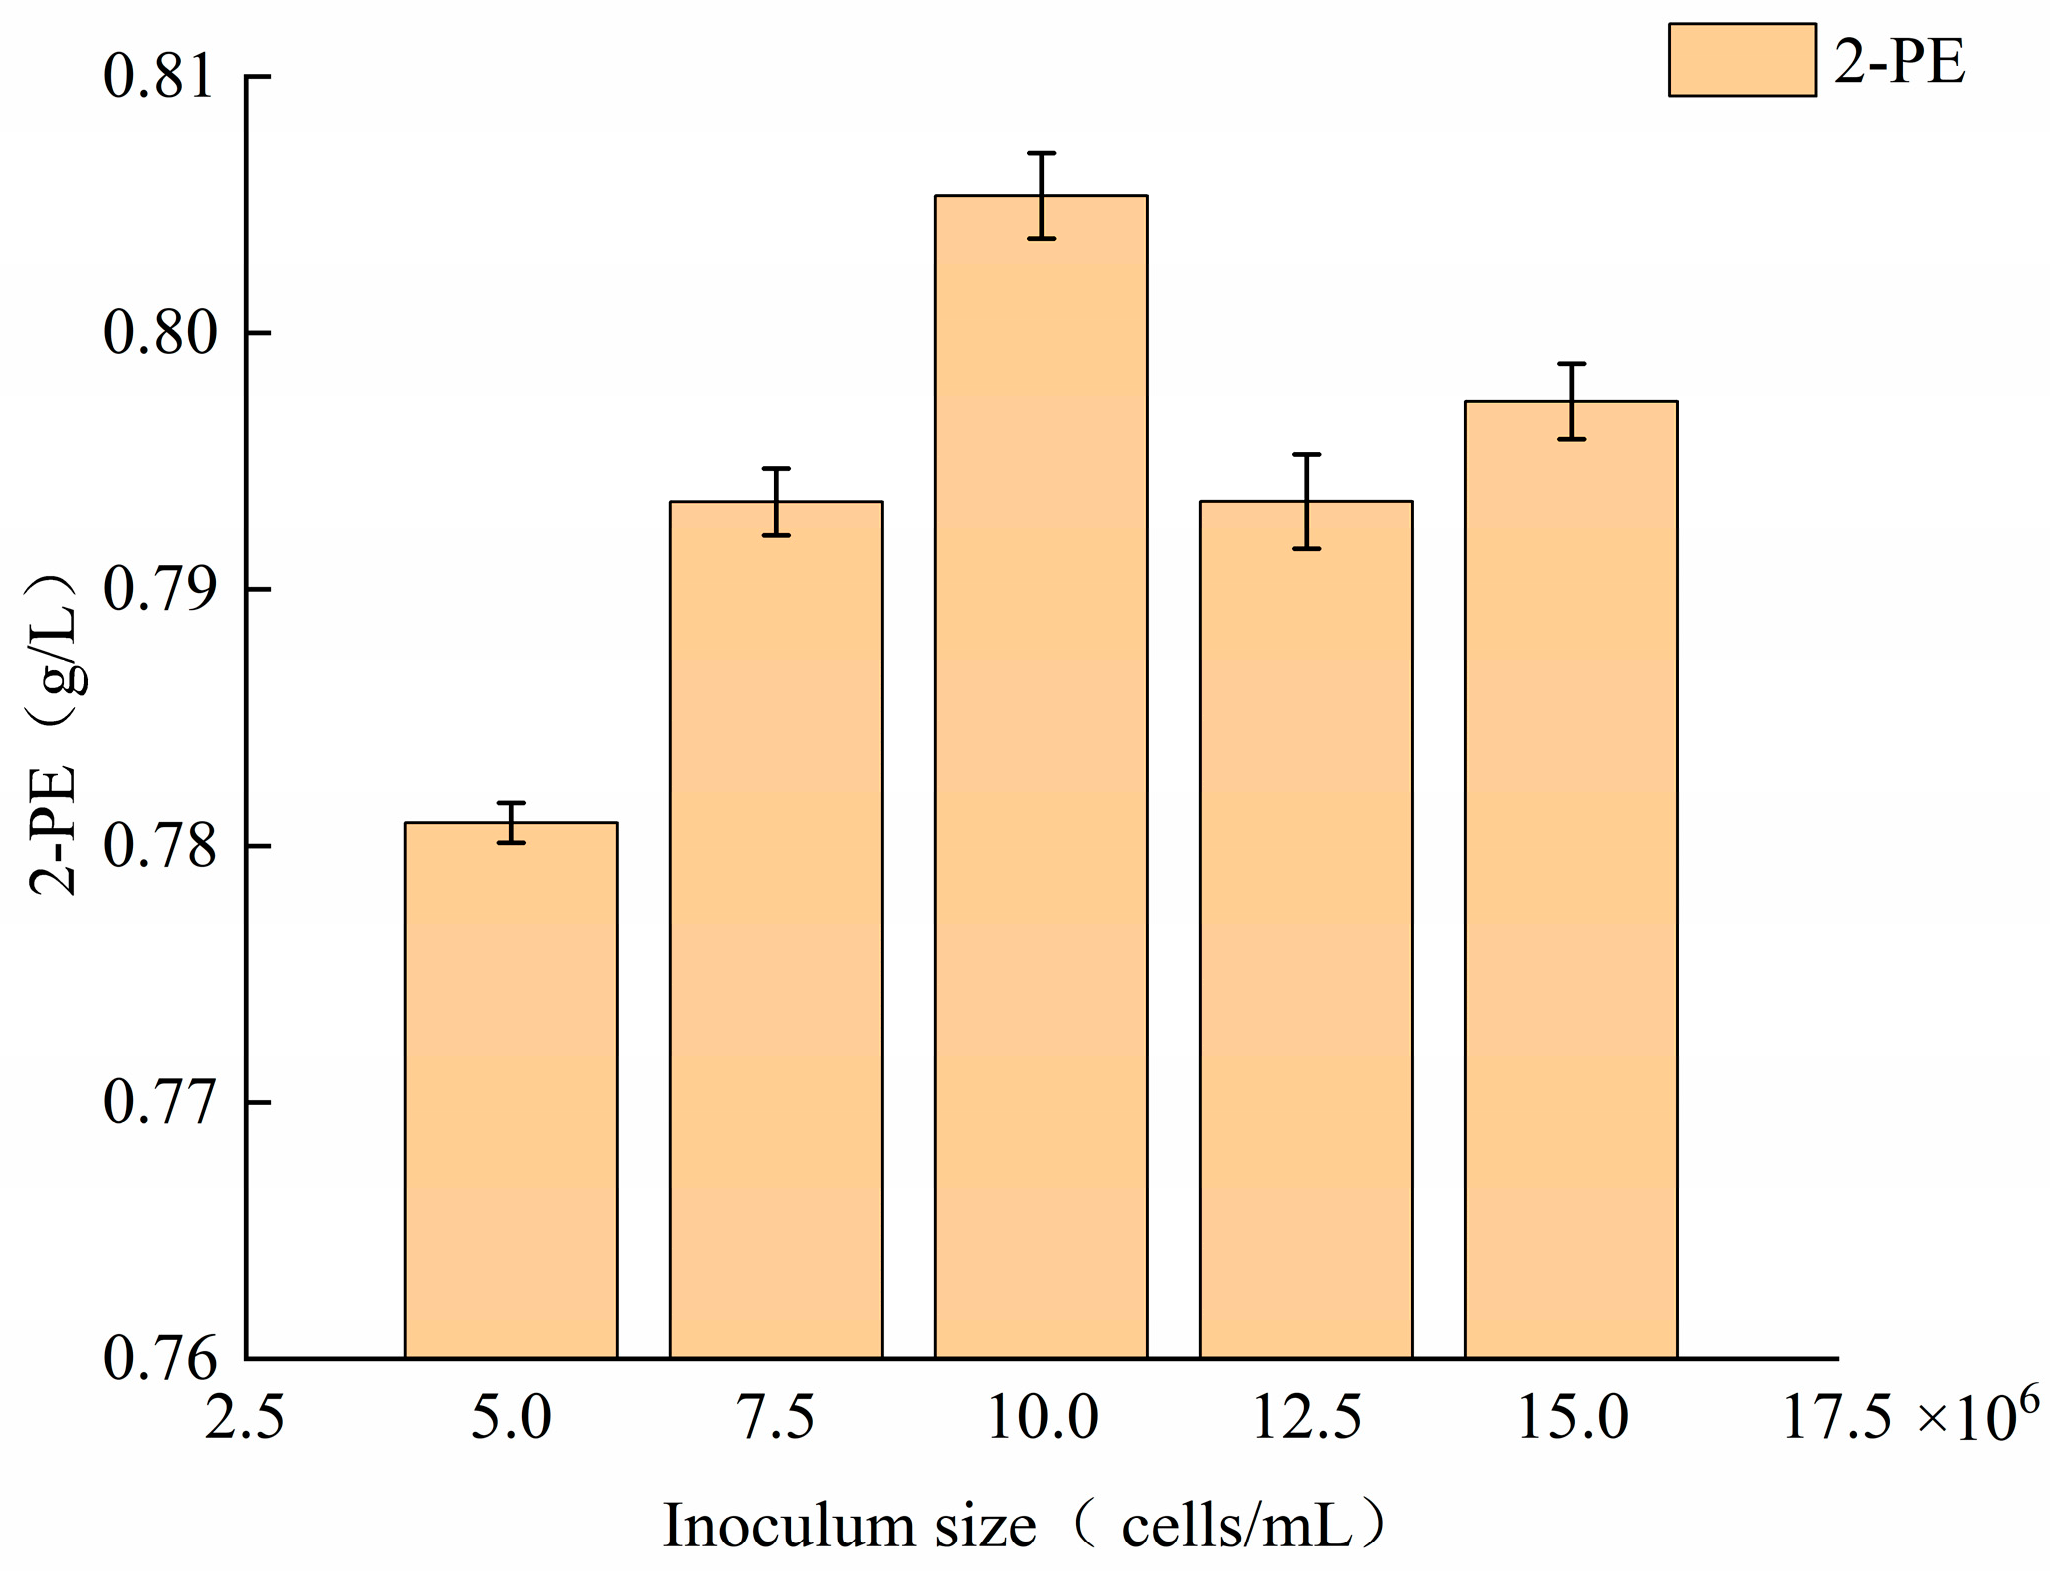
The content of 2-PE in whisky was produced following the inoculum size, as shown in Figure 8. As there is an increase in the S. cerevisiae inoculum size from 5 × 10⁶ cells/mL to 15 × 106 cells/mL, the yield of 2-PE in whisky continues to rise. At a lower S. cerevisiae inoculum size, the limited S. cerevisiae size resulted in slowing product accumulation and extending fermentation time. Although a higher S. cerevisiae inoculum size requires larger seed culture volumes and causes rapid nutrient depletion and massive by-product accumulation, it does not effectively improve the yield of 2-PE. The maximum content of 2-PE was approximately 0.81 g/L at an inoculum size of 10 × 106 cells/mL.

2.6.2. Effect of Wort pH on 2-PE in Whisky

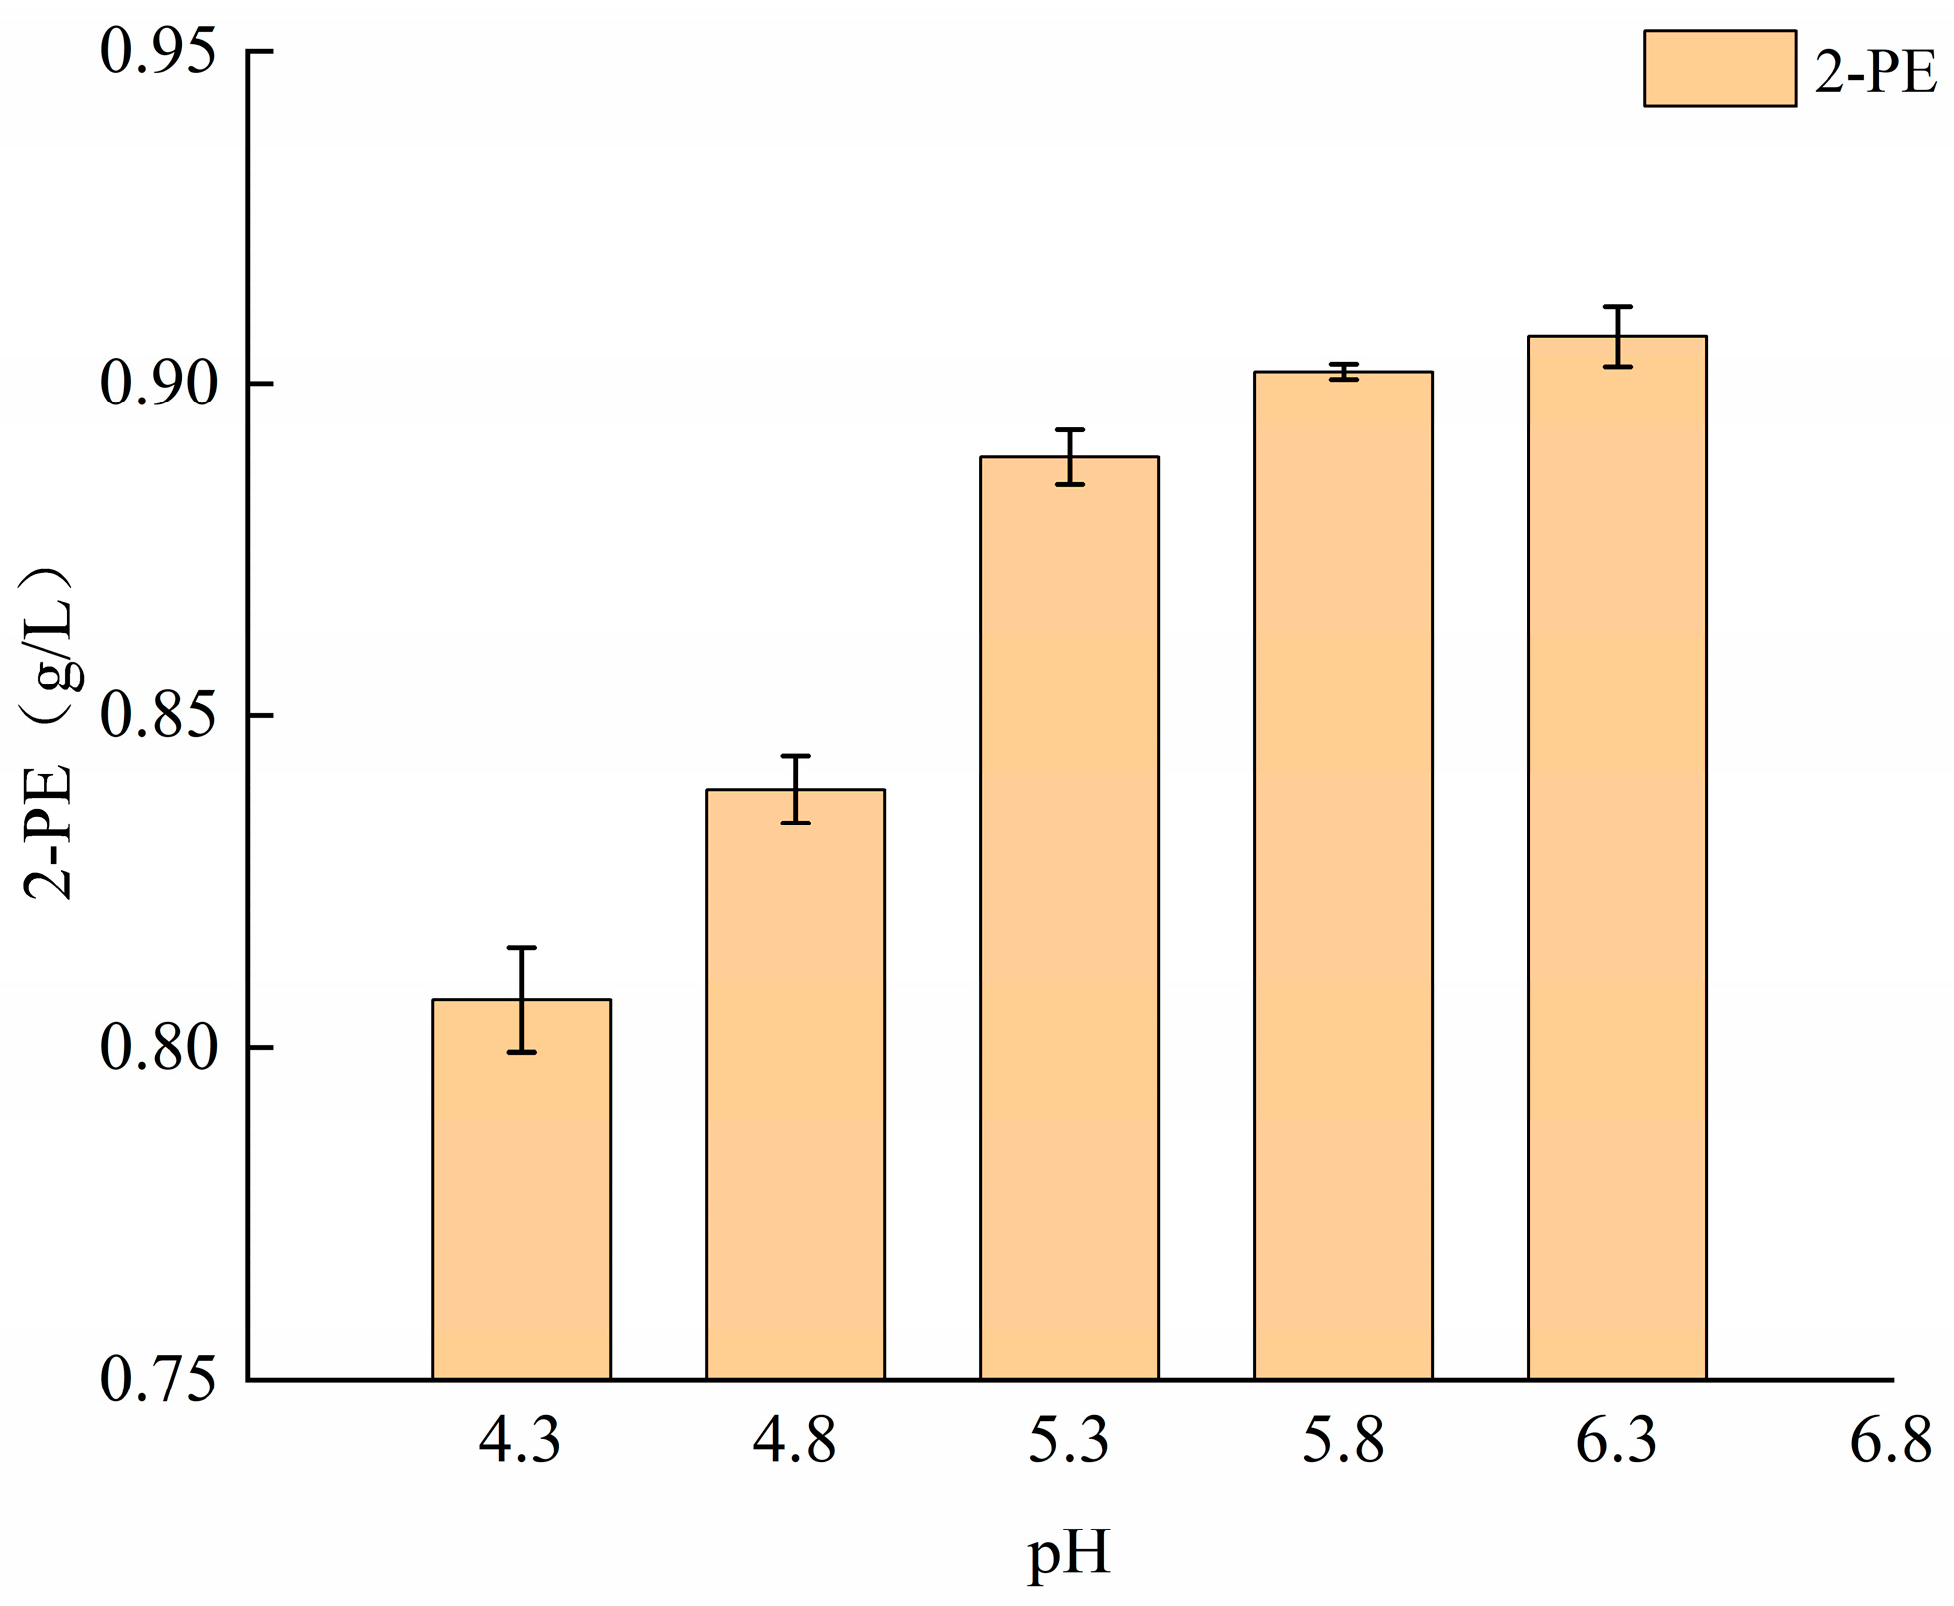
The content of 2-PE in whisky was produced under different wort pH levels, as shown in Figure 9. As the wort pH increases from 4.3 to 6.3, the yield of 2-PE in whisky continues to rise. At lower wort pH, the metabolic activity of S. cerevisiae was inhibited, which led to a decrease in the production of 2-PE. Conversely, at an optimal wort pH, the enzymes mediating the biosynthetic pathway of 2-PE display high catalytic activity, with S. cerevisiae exhibiting robust metabolic performance. The maximum 2-PE content was 0.91 g/L at optimal wort pH 6.3.

2.6.3. Effect of Different Sugar Concentration on 2-PE in Whisky

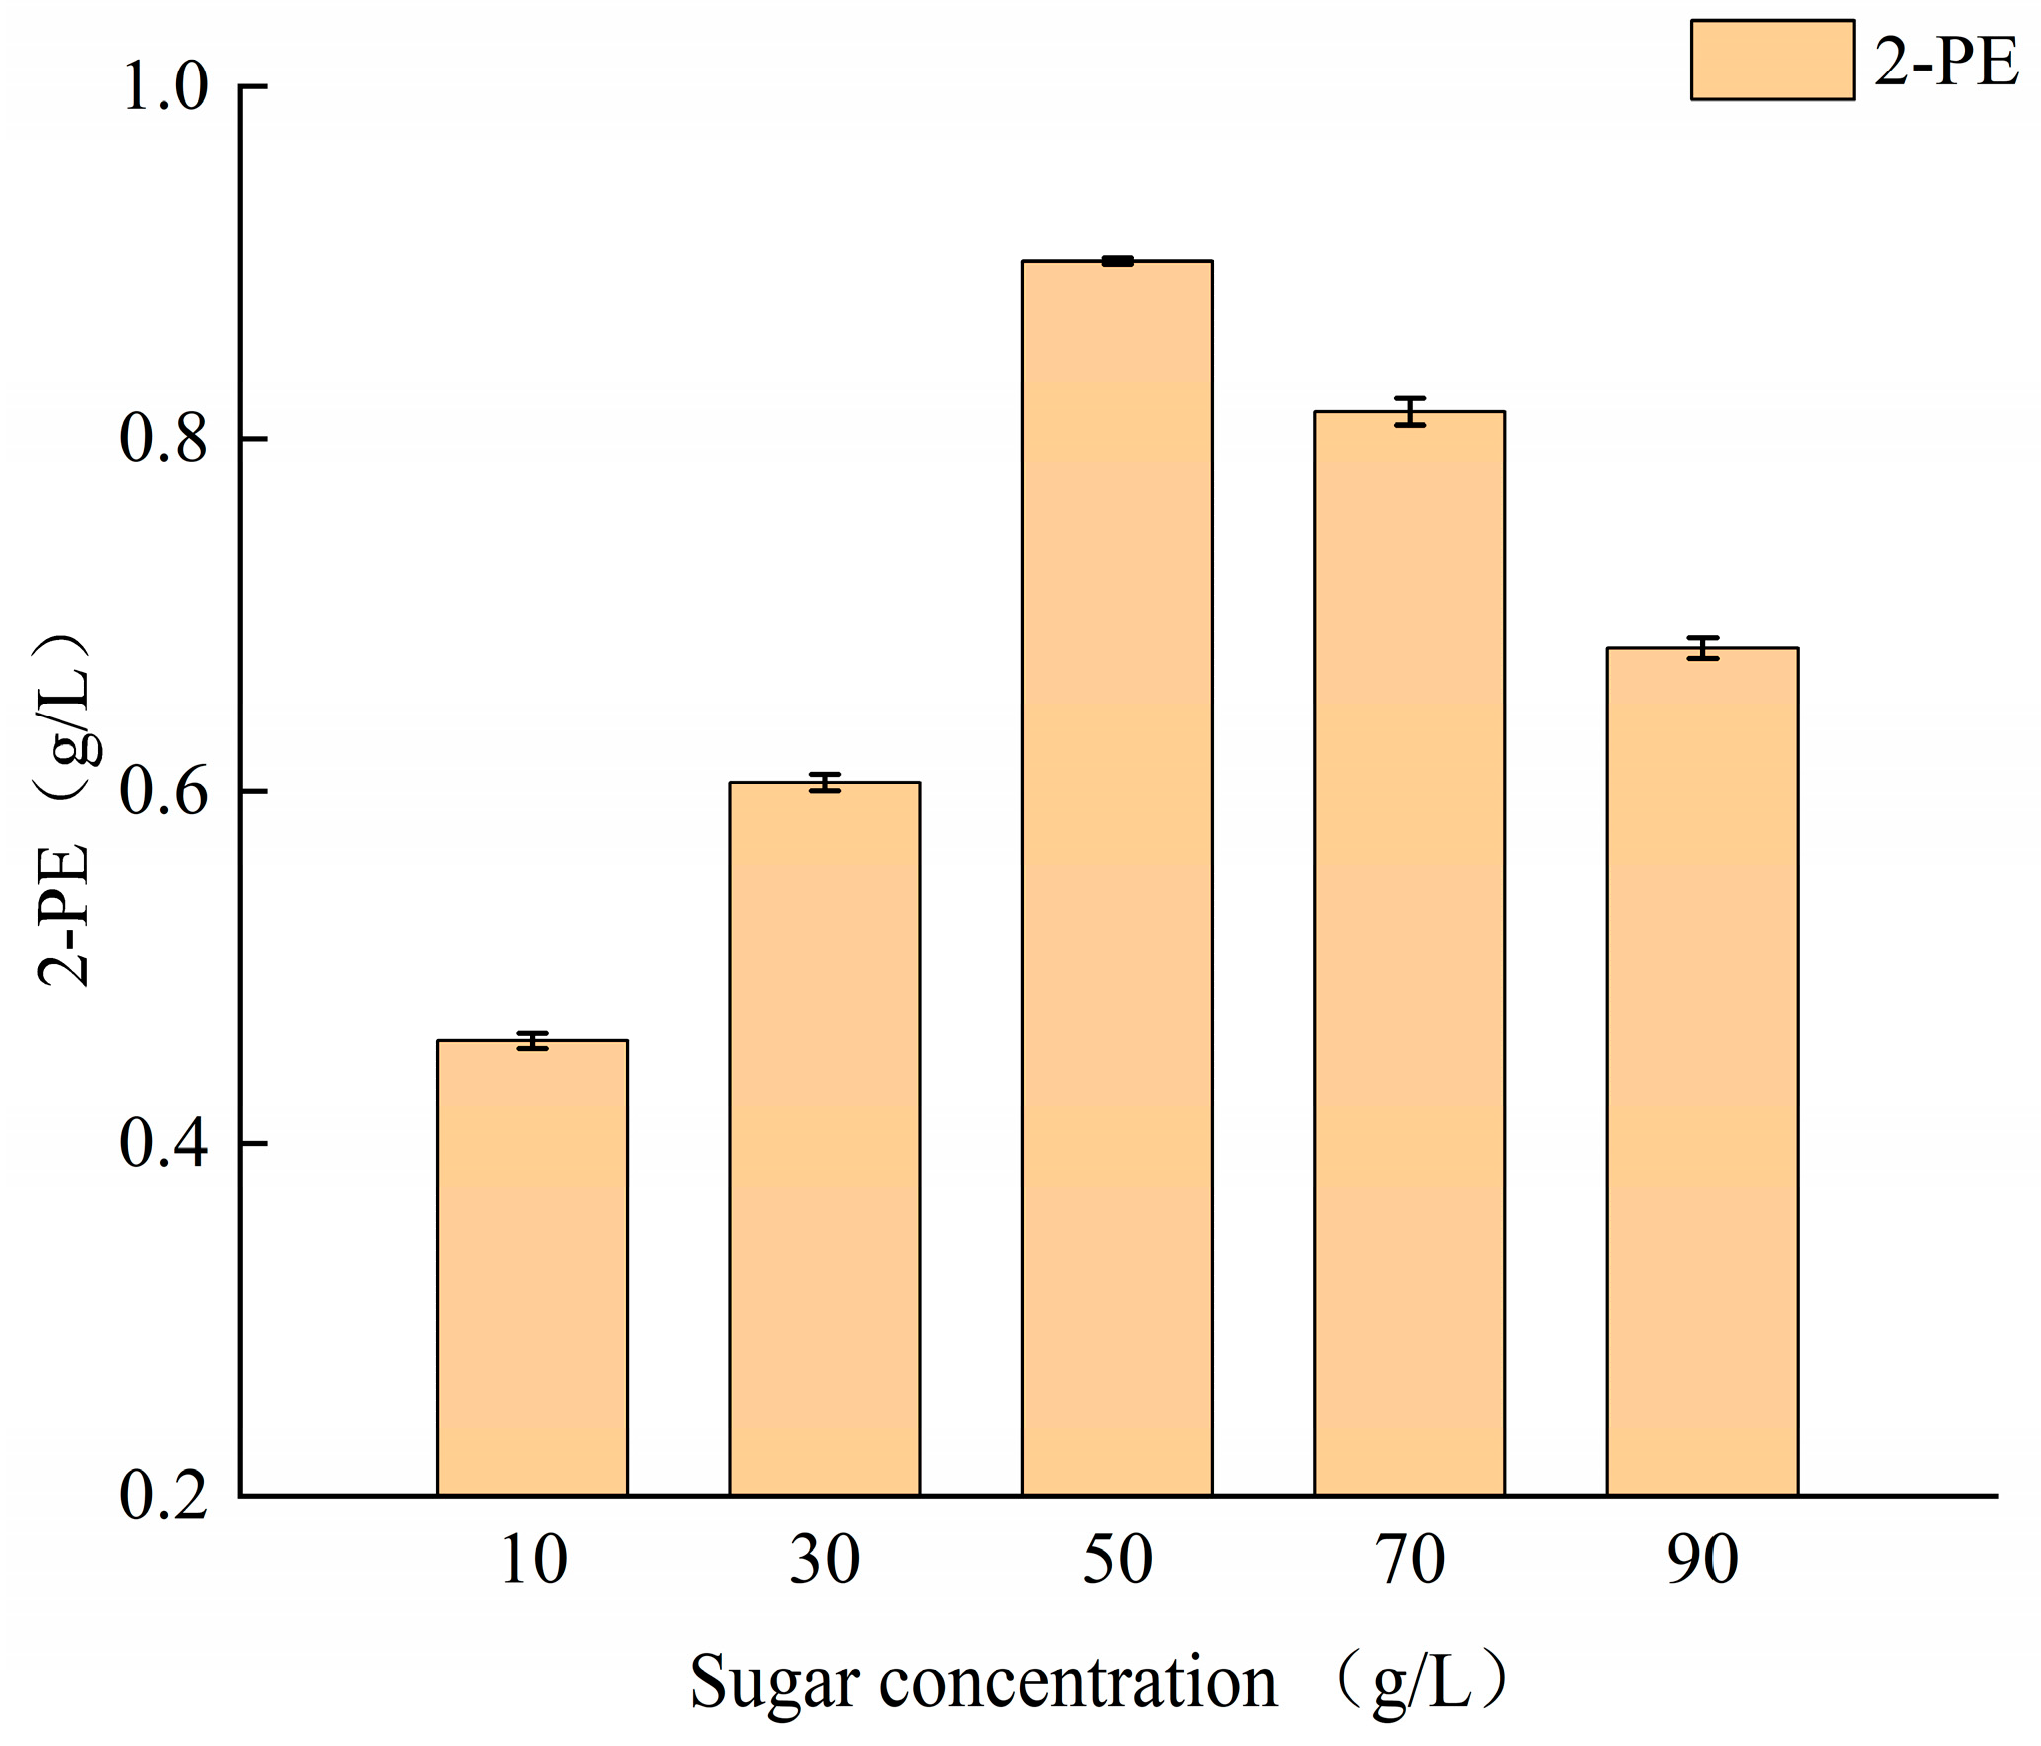
The content of 2-PE in whisky was produced following the sugar concentration, as shown in Figure 10. As there is an increase in the sugar additions from 10 to 50 g/L, the yield of 2-PE in whisky continues to rise. This also improves the efficiency of converting sugar into 2-PE. When sugar additions exceed 50 g/L, the biosynthesis rate of ethanol was significantly accelerated, with sugars primarily utilized for ethanol production, which triggers a decrease in the production of 2-PE. The maximum content of 2-PE was 0.90 g/L at the optimal sugar concentration of 50 g/L.

2.6.4. Effect of Fermentation Time on 2-PE in Whisky

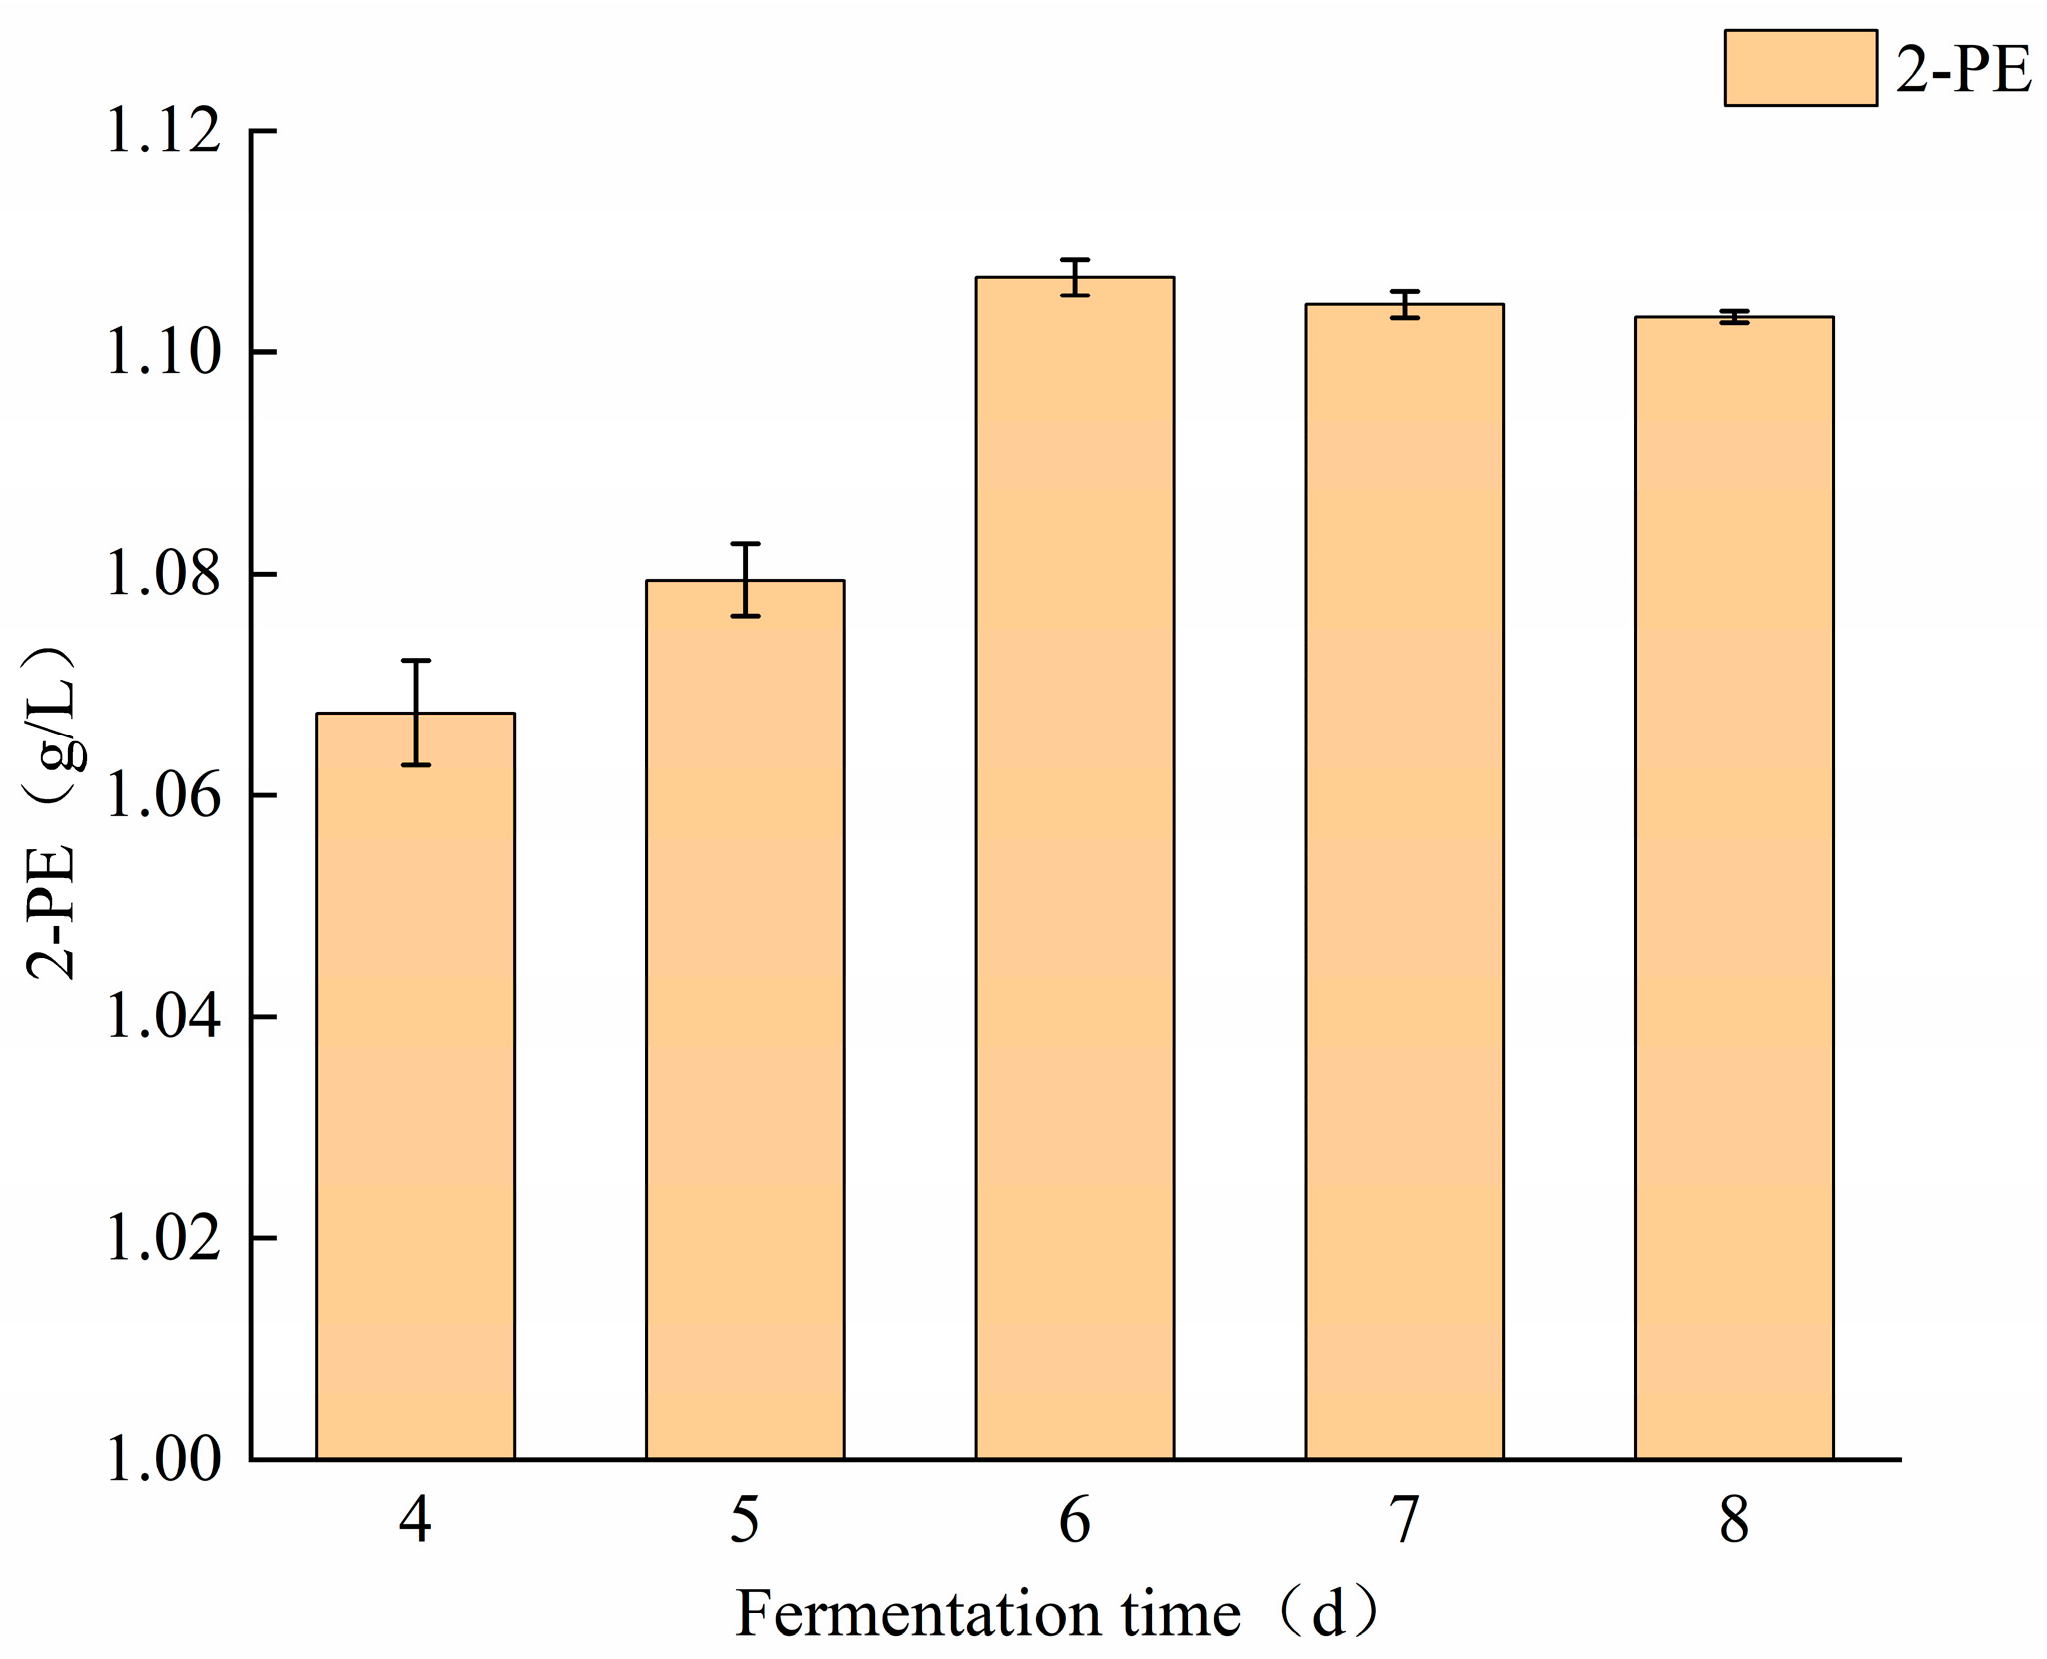
The content of 2-PE in whisky produced under different fermentation times is shown in Figure 11. During the anaerobic fermentation from 4 to 6 days, under the condition of sufficient nutrients, the metabolic activity of yeast was maintained at a high level. So, the content of 2-PE was continually increased. After 6 days, the depletion of nutrients and accumulation of undesirable by-products led to decreased metabolic activity of the yeast. So, the content of 2-PE no longer increased significantly. The maximum content of 2-PE was 1.10 g/L at the optimal 6 days.

2.6.5. Effect of L-Phe Concentration on 2-PE in Whisky

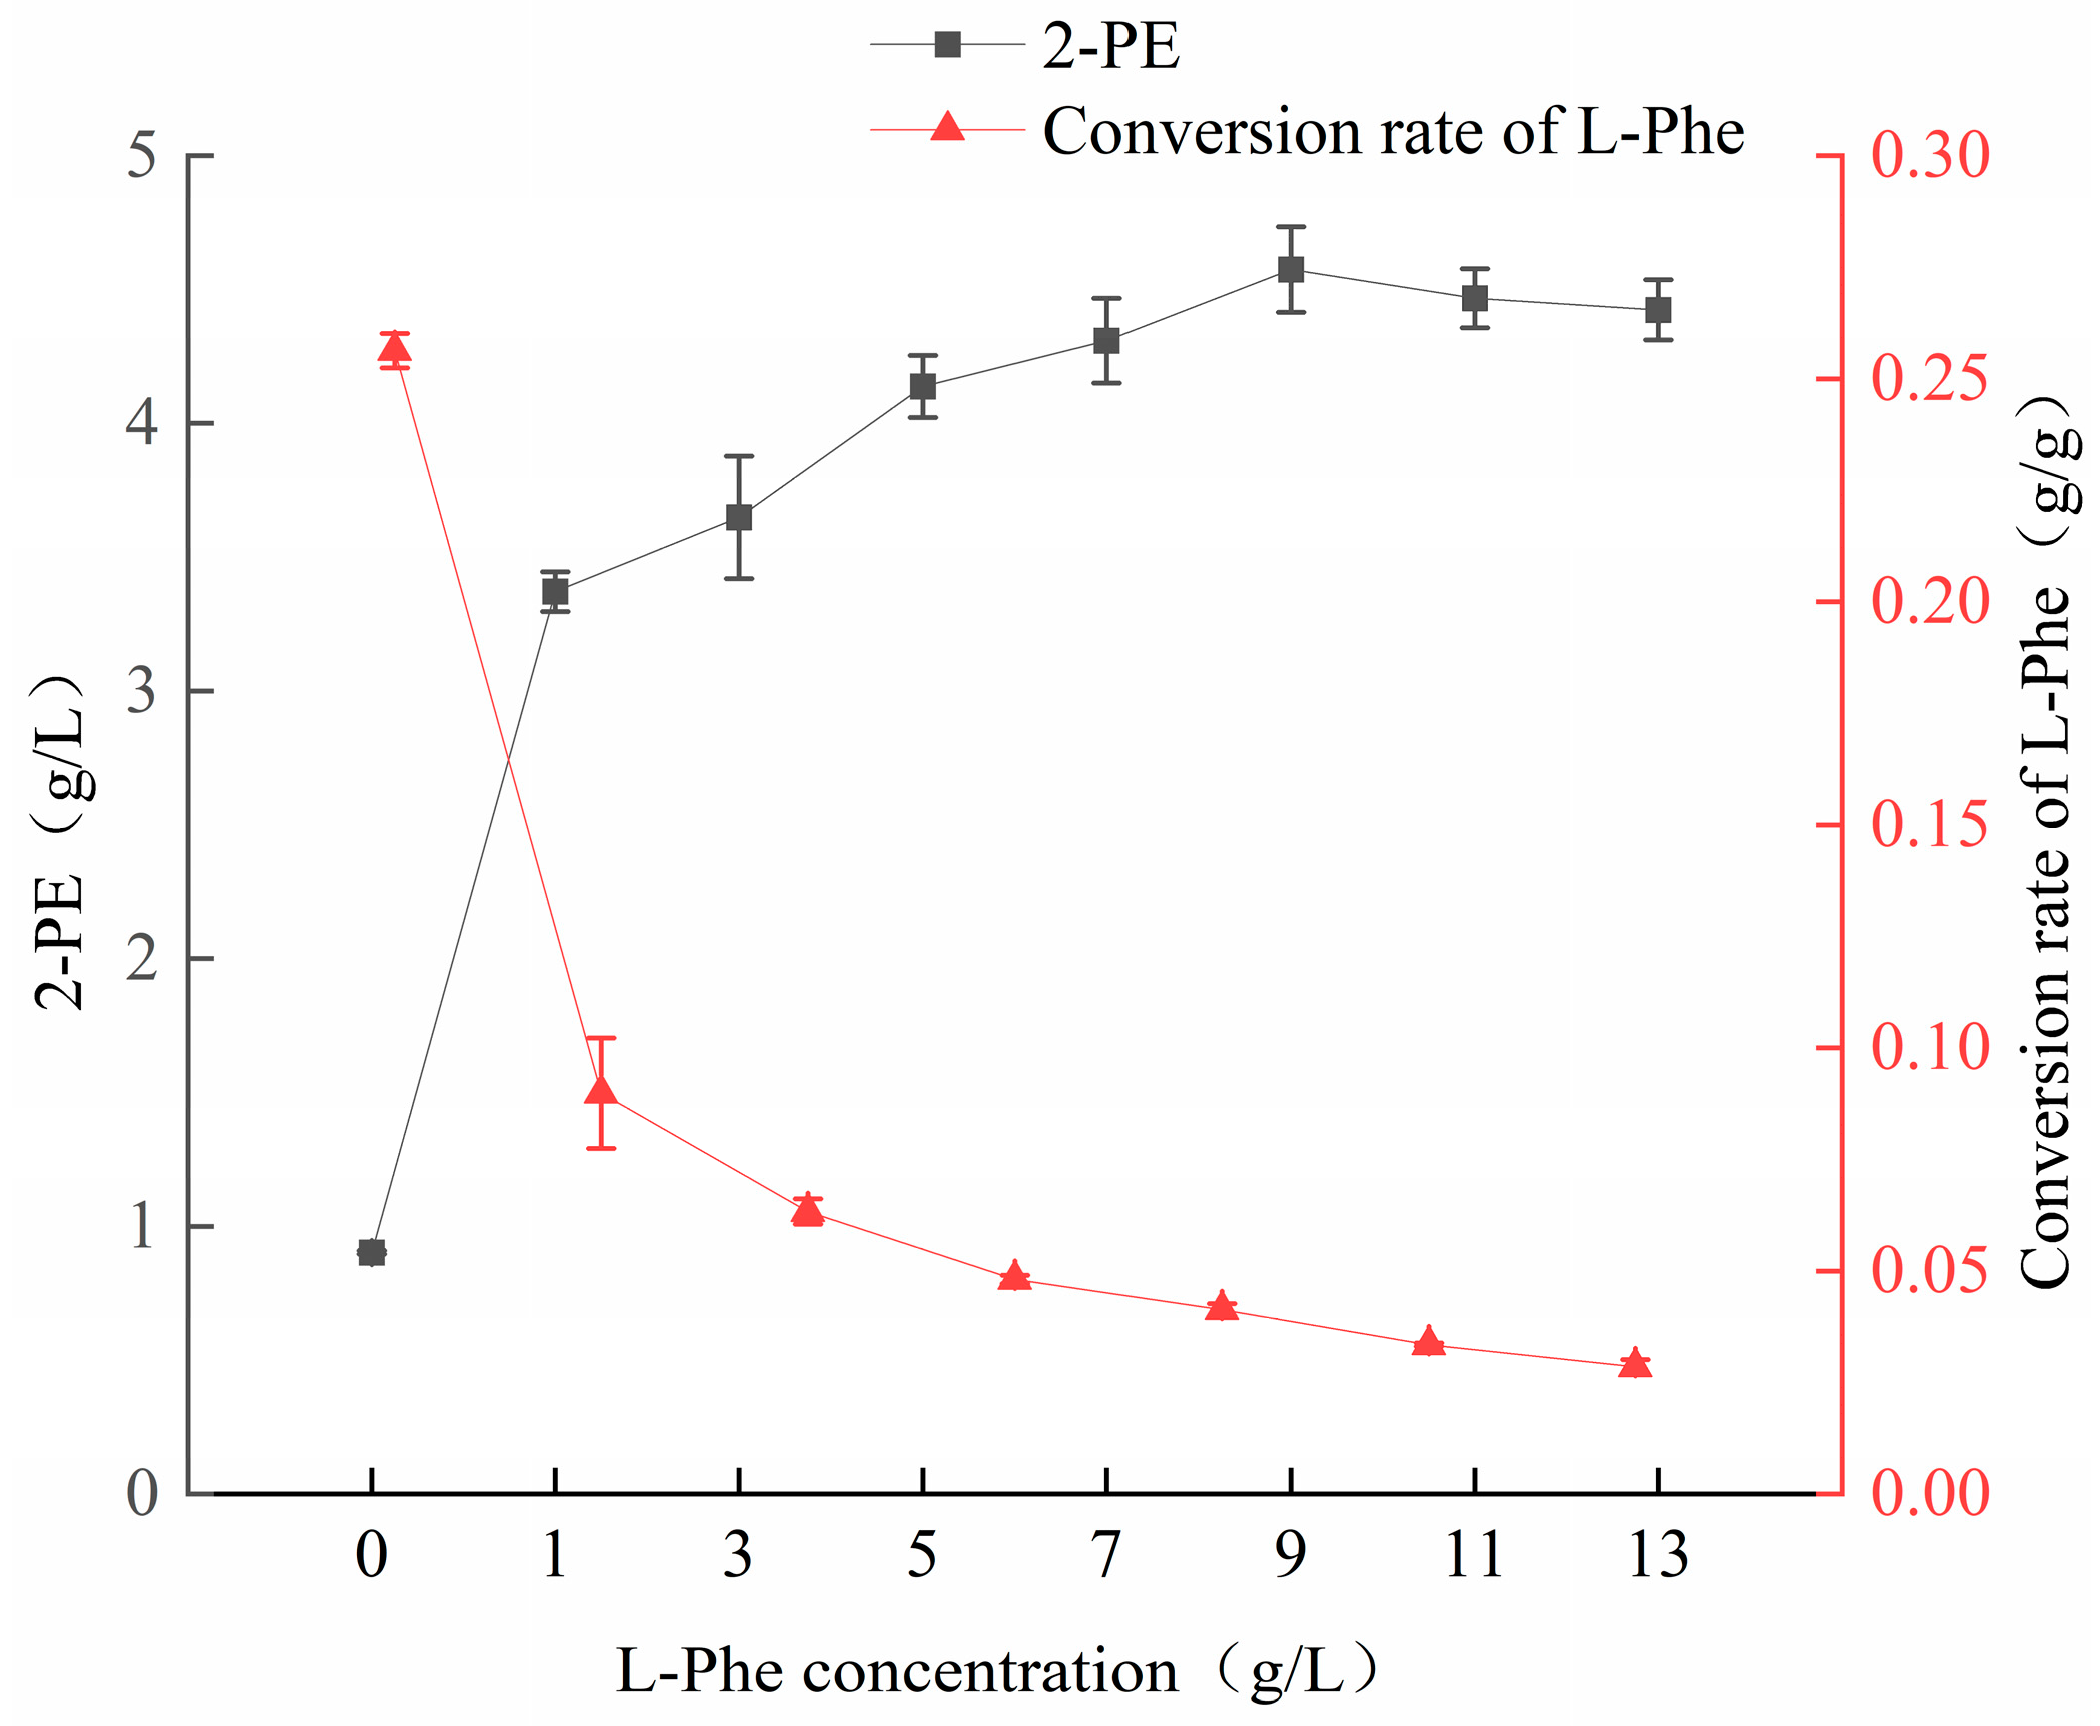
The content of 2-PE in whisky produced under different L-Phe concentrations is shown in Figure 12. As the concentration of L-Phe increased from 0 to 13 g/L, the content of 2-PE continuously increased. Although adding L-Phe enhances 2-PE production, the conversion rate of 2-PE from L-Phe continually decreased. So, the maximum molar yield of 2-PE from L-Phe was 0.25 g/g (or 0.34 mol/mol) at the L-Phe concentration of 1 g/L, and the content of 2-PE was 3.31 g/L, an increase of 267.78% compared with the 0 g/L L-Phe. These experimental data indicate that the addition of L-Phe could effectively enhance the biosynthetic pathways of 2-PE. Therefore, considering both 2-PE content and the conversion rate of 2-PE from L-Phe, the optimal concentration of L-Phe was 1 g/L.

2.7. Optimization of Fermentation Conditions Using Response Surface Methodology

2.7.1. Response Surface Methodology Model and Statistical Significance Analysis

The Box–Behnken design was employed for the response surface methodology, with investigating factors including sugar concentration (A), fermentation time (B), and L-Phe concentration (C). The response value was the 2-PE content (Y) in the whisky. The experimental results are detailed in Table 1.
The experimental data were analyzed using Design Expert 13 to obtain a multiple quadratic regression equation:
Y = 3.5335 − 0.1169A + 0.0394B − 0.0095C + 0.1508AB + 0.1254AC + 0.0007BC − 0.2628A2 − 0.2503B2 + 0.2694C2.

2.7.2. Variance and Confidence Analysis of 2-PE Content in Whisky

A further analysis of variance was conducted on the results of each experimental group from Table 1, and the findings are presented in Table 2.
As shown in Table 2, a quadratic model was applied to regress the 2-PE content in whisky. The model showed a highly significant difference with a p-value < 0.01, indicating a robust fit and suitability for subsequent optimization analyses. The lack-of-fit test had a p-value > 0.05, suggesting that the quadratic model provided an adequate fit across the regression range, effectively modeling the 2-PE content in whisky. An analysis of F-values revealed that the most influential factor was sugar concentration (A), fermentation time (B) and L-Phe concentration (C). In the significance analysis, using a threshold of p < 0.05, it was found that the linear terms A, B, quadratic terms A2, B2 and C2, and the interaction terms AB and AC had significant effects on the 2-PE content in whisky (p < 0.05). The model’s R2 value was 0.9918, indicating a strong correlation between the actual and predicted values, with 99.18% of the variance in the 2-PE content explained by the model. The adjusted R2 value was 0.9813, suggesting that 98.13% of the variability was accounted for by the investigated variables, demonstrating that the optimized model effectively captures the process conditions. The predicted R2 value was 0.8961, with the difference between the predicted and actual R2 values being less than 0.2, further validating the model’s accuracy and low error rate [27].

2.7.3. Response Surface Analysis and Verification Test of 2-PE Content in Whisky

The analysis results indicate that the p-values for the sugar concentration (A) and fermentation time (B) in the first-order term, A2, B2 and C2 in the second-order term, AB and AC in the interaction term are all below 0.05, demonstrating their significant influence on 2-PE content. Generally, a lower coefficient of variation (CV) corresponds to higher experimental reliability and precision. The CV% of this regression model is 1.06, indicating high reliability and accuracy in the response surface experiment; the adequate precision is 38.95, a value greater than four is considered reasonable. These findings confirm that the model exhibits high reliability, accuracy, and good adaptability [28].
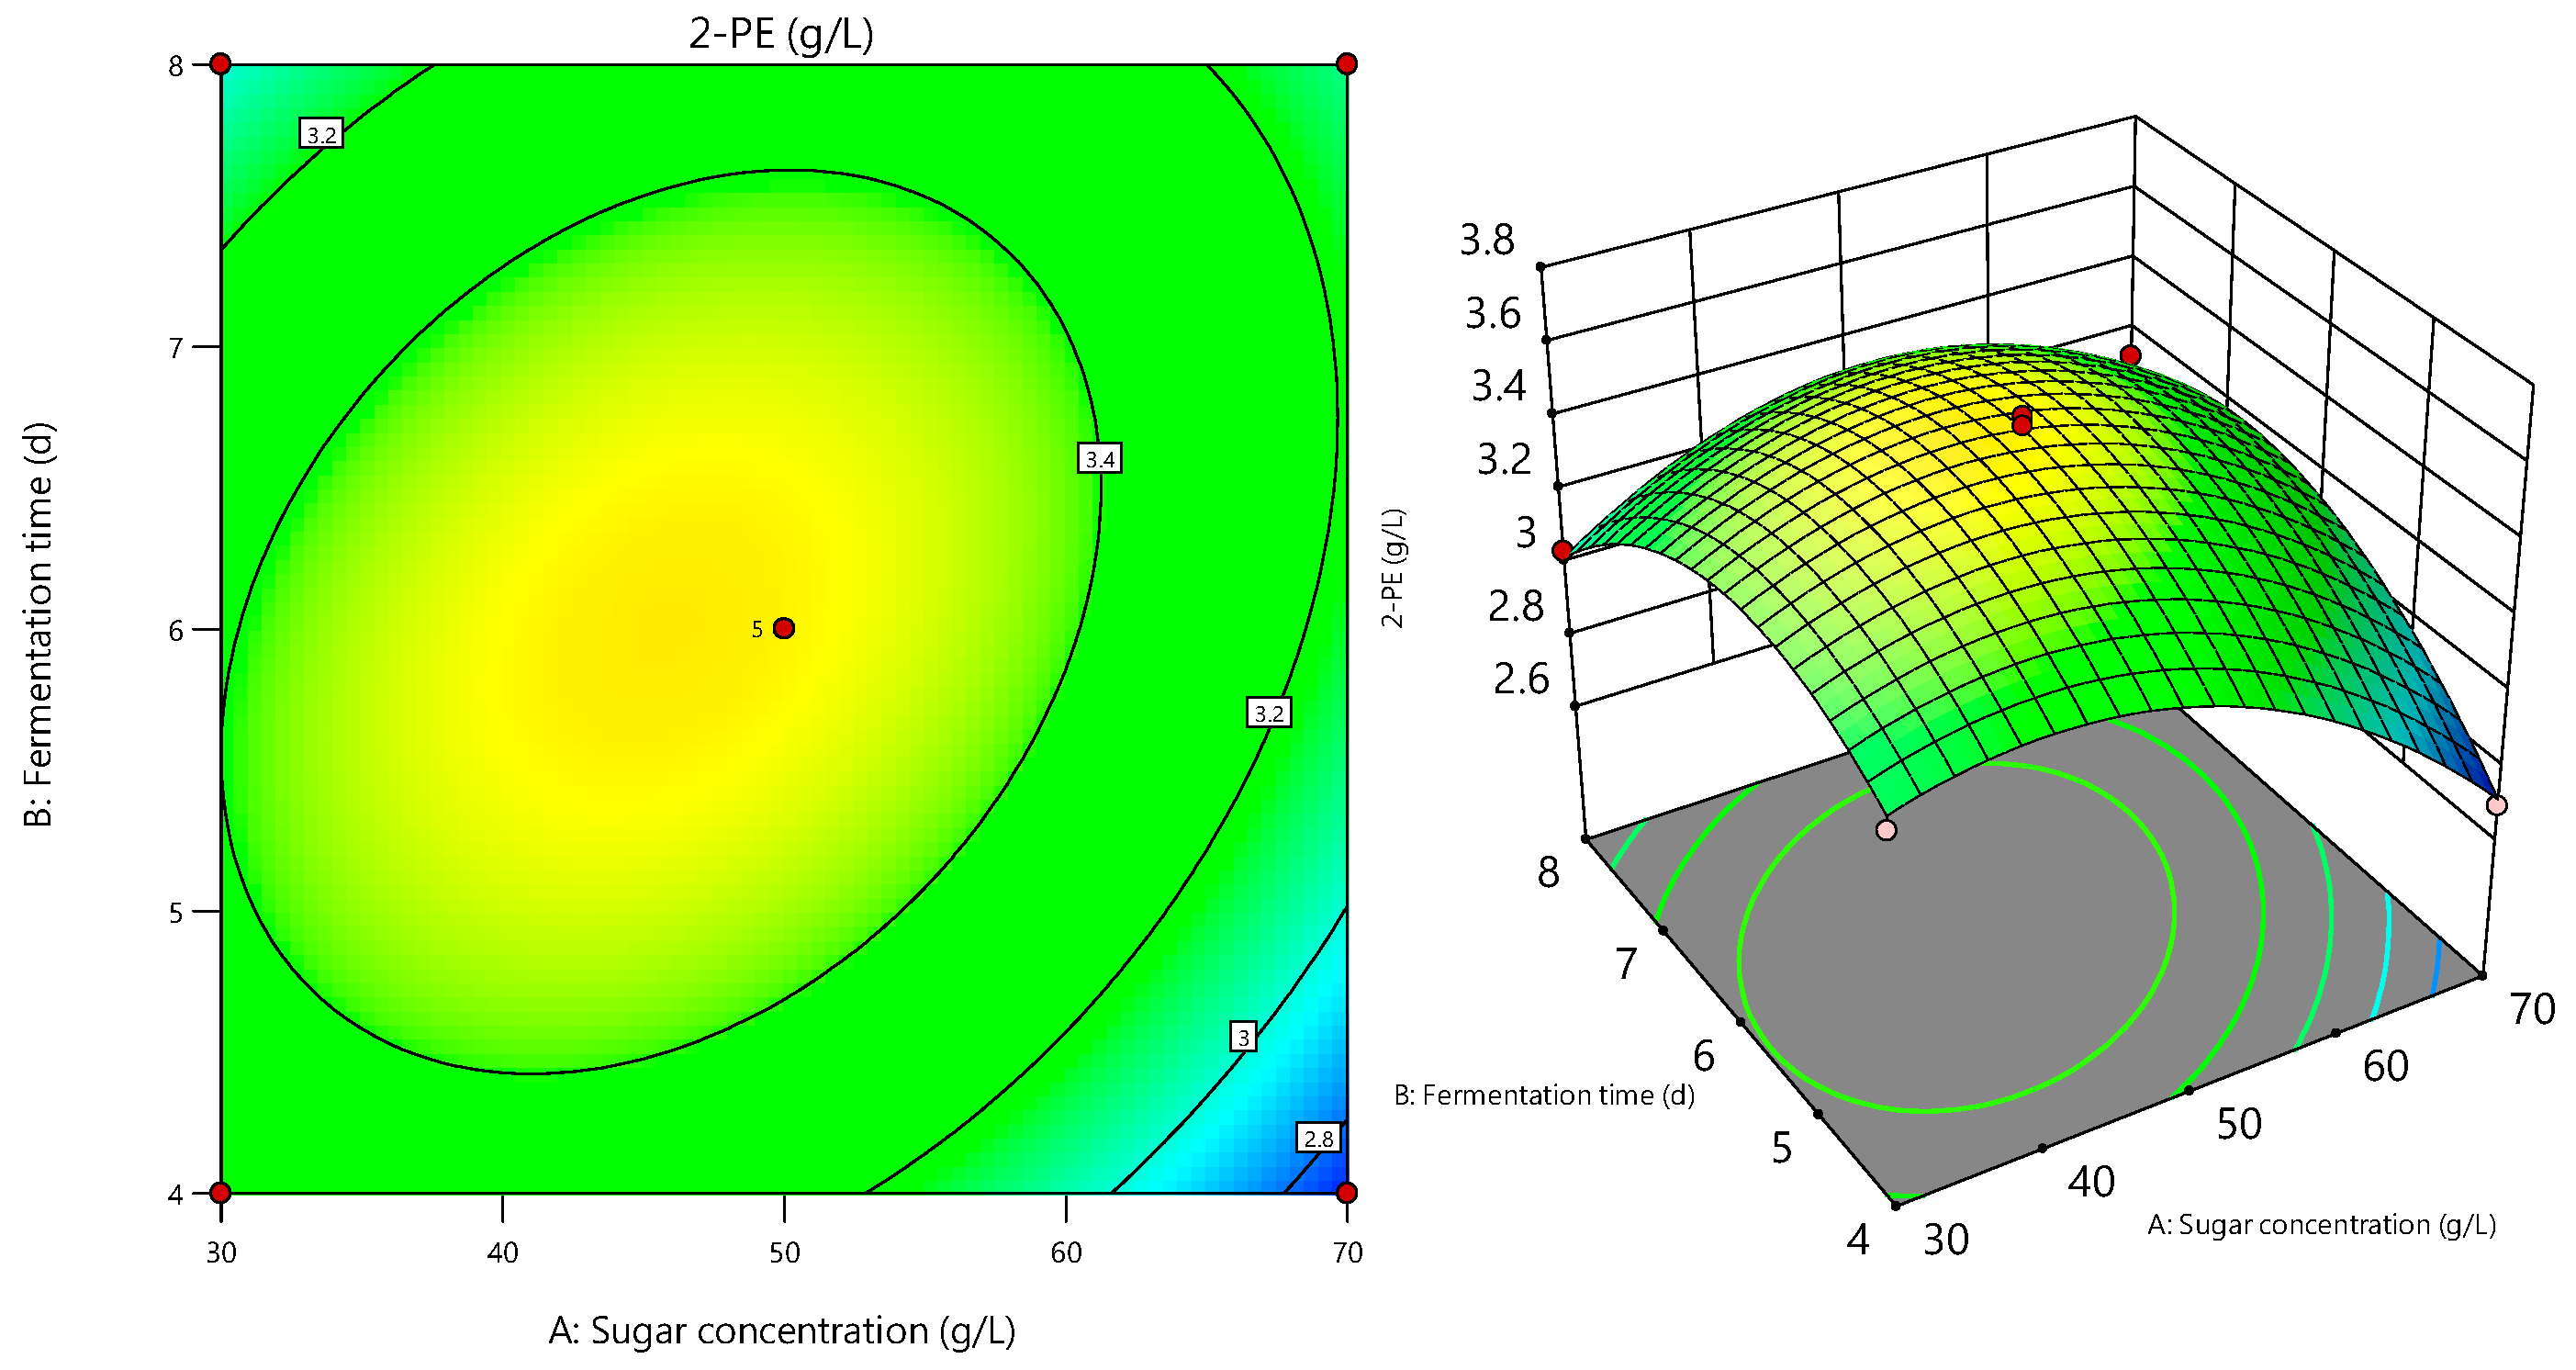
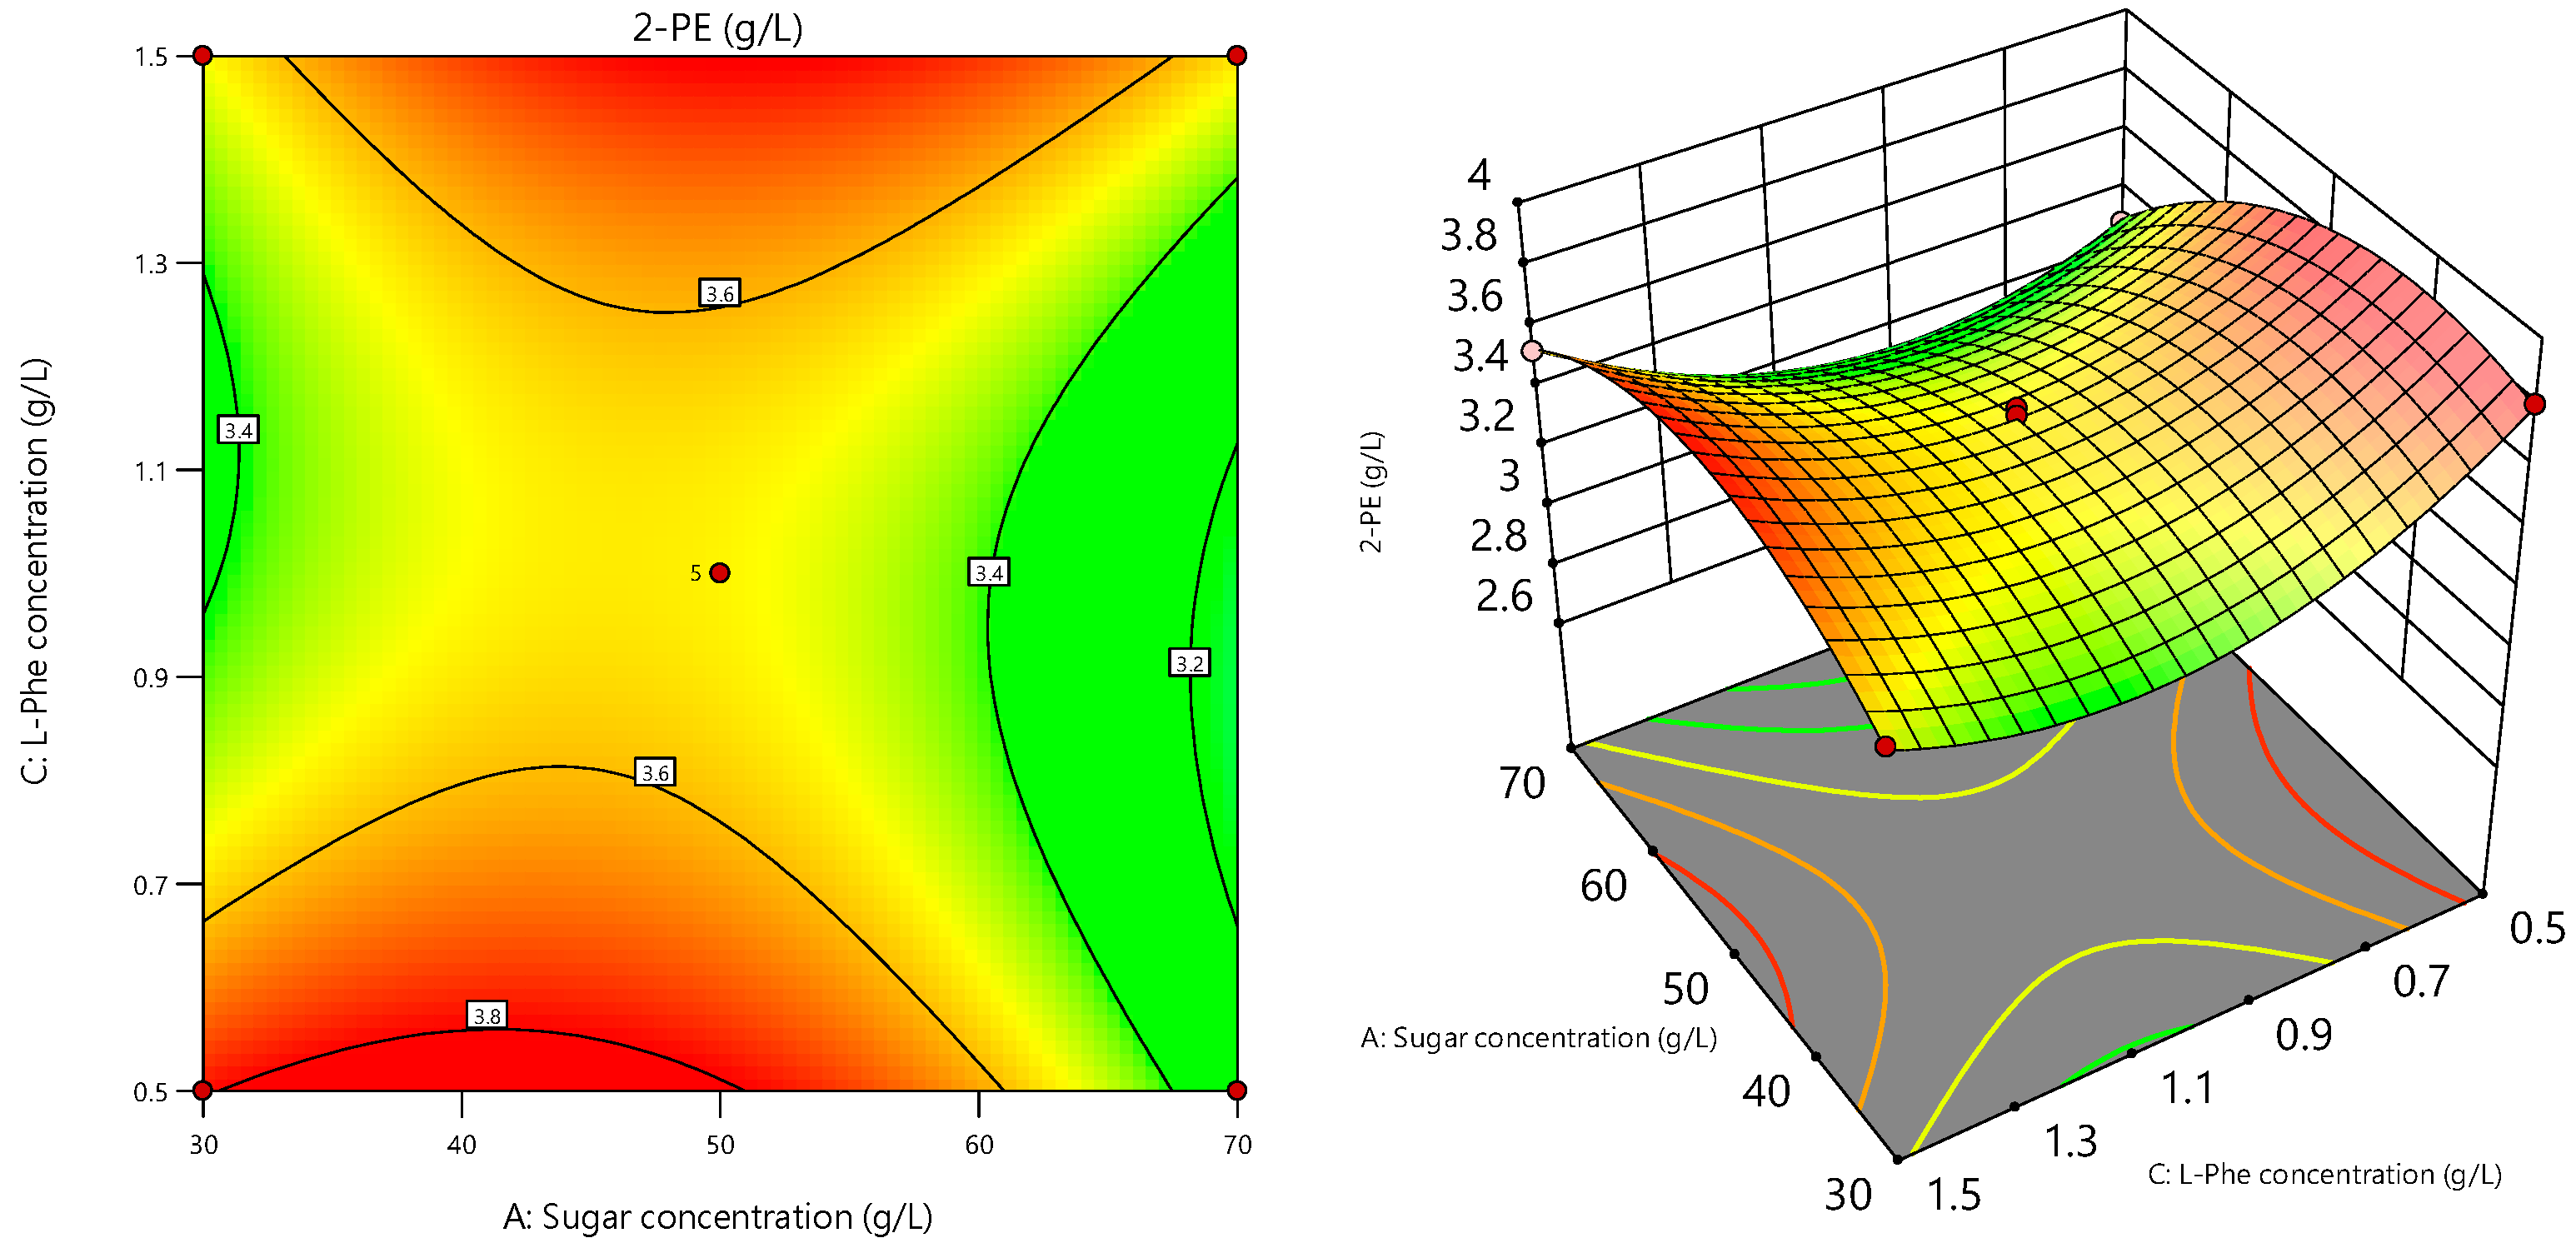
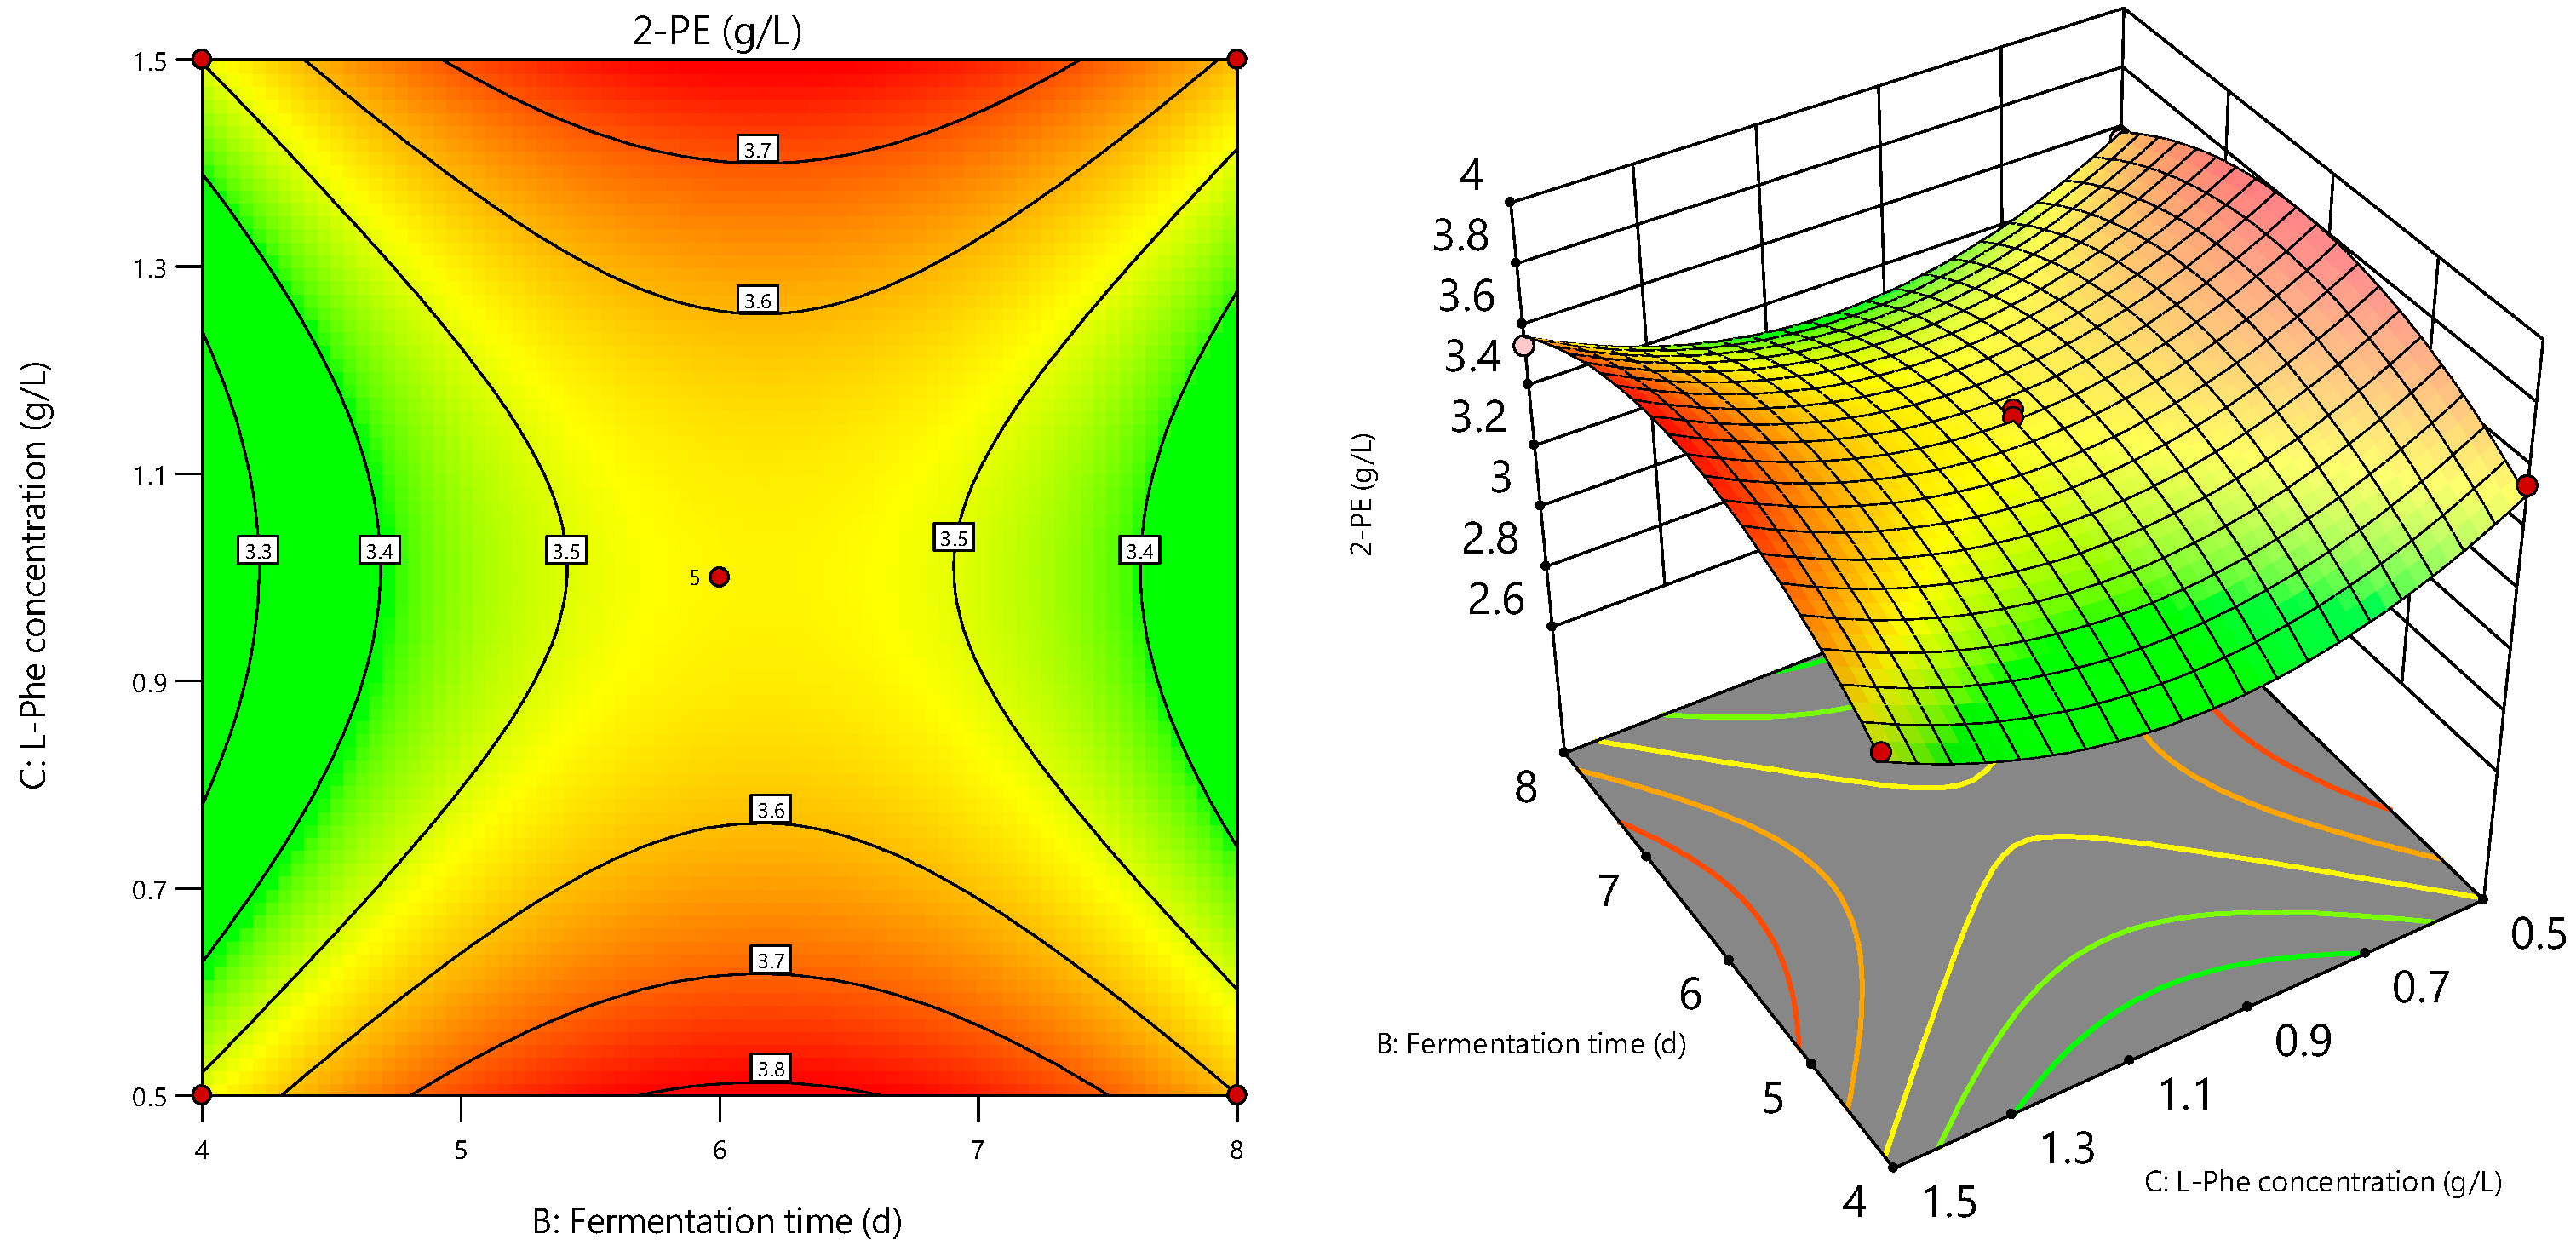
Based on the results in Table 2, three-dimensional response surface plots were generated using Design Expert to visualize the interaction effects between the investigating factors AB, AC, and BC, as shown in Figure 13, Figure 14 and Figure 15, respectively. According to the fundamental principles of the response surface methodology, circular contour lines typically indicate a minimal interaction between two factors, while elliptical or saddle-shaped contour lines suggest a significant interaction. Furthermore, a steep response surface indicates strong interaction between factors, whereas a flatter surface suggests weaker interaction [29,30].
As shown in Figure 13, at a constant fermentation time, 2-PE content first increased and then decreased as sugar concentration increased, and exhibited a similar trend at a constant sugar concentration as fermentation time was extended. The optimal sugar concentration supplied sufficient carbon sources for yeast growth, while excessive sugar induced osmotic stress and reduced metabolic activity. Short fermentation time led to insufficient 2-PE synthesis, whereas prolonged fermentation caused nutrient depletion and by-product accumulation. There was a significant interaction between sugar concentration and fermentation time, as reflected by elliptical contours and pronounced surface curvature. These two factors jointly regulated 2-PE biosynthesis, and their coordinated optimization enhanced 2-PE production.
As shown in Figure 14, at a constant L-Phe concentration, 2-PE content increased gradually as sugar concentration increased. At a constant sugar concentration, the 2-PE yield first increased and then decreased with increasing L-Phe concentration. The optimal L-Phe concentration served as a key precursor to facilitate 2-PE synthesis, while excessive addition inhibited yeast metabolism. The optimal sugar concentration strengthened microbial metabolism and further promoted product accumulation. Curved contours and a steep response surface revealed a significant interaction between sugar concentration and L-Phe concentration. When properly balanced, these two substrate concentrations effectively enhanced 2-PE production.
As shown in Figure 15, at a constant L-Phe concentration, 2-PE content first increased and then decreased as fermentation time prolonged. When fermentation time was constant, 2-PE content also rose first and fell later with the increase of L-Phe concentration. Yeast sufficiently converted the precursor within an appropriate fermentation time. It failed to achieve complete synthesis under insufficient time, whereas prolonged fermentation led to nutrient depletion and by-product accumulation. As a key precursor for 2-PE synthesis, a suitable L-Phe concentration can significantly promote product formation, while excessive concentration will cause metabolic inhibition. The two factors have a significant interaction, as evidenced by elliptical contours and obvious response surface changes. It is necessary to synergistically optimize fermentation time and L-Phe addition to achieve efficient accumulation of 2-PE.
Based on the above analysis, the optimal process conditions determined by the response surface model were as follows: sugar concentration of 46.28 g/L, fermentation time of 6.26 days, and L-Phe concentration of 1.43 g/L. Under these conditions, the maximum 2-PE content predicted by Design Expert 13 was 3.71 g/L. To validate the reliability of the predictions obtained by the response surface methodology, scale-up fermentation experiments were conducted under the above-mentioned conditions at 1 L scales. Specifically, with a sugar concentration of 46.30 g/L, a fermentation time of 6 days, and an L-Phe concentration of 1.43 g/L, the contents of 2-PE were 3.68 g/L. The experimental validation results was close to the predicted values, indicating that the response surface model established by the above experimental method is highly reliable and can be applied to the actual fermentation production of whisky. However, further pilot-scale or industrial-scale fermentation studies are needed to confirm the applicability of these optimized conditions in large-scale whisky production.

2.8. Sensory Evaluation and Off-Flavor Analysis of 2-PE Aroma Whisky

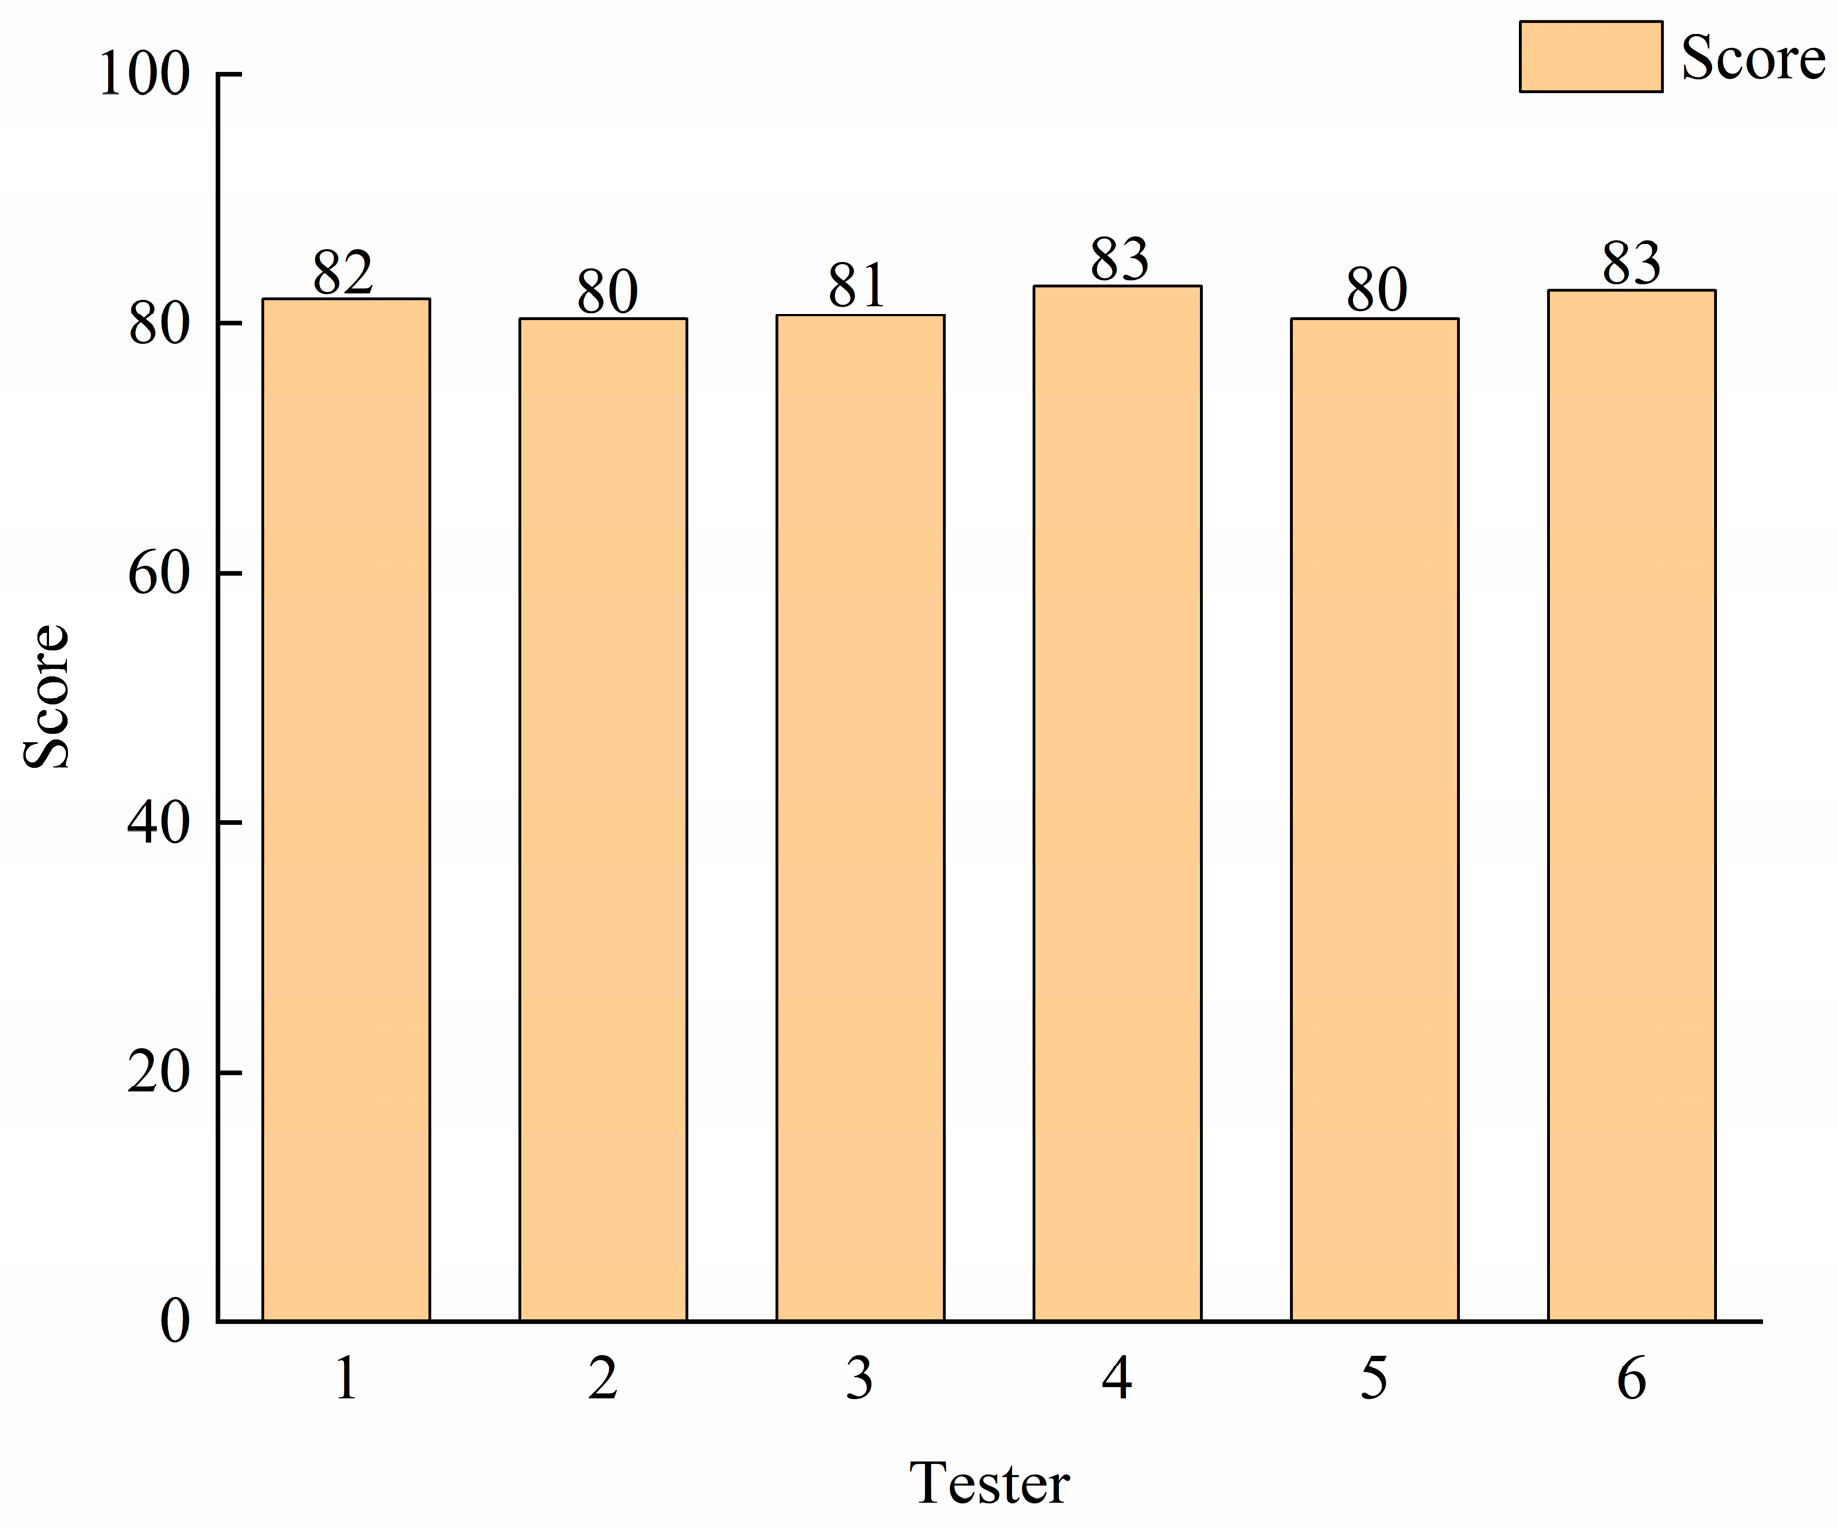
To evaluate the sensory characteristics and consumer acceptance of whisky produced by the recombinant strain SY-A8, the sensory properties (including taste and flavor) of the samples fermented under the optimal fermentation conditions determined by response surface methodology were systematically assessed in this study. The results are presented in Figure 16.
As shown in Figure 16, the sensory scores provided by six trained panelists were consistent, ranging from 80 to 83, with an average score of approximately 81.5. The evaluation results indicated that the whisky fermented by the recombinant strain SY-A8 exhibited a pronounced rose-like aroma and a rich alcoholic note that were well coordinated with the malt character; however, a slight bitterness was perceived in taste. We speculate that other higher alcohols produced by S. cerevisiae during fermentation may contribute to this slight bitterness in the spirit. Overall, the panelists gave relatively high ratings for the whisky’s taste, suggesting that the whisky produced by the recombinant strain is palatable and acceptable to consumers. The consistency of the panelists’ scores further highlights the stability and reliability of the final product quality, thus making it suitable for the development of 2-PE rose-aroma beverages.

3. Discussion

The primary biosynthetic pathways of 2-PE in S. cerevisiae SY-A8 are the shikimate pathway and the Ehrlich pathway [31]. The Ehrlich pathway, with its short metabolic route, is regulated by transaminases, decarboxylases, and alcohol dehydrogenases [32,33], as shown in Figure 1. The transaminase activity in this pathway is closely linked to cellular physiological growth, as it is tightly integrated with the TCA cycle through transamination with α-ketoglutarate [34]. The phenylpyruvate decarboxylase encoded by ARO10 primarily catalyzes the conversion of phenylpyruvate to phenylacetaldehyde [34,35]. A previous study demonstrated that in ∆ARO8 and ∆ARO9 strains, the expression of ARO10 increased significantly by up to sixfold, and the 2-PE production in ∆ARO8 and ∆ARO9 increased by 85% and 38%, respectively [36]. To investigate whether ARO8 deletion affects the expression of other genes in the Ehrlich pathway, we measured the expression levels of ARO9 and ARO10 by qPCR. The results showed that ARO9 and ARO10 were approximately upregulated by 3.4-fold and 1.4-fold, respectively, in the SY-A8 strain compared to the original strain SY. We suggest that deletion of ARO8 reduces the conversion of phenylpyruvate to L-Phe, while the increased expression of ARO10 promotes the formation of phenylacetaldehyde, thereby enhancing 2-PE synthesis via carbohydrate metabolism. This interpretation suggests that the observed changes in gene expression contribute to increased 2-PE production, though further research is warranted to confirm this mechanistic relationship.
However, the Ehrlich pathway relies on exogenous L-Phe supplementation, which is economically unfavorable for industrial-scale production. In contrast, the shikimate pathway enables de novo synthesis of 2-PE directly from glucose, bypassing the need for expensive precursor addition [34,37]. Recent studies have demonstrated that the two pathways can operate cooperatively under specific conditions. Zhang et al. [38] reported that corn steep liquor activates the expression of both shikimate and Ehrlich pathway genes (including aro4, aro8, and aro9), thereby promoting 2-PE synthesis through both routes. Yang et al. [34] demonstrated that when the shikimate and Ehrlich pathways coexist, the theoretical conversion yield of 2-PE can be exceeded, achieving a titer of 12.1 g/L in fed-batch fermentation. Beyond transcriptional regulation, additional layers of control, such as post-translational modifications of key enzymes (e.g., aro8, aro9, and aro10) and allosteric feedback inhibition by pathway intermediates, may also play important roles in modulating 2-PE biosynthesis. Furthermore, transcription factors including Aro80, Cat8, and Mig1 are known to regulate the expression of ARO9 and ARO10 in response to nitrogen availability and carbon source, suggesting that the regulatory network governing the Ehrlich pathway is multifaceted and warrants deeper investigation [14,21,22,39]. In our study, ARO8 deletion combined with process optimization yielded 3.68 g/L 2-PE, a substantial improvement over the original strain. Further enhancement could be achieved by co-engineering the shikimate pathway, for example, by relieving feedback inhibition of ARO3 and ARO4 and strengthening precursor supply [35,39].
In previous studies, Wu et al. [40] constructed a high 2-PE-yield strain via mutation breeding. After optimizing aerobic and anaerobic fermentation processes, the maximum content of 2-PE was 1.69 g/L in distilled liquor (30% vol). Our results showed that the 2-PE content in whisky fermented by SY-A8 was 0.73 g/L, an increase of 23.73% compared to SY. This indicated that the upregulated expression of ARO10 promoted 2-PE biosynthesis. The fermentation conditions of SY-A8 were optimized through single-factor experiments and the Box–Behnken design. The optimal conditions were a sugar concentration of 46.30 g/L, a fermentation time of 6 days, and an L-Phe concentration of 1.43 g/L. The high 2-PE aroma whisky was brewed with a higher 2-PE content of 3.68 g/L in a 1 L fermenter at the optimal conditions. In conclusion, ARO8 deletion combined with fermentation optimization enabled S. cerevisiae to efficiently produce 2-PE, increasing the concentration of 2-PE in whisky to 3.68 g/L.
Our results indicated that deletion of the ARO8 gene contributed to the upregulation of ARO9 and ARO10, and improved the production of 2-PE in distilled liquor. Although these findings support the effectiveness of the strain modification, a more systematic investigation of the related metabolic flux and comprehensive molecular regulatory mechanism will be further explored and supplemented in future studies to achieve a deeper understanding of 2-PE biosynthesis.

4. Materials and Methods

4.1. Materials and Reagents

4.1.1. The Construction of Strains and Plasmids

The strains and plasmids used in this study are listed in Table S3. Escherichia coli match-T1 with the p426-gRNA-ARO8-kanMX plasmid was grown in LB medium supplemented with 100 µg/mL ampicillin (Aladdin, Shanghai, China) at 37 °C for 12–16 h. S. cerevisiae SY was incubated at 30 °C for 12 h in YPD medium containing 100 µg/mL G418 sulfate (Aladdin, Shanghai, China) to select for positive transformants [41].

4.1.2. Primer Design

The primers used in this study are listed in Table S4. The ARO8 gene sequence of S. cerevisiae (S288c) was obtained from the National Center for Biotechnology Information (NCBI). The primers were designed using SnapGene 5.2.0 software and synthesized by Shanghai Bioengineering Technology Co., Ltd. (Shanghai, China) [29].

4.2. Construction of the CRISPR-Cas9 System

CRISPR-Cas9 is a gene editing technology involving two fundamental components: a guide RNA matching the target gene, and a nucleic acid endonuclease Cas9, causing a double-stranded DNA break and modifying the genome [42].
When constructing the Cas9 expression plasmid, the fragments containing the Cas9 gene and the bleomycin resistance gene (BleoR gene) were obtained by PCR amplification of the p414-Cas9 plasmid and pPICZ (alpha) plasmid as templates [43]. The purified fragments were ligated in vitro with a homologous recombination kit. These ligation products were then transformed into competent E. coli cells to screen for positive colonies. Subsequently, the Cas9 expression plasmid p414-Cas9-BleoR was purified using a plasmid extraction kit (Thermo Fisher, Shanghai, China) [29].
To construct the gRNA expression plasmid, the original target site was substituted with the ARO8 specific sequence. SnapGene 5.2.0 software was used to identify the protospacer adjacent motif (PAM; 5′-NGG-3′ or 5′-NAG-3′) within the ARO8 gene, and a 20-nucleotide guide sequence was selected immediately upstream of the PAM. The 60 bp fragment containing the 20 nt ARO8 target sequence was obtained by overlap extension PCR (98 °C for 3 min, followed by 30 cycles consisting of 98 °C for 10 s, 55 °C for 5 s, 72 °C for 10 s, and a final extension at 72 °C for 2 min). The vector fragment (6375 bp) was obtained by PCR amplification with primers DPD-F/DPD-R (98 °C for 3 min, followed by 30 cycles consisting of 98 °C for 10 s, 55 °C for 15 s, 72 °C for 7 min, and a final extension at 72 °C for 9 min) and template gRNA plasmid p426-gRNA-kanMX [31]. A pair of primers, each containing a 20 bp sequence homologous to the target regions, was designed for the 6395 bp vector fragment and the 60 bp fragment. Following purification, in vitro assembly of these two fragments was carried out using the ClonExpress® II One Step Cloning Kit (Vazyme, Nanjing, China). The ligation product was then introduced into Escherichia coli match-T1 competent cells. Through this process, we obtained the gRNA expression plasmid p426-gRNA-ARO8-kanMX, which is designed to specifically recognize the ARO8 target sequence [29].
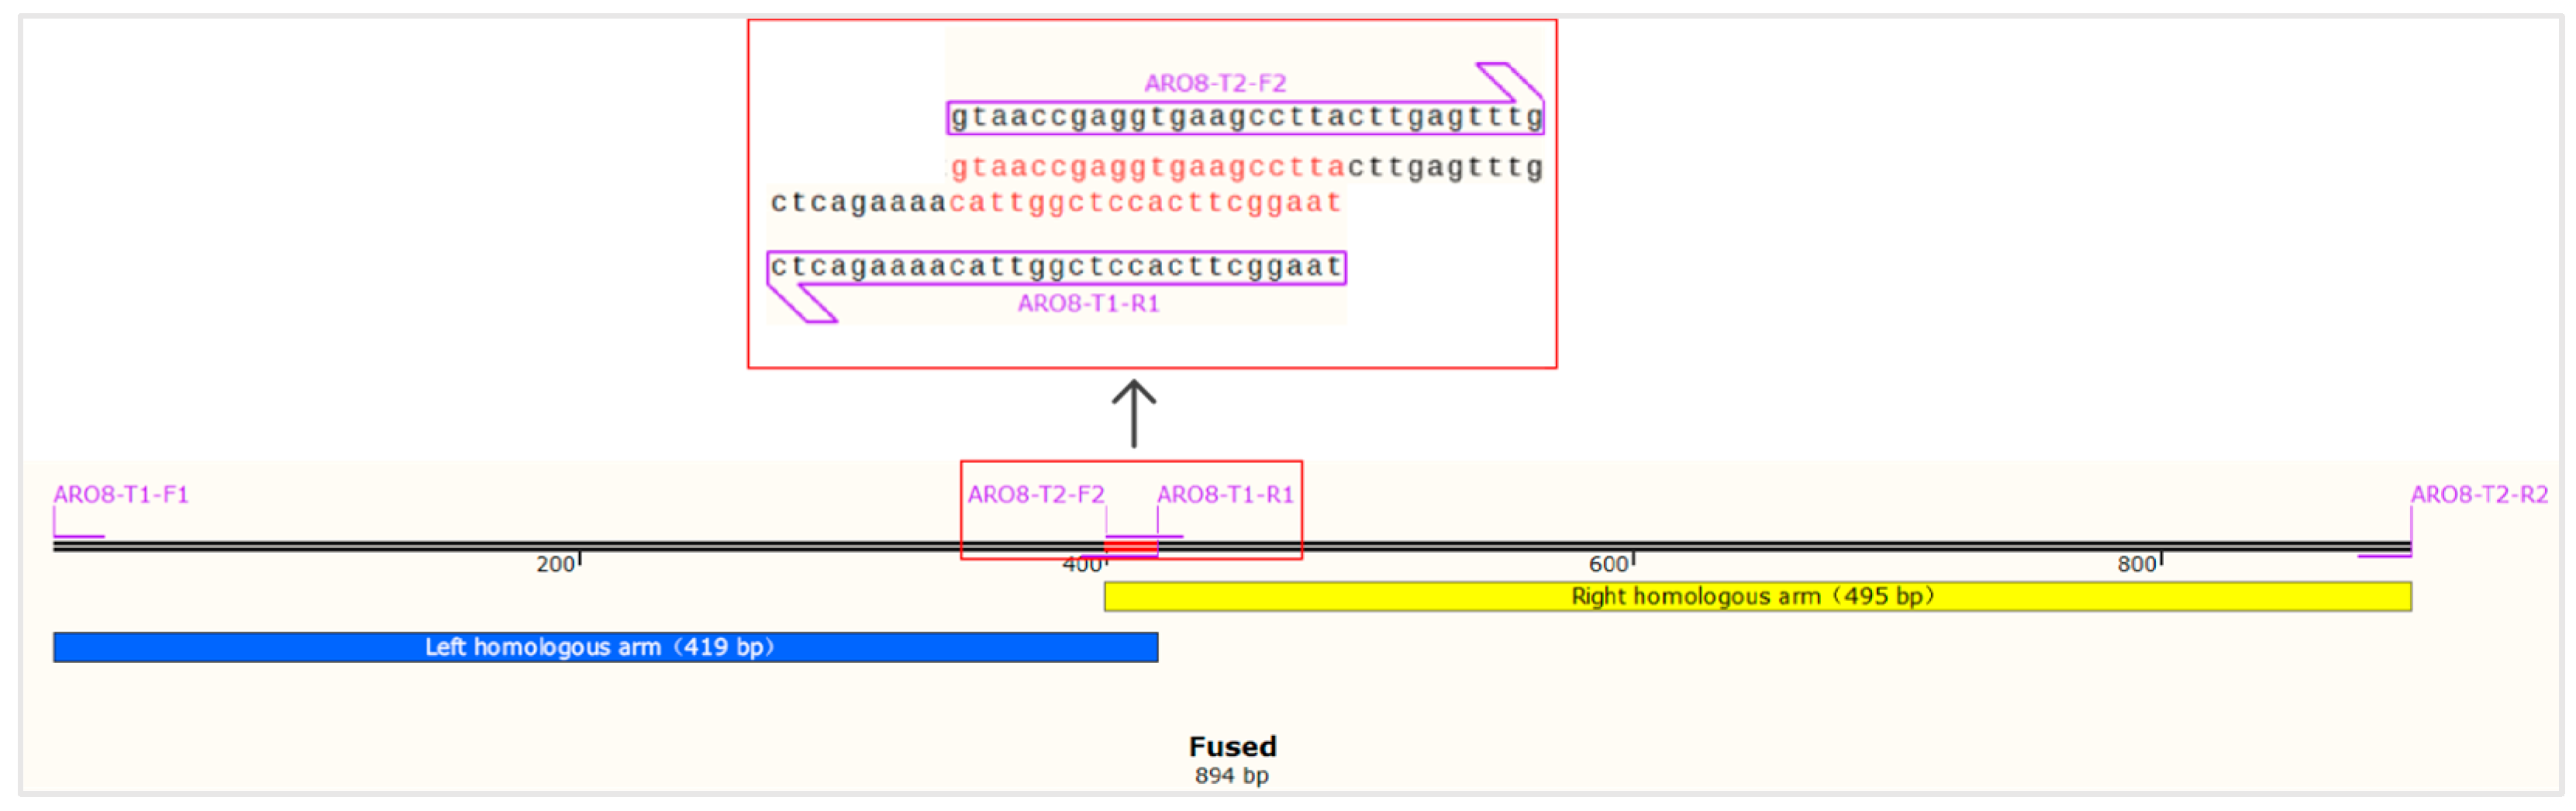
ARO8 Donor DNA Design (Figure 17): Using the SY genome as a template, the upstream and downstream homologous arms of the ARO8 target sequence were amplified by PCR with primer pairs ARO8-T1-F1/R1 and ARO8-T2-F2/R2 (98 °C for 3 min, followed by 30 cycles consisting of 98 °C for 10 s, 55 °C 15 s, 72 °C for 10 s, and a final extension at 72 °C for 1 min), respectively (20 bp of homology was set at the 5′end of primers ARO8-T1-R1 and ARO8-T2-F2). Subsequently, the two fragments were connected by overlap extension PCR (98 °C for 3 min, followed by 30 cycles consisting of 98 °C for 10 s, 55 °C for 15 s, 72 °C for 1 min, and a final extension at 72 °C for 3 min). Finally, the ARO8 donor DNA was obtained [29].

4.3. Electro Transformation of SY

The purified p414-Cas9-BleoR plasmid was transformed into the SY by electrotransformation. The transformed S. cerevisiae were cultured in YPD medium (200 µg/mL Zeocin™) (Thermo Fisher, Shanghai, China) at 30 °C for 48 h. Then, the positive transformants were selected by colony PCR. The SY with the p414-Cas9-BleoR plasmid was made into an electrocompetent yeast. It was mixed with p426-gRNA-ARO8-kanMX plasmid and donor DNA at a 1:10 (v/v) ratio to perform electroporation (Electroporation apparatus, 1.5 kV, 5 ms, Thermo Fisher, Shanghai, China). The transformed S. cerevisiae was cultured in YPD medium (100 µg/mL G418 sulfate) at 30 °C for 1–2 days. Then, the positive transformants were selected by colony PCR [29]. (Zeocin™: Thermo Fisher, Shanghai, China).

4.4. Screening and Validation of the Knockout Strain

The positive transformants were validated by PCR with primers ARO8-YZ-F and ARO8-YZ-R (3 min at 98 °C, followed by 30 cycles consisting of 98 °C for 10 s, 55 °C for 15 s, 72 °C for 2 min, and a final extension at 72 °C for 4 min) [29].

4.5. Fermentation and Determination of 2-PE

4.5.1. Wort Preparation

Malt powder was mixed with water at a ratio of 1:4 (kg/L) and stirred to initiate saccharification. The saccharification process consisted of heating the mixture sequentially at 53 °C for 60 min, 65 °C for 60 min, and finally at 72 °C for 20 min. The resulting mixture was then filtered through four layers of sterile gauze. After preparation, the wort medium was stored at −20 °C until further use [29].

4.5.2. Yeast Inoculation and Fermentation

The wort was prepared and adjusted to a concentration of 8% (w/v), and sugar was added to 50 g/L. The broth was brought to a final volume of 100 mL in a sterile 100 mL graduated cylinder. The inoculum suspension was centrifuged at 10,000 rpm for 5 min, and the cell pellet was collected. The pellet was washed twice with sterile deionized water and then resuspended in the fermented wort. Both strains, SY and SY-A8, were inoculated into the wort broth at an inoculum size of 5 × 10⁶ cells/mL. The cultures were then incubated at 28 °C for 7 days. The fermentation broth was gently shaken every 24 h throughout the incubation period to maintain homogeneous fermentation. After fermentation, the 2-PE content was measured by liquid chromatography.

4.5.3. Determination Methods of 2-PE

The content of 2-PE in whisky was determined using an external standard method by high-performance liquid chromatography (HPLC). The chromatographic conditions were as follows: chromatographic column: Ultimate XB-C18 (4.6 mm × 250 mm, 5 μm); column temperature: 25 °C; mobile phase: methanol–water (55:45, v/v); flow rate: 1.0 mL/min; detection wavelength: 210 nm. Prior to analysis, the samples were diluted with the mobile phase and filtered through a 0.45 μm membrane [44].

4.6. Quantification of the Relative Expression Levels of the ARO8 Gene

Total RNA was extracted from the yeast strains using a total RNA extraction kit (Sangon, Shanghai, China). The relative expression level of the ARO8 gene was then determined by qPCR using total RNA extracted from SY and SY-A8 as templates. The qPCR (30 s at 95 °C, and then 40 cycles of 95 °C for 10 s, 55 °C for 15 s, 72 °C for 15 s) with template of total RNA extracted from the SY and SY-A8 [29].

4.7. Discard Plasmids

The gene knockout strains were cultured in 5 mL of YPD broth at 30 °C for 24 h. They were then subcultured for more than 15 generations. Subsequently, the plasmid-depleted strain was screened on YPD medium containing 100 µg/mL G418 sulfate [29].

4.8. Determination of Growth Curve

The yeast seed culture was inoculated into 100 mL YPD medium and incubated at 30 °C, 200 r/min. Then, OD600nm was determined every 2 h [43].

4.9. Optimization of Fermentation Conditions [29]

4.9.1. Fermentation with Different S. cerevisiae Inoculum Size

The SY-A8 was inoculated in 8% (w/v) wort, adding 50 g/L sugar with inoculum size 5 × 10⁶, 7.5 × 10⁶, 10 × 106, 12.5 × 10⁶ and 15 × 106 cells/mL, respectively. Then, it was fermented at 28 °C for 7 days.

4.9.2. Fermentation with Different Wort pH

The pH of 8% (w/v) wort broth, adding 50 g/L sugar, was adjusted to 4.3, 4.8, 5.3, 5.8 and 6.3, respectively. Then, it was fermented by SY-A8 at 28 °C for 7 days.

4.9.3. Fermentation with Different Sugar Concentration

The 8% (w/v) wort broth was added with different sugar concentrations of 10, 30, 50, 70, and 90 g/L, respectively. Then, it was fermented by SY-A8 at 28 °C for 7 days.

4.9.4. Fermentation with Different Fermentation Times

The 8% (w/v) wort, adding 50 g/L sugar, was fermented by SY-A8 at 28 °C for 4, 5, 6, 7, and 8 days, respectively.

4.9.5. Fermentation with Different L-Phe Concentration

The 8% (w/v) wort, adding 50 g/L sugar, was added with different L-Phe concentrations of 0, 1, 3, 5, 7, 9, 11, and 13 g/L, respectively. Then, it was fermented by SY-A8 at 28 °C for 6 days.

4.10. Response Surface Optimization Experiment

A total of 17 experiments were conducted by the Box–Behnken design for the response surface methodology. As shown in Table 3, the design included three factors at three levels: sugar concentration (A), fermentation time (B), and L-Phe concentration (C). The levels were set at −1, 0, and 1, with the 2-PE content (Y) as the response variable. This approach was employed to optimize the experimental conditions through response surface optimization.

4.11. Sensory Evaluation and Off-Flavor Analysis of Whisky

The organoleptic characteristics of samples fermented under the optimal conditions determined by response surface methodology were evaluated by a trained sensory panel consisting of six members with expertise in brewing science: two supervisors, two corporate wine tasters, and two graduate students. The sessions were conducted in a well-lit, quiet, and controlled laboratory environment to minimize external interference. Following established sensory protocols for fermented beverages, the samples were assessed across four primary dimensions, including clarity, color, aroma, and flavor, based on the scoring criteria specified in Table 4. The final sensory score for each attribute was calculated as the arithmetic mean of all individual ratings, rounded to the nearest integer [45,46,47].

4.12. Data Processing

Due to the varying degrees of fermentation in the experimental samples, the results were uniformly converted and analyzed under a 50% vol alcohol system [29]. Each experiment was conducted in triplicate. Significance analysis was performed using SPSS v.27.0; a p-value of less than 0.05 was considered statistically significant. Origin v.10.1 and other software were used for plotting bar charts and line charts.

5. Conclusions

The SY-A8 with gene knockout of ARO8 was successfully constructed by CRISPR-Cas9 in this study. Knockout of the ARO8 gene not only reduced the expression of ARO8 but also simultaneously upregulated the expression of ARO9 and ARO10 in SY-A8. Then, the fermentation conditions of SY-A8 were optimized through single-factor experiments and the Box–Behnken design. The optimal conditions were a sugar concentration of 46.30 g/L, a fermentation time of 6 days, and an L-Phe concentration of 1.43 g/L. The high 2-PE aroma whisky was brewed with a higher 2-PE content of 3.68 g/L in a 1 L fermenter at the optimal conditions, an increase of 404.11% compared to the pre-optimization level. These findings suggest that genetic modification of the Ehrlich pathway in S. cerevisiae is an effective strategy for boosting 2-PE biosynthesis. This study provides a technical basis for improving the aroma of whisky and other brewed wines. Future research will focus on exploring combinatorial genetic modifications and scaled-up fermentation processes to promote industrial application.

Supplementary Materials

The following supporting information can be downloaded at: https://www.mdpi.com/article/10.3390/ijms27114759/s1.

Author Contributions

K.T. was responsible for conceptualization, methodology, software, formal analysis, data curation, visualization, and original draft preparation. K.T., Z.D. and X.L. contributed to validation and investigation. K.T. and S.Z. reviewed and edited the manuscript. S.Z. provided resources, supervised the study, administered the project, and acquired the funding. All authors have read and agreed to the published version of the manuscript.

Funding

This research was supported by the National Natural Science Foundation of China (Grant No. 51878291).

Institutional Review Board Statement

Not applicable.

Informed Consent Statement

Not applicable.

Data Availability Statement

The original contributions presented in the study are included in the article. Further inquiries can be directed to the corresponding author.

Acknowledgments

All authors have reviewed and approved the final manuscript and assume full responsibility for the information presented in this publication.

Conflicts of Interest

The authors declare no conflicts of interest.

Abbreviations

The following abbreviations are used in this manuscript:
2-PE2-phenylethanol
L-PheL-phenylalanine

References

  1. Chen, X.R.; Wang, Z.Y.; He, X.P. Advances in biosynthesis of 2-PE by yeasts. China J. Biotech. 2016, 32, 1151–1163. [Google Scholar]
  2. Wang, Q.; Mao, Y.; Zhao, Y.Y.; Wang, Q.; Mao, Y.; Zhao, Y.Y.; Deng, Y. Research on synthesis of 2-phenylethanol by a wild-type aroma-producing yeast through biotransformation method. Food Ferment. Ind. 2025, 51, 22–28. [Google Scholar]
  3. Tian, R.; Han, J.; Li, W.B.; Tian, R.; Han, J.; Li, W.B.; Chen, W.T.; Bai, M.H.; Hou, Y.H.; Zhang, X.Q. Impact of 2-Phenylethanol Treatment on Disease Inhibition and Quality of Post-harvest Prune Fruits. Storage Process 2025, 25, 12–20. [Google Scholar]
  4. Bernardino, A.R.S.; Torres, C.A.V.; Crespo, J.G.; Bernardino, A.R.S.; Torres, C.A.V.; Crespo, J.G.; Reis, M.A. Biotechnological 2-Phenylethanol Production: Recent Developments. Molecules 2024, 29, 5761. [Google Scholar] [CrossRef]
  5. Kim, T.Y.; Lee, S.W.; Oh, M.K. Biosynthesis of 2-phenylethanol from glucose with genetically engineered Kluyveromyces marxianus. Enzym. Microb. Technol. 2014, 61, 44–47. [Google Scholar] [CrossRef]
  6. Mei, W. The Comparison in Methods of the Testing 2-phenylethanol in Wine by GC. Food Ind. 2008, 01, 74–75. [Google Scholar]
  7. Guo, S.; Wang, D.; Li, Y.; Guo, S.; Wang, D.; Li, Y.; Li, J.; Du, J. Comparison of Aroma Profiles of Whiskeys Fermented from Different Grain Ingredients. Foods 2024, 13, 2031. [Google Scholar] [CrossRef]
  8. Poisson, L.; Schieberle, P. Characterization of the Key Aroma Compounds in an American Bourbon Whisky by Quantitative Measurements, Aroma Recombination, and Omission Studies. Agric. Food Chem. 2008, 56, 5820–5826. [Google Scholar] [CrossRef]
  9. Sun, M.; Yao, L.Y.; Yu, C.; Shen, X.; Wang, H.; Zhuang, H.; Yao, L.; Sun, M.; Yu, C.; Feng, T. Comparative analysis of the aromatic profile of single malt whiskies from different regions of Scotland using GC-MS, GC-O-MS and sensory evaluation. J. Food Compos. Anal. 2024, 133, 106465. [Google Scholar]
  10. Wang, Y.; Zhang, Z.; Lu, X.; Wang, Y.; Zhang, Z.; Lu, X.; Zong, H.; Zhuge, B. Genetic engineering of an industrial yeast Candida glycerinogenes for efficient production of 2-phenylethanol. Appl. Microbiol. Biotechnol. 2020, 104, 10481–10491. [Google Scholar] [CrossRef] [PubMed]
  11. Zhu, L.; Xu, S.; Li, Y.; Zhu, L.; Xu, S.; Li, Y.; Shi, G. Improvement of 2-phenylethanol production in Saccharomyces cerevisiae by evolutionary and rational metabolic engineering. PLoS ONE 2021, 16, e0258180. [Google Scholar] [CrossRef]
  12. Yin, S.; Zhou, H.; Xiao, X.; Yin, S.; Zhou, H.; Xiao, X.; Lang, T.; Liang, J.; Wang, C. Improving 2-phenylethanol production via Ehrlich pathway using genetic engineered Saccharomyces cerevisiae strains. Curr. Microbiol. 2015, 70, 762–767. [Google Scholar] [CrossRef]
  13. Jin, D.; Gu, B.; Xiong, D.; Jin, D.; Gu, B.; Xiong, D.; Huang, G.; Huang, X.; Liu, L.; Xiao, J. A transcriptomic analysis of Saccharomyces cerevisiae under the stress of 2-phenylethanol. Curr. Microbiol. 2018, 75, 1068–1076. [Google Scholar] [CrossRef]
  14. Zhu, L.; Wang, J.; Xu, S.; Zhu, L.; Wang, J.; Xu, S.; Shi, G. Improved aromatic alcohol production by strengthening the shikimate pathway in Saccharomyces cerevisiae. Process Biochem. 2021, 103, 18–30. [Google Scholar] [CrossRef]
  15. Shen, L.; Nishimura, Y.; Matsuda, F.; Shen, L.; Nishimura, Y.; Matsuda, F.; Ishii, J.; Kondo, A. Overexpressing enzymes of the Ehrlich pathway and deleting genes of the competing pathway in Saccharomyces cerevisiae for increasing 2-phenylethanol production from glucose. J. Biosci. Bioeng. 2016, 122, 34–39. [Google Scholar] [CrossRef]
  16. Qian, X.; Yan, W.; Zhang, W.; Qian, X.; Yan, W.; Zhang, W.; Dong, W.; Ma, J.; Ochsenreither, K.; Xin, F. Current status and perspectives of 2-phenylethanol production through biological processes. Crit. Rev. Biotechnol. 2019, 39, 235–248. [Google Scholar] [CrossRef]
  17. Wang, Z.; Jiang, M.; Guo, X.; Wang, Z.; Jiang, M.; Guo, X.; Liu, Z.; He, X. Reconstruction of metabolic module with improved promoter strength increases the productivity of 2-phenylethanol in Saccharomyces cerevisiae. Microb. Cell Factories 2018, 17, 60. [Google Scholar] [CrossRef]
  18. Zhu, Z.; Fang, S.; Huang, P.; Zhu, Z.; Fang, S.; Huang, P.; Luo, D.; Qi, X. CRISPRa-Mediated Triple-Gene Activation of ARO10, ARO80, and ADH2 for Enhancing 2-Phenylethanol Biosynthesis via the Ehrlich Pathway in Saccharomyces cerevisiae. Fermentation 2025, 11, 345. [Google Scholar] [CrossRef]
  19. Gu, Y.; Ma, J.; Zhu, Y.; Gu, Y.; Ma, J.; Zhu, Y.; Xu, P. Refactoring Ehrlich pathway for high-yield 2-phenylethanol production in Yarrowia lipolytica. ACS Synth. Biol. 2020, 9, 623–633. [Google Scholar] [CrossRef]
  20. Kim, B.; Cho, B.R.; Hahn, J.S. Metabolic engineering of Saccharomyces cerevisiae for the production of 2-phenylethanol via Ehrlich pathway. Biotechnol. Bioeng. 2014, 111, 115–124. [Google Scholar] [CrossRef]
  21. Wang, Z.; Bai, X.; Guo, X.; Wang, Z.; Bai, X.; Guo, X.; He, X. Regulation of crucial enzymes and transcription factors on 2-phenylethanol biosynthesis via Ehrlich pathway in Saccharomyces cerevisiae. J. Ind. Microbiol. Biotechnol. 2017, 44, 129–139. [Google Scholar] [CrossRef]
  22. Hazelwood, L.A.; Daran, J.M.; van Maris, A.J.A.; Hazelwood, L.A.; Daran, J.M.; Van Maris, A.J.; Pronk, J.T.; Dickinson, J.R. The Ehrlich pathway for fusel alcohol production: A century of research on Saccharomyces cerevisiae metabolism. Appl. Environ. Microbiol. 2008, 74, 2259–2266. [Google Scholar] [CrossRef]
  23. Dickinson, J.R.; Salgado, L.E.J.; Hewlins, M.J.E. The catabolism of amino acids to long chain and complex alcohols in Saccharomyces cerevisiae. J. Biol. Chem. 2003, 278, 8028–8034. [Google Scholar] [CrossRef]
  24. Muzio, G.; Maggiora, M.; Paiuzzi, E.; Muzio, G.; Maggiora, M.; Paiuzzi, E.; Oraldi, M.; Canuto, R.A. Aldehyde dehydrogenases and cell proliferation. Free Radic. Biol. Med. 2012, 52, 735–746. [Google Scholar] [CrossRef]
  25. Liang, J.; Yin, S.; Liu, L.; Liang, J.R.; Yin, S.; Liu, L.; Wang, C.; Wen, Y. Over-expression of the Decarboxylase Gene ARO10 and its influence on β-phenethyl alcohol biosynthesis in Saccharomyces cerevisiae. Sci. Technol. Food Ind. 2014, 35, 155–159. [Google Scholar]
  26. Romagnoli, G.; Knijnenburg, T.A.; Liti, G.; Romagnoli, G.; Knijnenburg, T.A.; Liti, G.; Louis, E.J.; Pronk, J.T.; Daran, J.M. Deletion of the Saccharomyces cerevisiae ARO8 gene, encoding an aromatic amino acid transaminase, enhances phenylethanol production from glucose. Yeast 2015, 32, 29–45. [Google Scholar]
  27. Luo, H.; Sun, Y.; Fan, Q.; Luo, H.B.; Sun, Y.L.; Fan, Q.G.; Huang, J.F.; Zheng, J. Advances in the Application of Omics Technologies in Microorganisms Used for Baijiu Fermentation. China Ferment. 2023, 42, 13–21. [Google Scholar]
  28. Guo, T.T. Experimental Study on Liquid Fermentation of Rice-Aroma Baijiu. Master’s Thesis, Guangxi University of Science and Technology, Liuzhou, China, 2023. [Google Scholar]
  29. He, J.; Zhou, H.; Liang, J.; He, J.; Zhou, H.; Liang, J.; Tuerxun, K.; Ding, Z.; Zhou, S. HOM2 Deletion by CRISPR-Cas9 in Saccharomyces cerevisiae for decreasing Higher Alcohols in Wort wine. Fermentation 2024, 10, 589. [Google Scholar] [CrossRef]
  30. Yin, Y.; Han, X.; Lu, Y.; Yin, Y.; Han, X.; Lu, Y.; Li, J.; Zhang, Z.; Xia, X.; Hu, Y. Control of N-Propanol Production in Simulated Liquid State Fermentation of Chinese Baijiu by Response Surface Methodology. Fermentation 2021, 7, 85. [Google Scholar] [CrossRef]
  31. Hassing, E.-J.; de Groot, P.A.; Marquenie, V.R.; Hassing, E.J.; de Groot, P.A.; Marquenie, V.R.; Pronk, J.T.; Daran, J.M.G. Connecting central carbon and aromatic amino acid metabolisms to improve de novo 2-phenylethanol production in Saccharomyces cerevisiae. Metab. Eng. 2019, 56, 165–180. [Google Scholar] [CrossRef]
  32. Martínez-Avila, O.; Sánchez, A.; Font, X.; Barrena, A. Bioprocesses for 2-PE and 2-phenylethyl acetate production: Current state and perspectives. Appl. Microbiol. Biotechnol. 2018, 102, 9991–10004. [Google Scholar] [CrossRef]
  33. Bian, Y.; Liu, S.; Zhang, B.M.; Zhang, Y.L.; Li, X.T. Advances in Microbial Synthesis of 2-Phenylethanol. China Biotechnol. 2022, 42, 128–136. [Google Scholar]
  34. Yang, C.; Lv, Q.; Zhang, L.; Jia, H.; Chen, H.; Yang, S.; Tian, X. The “Coexistence” of Ehrlich pathway and de novo pathway improves 2-PE synthesis in Saccharomyces cerevisiae. Chem. Eng. J. 2025, 516, 163688. [Google Scholar] [CrossRef]
  35. Vuralhan, Z.; Luttik, M.A.H.; Tai, S.L.; Boer, V.M.; Morais, M.A.; Schipper, D.; Pronk, J.T. Physiological characterization of the ARO10-dependent, broad-substrate-specificity 2-oxo acid decarboxylase activity of Saccharomyces cerevisiae. Appl. Environ. Microbiol. 2005, 71, 3276–3284. [Google Scholar] [CrossRef]
  36. Zhang, D.; Wang, F.; Yu, Y.; Ding, S.; Chen, T.; Sun, W.; Chen, Y. Effect of quorum-sensing molecule 2-phenylethanol and ARO genes on Saccharomyces cerevisiae biofilm. Appl. Microbiol. Biotechnol. 2021, 105, 3635–3648. [Google Scholar] [CrossRef]
  37. Lin, L.C.; Xu, Z.W.; Zhang, J.Z.; Dan, Y.D.; Xiao, F.; Xu, H.; Li, Q.P.; Yi, P.H.; Wang, K.; Zhu, T.H. Protoplast fusion combined with gene editing technology significantly improves the ability of Saccharomyces cerevisiae to produce 2-phenylethanol. Food Ferment. Ind. 2023, 49, 18–24. [Google Scholar]
  38. Zhang, C.; Fan, T.; Wang, Z.; Yu, J.; Guo, X.; Jiang, W.; Yang, H. Screening of High-Yield 2-Phenylethanol Producing Strain from Wild-Type Saccharomyces cerevisiae and Optimization of Fermentation Parameters. Foods 2025, 14, 2444. [Google Scholar] [CrossRef]
  39. Xia, H.; Shangguan, L.; Chen, S.; Yang, Q.; Zhang, X.; Yao, L.; Chen, X. Rapamycin enhanced the production of 2-phenylethanol during whole-cell bioconversion by yeast. Appl. Microbiol. Biotechnol. 2022, 106, 6623–6634. [Google Scholar] [CrossRef]
  40. Wu, X.; Li, Z.; Zhou, S. Optimization of brewing technology of β-phenylethanol flavoring liquor by two-step process. China Brew. 2017, 36, 45–49. [Google Scholar]
  41. Yan, T.; Wang, Z.; Zhou, H.; He, J.; Zhou, S. Effects of four critical gene deletions in Saccharomyces cerevisiae on fusel alcohols during red wine fermentation. Fermentation 2023, 9, 379. [Google Scholar] [CrossRef]
  42. Redman, M.; King, A.; Watson, C.; King, D. What is CRISPR/Cas9? Arch. Dis. Child.-Educ. Pract. 2016, 101, 213–215. [Google Scholar] [CrossRef] [PubMed]
  43. Wang, Z.; He, J.; Lang, S.; Zhou, S. Construction of LEU1 gene deleted Saccharomyces cerevisiae based on CRISPR-Cas9 system for brewing low degree of drunkenness rice wine. China Brew. 2024, 43, 62–67. [Google Scholar]
  44. Yang, Y.; Xu, L.; Wu, F. High-Performance Liquid Chromatography Method for Determining Phenethyl Alcohol Content in Rice Wine. J. Health Insp. 2011, 21, 2866–2867. [Google Scholar]
  45. Wang, Z.X. Construction of Saccharomyces cerevisiae with LEU1 Gene Deletion for Brewing Low-Drunkenness Alcohol Based on CRISPR-Cas9. Master’s Thesis, South China University of Technology, Guangzhou, China, 2024. [Google Scholar]
  46. Cheng, J.; Zhang, Y. Comparative study on sensory evaluation of world distilled spirits. J. Food Saf. Qual. 2015, 6, 4889–4893. [Google Scholar]
  47. Fang, C.; Liu, Z.G.; Qiao, L.; Lin, L.C.; Zhang, C.Y.; Huang, J.L.; Wang, G.M. Analysis of volatile characteristic flavors of three flavor types of Shanzhuang Laojiu Baijiu by quantitative descriptive sensory analysis and GC-MS. Food Sci. 2023, 44, 291–299. [Google Scholar]
Figure 1. Shikimate pathway and Ehrlich pathway for 2-PE synthesis in S. cerevisiae [11,16].
Ijms 27 04759 g001
Figure 2. The recombinant plasmid p426-gRNA-ARO8-kanMX.
Ijms 27 04759 g002
Figure 3. Construction results of recombinant S. cerevisiae strains. Lane M shows the 5000 bp marker. Verification results for SY-A8. Lane 1 is SY; Lane 2 is SY-A8.
Ijms 27 04759 g003
Figure 4. 2-PE production by SY and SY-A8. Each experiment was conducted in triplicate. The p-value of less than 0.05 was considered statistically significant.
Ijms 27 04759 g004
Figure 5. Relative expression levels of the ARO8, ARO9 and ARO10 genes in the SY and SY-A8 strains. Each experiment was conducted in triplicate. The p-value of less than 0.05 was considered statistically significant.
Ijms 27 04759 g005
Figure 6. Verification of plasmid loss in recombinant strains.
Ijms 27 04759 g006
Figure 7. Growth curves of the original strain SY and recombinant strain SY-A8. Each experiment was conducted in triplicate. The p-value of less than 0.05 was considered statistically significant.
Ijms 27 04759 g007
Figure 8. 2-PE production by SY-A8 in different inoculum sizes. Each experiment was conducted in triplicate. The p-value of less than 0.05 was considered statistically significant.
Ijms 27 04759 g008
Figure 9. 2-PE production by SY-A8 in different wort pH. Each experiment was conducted in triplicate. The p-value of less than 0.05 was considered statistically significant.
Ijms 27 04759 g009
Figure 10. 2-PE production by SY-A8 in different sugar concentrations. Each experiment was conducted in triplicate. The p-value of less than 0.05 was considered statistically significant.
Ijms 27 04759 g010
Figure 11. 2-PE production by SY-A8 in different fermentation times. Each experiment was conducted in triplicate. The p-value of less than 0.05 was considered statistically significant.
Ijms 27 04759 g011
Figure 12. 2-PE production by SY-A8 in different L-Phe concentrations. Each experiment was conducted in triplicate. The p-value of less than 0.05 was considered statistically significant.
Ijms 27 04759 g012
Figure 13. Effect of sugar concentration and fermentation time on the content of 2-PE.
Ijms 27 04759 g013
Figure 14. Effect of sugar concentration and L-Phe concentration on the content of 2-PE.
Ijms 27 04759 g014
Figure 15. Effect of fermentation time and L-Phe concentration on the content of 2-PE.
Ijms 27 04759 g015
Figure 16. Sensory and off-flavor evaluation of whisky.
Ijms 27 04759 g016
Figure 17. Schematic diagram of donor DNA construction.
Ijms 27 04759 g017
Table 1. Response surface test design and results.
Factors
RunSugar Concentration (g/L)Fermentation Time
(d)
L-Phe Concentration (g/L)2-PE (g/L)
15081.53.5533
25041.53.5292
37060.53.2960
430413.2113
55040.53.5533
650613.5425
750613.5079
850613.5309
950613.5191
1030813.0446
117061.53.5316
1270412.6946
135080.53.5745
1470813.1312
153061.53.5334
1650613.5671
173060.53.7995
Table 2. Response surface regression model analysis of variance.
Sum of SquaresdfMean SquareF-Valuep-ValueSignificance
Model1.1190.123194.38<0.0001**
A0.109410.109483.87<0.0001**
B0.012410.01249.530.0177*
C0.000710.00070.55070.4822
AB0.091010.091069.79<0.0001**
AC0.062910.062948.270.0002**
BC2.117 × 10−612.117 × 10−60.00160.9690
A20.290710.2907222.95<0.0001**
B20.263810.2638202.33<0.0001**
C20.305610.3056234.41<0.0001**
Residual0.009170.0013
Lack of Fit0.007030.00234.520.0896
Pure Error0.002140.0005
Cor Total1.1216
Note. **: highly significant (p < 0.01); *: significant; significant (p < 0.05).
Table 3. Coded and actual values of factors in Box–Behnken design.
Levels
Factors−101
Sugar concentration (g/L)305070
Fermentation time (d)468
L-Phe concentration (g/L)0.511.5
Table 4. Sensory evaluation criteria for the fermented beverage.
AttributeScoring CriteriaScore (Points)
Clarity and Color
(20 points)
Pure color, clear and bright15~20
Pure color and clear10~14
Uniform color, clear and transparent<10
Aroma
(40 points)
Pronounced rose-like aroma, rich alcoholic note, well-coordinated with malt aroma33~40
Rose-like aroma and alcoholic note, coordinated with malt aroma24~32
Weak rose-like aroma and alcoholic note, poorly coordinated with malt aroma<24
Flavor
(40 points)
Balanced and smooth flavor, mellow taste, no off-flavors33~40
Balanced flavor, mellow taste, slight bitterness24~32
Unbalanced flavor, bitterness or off-flavors<24
Disclaimer/Publisher’s Note: The statements, opinions and data contained in all publications are solely those of the individual author(s) and contributor(s) and not of MDPI and/or the editor(s). MDPI and/or the editor(s) disclaim responsibility for any injury to people or property resulting from any ideas, methods, instructions or products referred to in the content.