The Research of New Natural Spontaneous Fertile Attention: Title Altered Hybrids (Aegilops trivialis Migusch. Et Chak) Using Laser Microscopy and Tandem Mass Spectrometry

 ,
,  ,
, 
Abstract
1. Introduction
- -
- A botanical and morphological analysis of the ear of the Aegilops-wheat hybrids;
- -
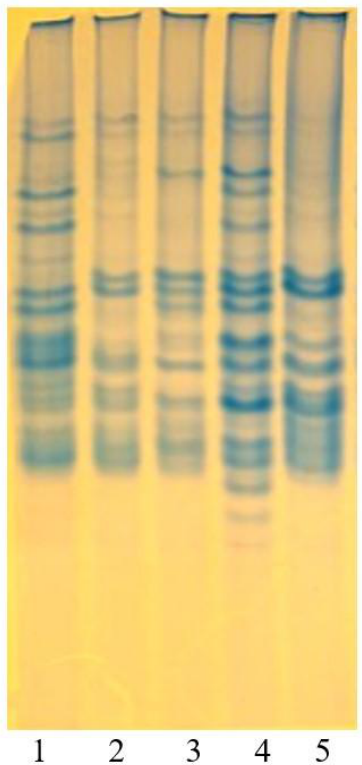
- Study and register Aegilops–wheat hybrids according to protein formulas;
- -
- Analyze spontaneous fertile Aegilops–wheat hybrids using laser microscopy and tandem mass spectrometry.
2. Results
2.1. Morphological Characterization of Maternal Form and Spontaneous Hybrids
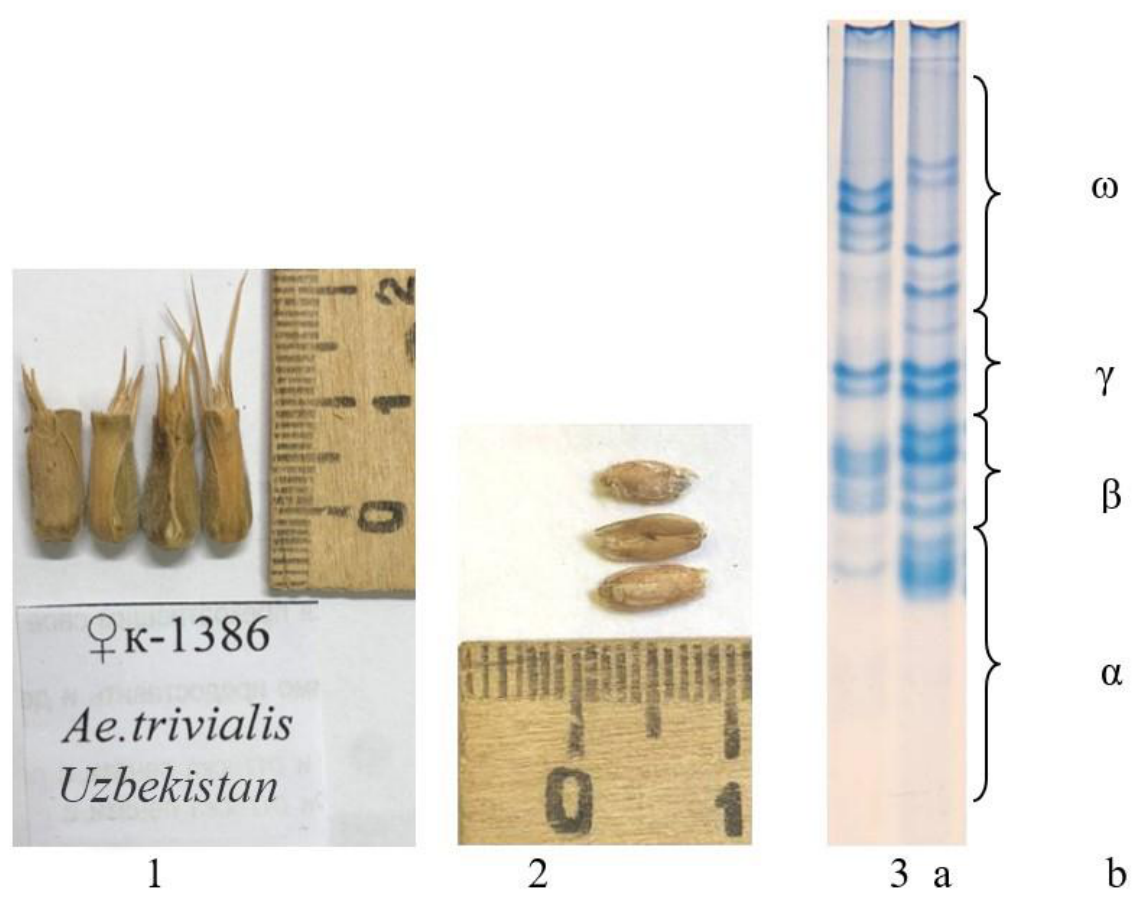
2.1.1. Maternal Form Aegilops trivialis Migusch. Et Chak. k-1386 (Uzbekistan)
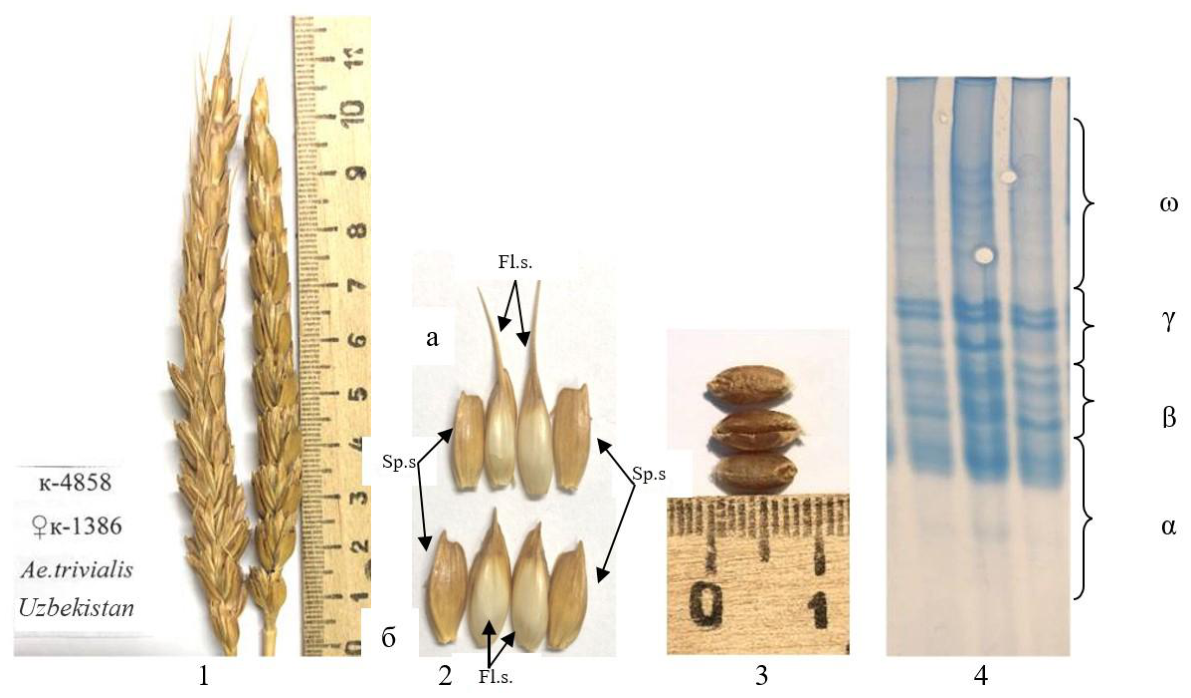
2.1.2. Spontaneous Hybrid k-4858 (Ae. trivialis k-1386 × Triticum)
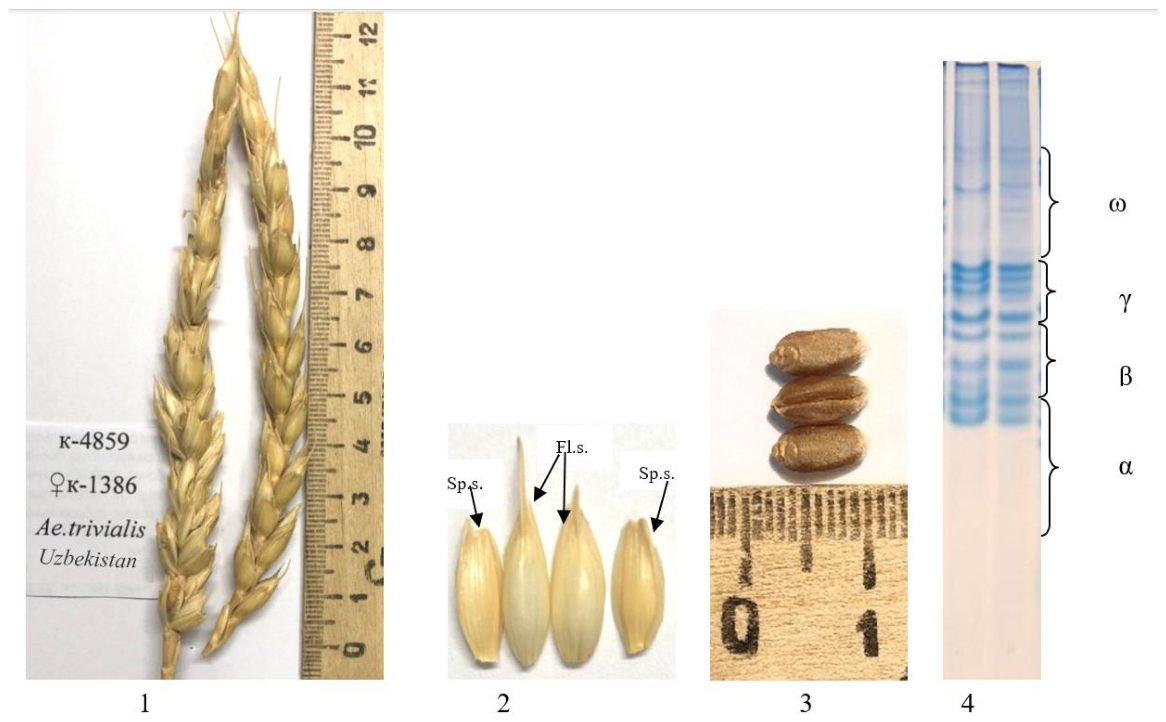
2.1.3. Spontaneous Hybrid k-4859 (Ae. trivialis × Triticum)
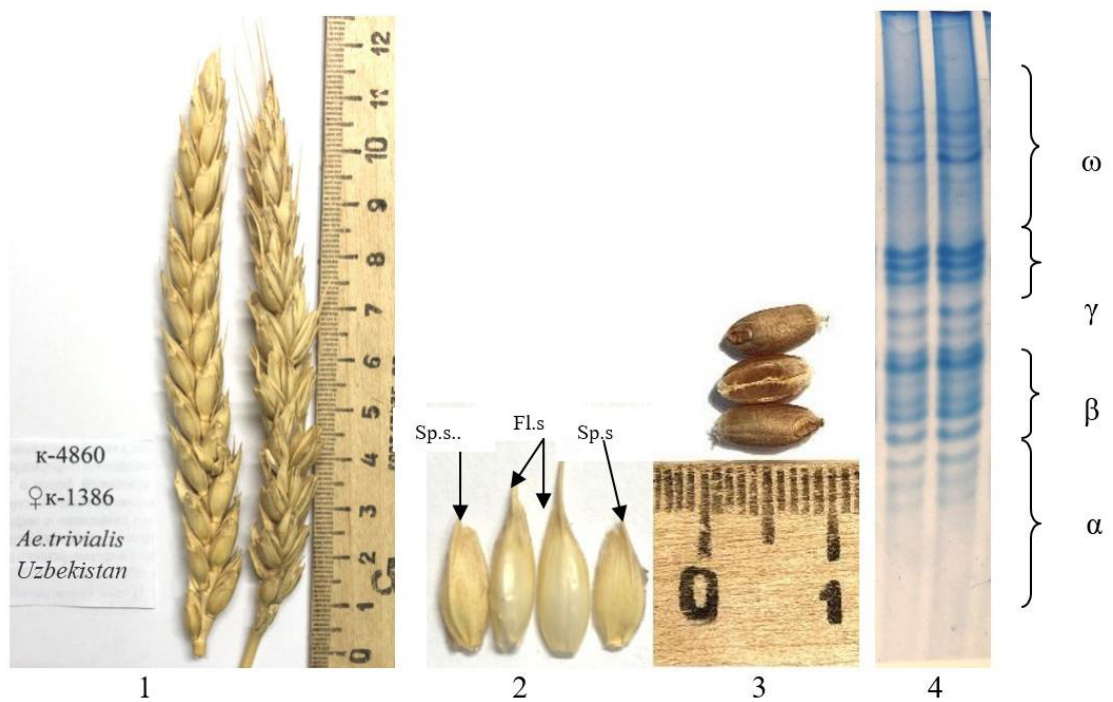
2.1.4. Spontaneous Hybrid k-4860 (Ae. trivialis k-1386 × Triticum)
2.1.5. Spontaneous Hybrid k-4861 (Ae. trivialis k-1386 × Triticum)
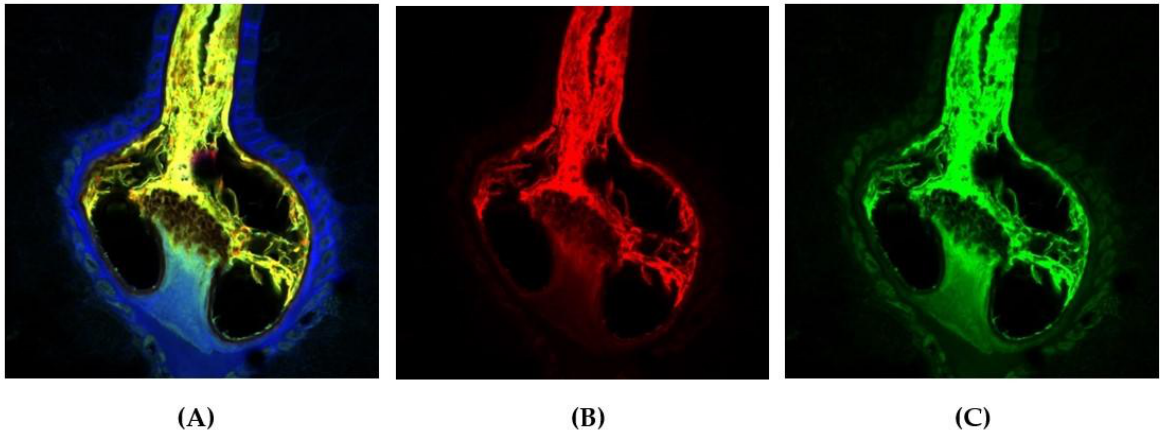
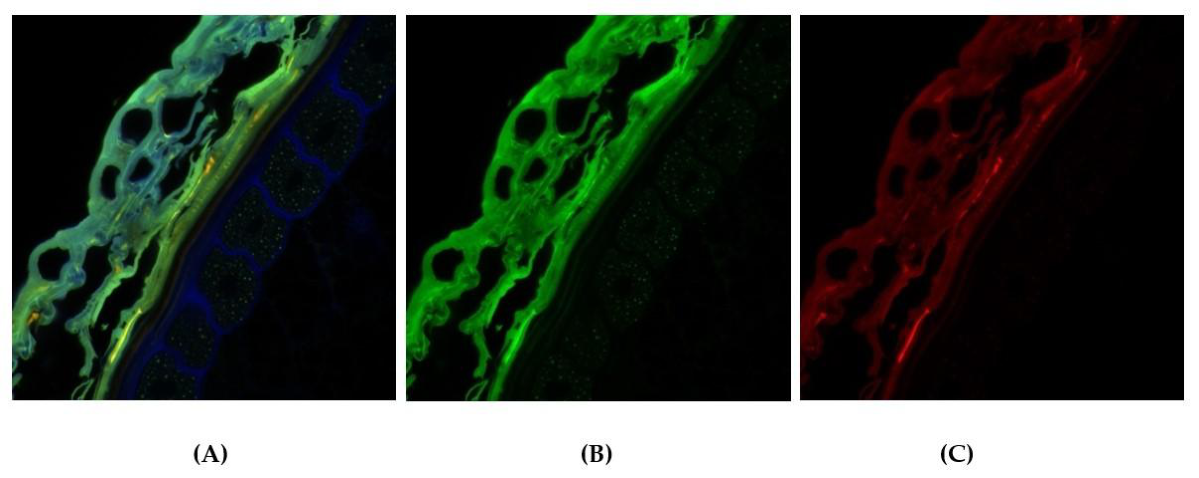
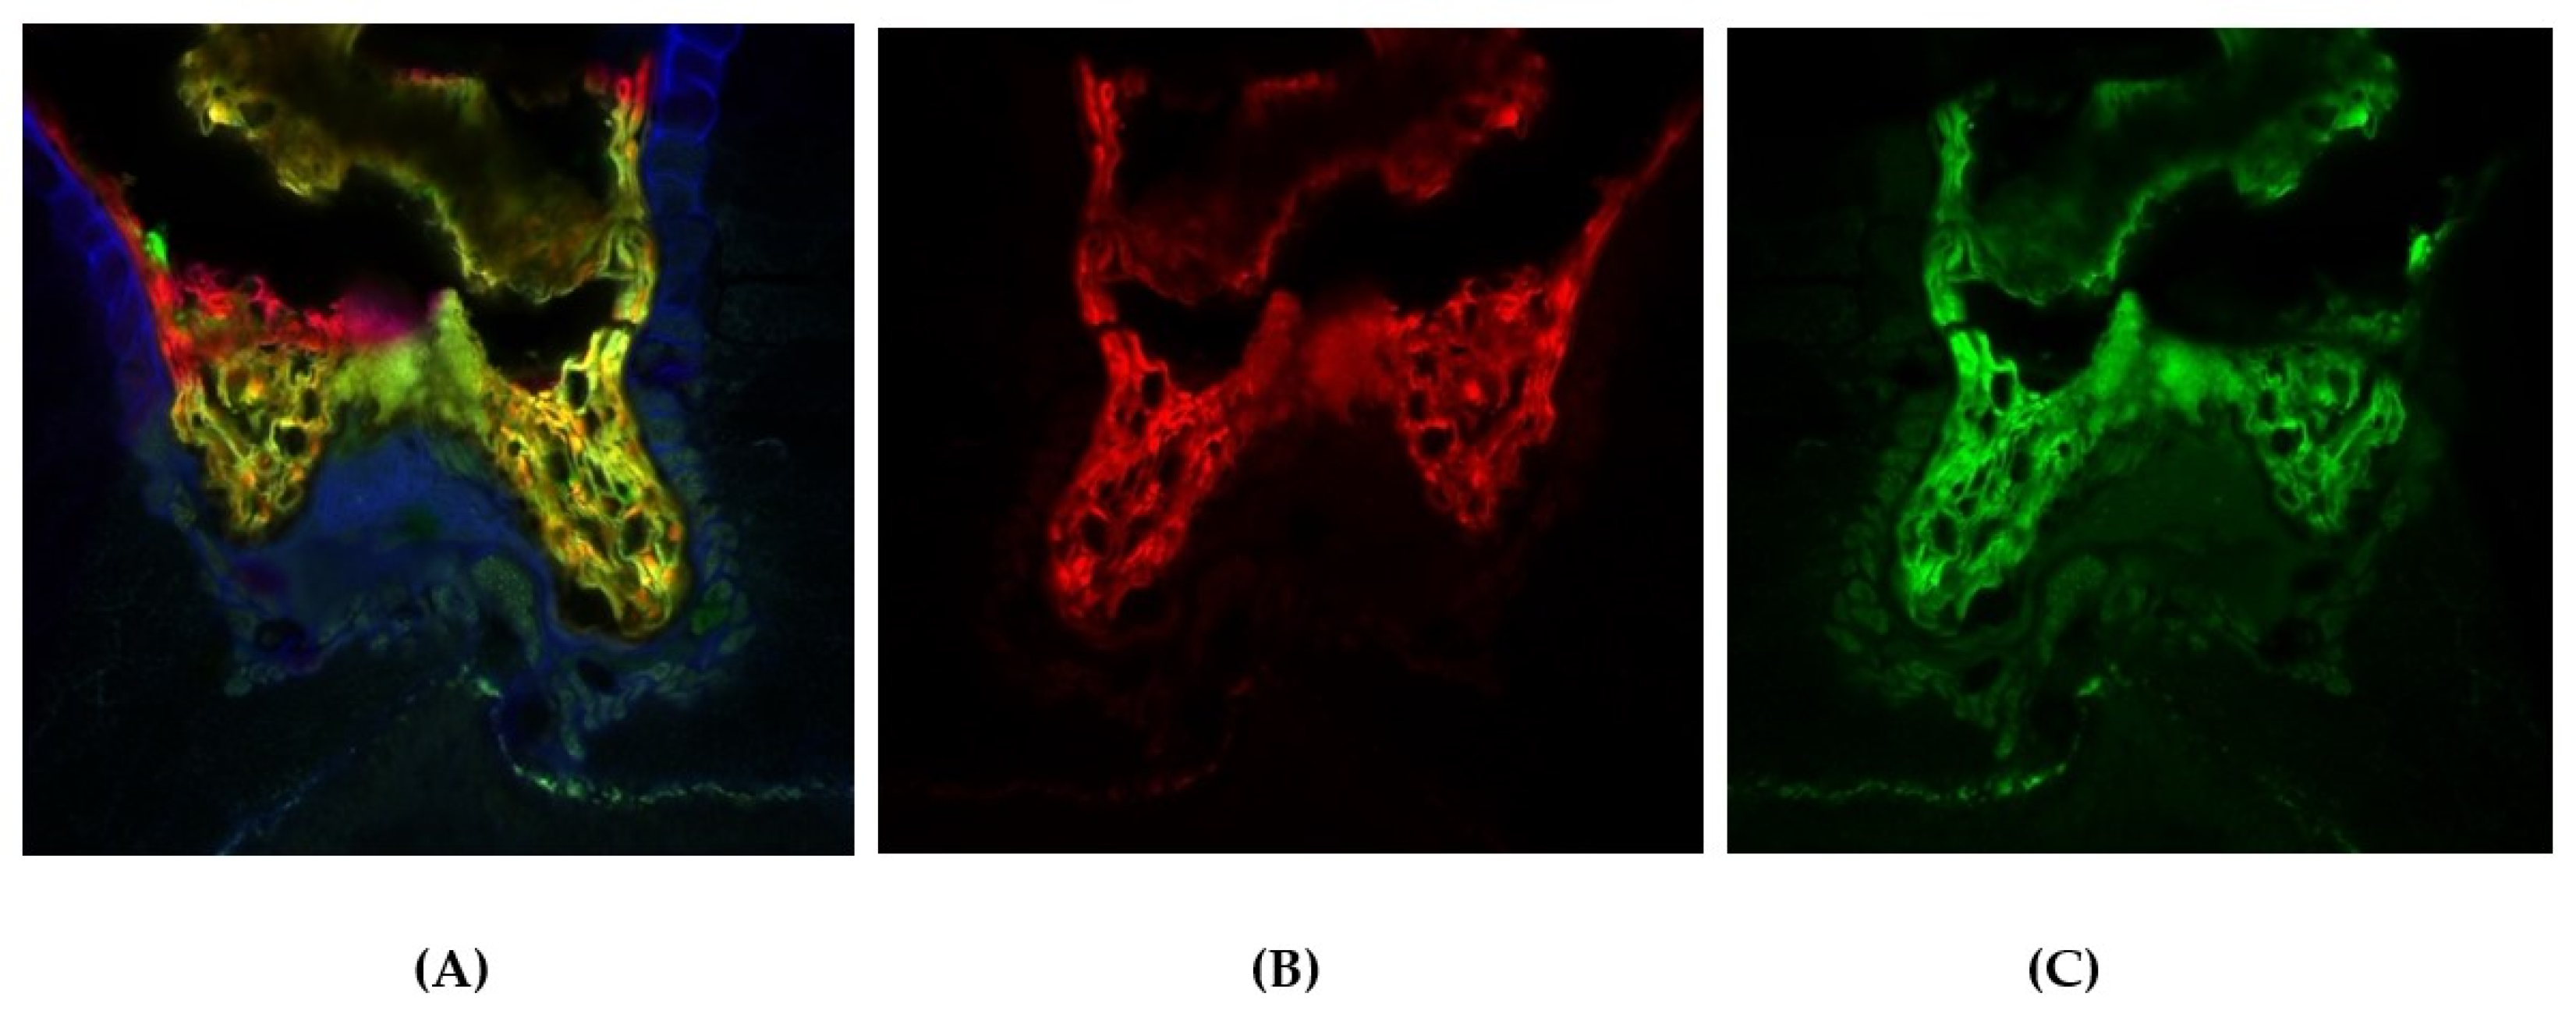
2.2. Laser Microscopy Visualization of Phenolic Compounds
2.3. Metabolomic Profiling by LC-MS/MS
2.4. Comparative Analysis of Polyphenolic Compounds in Spontaneous Hybrids
3. Discussion
4. Materials and Methods
4.1. Electrophoretic Analysis of Spontaneous Hybrids Ae. trivialis
4.2. Chemicals and Reagents
4.3. Fractional Maceration
4.4. Liquid Chromatography
4.5. Mass Spectrometry
4.6. Data Analysis
5. Conclusions
Author Contributions
Funding
Institutional Review Board Statement
Informed Consent Statement
Data Availability Statement
Conflicts of Interest
Appendix A

| Class of Compounds | Identification | Formula | Calculated Mass | Observed Mass [M − H]− | Observed Mass [M + H]+ | MS/MS Stage 2 Fragmentation | MS/MS Stage 3 Fragmentation | MS/MS Stage 4 Fragmentation | References | |
|---|---|---|---|---|---|---|---|---|---|---|
| Polyphenols | ||||||||||
| 1 | Flavone | Pinocembrin [(+)-Pinocembrin; Pihyrochrysin; (2S)-Pinocembrin] | C15H12O4 | 256.25 | 285 | 257 | 201; 219; 131 | Punica granatum [57]; Rosa amblyotis [16]; Loropetalum chinense [17]; Propolis [33] | ||
| 2 | Flavone | Apigenin [5,7-Dixydroxy-2-(40Hydroxyphenyl)-4H-Chromen-4-One] | C15H10O5 | 270.23 | 271 | 254; 236; 218; 187; 150 | 200; 172; 132 | Triticum aestivum L. [10,12]; Propolis [33] | ||
| 3 | Flavone | Prunetin [Padmakastein] | C16H12O5 | 284.26 | 285 | 257 | 173; 237; 111 | 117 | Triticum aestivum [58]; Rosa rugosa [31] | |
| 4 | Flavone | Dihydroxy-methoxy(iso)flavone | C16H12O5 | 284.26 | 285 | 270; 257 | Propolis [33] | |||
| 5 | Flavone | Acacetin | C16H12O5 | 284.26 | 285 | 270; 257; 201; 155 | 215; 181 | Triticum aestivum [58]; Rosa acicularis [16]; Ribes dikuscha, Ribes triste [27]; Propolis [33] | ||
| 6 | Flavone | Chrysoeriol [Chryseriol] | C16H12O6 | 300.26 | 301 | 283 | 268; 184 | 145 | Rhus coriaria [59]; Triticum aestivum L. [12]; Rosa rugosa [16]; Loropetalum chinense [17]; Propolis [33] | |
| 7 | Flavone | 5,7-Dimethoxyluteolin | C17H14O6 | 314.28 | 315 | 158; 239 | 130 | Rosa rugosa; Rosa davurica [60]; Glycine soja [20]; Syzygium aromaticum [29] | ||
| 8 | Flavone | Velutin [Flavoyadorigenin B; Luteolin 7,3′-dimethyl ether] | C17H14O6 | 314.28 | 315 | 158 | 130 | Triticum aestivum [58] | ||
| 9 | Flavone | Tricin [5,7,4′-trihydroxy-3′,5′-dimetoxyflavone] | C17H14O7 | 330.28 | 329 | 314 | 299 | 271 | Triticum aestivum [10,12,58] | |
| 10 | Flavone | Cirsiliol | C17H14O7 | 330.28 | 332 | 314 | 264 | 218 | Juglans mandshurica [61]; Inula viscosa [19] | |
| 11 | Flavone | Hydroxy trimethoxyflavone | C18H16O6 | 328.31 | 327 | 314; 229 | 299 | 271; 227 | G. linguiforme; F. pottsii [62]; Propolis [33] | |
| 12 | Flavone | Dimethoxy-trihydroxy(iso)flavone | C17H14O7 | 330.28 | 329 | 314 | 299 | 271 | Jatropha [63]; Propolis [33] | |
| 13 | Flavone | Jaceosidin [5,7,4′-trihydroxy-6′,5′-dimethoxyflavone] | C17H14O7 | 330.28 | 329 | 314 | 299 | 271 | Mentha [64] | |
| 14 | Flavone | Di-O-methylquercetin | C17H14O7 | 330.28 | 329 | 311; 229 | 211 | Triticum aestivum [58]; Loropetalum chinense [17] | ||
| 15 | Flavone | Pentahydroxy dimethoxyflavone | C17H14O9 | 362.28 | 363 | 300; 256; 146 | 146 | 116 | G. linguiforme; F. pottsii [62]; Chinese herbal formula Jian-Pi-Yi-Shen pill [65] | |
| 16 | Flavone | Tricin O-glycerol | C20H20O9 | 404.36 | 405 | 331 | 315 | 270 | Eleocharis dulcis [66] | |
| 17 | Flavone | Vitexin [Apigenin 8-C-Glucoside] | C21H20O10 | 432.37 | 433 | 415; 367; 313; 283 | 337; 283 | 309; 281 | Triticum aestivum L. [10,58,67] | |
| 18 | Flavone | Isovitexin [Saponaretin; Homovitexin; Apigenin-6-C-Glucoside] | C21H20O10 | 432.37 | 433 | 415; 367; 313; 283 | 337; 283 | 309; 281 | Chilean currants [68]; Triticum aestivum L. [12]; Rhus coriaria [59] | |
| 19 | Flavone | Genistein 8-C-glucoside | C21H20O10 | 432.37 | 433 | 415; 367; 313; 283 | 337; 283 | 309; 281 | Mexican lupine species [69] | |
| 20 | Flavone | Luteolin 8-C-Glucoside [Orientin; Lutexin] | C21H20O11 | 448.37 | 447 | 357; 429 | 339 | 311; 175 | Fagopyrum esculentum [70]; Triticum aestivum L. [10,11,67] | |
| 21 | Flavone | Luteolin C-hexoside [Isoorientin; Homoorientin] | C21H20O11 | 448.37 | 447 | 357; 429 | 339; 297 | 311; 225 | Triticum aestivum L. [11,12,58]; Fagopyrum esculentum [70] | |
| 22 | Flavone | Chrysoeriol C-hexoside | C22H22O11 | 462.40 | 463 | 445; 397; 343 | 367; 313 | 339; 311 | Triticum aestivum [71] | |
| 23 | Flavone | Chrysoeriol 6-O-hexoside | C22H22O11 | 462.40 | 463 | 445; 397; 343; 313 | 313 | 313; 298 | Triticum aestivum L. [11,12,71] | |
| 24 | Flavone | Chrysoeriol 6-C-glucoside [Isoscoparin; Isoscoparine] | C22H22O11 | 462.40 | 463 | 445; 397; 343 | 367; 313 | 339; 311 | Triticum aestivum L. [11,12,71]; P. aculeata [72] | |
| 25 | Flavone | Tricin 7-C-hexoside | C23H24O12 | 492.42 | 493 | 331 | 316 | 315 | Triticum aestivum L. [12] | |
| 26 | Flavone | Tricin O-hexoside | C23H24O12 | 492.42 | 493 | 331 | 316 | 315 | Triticum aestivum L. [11,73] | |
| 27 | Flavone | Tricin 5-O-hexoside | C23H24O12 | 492.42 | 493 | 331 | 316 | 315 | Triticum aestivum [58] | |
| 28 | Flavone | Tricin 4′-O-syringyl alcohol | C26H24O10 | 496.46 | 497 | 331 | 315 | 270 | Triticum aestivum [58] | |
| 29 | Flavone | Tricin trimethyl ether 7-O-hexoside | C24H26O12 | 506.45 | 507 | 345; 199 | 284 | 255 | Triticum aestivum L. [12] | |
| 30 | Flavone | Dihydroxy-trimethoxyflavone-O-hexoside | C24H26O12 | 506.45 | 507 | 345; 199 | 284 | 255 | Citrus species [74]; Glycine soja [20] | |
| 31 | Flavone | Tricin O-eudesmic acid | C27H24O11 | 524.47 | 525 | 331 | 315 | 270 | Triticum aestivum [58] | |
| 32 | Flavone | Tricin 4′-O-beta-guaiacylglycerol | C24H30O14 | 526.48 | 527 | 331 | 315; 270 | 270 | Loropetalum chinense [17]; Eleocharis dulcis [66] | |
| 33 | Flavone | Apigenin 8-C-hexoside-6-C-pentoside | C26H28O14 | 564.49 | 565 | 547; 427 | 529; 427 | 511; 409; 325 | Triticum aestivum L. [10,11,71]; Cynodon dactylon [13] | |
| 34 | Flavone | Apigenin-6-C-glycoside-8-C-arabinoside | C26H28O14 | 564.49 | 565 | 547; 427 | 529; 427 | 511; 481; 409 | Camellia kucha [14] | |
| 35 | Flavone | Apigenin 6-C-glucoside-8-C-pentoside | C26H28O14 | 564.49 | 565 | 547; 427 | 529; 427 | 511; 409; 325 | Artemisia annua [75] | |
| 36 | Flavone | Apigenin-C-hexoside-C-pentoside | C26H28O14 | 564.49 | 565 | 511; 427; 251 | 511; 427; 295 | 427; 391; 313 | Triticum aestivum [73,76] | |
| 37 | Flavone | Vicenin-1 [Apigenin 8-C-glucoside 6-C-xyloside] | C26H28O14 | 564.49 | 565 | 547; 427 | 529; 427 | 511; 409; 325 | Jatropha [63] | |
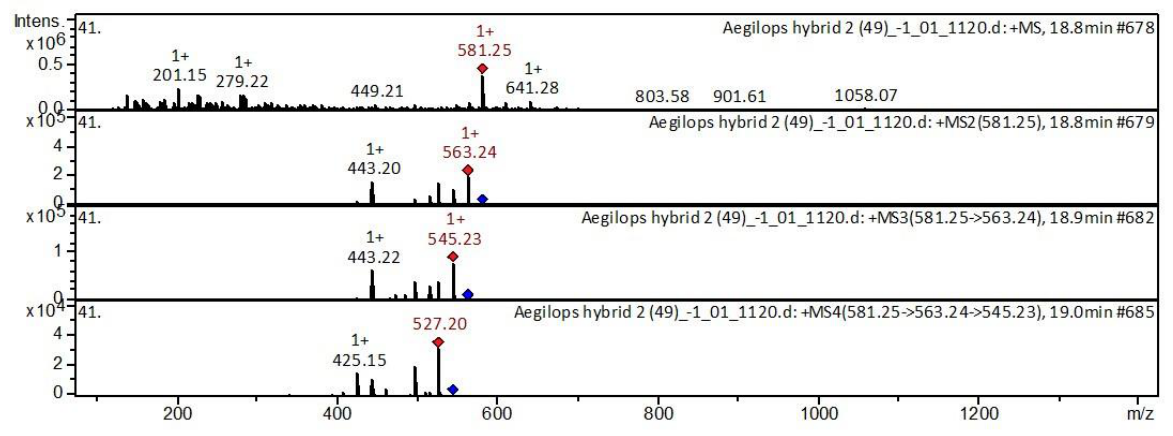
| 38 | Flavone | Naringin [Naringenin 7-O-Neohesperidoside] | C27H32O14 | 580.53 | 581 | 563; 443 | 545; 443 | 527; 425 | Exocarpium Citri Grandis [77]; G. linguiforme; F. pottsii [62]; Mentha [64] | |
| 39 | Flavone | Luteolin 8-C-pentoside-6-C-hexoside | C26H28O15 | 580.49 | 581 | 545; 443 | 527; 425 | 443 | Triticum aestivum [10,11,76]; Cynodon dactylon [13] | |
| 40 | Flavone | Luteolin 8-C-hexoside-6-C-pentoside | C26H28O15 | 580.49 | 581 | 563; 443 | 545; 443 | 527; 425 | Triticum aestivum [11,71,73,76]; Jatropha [63] | |
| 41 | Flavone | Vicenin-2 [Apigenin-6,8-Di-C-Glucoside] | C27H30O15 | 594.51 | 595 | 577; 457 | 559; 457 | 541; 439 | Lemon, Passion fruits [78]; Triticum aestivum L. [10,58,76]; P. aculeata [72]; Exocarpium Citri Grandis [77] | |
| 42 | Flavone | Chrysoeriol C-hexoside-C-pentoside | C27H30O15 | 594.51 | 595 | 577; 457; 415; 367; 313 | 559; 511; 457; 415; 349 | 511; 481 | Triticum aestivum [71,73] | |
| 43 | Flavone | Luteolin C-deoxyhexosyl-O-hexoside | C27H30O15 | 594.51 | 595 | 577; 457 | 559; 457 | 541; 439 | Triticum aestivum L. [12] | |
| 44 | Flavone | methoxylated O-pentosyl isoorientin | C28H32O15 | 608.54 | 609 | 463; 445; 397; 343 | 445; 427; 397; 313 | 367; 313 | Triticum aestivum L. [11,12] | |
| 45 | Flavone | Chrysoeriol O-deoxyhexoside-C-hexoside | C28H32O15 | 608.54 | 609 | 463; 445; 397; 343 | 445; 427; 397; 313 | 367; 313 | Triticum aestivum [12,71] | |
| 46 | Flavone | Chrysoeriol C-hexosyl-O-rhamnoside | C28H32O15 | 608.54 | 609 | 463; 445; 397; 343 | 445; 427; 397; 313 | 367; 313 | Triticum aestivum [58,73] | |
| 47 | Flavone | Chrysoeriol O-hexoside C-hexoside | C28H32O16 | 624.54 | 625 | 463; 505; 607 | 445; 397 | 397 | Triticum aestivum L. [12,58,73] | |
| 48 | Flavone | Chrysoeriol O-hexosyl- O-hexoside | C28H32O16 | 624.54 | 625 | 463; 505; 607 | 445; 397 | 397 | Triticum aestivum [58] | |
| 49 | Flavone | Tricin 7-O-deoxyhexosyl-O-hexoside | C29H34O16 | 638.57 | 639 | 493; 331 | 331 | 316 | Triticum aestivum L. [12,71] | |
| 50 | Flavone | Tricin O-rhamnoside-O-hexoside | C29H34O16 | 638.57 | 639 | 493; 331 | 331 | 315; 270 | Triticum aestivum L. [73] | |
| 51 | Flavone | Tricin O-hexosyl-O-pentoside | C29H34O16 | 638.57 | 639 | 493; 331 | 331 | 316 | Triticum aestivum L. [11] | |
| 52 | Flavone | Tricetin trimethyl ether 7-O-deoxyhexosyl-O-hexoside | C30H36O16 | 652.59 | 653 | 507; 345 | 345 | 284 | Triticum aestivum L. [12] | |
| 53 | Flavone | 3′, 4′, 5′-Tricetin O-rutinoside | C30H36O16 | 652.59 | 653 | 507; 345 | 345 | 284 | Triticum aestivum [58] | |
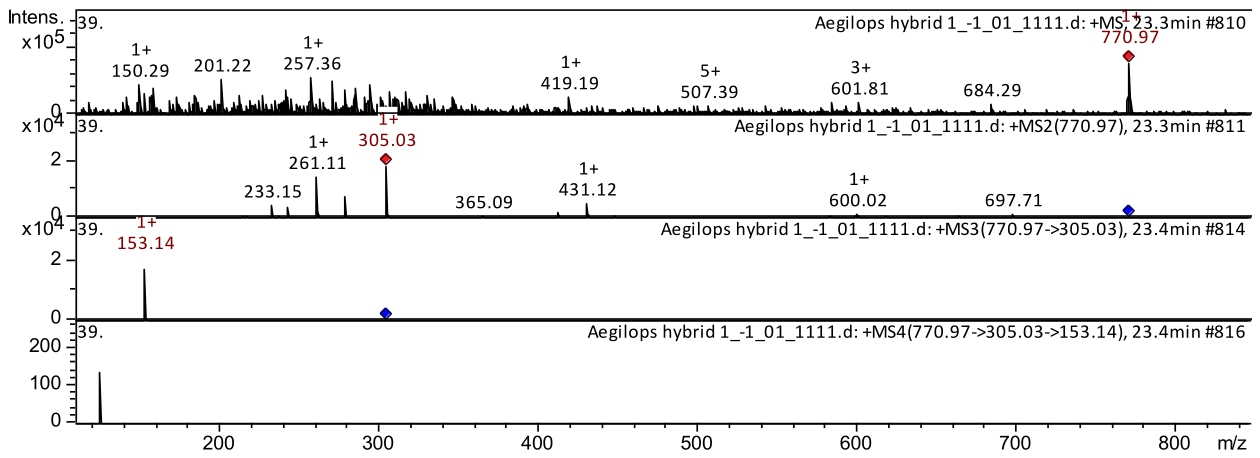
| 54 | Flavone | Apigenin-6-C-beta-galactosyl-8-C-beta-glycosyl-O-glycuronopyranoside | C33H38O21 | 770.64 | 771 | 697; 600; 431; 365; 305 | 153 | Triticum aestivum L. [10] | ||
| 55 | Flavonol | Kaempferol | C15H10O6 | 286.23 | 285 | 257; 185; 117 | 117 | Andean blueberry [23]; Rapeseed petals [26]; Oligomeris linifolia [35]; Rhus coriaria [59]; Juglans mandshurica [61] | ||
| 56 | Flavonol | Quercetin | C15H10O7 | 302.23 | Inula graveolens [79]; Inula viscosa [19]; Eucalyptus [25]; Propolis [33]; Rhus coriaria [59]; Juglans mandshurica [61] | |||||
| 57 | Flavonol | Kumatakenin [Kaempferol 3,7-dimethyl ether] | C17H14O6 | 314.28 | 315 | 287 | 187; 241 | Triticum aestivum [58] | ||
| 58 | Flavonol | Selgin [Selagin; 3-O-Methyltricetin; Tricetin ′3-O-methyl ether] | C16H12O7 | 316.26 | 317 | 299; 217; 147 | 252 | 196 | Triticum aestivum [80] | |
| 59 | Flavonol | Isorhamnetin [Isorhamnetol; Quercetin 3′-Methyl ether; 3-Methylquercetin] | C16H12O7 | 316.26 | 317 | 302 | 274; 190 | 274 | Inula viscosa [19]; Embelia [30]; Rosa rugosa [31]; Rosmarinus officinalis [32]; Propolis [33]; Phoenix dactylifera [34]; Oligomeris linifolia [35]; Cyperus laevigatus [36]; Mint; Salvia [37] | |
| 60 | Flavonol | Rhamnetin II | C16H12O7 | 316.26 | 317 | 301 | 287; 256 | 159 | Polygala sibirica [81]; Inula graveolens [79]; Rosa acicularis [16]; Spondias purpurea [22]; Ribes dikuscha, Ribes triste [27]; Syzygium aromaticum [29]; Rhus coriaria [59] | |
| 61 | Flavonol | Myricetin | C15H10O8 | 318.23 | 319 | 317; 289; 219 | 301; 261; 191 | 241 | Inula graveolens [79]; Rosa acicularis [16]; Juglans mandshurica [61]; G. linguiforme; F. pottsii [62] | |
| 62 | Flavonol | Di-O-methylquercetin | C17H14O7 | 330.28 | 329 | 229 | 210 | 209 | Triticum aestivum [58] | |
| 63 | Flavonol | Kaempferol-8-C-beta-D-glucopyranoside | C21H20O11 | 448.37 | 447 | 357; 429 | 339 | 311; 175 | P. aculeata [72] | |
| 64 | Flavonol | Quercetin 3-O-glucoside [Isoquercetin; Isoquercitrin; Hirsutrin] | C21H20O12 | 464.37 | 465 | 303; 235 | 235 | 218; 138 | Spondias purpurea [22]; Andean blueberry [23]; Rapeseed petals [26]; Embelia [30]; Rhus coriaria [59]; Juglans mandshurica [61] | |
| 65 | Flavonol | Myricetin-3-O-galactoside | C21H20O13 | 480.37 | 481 | 319; 197 | 179 | 161; 133 | Rosa acicularis [16]; Loropetalum chinense [17]; Vaccinium macrocarpon [21]; Ribes dikuscha, Ribes triste [27]; Juglans mandshurica [61] | |
| 66 | Flavonol | Myricetin-3-O-glucoside | C21H20O13 | 480.37 | 481 | 319 | 197; 179 | 161; 133 | Triticum aestivum [82]; Camellia kucha [14]; Rosa acicularis [16]; Ribes dikuscha, Ribes triste [27]; Rhus coriaria [59] | |
| 67 | Flavanone | Neoeriocitrin | C27H32O15 | 596.53 | 597 | 331 | 315 | 270 | Exocarpium Citri Grandis [77] | |
| 68 | Flavanone | Eriocitrin [Eriodictoyl-7-O-rutinoside] | C27H32O15 | 596.53 | Lemon, Passion fruits [78]; Triticum aestivum [58]; G. linguiforme; F. pottsii [62]; Exocarpium Citri Grandis [77] | |||||
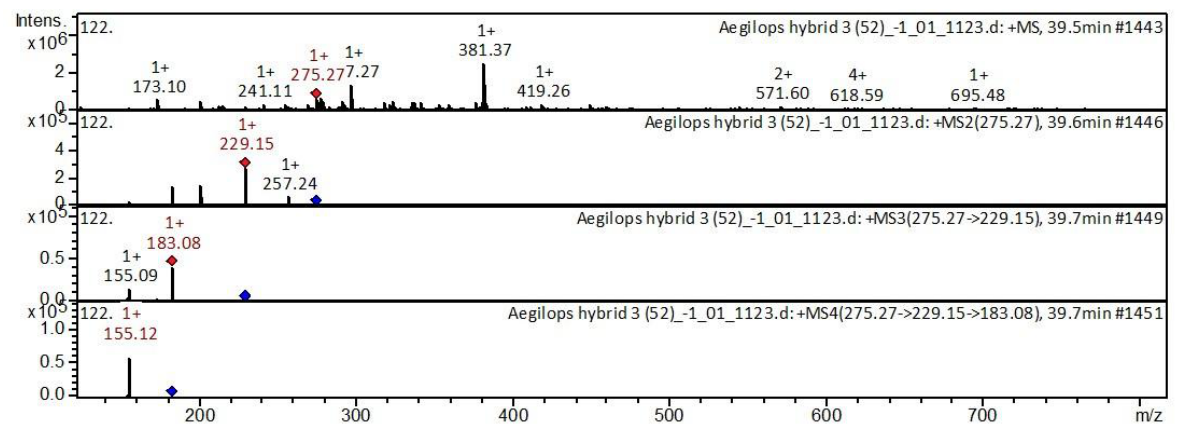
| 69 | Flavan-3-ol | Afzelechin | C15H14O5 | 274.26 | 275 | 257; 229 | 183; 155 | 155 | Camellia kucha [14]; Pelargonium endlicherianum [15] | |
| 70 | Flavan-3-ol | (epi)-Afzelechin | C15H14O5 | 274.26 | 275 | 257 | 183 | Glycine soja [20]; F. glaucescens; G. linguiforme; F. pottsii [62] | ||
| 71 | Flavan-3-ol | (epi)-Catechin | C15H14O6 | 290.26 | 292 | 273; 191 | 255 | 239; 169 | Black soja [83]; Eucalyptus [25]; Jatropha [63] | |
| 72 | Flavan-3-ol | Gallocatechin [+(−)Gallocatechin] | C15H14O7 | 306.26 | 307 | 261 | 243 | 173 | Carpinus betulus [84]; Embelia [30]; G. linguiforme; F. pottsii [62] | |
| 73 | Flavan-3-ol | (Epi)Gallocatechin | C15H14O7 | 306.26 | 307 | 289 | 262; 194; 151 | Carpinus betulus [84]; G. linguiforme; F. pottsii [62]; Chilean currants [68] | ||
| 74 | Flavan-3-ol | Epiafzelechin derivative | C18H16O10 | 392.31 | 393 | 375; 245 | 357; 222 | Ribes fragrans [85]; Lonicera caerulea [24] | ||
| 75 | Anthocyanin | Petunidin | C16H13O7+ | 317.27 | 318 | 300 | 282 | 264 | Wines [86]; G. linguiforme; C. edulis; F. pottsii [62] | |
| 76 | Anthocyanin | Petunidin 3-O-glucoside-acetaldehyde | C24H23O12 | 503.43 | 503 | 341; 318; 271; 219; 185 | 279; 219 | Wines [86] | ||
| 77 | Phenolic acid | p-Coumaric acid [4-Hydroxycinnamic acid] | C9H8O3 | 164.15 | 165 | 149; 119 | 119 | Rapeseed petals [26]; Cyperus laevigatus [36]; Rhus coriaria [59]; Juglans mandshurica [61] | ||
| 78 | Phenolic acid | Methylgallic acid [Methyl gallate; Methyl 3,4,5-trihydroxybenzoate] | C8H8O5 | 184.14 | 185 | 153 | 123 | Papaya, Lemon, Passion fruits [78]; Rosa acicularis [16]; Lonicera caerulea [24]; Ribes dikuscha, Ribes triste [27]; Rhus coriaria [59] | ||
| 79 | Phenolic acid | Syringic acid [Benzoic acid; Cedar acid] | C9H10O5 | 198.17 | 199 | 153 | Triticum aestivum [87]; Rosa acicularis [16]; Rosa rugosa [31]; Rhus coriaria [59]; Juglans mandshurica [61] | |||
| 80 | Phenolic acid | 3-O-caffeoylshikimic acid [3-CSA] | C16H16O8 | 336.29 | 337 | 319; 290; 191 | 273; 237; 199 | Inula viscosa [88]; Phoenix dactylifera [34] | ||
| 81 | Phenolic acid | Salvianolic acid G | C18H12O7 | 340.28 | 341 | 323 | 276 | 164 | Salvia miltiorrhiza [89]; Mentha [64]; Terminalia arjuna [90] | |
| 82 | Phenolic acid | Caffeic acid derivative | C16H18O9Na | 377.29 | 377 | 341; 195 | 179 | 119 | Bougainvillea [91] | |
| 83 | Phenolic acid | Caffeic acid-O- hexoside derivative | C20H16O12 | 448.33 | 447 | 301 | 271; 211; 179; 151 | 151 | Lemon, Passion fruits [78]; Embelia [30] | |
| 84 | Phenolic acid | Ellagic acid-O-hexoside | C20H16O13 | 464.33 | 465 | 303; 235 | 258 | 210 | Pelargonium endlicherianum [15]; Eucalyptus [25]; Punica granatum [57]; Carpinus betulus [84]; Terminalia arjuna [90] | |
| 85 | Stilbenes | 3-Hydroxyresveratrol [Piceatannol] | C14H12O4 | 244.24 | 245 | 217 | 199 | Rosa rugosa; Rosa davurica [60]; G. linguiforme; F. pottsii [62] | ||
| 86 | Stilbenes | Resveratrol [trans-Resveratrol; 3,4′,5-Trihydroxystilbene] | C14H12O3 | 228.24 | 229 | 209 | 139 | Embelia [30]; G. linguiforme; F. glaucescens; F. herrerae; F. pottsii [62] | ||
| 87 | Coumarin | Esculetin [3,7-Dihydroxylcoumarin; Cichorigenin] | C9H6O4 | 178.14 | 179 | 151; 133; 123 | 123 | Artemisia annua [92]; Basilic; Rosemary; Thymus vulgaris, Mint; Salvia [37] | ||
| 88 | Coumarin | Umbelliferone hexoside | C15H16O8 | 324.28 | 325 | 307 | 287 | Lonicera caerulea [24]; G. linguiforme; F. pottsii [62]; | ||
| 89 | Lignans | Hinokinin | C20H18O6 | 354.35 | 355 | 337 | 319 | 300 | Lignans [93]; Triticum aestivum [82,87] | |
| 90 | Lignans | Pinoresinol | C20H22O6 | 358.38 | 359 | 341; 191 | 277 | Triticum aestivum L. [10,87]; Punica granatum [57]; Rosa rugosa; Rosa davurica [60]; Lignans [93] | ||
| 91 | Lignans | Syringaresinol | C22H26O8 | 418.44 | 419 | 383; 355; 326; 295 | 298 | Wheat [94]; Triticum aestivum [82]; Lignans [93] | ||
| 92 | Lignans | Pinosylvin (double glycosylation) | C26H32O12 | 536.52 | 537 | 408 | 351; 149 | 308; 237 | Triticum aestivum [87]; Triticum aestivum L. [10] | |
| 93 | Dihydrochalcone | Phloretin [Dihydronaringenin; Phloretol] | C15H14O5 | 274.26 | 275 | 256 | 212 | 212 | Loropetalum chinense [17]; Eucalyptus [25]; G. linguiforme; F. pottsii [62]; Eleocharis dulcis [66] | |
| Others | ||||||||||
| 94 | Aliphatic amino acid | L-Glutamic acid [L-Glutamate] | C5H7NO4 | 145.11 | 146 | 127 | Medicago truncatula [95] | |||
| 95 | Amino acid | Phenylalanine [L-Phenylalanine] | C9H11NO2 | 165.18 | 166 | 120 | Camellia kucha [14]; Rosa acicularis [16]; Juglans mandshurica [61]; G. linguiforme; F. pottsii [62]; Medicago truncatula [95] | |||
| 96 | Amino acid | L-theanine [Theanine; Theanin; N-Ethyl-L-glutamine] | C7H14N2O3 | 174.19 | 175 | 157; 135; 117 | Rosa amblyotis [16]; Camellia kucha [14]; Glycine soja [20]; Ribes aureum, Ribes triste [27] | |||
| 97 | Vitamin | L-Ascorbic acid [Vitamin C] | C6H8O6 | 176.12 | 177 | 145 | 117 | Strawberry, Papaya, Lemon, Passion fruits [78]; Phoenix dactylifera [34] | ||
| 98 | 8-Hydroxy-tetradec-(9E)-ene-11,13-diyn-2-one | C14H18O2 | 218.29 | 217 | 180 | 143 | Rosa acicularis [16] | |||
| 99 | Carboxylic acid | Myristoleic acid [Cis-9-Tetradecanoic acid] | C14H26O2 | 226.35 | 227 | 209; 165 | 121 | Maackia amurensis [96]; G. linguiforme; F. glaucescens; F. pottsii [62] | ||
| 100 | Sesquiterpenoid | Atractylenolide I | C15H18O2 | 230.30 | 231 | 203; 185; 162; 139 | 185; 139 | 139 | Chinese herbal formula Jian-Pi-Yi-Shen pill [65] | |
| 101 | Sulfur-contained amino acid cystine | Cystine | C6H12N2O4S2 | 240.30 | 239 | 195; 151 | 150 | 135 | Triticum aestivum [97] | |
| 102 | Trihydroxy anthraquinone | Chrysophanol [Chrysophanolic acid; 3-Methylchrysazin] | C15H10O4 | 254.23 | 255 | 227; 209 | 209 | Dryopteris fragrans [98]; Chinese herbal formula Jian-Pi-Yi-Shen pill [65] | ||
| 103 | Tanshinone I [Tanshinone A; Tanshinone] | C18H12O3 | 276.28 | 277 | 259; 115 | 241; 115 | Radix Salviae [99] | |||
| 104 | Omega-3 fatty acid; octadecatetraenoic acid | Stearidonic acid [6,9,12,15-Octadecatetraenoic acid; Moroctic acid] | C18H28O2 | 276.41 | 277 | 260 | 215; 115 | 128 | Salviae Miltiorrhizae [100]; Rhus coriaria [59]; G. linguiforme; F. pottsii [62]; Jatropha [63] | |
| 105 | Omega-3 fatty acid | Linolenic acid (Alpha-Linolenic acid; Linolenate) | C18H30O2 | 278.42 | 279 | 261 | 115 | Salviae Miltiorrhizae [100]; Glycine soja [20]; Jatropha [63] | ||
| 106 | Linoleic acid amide | C18H33NO | 279.46 | 280 | 262 | 244; 118 | 196 | Propolis [33]; Rhus coriaria [59] | ||
| 107 | Naphthoquinone | Rhein [Monorhein; Rheic acid; Rhubarb Yellow] | C15H8O6 | 284.22 | 285 | 257; 149 | 117 | Juglans mandshurica [61]; Chinese herbal formula Jian-Pi-Yi-Shen pill [65] | ||
| 108 | Triterpenoid | 3,4-Dihydroxyestran-17-one | C18H28O3 | 292.41 | 293 | 275; 177 | 257 | 213 | Juglans mandshurica [61] | |
| 109 | Fatty acid | Methyl linolenate | C19H32O2 | 292.45 | 293 | 261 | 243; 187; 133 | 187; 159 | Apium graveolens [101] | |
| 110 | Triterpenoid | Abietan-18-ol | C20H36O | 292.49 | 293 | 275; 177 | 257 | 213 | Juglans mandshurica [61] | |
| 111 | Diterpenoid naphthoquinone | Tanshinone IIA [Tanshinone II; Tanshinone B] | C19H18O3 | 294.34 | 295 | 277 | 259; 161 | 194 | Radix Salviae [99]; Chinese herbal formula Jian-Pi-Yi-Shen pill [65] | |
| 112 | Fatty acid | Methyl linoleate | C19H34O2 | 294.47 | 295 | 244; 159 | 149 | Apium graveolens [101] | ||
| 113 | Tyramines | N-trans-feruloyl tiramine | C18H19NO4 | 313.34 | 314 | 268; 240; 194; 151 | 240; 167; 125 | 194 | Propolis [33]; G. linguiforme; A. cordifolia; F. pottsii [62]; Jatropha [63]; Bougainvillea [91] | |
| 114 | Cyclohexenecarboxylic acid | 4-O-p-coumaroyl shiikimic acid | C16H16O7 | 320.29 | 321 | 275 | 257; 197 | 238 | Phoenix dactylifera [34] | |
| 115 | Oxylipins | 13- Trihydroxy-Octadecenoic acid [THODE] | C18H34O5 | 330.45 | 329 | 229; 171 | 209; 155 | 183 | Bituminaria [102]; Phoenix dactylifera [34]; Jatropha [63] | |
| 116 | Alpha,omega-dicarboxylic acid | Eicosatetraenedioic acid | C20H30O4 | 334.44 | 335 | 289 | 273; 288 | Lonicera caerulea [24]; G. linguiforme; F. pottsii [62] | ||
| 117 | Cyclohexenecarboxylic acid | Caffeoyl shikimic acid | C16H16O8 | 336.29 | 337 | 291 | 273 | 199 | Carpinus betulus [84] | |
| 118 | Docosenoic acid [2-Docosenoic acid] | C22H42O2 | 338.56 | 339 | 321; 209 | 245 | 121 | A. cordifolia; F. glaucescens; F. herrerae G. linguiforme [62] | ||
| 119 | Diarylheptanoid | 4,16-Dihydroxy-17-methoxy-2-oxatricyclo [13.2.2.1-3,7-]icosa-1(17),3(20),4,6,15,18-hexaen-10-one | C20H22O5 | 342.38 | 343 | 325; 297 | 297 | Juglans mandshurica [61] | ||
| 120 | Naphthoquinone | 8,8′-Dihydroxy-2,2′-binaphthalene-1,1′,4,4′-tetrone | C20H10O6 | 346.28 | 347 | 319; 158 | 291 | 261 | Juglans mandshurica [61] | |
| 121 | 1,8,11-Trihydroxy-3-methoxy-10-methyl-5,12-tetracenedione | C20H14O6 | 350.32 | 351 | 333 | 314; 257 | 271 | Juglans mandshurica [61] | ||
| 122 | Trihydroxy eicosatetraenoic acid | C20H32O5 | 352.46 | 353 | 177; 145 | 145 | F. glaucescens; G. linguiforme; F. pottsii [62] | |||
| 123 | Naphthoquinone | 3,3′,5,5′-Tetrahydroxy-2,2′-binaphthalene-1,1′,4,4′-tetrone | C20H10O8 | 378.28 | 379 | 361 | 344 | 302; 164 | Juglans mandshurica [61] | |
| 124 | Unsaturated fatty acid | Pentacosenoic acid | C25H48O2 | 380.64 | 381 | 362; 253; 191 | 270; 226 | F. glaucescens; G. linguiforme; F. pottsii [62] | ||
| 125 | Sterol | Campesterol [Dihydrobrassicasterol] | C28H48O | 400.68 | Cicer arietinum [103]; A. cordifolia; C. edulis; G. linguiforme; F. pottsii [62] | |||||
| 126 | Triterpenoid | Squalene (Trans-Squalene; Spinacene; Supraene) | C30H50 | 410.71 | 411 | 265; 177 | 248; 177 | Squalene [104] | ||
| 127 | Anabolic steroid; Androgen; Androgen ester | Vebonol | C30H44O3 | 452.66 | 453 | 435; 336; 209 | 336; 226 | 209 | Hylosereus polyrhizus [105]; Rhus coriaria [59] | |
| 128 | Triterpenoid | 1-Hydroxy-3-oxours-12-en-28-oic acid | C30H46O4 | 470.68 | 471 | 453; 359; 209 | 436; 388; 343; 265; 208 | Pear [106]; Rosa amblyotis [16] |
References
- Feldman, M.; Sears, E. The Wild Gene Resources of Wheat. Sci. Am. 1981, 244, 102–113. [Google Scholar] [CrossRef]
- Feldman, M. Cytogenetic and molecular approaches to alien gene transfer in wheat. In Proceedings of the Seventh International Wheat Genetics Symposium, Cambridge, UK, 13–19 July 1988; pp. 23–32. [Google Scholar]
- McGuire, P.; Dvorak, J. High Salt-Tolerance Potential in Wheatgrasses. Crop Sci. 1981, 21, 702–705. [Google Scholar] [CrossRef]
- Nevo, E.; Crugman, T.; Beiles, A. Genetic resources for salt tolerance in the wild progenitors of wheat (Triticum dicoccoides) and barley (Hordeum spontaneum) in Israel. Plant Breed. 1993, 110, 338–341. [Google Scholar] [CrossRef]
- Damania, A.B. Biodiversity and Wheat Improvement: A Workshop on the Evaluation and Utilization of Biodiversity in Wild Relatives and Primitives Forms for Wheat Improvement Held at ICARDA, Aleppo, Syrie, October 1992; J. Wiley and Sons: Hoboken, NJ, USA; International Center for the Agricultural Research in the Dry Areas (ICARDA): Beirut, Lebanon, 1993. [Google Scholar]
- Konarev, V.G. Wheat Proteins; Kolos Publishing: Moscow, Russia, 1980. (In Russian) [Google Scholar]
- Konarev, V.G. Molecular Biological Aspects of Applied Botany Genetics and Breeding; VIR: Saint-Petersburg, Russia, 1996. [Google Scholar]
- Chikida, N.; Maximov, I.; Davoyan, R. Prospects for using heterogeneous species of egilops (wild relatives of wheat) to expand the genetic potential of food wheat. Hum. Health Chall. Solut. 2011, 6, 20–23. [Google Scholar]
- Konarev, V.G.; Gavrilyuk, I.; Gubareva, N.; Alpateva, N.; Khakimova, A.; Peneva, T.; Konarev, A. Identification of Varieties and Registration of the Genofond of Cultivated Plants by Seed Proteins; VIR: Saint-Petersburg, Russia, 2000. [Google Scholar]
- Dinelli, G.; Segura-Carretero, A.; Di Silvestro, R.; Marotti, I.; Arráez-Román, D.; Benedettelli, S.; Ghiselli, L.; Fernadez-Gutierrez, A. Profiles of phenolic compounds in modern and old common wheat varieties determined by liquid chromatography coupled with time-of-flight mass spectrometry. J. Chromatogr. A 2011, 1218, 7670–7681. [Google Scholar] [CrossRef]
- Ioset, J.-R.; Urbaniak, B.; Ndjoko-Ioset, K.; Wirth, J.; Martin, F.; Gruissem, W.; Hostettmann, K.; Sautter, C. Flavonoid profiling among wild type and related GM wheat varieties. Plant Mol. Biol. 2007, 65, 645–654. [Google Scholar] [CrossRef] [PubMed]
- Wojakowska, A.; Perkowski, J.; Góral, T.; Stobiecki, M. Structural characterization of flavonoid glycosides from leaves of wheat (Triticum aestivum L.) using LC/MS/MS profiling of the target compounds. J. Mass Spectrom. 2013, 48, 329–339. [Google Scholar] [CrossRef]
- Annapurna, H.V.; Apoorva, B.; Ravichandran, N.; Arun, K.P.; Brindha, P.; Swaminathan, S.; Vijayalakshmi, M.; Nagarajan, A. Isolation and in silico evaluation of antidiabetic molecules of Cynodon dactylon (L.). J. Mol. Graph. Model. 2013, 39, 87–97. [Google Scholar] [CrossRef]
- Qin, D.; Wang, Q.; Li, H.; Jiang, X.; Fang, K.; Wang, Q.; Li, B.; Pan, C.; Wu, H. Identification of key metabolites based on non-targeted metabolomics and chemometrics analyses provides insights into bitterness in Kucha [Camellia kucha (Chang et Wang) Chang]. Food Res. Int. 2020, 138, 109789. [Google Scholar] [CrossRef]
- Zengin, G.; Leyva-Jiménez, F.J.; Fernández-Ochoa, Á.; Bouyahya, A.; Yildiztugay, E.; Carretero, A.S.; Mahomoodally, M.F.; Ponniya, S.K.M.; Nilofar; Koyuncu, I.; et al. UHPLC-ESI-QTOF-MS metabolite profiles of different extracts from Pelargonium endlicherianum parts and their biological properties based on network pharmacological approaches. Arch. Pharm. 2024, 357, 2300728. [Google Scholar] [CrossRef]
- Razgonova, M.P.; Nawaz, M.A.; Rusakova, E.A.; Golokhvast, K.S. Application of Supercritical CO2 Extraction and Identification of Polyphenolic Compounds in Three Species of Wild Rose from Kamchatka: Rosa acicularis, Rosa amblyotis, and Rosa rugosa. Plants 2024, 14, 59. [Google Scholar] [CrossRef]
- Zhang, X.; Zhang, L.; Zhang, D.; Liu, Y.; Lin, L.; Xiong, X.; Zhang, D.; Sun, M.; Cai, M.; Yu, X.; et al. Transcriptomic and Metabolomic Profiling Provides Insights into Flavonoid Biosynthesis and Flower Coloring in Loropetalum chinense and Loropetalum chinense var. rubrum. Agronomy 2023, 13, 1296. [Google Scholar] [CrossRef]
- Azizah, M.; Pripdeevech, P.; Thongkongkaew, T.; Mahidol, C.; Ruchirawat, S.; Kittakoop, P. UHPLC-ESI-QTOF-MS/MS-Based Molecular Networking Guided Isolation and Dereplication of Antibacterial and Antifungal Constituents of Ventilago denticulata. Antibiotics 2020, 9, 606. [Google Scholar] [CrossRef] [PubMed]
- Kheyar-Kraouche, N.; da Silva, A.B.; Serra, A.T.; Bedjou, F.; Bronze, M.R. Characterization by liquid chromatography–mass spectrometry and antioxidant activity of an ethanolic extract of Inula viscosa leaves. J. Pharm. Biomed. Anal. 2018, 156, 297–306. [Google Scholar] [CrossRef] [PubMed]
- Razgonova, M.P.; Navaz, M.A.; Butovets, E.S.; Lukyanchuk, L.M.; Chunikhina, O.A.; Ercişli, S.; Emelyanov, A.N.; Golokhvast, K.S. Autofluorescence and Metabotyping of Soybean Varieties Using Confocal Laser Microscopy and High-Resolution Mass Spectrometric Approaches. Plants 2025, 14, 1995. [Google Scholar] [CrossRef]
- Rafsanjany, N.; Senker, J.; Brandt, S.; Dobrindt, U.; Hensel, A. In Vivo Consumption of Cranberry Exerts ex Vivo Antiadhesive Activity against FimH-Dominated Uropathogenic Escherichia coli: A Combined in Vivo, ex Vivo, and in Vitro Study of an Extract from Vaccinium macrocarpon. J. Agric. Food Chem. 2015, 63, 8804–8818. [Google Scholar] [CrossRef]
- Engels, C.; Gräter, D.; Esquivel, P.; Jiménez, V.M.; Gänzle, M.G.; Schieber, A. Characterization of phenolic compounds in jocote (Spondias purpurea L.) peels by ultra high-performance liquid chromatography/electrospray ionization mass spectrometry. Food Res. Int. 2012, 46, 557–562. [Google Scholar] [CrossRef]
- Aita, S.; Capriotti, A.; Cavaliere, C.; Cerrato, A.; Giannelli Moneta, B.; Montone, C.; Piovesana, S.; Laganà, A. Andean Blueberry of the Genus Disterigma: A High-Resolution Mass Spectrometric Approach for the Comprehensive Characterization of Phenolic Compounds. Separations 2021, 8, 58. [Google Scholar] [CrossRef]
- Razgonova, M.P.; Navaz, M.A.; Sabitov, A.S.; Zinchenko, Y.N.; Rusakova, E.A.; Petrusha, E.N.; Golokhvast, K.S.; Tikhonova, N.G. The Global Metabolome Profiles of Four Varieties of Lonicera caerulea, Established via Tandem Mass Spectrometry. Horticulturae 2023, 9, 1188. [Google Scholar] [CrossRef]
- Santos, S.A.O.; Vilela, C.; Freire, C.S.R.; Neto, C.P.; Silvestre, A.J.D. Ultra-high performance liquid chromatography coupled to mass spectrometry applied to the identification of valuable phenolic compounds from Eucalyptus wood. J. Chromatogr. B 2013, 938, 65–74. [Google Scholar] [CrossRef]
- Yin, N.-W.; Wang, S.-X.; Jia, L.-D.; Zhu, M.-C.; Yang, J.; Zhou, B.-J.; Yin, J.-M.; Lu, K.; Wang, R.; Li, J.-N.; et al. Identification and Characterization of Major Constituents in Different-Colored Rapeseed Petals by UPLC–HESI-MS/MS. J. Agric. Food Chem. 2019, 67, 11053–11065. [Google Scholar] [CrossRef]
- Razgonova, M.P.; Nawaz, M.A.; Sabitov, A.S.; Golokhvast, K.S. Genus Ribes: Ribes aureum, Ribes pauciflorum, Ribes triste, and Ribes dikuscha—Comparative Mass Spectrometric Study of Polyphenolic Composition and Other Bioactive Constituents. Int. J. Mol. Sci. 2024, 25, 10085. [Google Scholar] [CrossRef]
- Lee, S.Y.; Shaari, K. LC–MS metabolomics analysis of Stevia rebaudiana Bertoni leaves cultivated in Malaysia in relation to different developmental stages. Phytochem. Anal. 2022, 33, 249–261. [Google Scholar] [CrossRef]
- Fathoni, A.; Saepudin, E.; Cahyana, A.H.; Rahayu, D.U.C.; Haib, J. Identification of nonvolatile compounds in clove (Syzygium aromaticum) from Manado. In AIP Conference Proceedings; AIP Publishing LLC: Melville, NY, USA, 2017; p. 030079. [Google Scholar]
- Rini Vijayan, K.P.; Raghu, A.V. Tentative characterization of phenolic compounds in three species of the genus Embelia by liquid chromatography coupled with mass spectrometry analysis. Spectrosc. Lett. 2019, 52, 653–670. [Google Scholar] [CrossRef]
- Olech, M.; Pietrzak, W.; Nowak, R. Characterization of Free and Bound Phenolic Acids and Flavonoid Aglycones in Rosa rugosa Thunb. Leaves and Achenes Using LC–ESI–MS/MS–MRM Methods. Molecules 2020, 25, 1804. [Google Scholar] [CrossRef]
- Mena, P.; Cirlini, M.; Tassotti, M.; Herrlinger, K.; Dall’Asta, C.; Del Rio, D. Phytochemical Profiling of Flavonoids, Phenolic Acids, Terpenoids, and Volatile Fraction of a Rosemary (Rosmarinus officinalis L.) Extract. Molecules 2016, 21, 1576. [Google Scholar] [CrossRef] [PubMed]
- Belmehdi, O.; Bouyahya, A.; Jekő, J.; Cziáky, Z.; Zengin, G.; Sotkó, G.; El Baaboua, A.; Senhaji, N.S.; Abrini, J. Synergistic interaction between propolis extract, essential oils, and antibiotics against Staphylococcus epidermidis and methicillin resistant Staphylococcus aureus. Int. J. Second. Metab. 2021, 8, 195–213. [Google Scholar] [CrossRef]
- Ben Said, R.; Hamed, A.I.; Mahalel, U.A.; Al-Ayed, A.S.; Kowalczyk, M.; Moldoch, J.; Oleszek, W.; Stochmal, A. Tentative Characterization of Polyphenolic Compounds in the Male Flowers of Phoenix dactylifera by Liquid Chromatography Coupled with Mass Spectrometry and DFT. Int. J. Mol. Sci. 2017, 18, 512. [Google Scholar] [CrossRef]
- El-Hagrassy, A.M.; Elkhateeb, A.; Hussein, S.R.; Abdel-Hameed, E.-S.S.; Marzouk, M.M. LC-ESI-MS profile, antioxidant activity and cytotoxic screening of Oligomeris linifolia (Vahl) Macbr. (Resedaceae). J. Appl. Pharm. Sci. 2017, 7, 43–47. [Google Scholar] [CrossRef][Green Version]
- Ayoub, I.M.; El-Baset, M.A.; Elghonemy, M.M.; Bashandy, S.A.E.; Ibrahim, F.A.A.; Ahmed-Farid, O.A.H.; El Gendy, A.E.-N.G.; Afifi, S.M.; Esatbeyoglu, T.; Farrag, A.R.H.; et al. Chemical Profile of Cyperus laevigatus and Its Protective Effects against Thioacetamide-Induced Hepatorenal Toxicity in Rats. Molecules 2022, 27, 6470. [Google Scholar] [CrossRef]
- Ali, A.; Bashmil, Y.M.; Cottrell, J.J.; Suleria, H.A.R.; Dunshea, F.R. LC-MS/MS-QTOF Screening and Identification of Phenolic Compounds from Australian Grown Herbs and Their Antioxidant Potential. Antioxidants 2021, 10, 1770. [Google Scholar] [CrossRef]
- Lakowicz, J.R. Principles of Fluorescence Spectroscopy; Springer Science + Business Media LLC: Boston, MA, USA, 2006. [Google Scholar]
- García-Plazaola, J.I.; Fernández-Marín, B.; Duke, S.O.; Hernández, A.; López-Arbeloa, F.; Becerril, J.M. Autofluorescence: Biological functions and technical applications. Plant Sci. 2015, 236, 136–145. [Google Scholar] [CrossRef]
- Usha, K.; Singh, B. Potential applications of remote sensing in horticulture—A review. Sci. Hortic. 2013, 153, 71–83. [Google Scholar] [CrossRef]
- Raimondi, V.; Cecchi, G.; Lognoli, D.; Palombi, L.; Grönlund, R.; Johansson, A.; Svanberg, S.; Barup, K.; Hällström, J. The fluorescence lidar technique for the remote sensing of photoautotrophic biodeteriogens in the outdoor cultural heritage: A decade of in situ experiments. Int. Biodeterior. Biodegrad. 2009, 63, 823–835. [Google Scholar] [CrossRef]
- Corcel, M.; Devaux, M.F.; Guillon, F.; Barron, C. Identification of Tissular Origin of Particles Based on Autofluorescence Multispectral Image Analysis at the Macroscopic Scale; EDP Sciences: London, UK, 2017; Volume 140, p. 05012. [Google Scholar]
- Lichtenthaler, H.K.; Schweiger, J. Cell wall bound ferulic acid, the major substance of the blue-green fluorescence emission of plants. J. Plant Physiol. 1998, 152, 272–282. [Google Scholar] [CrossRef]
- Donaldson, L. Softwood and Hardwood Lignin Fluorescence Spectra of Wood Cell Walls in Different Mounting Media. IAWA J. 2013, 34, 3–19. [Google Scholar] [CrossRef]
- Razgonova, M.P.; Zinchenko, Y.N.; Kozak, D.K.; Kuznetsova, V.A.; Zakharenko, A.M.; Ercisli, S.; Golokhvast, K.S. Autofluorescence-Based Investigation of Spatial Distribution of Phenolic Compounds in Soybeans Using Confocal Laser Microscopy and a High-Resolution Mass Spectrometric Approach. Molecules 2022, 27, 8228. [Google Scholar] [CrossRef] [PubMed]
- Razgonova, M.P.; Burlyaeva, M.O.; Zinchenko, Y.N.; Krylova, E.A.; Chunikhina, O.A.; Ivanova, N.M.; Zakharenko, A.M.; Golokhvast, K.S. Identification and Spatial Distribution of Bioactive Compounds in Seeds Vigna unguiculata (L.) Walp. by Laser Microscopy and Tandem Mass Spectrometry. Plants 2022, 11, 2147. [Google Scholar] [CrossRef] [PubMed]
- Collings, D.A. Anthocyanin in the Vacuole of Red Onion Epidermal Cells Quenches Other Fluorescent Molecules. Plants 2019, 8, 596. [Google Scholar] [CrossRef]
- Mackon, E.; Ma, Y.; Jeazet Dongho Epse Mackon, G.C.; Li, Q.; Zhou, Q.; Liu, P. Subcellular Localization and Vesicular Structures of Anthocyanin Pigmentation by Fluorescence Imaging of Black Rice (Oryza sativa L.) Stigma Protoplast. Plants 2021, 10, 685. [Google Scholar] [CrossRef] [PubMed]
- Acuña, A.U.; Amat-Guerri, F.; Morcillo, P.; Liras, M.; Rodríguez, B. Structure and Formation of the Fluorescent Compound of Lignum nephriticum. Org. Lett. 2009, 11, 3020–3023. [Google Scholar] [CrossRef] [PubMed]
- Weston, L.A.; Mathesius, U. Flavonoids: Their Structure, Biosynthesis and Role in the Rhizosphere, Including Allelopathy. J. Chem. Ecol. 2013, 39, 283–297. [Google Scholar] [CrossRef] [PubMed]
- Donaldson, L.; Williams, N. Imaging and Spectroscopy of Natural Fluorophores in Pine Needles. Plants 2018, 7, 10. [Google Scholar] [CrossRef] [PubMed]
- Berg, R.H. Evaluation of spectral imaging for plant cell analysis. J. Microsc. 2004, 214, 174–181. [Google Scholar] [CrossRef]
- Razgonova, M.; Zinchenko, Y.; Pikula, K.; Tekutyeva, L.; Son, O.; Zakharenko, A.; Kalenik, T.; Golokhvast, K. Spatial Distribution of Polyphenolic Compounds in Corn Grains (Zea mays L. var. Pioneer) Studied by Laser Confocal Microscopy and High-Resolution Mass Spectrometry. Plants 2022, 11, 630. [Google Scholar] [CrossRef]
- Buer, C.S.; Muday, G.K. The transparent testa4 Mutation Prevents Flavonoid Synthesis and Alters Auxin Transport and the Response of Arabidopsis Roots to Gravity and Light. Plant Cell 2004, 16, 1191–1205. [Google Scholar] [CrossRef]
- Monago-Maraña, O.; Durán-Merás, I.; Galeano-Díaz, T.; Muñoz de la Peña, A. Fluorescence properties of flavonoid compounds. Quantification in paprika samples using spectrofluorimetry coupled to second order chemometric tools. Food Chem. 2016, 196, 1058–1065. [Google Scholar] [CrossRef]
- Azmir, J.; Zaidul, I.S.M.; Rahman, M.M.; Sharif, K.M.; Mohamed, A.; Sahena, F.; Jahurul, M.H.A.; Ghafoor, K.; Norulaini, N.A.N.; Omar, A.K.M. Techniques for extraction of bioactive compounds from plant materials: A review. J. Food Eng. 2013, 117, 426–436. [Google Scholar] [CrossRef]
- Mena, P.; Calani, L.; Dall’Asta, C.; Galaverna, G.; García-Viguera, C.; Bruni, R.; Crozier, A.; Del Rio, D. Rapid and Comprehensive Evaluation of (Poly)phenolic Compounds in Pomegranate (Punica granatum L.) Juice by UHPLC-MSn. Molecules 2012, 17, 14821–14840. [Google Scholar] [CrossRef]
- Wang, X.; Zhang, X.; Hou, H.; Ma, X.; Sun, S.; Wang, H.; Kong, L. Metabolomics and gene expression analysis reveal the accumulation patterns of phenylpropanoids and flavonoids in different colored-grain wheats (Triticum aestivum L.). Food Res. Int. 2020, 138, 109711. [Google Scholar] [CrossRef]
- Abu-Reidah, I.M.; Ali-Shtayeh, M.S.; Jamous, R.M.; Arráez-Román, D.; Segura-Carretero, A. HPLC–DAD–ESI-MS/MS screening of bioactive components from Rhus coriaria L. (Sumac) fruits. Food Chem. 2015, 166, 179–191. [Google Scholar] [CrossRef]
- Razgonova, M.P.; Bazhenova, B.A.; Zabalueva, Y.Y.; Burkhanova, A.G.; Zakharenko, A.M.; Kupriyanov, A.N.; Sabitov, A.S.; Ercisli, S.; Golokhvast, K.S. Rosa davurica Pall., Rosa rugosa Thumb., and Rosa acicularis Lindl. Originating from Far Eastern Russia: Screening of 146 Chemical Constituents in Three Species of the Genus Rosa. Appl. Sci. 2022, 12, 9401. [Google Scholar] [CrossRef]
- Huo, J.-H.; Du, X.-W.; Sun, G.-D.; Dong, W.-T.; Wang, W.-M. Identification and characterization of major constituents in Juglans mandshurica using ultra performance liquid chromatography coupled with time-of-flight mass spectrometry (UPLC-ESI-Q-TOF/MS). Chin. J. Nat. Med. 2018, 16, 525–545. [Google Scholar] [CrossRef]
- Hamed, A.R.; El-Hawary, S.S.; Ibrahim, R.M.; Abdelmohsen, U.R.; El-Halawany, A.M. Identification of Chemopreventive Components from Halophytes Belonging to Aizoaceae and Cactaceae Through LC/MS—Bioassay Guided Approach. J. Chromatogr. Sci. 2021, 59, 618–626. [Google Scholar] [CrossRef]
- Zengin, G.; Mahomoodally, M.F.; Sinan, K.I.; Ak, G.; Etienne, O.K.; Sharmeen, J.B.; Brunetti, L.; Leone, S.; Di Simone, S.C.; Recinella, L.; et al. Chemical Composition and Biological Properties of Two Jatropha Species: Different Parts and Different Extraction Methods. Antioxidants 2021, 10, 792. [Google Scholar] [CrossRef]
- Xu, L.-L.; Xu, J.-J.; Zhong, K.-R.; Shang, Z.-P.; Wang, F.; Wang, R.-F.; Zhang, L.; Zhang, J.-Y.; Liu, B. Analysis of Non-Volatile Chemical Constituents of Menthae Haplocalycis Herba by Ultra-High Performance Liquid Chromatography-High Resolution Mass Spectrometry. Molecules 2017, 22, 1756. [Google Scholar] [CrossRef]
- Wang, F.; Huang, S.; Chen, Q.; Hu, Z.; Li, Z.; Zheng, P.; Liu, X.; Li, S.; Zhang, S.; Chen, J. Chemical characterisation and quantification of the major constituents in the Chinese herbal formula Jian-Pi-Yi-Shen pill by UPLC-Q-TOF-MS/MS and HPLC-QQQ-MS/MS. Phytochem. Anal. 2020, 31, 915–929. [Google Scholar] [CrossRef]
- Li, G.; Huang, S.; Li, X.; Luo, Y.; Nie, H. Identification of compounds from chufa (Eleocharis dulcis) peels by widely targeted metabolomics. Food Sci. Nutr. 2023, 11, 545–554. [Google Scholar] [CrossRef]
- Montevecchi, G.; Setti, L.; Olmi, L.; Buti, M.; Laviano, L.; Antonelli, A.; Sgarbi, E. Determination of Free Soluble Phenolic Compounds in Grains of Ancient Wheat Varieties (Triticum sp. pl.) by Liquid Chromatography–Tandem Mass Spectrometry. J. Agric. Food Chem. 2019, 67, 201–212. [Google Scholar] [CrossRef]
- Burgos-Edwards, A.; Jiménez-Aspee, F.; Theoduloz, C.; Schmeda-Hirschmann, G. Colonic fermentation of polyphenols from Chilean currants (Ribes spp.) and its effect on antioxidant capacity and metabolic syndrome-associated enzymes. Food Chem. 2018, 258, 144–155. [Google Scholar] [CrossRef]
- Wojakowska, A.; Piasecka, A.; García-López, P.M.; Zamora-Natera, F.; Krajewski, P.; Marczak, Ł.; Kachlicki, P.; Stobiecki, M. Structural analysis and profiling of phenolic secondary metabolites of Mexican lupine species using LC–MS techniques. Phytochemistry 2013, 92, 71–86. [Google Scholar] [CrossRef]
- Kiprovski, B.; Mikulic-Petkovsek, M.; Slatnar, A.; Veberic, R.; Stampar, F.; Malencic, D.; Latkovic, D. Comparison of phenolic profiles and antioxidant properties of European Fagopyrum esculentum cultivars. Food Chem. 2015, 185, 41–47. [Google Scholar] [CrossRef] [PubMed]
- Stallmann, J.; Schweiger, R.; Pons, C.A.A.; Müller, C. Wheat growth, applied water use efficiency and flag leaf metabolome under continuous and pulsed deficit irrigation. Sci. Rep. 2020, 10, 10112. [Google Scholar] [CrossRef] [PubMed]
- Hassan, W.H.B.; Abdelaziz, S.; Al Yousef, H.M. Chemical Composition and Biological Activities of the Aqueous Fraction of Parkinsonea aculeata L. Growing in Saudi Arabia. Arab. J. Chem. 2019, 12, 377–387. [Google Scholar] [CrossRef]
- Cavaliere, C.; Foglia, P.; Pastorini, E.; Samperi, R.; Laganà, A. Identification and mass spectrometric characterization of glycosylated flavonoids in Triticum durum plants by high-performance liquid chromatography with tandem mass spectrometry. Rapid Commun. Mass Spectrom. 2005, 19, 3143–3158. [Google Scholar] [CrossRef]
- Wang, S.; Yang, C.; Tu, H.; Zhou, J.; Liu, X.; Cheng, Y.; Luo, J.; Deng, X.; Zhang, H.; Xu, J. Characterization and Metabolic Diversity of Flavonoids in Citrus Species. Sci. Rep. 2017, 7, 10549. [Google Scholar] [CrossRef]
- Han, J.; Ye, M.; Qiao, X.; Xu, M.; Wang, B.; Guo, D.-A. Characterization of phenolic compounds in the Chinese herbal drug Artemisia annua by liquid chromatography coupled to electrospray ionization mass spectrometry. J. Pharm. Biomed. Anal. 2008, 47, 516–525. [Google Scholar] [CrossRef]
- Geng, P.; Sun, J.; Zhang, M.; Li, X.; Harnly, J.M.; Chen, P. Comprehensive characterization of C-glycosyl flavones in wheat (Triticum aestivum L.) germ using UPLC-PDA-ESI/HRMSn and mass defect filtering. J. Mass Spectrom. 2016, 51, 914–930. [Google Scholar] [CrossRef]
- Zeng, X.; Su, W.; Zheng, Y.; Liu, H.; Li, P.; Zhang, W.; Liang, Y.; Bai, Y.; Peng, W.; Yao, H. UFLC-Q-TOF-MS/MS-Based Screening and Identification of Flavonoids and Derived Metabolites in Human Urine after Oral Administration of Exocarpium Citri Grandis Extract. Molecules 2018, 23, 895. [Google Scholar] [CrossRef]
- Spínola, V.; Pinto, J.; Castilho, P.C. Identification and quantification of phenolic compounds of selected fruits from Madeira Island by HPLC-DAD–ESI-MSn and screening for their antioxidant activity. Food Chem. 2015, 173, 14–30. [Google Scholar] [CrossRef]
- Silinsin, M.; Bursal, E. UHPLC-MS/MS phenolic profiling and in vitro antioxidant activities of Inula graveolens (L.) Desf. Nat. Prod. Res. 2018, 32, 1467–1471. [Google Scholar] [CrossRef] [PubMed]
- Zhou, J.-M.; Gold, N.D.; Martin, V.J.J.; Wollenweber, E.; Ibrahim, R.K. Sequential O-methylation of tricetin by a single gene product in wheat. Biochim. Biophys. Acta (BBA) —Gen. Subj. 2006, 1760, 1115–1124. [Google Scholar] [CrossRef] [PubMed]
- Okhlopkova, Z.M.; Razgonova, M.P.; Kucharova, E.V.; Egorova, P.S.; Golokhvast, K.S. Rare Plant of Central Yakutia Polygala sibirica L.: Phytochemical Profile and In Vitro Morphogenic Culture. Russ. J. Plant Physiol. 2023, 70, 176. [Google Scholar] [CrossRef]
- Sharma, M.; Sandhir, R.; Singh, A.; Kumar, P.; Mishra, A.; Jachak, S.; Singh, S.P.; Singh, J.; Roy, J. Comparative Analysis of Phenolic Compound Characterization and Their Biosynthesis Genes between Two Diverse Bread Wheat (Triticum aestivum) Varieties Differing for Chapatti (Unleavened Flat Bread) Quality. Front. Plant Sci. 2016, 7, 1870. [Google Scholar] [CrossRef]
- Xu, J.L.; Shin, J.-S.; Park, S.-K.; Kang, S.; Jeong, S.-C.; Moon, J.-K.; Choi, Y. Differences in the metabolic profiles and antioxidant activities of wild and cultivated black soybeans evaluated by correlation analysis. Food Res. Int. 2017, 100, 166–174. [Google Scholar] [CrossRef]
- Felegyi-Tóth, C.A.; Garádi, Z.; Darcsi, A.; Csernák, O.; Boldizsár, I.; Béni, S.; Alberti, Á. Isolation and quantification of diarylheptanoids from European hornbeam (Carpinus betulus L.) and HPLC-ESI-MS/MS characterization of its antioxidative phenolics. J. Pharm. Biomed. Anal. 2022, 210, 114554. [Google Scholar] [CrossRef]
- Razgonova, M.P.; Sabitov, A.S.; Senotrusova, T.A.; Lee, N.G.; Vitomskova, E.A.; Golokhvast, K.S. Ribes fragrans Pall.: Supercritical CO2-extraction and complete plant metabolome. Bot. Pacifica 2024, 13, 61–72. [Google Scholar] [CrossRef]
- Fermo, P.; Comite, V.; Sredojević, M.; Ćirić, I.; Gašić, U.; Mutić, J.; Baošić, R.; Tešić, Ž. Elemental Analysis and Phenolic Profiles of Selected Italian Wines. Foods 2021, 10, 158. [Google Scholar] [CrossRef]
- Leoncini, E.; Prata, C.; Malaguti, M.; Marotti, I.; Segura-Carretero, A.; Catizone, P.; Dinelli, G.; Hrelia, S. Phytochemical Profile and Nutraceutical Value of Old and Modern Common Wheat Cultivars. PLoS ONE 2012, 7, e45997. [Google Scholar] [CrossRef]
- Brahmi-Chendouh, N.; Piccolella, S.; Crescente, G.; Pacifico, F.; Boulekbache, L.; Hamri-Zeghichi, S.; Akkal, S.; Madani, K.; Pacifico, S. A nutraceutical extract from Inula viscosa leaves: UHPLC-HR-MS/MS based polyphenol profile, and antioxidant and cytotoxic activities. J. Food Drug Anal. 2019, 27, 692–702. [Google Scholar] [CrossRef]
- Jiang, R.W.; Lau, K.M.; Hon, P.M.; Mak, T.C.W.; Woo, K.S.; Fung, K.P. Chemistry and Biological Activities of Caffeic Acid Derivatives from Salvia miltiorrhiza. Curr. Med. Chem. 2005, 12, 237–246. [Google Scholar] [CrossRef]
- Singh, J.; Kumar, S.; Rathi, B.; Bhrara, K.; Chhikata, B.S. Therapeutic analysis of Terminalia arjuna plant extracts in combinations with different metal nanoparticles. J. Mater. Nanosci. 2015, 2, 1–7. [Google Scholar]
- El-sayed, M.; Abbas, F.; Refaat, S.; El-Shafae, A.; Fikry, E. UPLC-ESI-MS/MS Profile of the Ethyl Acetate Fraction of Aerial Parts of Bougainvillea “Scarlett O’Hara” Cultivated in Egypt. Egypt. J. Chem. 2020, 64, 793–806. [Google Scholar] [CrossRef]
- Trifan, A.; Zengin, G.; Sinan, K.I.; Sieniawska, E.; Sawicki, R.; Maciejewska-Turska, M.; Skalikca-Woźniak, K.; Luca, S.V. Unveiling the Phytochemical Profile and Biological Potential of Five Artemisia Species. Antioxidants 2022, 11, 1017. [Google Scholar] [CrossRef]
- Eklund, P.C.; Backman, M.J.; Kronberg, L.Å.; Smeds, A.I.; Sjöholm, R.E. Identification of lignans by liquid chromatography-electrospray ionization ion-trap mass spectrometry. J. Mass Spectrom. 2008, 43, 97–107. [Google Scholar] [CrossRef]
- Čukelj, N.; Jakasa, I.; Sarajlija, H.; Novotni, D.; Ćurić, D. Identification and quantification of lignans in wheat bran by gas chromatography-electron capture detection. Talanta 2011, 84, 127–132. [Google Scholar] [CrossRef]
- Dokwal, D.; Cocuron, J.-C.; Alonso, A.P.; Dickstein, R. Metabolite shift in Medicago truncatula occurs in phosphorus deprivation. J. Exp. Bot. 2022, 73, 2093–2111. [Google Scholar] [CrossRef] [PubMed]
- Razgonova, M.P.; Cherevach, E.I.; Tekutyeva, L.A.; Fedoreyev, S.A.; Mishchenko, N.P.; Tarbeeva, D.V.; Demidova, E.N.; Kirilenko, N.S.; Golokhvast, K. Maackia amurensis Rupr. et Maxim.: Supercritical CO2 Extraction and Mass Spectrometric Characterization of Chemical Constituents. Molecules 2023, 28, 2026. [Google Scholar] [CrossRef]
- Tsochatzis, E.; Papageorgiou, M.; Kalogiannis, S. Validation of a HILIC UHPLC-MS/MS Method for Amino Acid Profiling in Triticum Species Wheat Flours. Foods 2019, 8, 514. [Google Scholar] [CrossRef] [PubMed]
- Razgonova, M.P.; Okhlopkova, Z.M.; Nawaz, M.A.; Egorova, P.S.; Golokhvast, K.S. Supercritical Extraction and Identification of Bioactive Compounds in Dryopteris fragrans (L.) Schott. Pharmaceuticals 2025, 18, 299. [Google Scholar] [CrossRef] [PubMed]
- Hu, P.; Liang, Q.-L.; Luo, G.-A.; Zhao, Z.-Z.; Jiang, Z.-H. Multi-component HPLC Fingerprinting of Radix Salviae Miltiorrhizae and Its LC-MS-MS Identification. Chem. Pharm. Bull. 2005, 53, 677–683. [Google Scholar] [CrossRef]
- Yang, S.T.; Wu, X.; Rui, W.; Guo, J.; Feng, Y.F. UPLC/Q-TOF-MS Analysis for Identification of Hydrophilic Phenolics and Lipophilic Diterpenoids from Radix Salviae Miltiorrhizae. Acta Chromatogr. 2015, 27, 711–728. [Google Scholar] [CrossRef]
- Emad, A.M.; Rasheed, D.M.; El-Kased, R.F.; El-Kersh, D.M. Antioxidant, Antimicrobial Activities and Characterization of Polyphenol-Enriched Extract of Egyptian Celery (Apium graveolens L., Apiaceae) Aerial Parts via UPLC/ESI/TOF-MS. Molecules 2022, 27, 698. [Google Scholar] [CrossRef]
- Llorent-Martínez, E.J.; Spínola, V.; Gouveia, S.; Castilho, P.C. HPLC-ESI-MSn characterization of phenolic compounds, terpenoid saponins, and other minor compounds in Bituminaria bituminosa. Ind. Crops Prod. 2015, 69, 80–90. [Google Scholar] [CrossRef]
- Pérez-Ramírez, I.F.; Escobedo-Alvarez, D.E.; Mendoza-Sánchez, M.; Rocha-Guzmán, N.E.; Reynoso-Camacho, R.; Acosta-Gallegos, J.A.; Ramos-Gómez, M. Phytochemical Profile and Composition of Chickpea (Cicer arietinum L.): Varietal Differences and Effect of Germination under Elicited Conditions. Plants 2023, 12, 3093. [Google Scholar] [CrossRef] [PubMed]
- Sun, S.; Gao, Y.; Ling, X.; Lou, H. The combination effects of phenolic compounds and fluconazole on the formation of ergosterol in Candida albicans determined by high-performance liquid chromatography/tandem mass spectrometry. Anal. Biochem. 2005, 336, 39–45. [Google Scholar] [CrossRef] [PubMed]
- Wu, Y.; Xu, J.; He, Y.; Shi, M.; Han, X.; Li, W.; Zhang, X.; Wen, X. Metabolic Profiling of Pitaya (Hylocereus polyrhizus) during Fruit Development and Maturation. Molecules 2019, 24, 1114. [Google Scholar] [CrossRef] [PubMed]
- Sun, L.; Tao, S.; Zhang, S. Characterization and Quantification of Polyphenols and Triterpenoids in Thinned Young Fruits of Ten Pear Varieties by UPLC-Q TRAP-MS/MS. Molecules 2019, 24, 159. [Google Scholar] [CrossRef]




Disclaimer/Publisher’s Note: The statements, opinions and data contained in all publications are solely those of the individual author(s) and contributor(s) and not of MDPI and/or the editor(s). MDPI and/or the editor(s) disclaim responsibility for any injury to people or property resulting from any ideas, methods, instructions or products referred to in the content. |
© 2026 by the authors. Licensee MDPI, Basel, Switzerland. This article is an open access article distributed under the terms and conditions of the Creative Commons Attribution (CC BY) license.
Share and Cite
Chikida, N.N.; Razgonova, M.P.; Nawaz, M.A.; Belousova, M.K.; Golokhvast, K.S. The Research of New Natural Spontaneous Fertile Attention: Title Altered Hybrids (Aegilops trivialis Migusch. Et Chak) Using Laser Microscopy and Tandem Mass Spectrometry. Int. J. Mol. Sci. 2026, 27, 4758. https://doi.org/10.3390/ijms27114758
Chikida NN, Razgonova MP, Nawaz MA, Belousova MK, Golokhvast KS. The Research of New Natural Spontaneous Fertile Attention: Title Altered Hybrids (Aegilops trivialis Migusch. Et Chak) Using Laser Microscopy and Tandem Mass Spectrometry. International Journal of Molecular Sciences. 2026; 27(11):4758. https://doi.org/10.3390/ijms27114758
Chicago/Turabian StyleChikida, Nadezhda N., Mayya P. Razgonova, Muhammad Amjad Nawaz, Maria Kh. Belousova, and Kirill S. Golokhvast. 2026. "The Research of New Natural Spontaneous Fertile Attention: Title Altered Hybrids (Aegilops trivialis Migusch. Et Chak) Using Laser Microscopy and Tandem Mass Spectrometry" International Journal of Molecular Sciences 27, no. 11: 4758. https://doi.org/10.3390/ijms27114758
APA StyleChikida, N. N., Razgonova, M. P., Nawaz, M. A., Belousova, M. K., & Golokhvast, K. S. (2026). The Research of New Natural Spontaneous Fertile Attention: Title Altered Hybrids (Aegilops trivialis Migusch. Et Chak) Using Laser Microscopy and Tandem Mass Spectrometry. International Journal of Molecular Sciences, 27(11), 4758. https://doi.org/10.3390/ijms27114758