Article

Multi-Omic Analysis Reveals the Potential Anti-Disease Mechanism of Disease-Resistant Grass Carp

1
Engineering Research Center of Polyploid Fish Reproduction and Breeding of the State Education, Ministry, College of Life Sciences, Hunan Normal University, Changsha 410081, China
2
Nansha-South China Agricultural University Fishery Research Institute, Guangzhou 511457, China
*
Author to whom correspondence should be addressed.
Int. J. Mol. Sci. 2025, 26(8), 3619; https://doi.org/10.3390/ijms26083619
Submission received: 21 February 2025 / Revised: 31 March 2025 / Accepted: 4 April 2025 / Published: 11 April 2025

Abstract

The gut–liver axis is essential in animal disease and health. However, the role of the gut–liver axis in the anti-disease mechanism of disease-resistant grass carp (DRGC) derived from the backcross of female gynogenetic grass carp (GGC) and male grass carp (GC) remains unclear. This study analyzed the changes in gut histopathology, fecal intestinal microflora and metabolites, and liver transcriptome between GC and DRGC. Histological analysis revealed significant differences in the gut between DRGC and GC. In addition, microbial community analyses indicated that hybridization induced gut microbiome variation by significantly increasing the proportion of Firmicutes and Bacteroidota in DRGC. Metabolomic data revealed that the hybridization-induced metabolic change was probably characterized by being related to taurocholate and sphinganine in DRGC. Transcriptome analysis suggested that the enhanced disease resistance of DRGC was primarily attributed to immune-related genes (SHMT2, GOT1, ACACA, DLAT, GPIA, TALDO1, G6PD, and FASN). Spearman’s correlation analysis revealed a significant association between the gut microbiota, immune-related genes, and metabolites. Collectively, the gut–liver axis, through the interconnected microbiome–metabolite–gene pathway, may play a crucial role in the mechanism of greater disease resistance in DRGC, offering valuable insights for advancing the grass carp cultivation industry.

1. Introduction

The intestinal microorganism is believed to function as an additional organ [1,2], and the microbiome significantly contributes to the maintenance of biological processes in the host [3]. Growing research on host–microbe interactions has demonstrated that gut microbiota plays a vital role in host health and immune function [4,5]. Numerous factors, such as habitat environment, season, host genetics, developmental stage, nutrition level, and diet composition, have been reported to influence the origin and composition of fish gut microbiota, with the habitat environment potentially being the primary determinant [6].
Furthermore, alterations in gut bacteria, driven by the host’s genetics, could modify fish immunity and their ability to resist diseases [7,8]. In general, the gut microbiome plays a central role in regulating host immunity through the connection between the intestines and the liver [9]. The liver receives blood from the intestine and is profoundly impacted by the gut microbiota and its metabolites [10]. Hence, a close association is observed between the liver and the intestine, describing the gut–liver axis [11]. Growing evidence in animal research indicates that the gut–liver axis affects the host’s health and disease [12].
Fish represents a high-quality animal protein source for human consumption [13]. In the aquaculture industry, grass carp (Ctenopharyngodon Idella, GC) are among the most extensively cultivated freshwater fish worldwide, contributing greatly to aquaculture production [14]. In China, grass carp rank first in terms of output and economic value in freshwater aquaculture [15]. However, GC are susceptible to microbial invasion due to high industrial density and intensive farming practices, increasing vulnerability to disease outbreaks [16]. The primary GC diseases include viral hemorrhagic disease and recurring bacterial infections from seasonal bacteria, leading to major economic losses in aquaculture [17]. Recent studies have investigated the effects of enhancing feed ingredients to boost immunity in GC, such as incorporating antimicrobial peptides, gut probiotics, dietary choline, curcumin meal, and developing vaccines [18,19,20,21,22]. Notably, genetic breeding methods were employed to create new strains of grass carp with greater disease resistance and faster growth, including gynogenetic grass carp [23], genetically selected grass carp “Husu No.2” [24], and hybrid grass carp [25]. In the last few years, our team has produced disease-resistant grass carp (DRGC) by backcrossing female gynogenetic grass carp (GGC) with male GC, resulting in improved survival, growth, and disease resistance [26]. However, the role of the gut–liver axis in disease resistance in DRGC remains unexplored.
This research investigated the possible anti-disease mechanisms in disease-resistant grass carp by analyzing the gut histology, microbiota, metabolome, and liver transcriptome. The intestine of both DRGC and GC was subjected to histological analysis, and the microbiota and metabolome were determined. Transcriptome analysis was conducted on liver tissues from both groups of grass carp. This study elucidates the potential anti-disease mechanism in disease-resistant grass carp, enhancing aquaculture productivity and economic efficiency while supporting environmental protection and food safety, and providing essential data for grass carp immunology research.

2. Results

2.1. Intestinal Histology

Figure 1 presents the H&E staining of the intestinal tissues of DRGC and GC. The DRGC group exhibited significantly increased villus length and gut wall thickness compared to the GC group (p < 0.05), as shown in Table 1. The villus width was significantly greater in the GC group than in the DRGC group (p < 0.05).

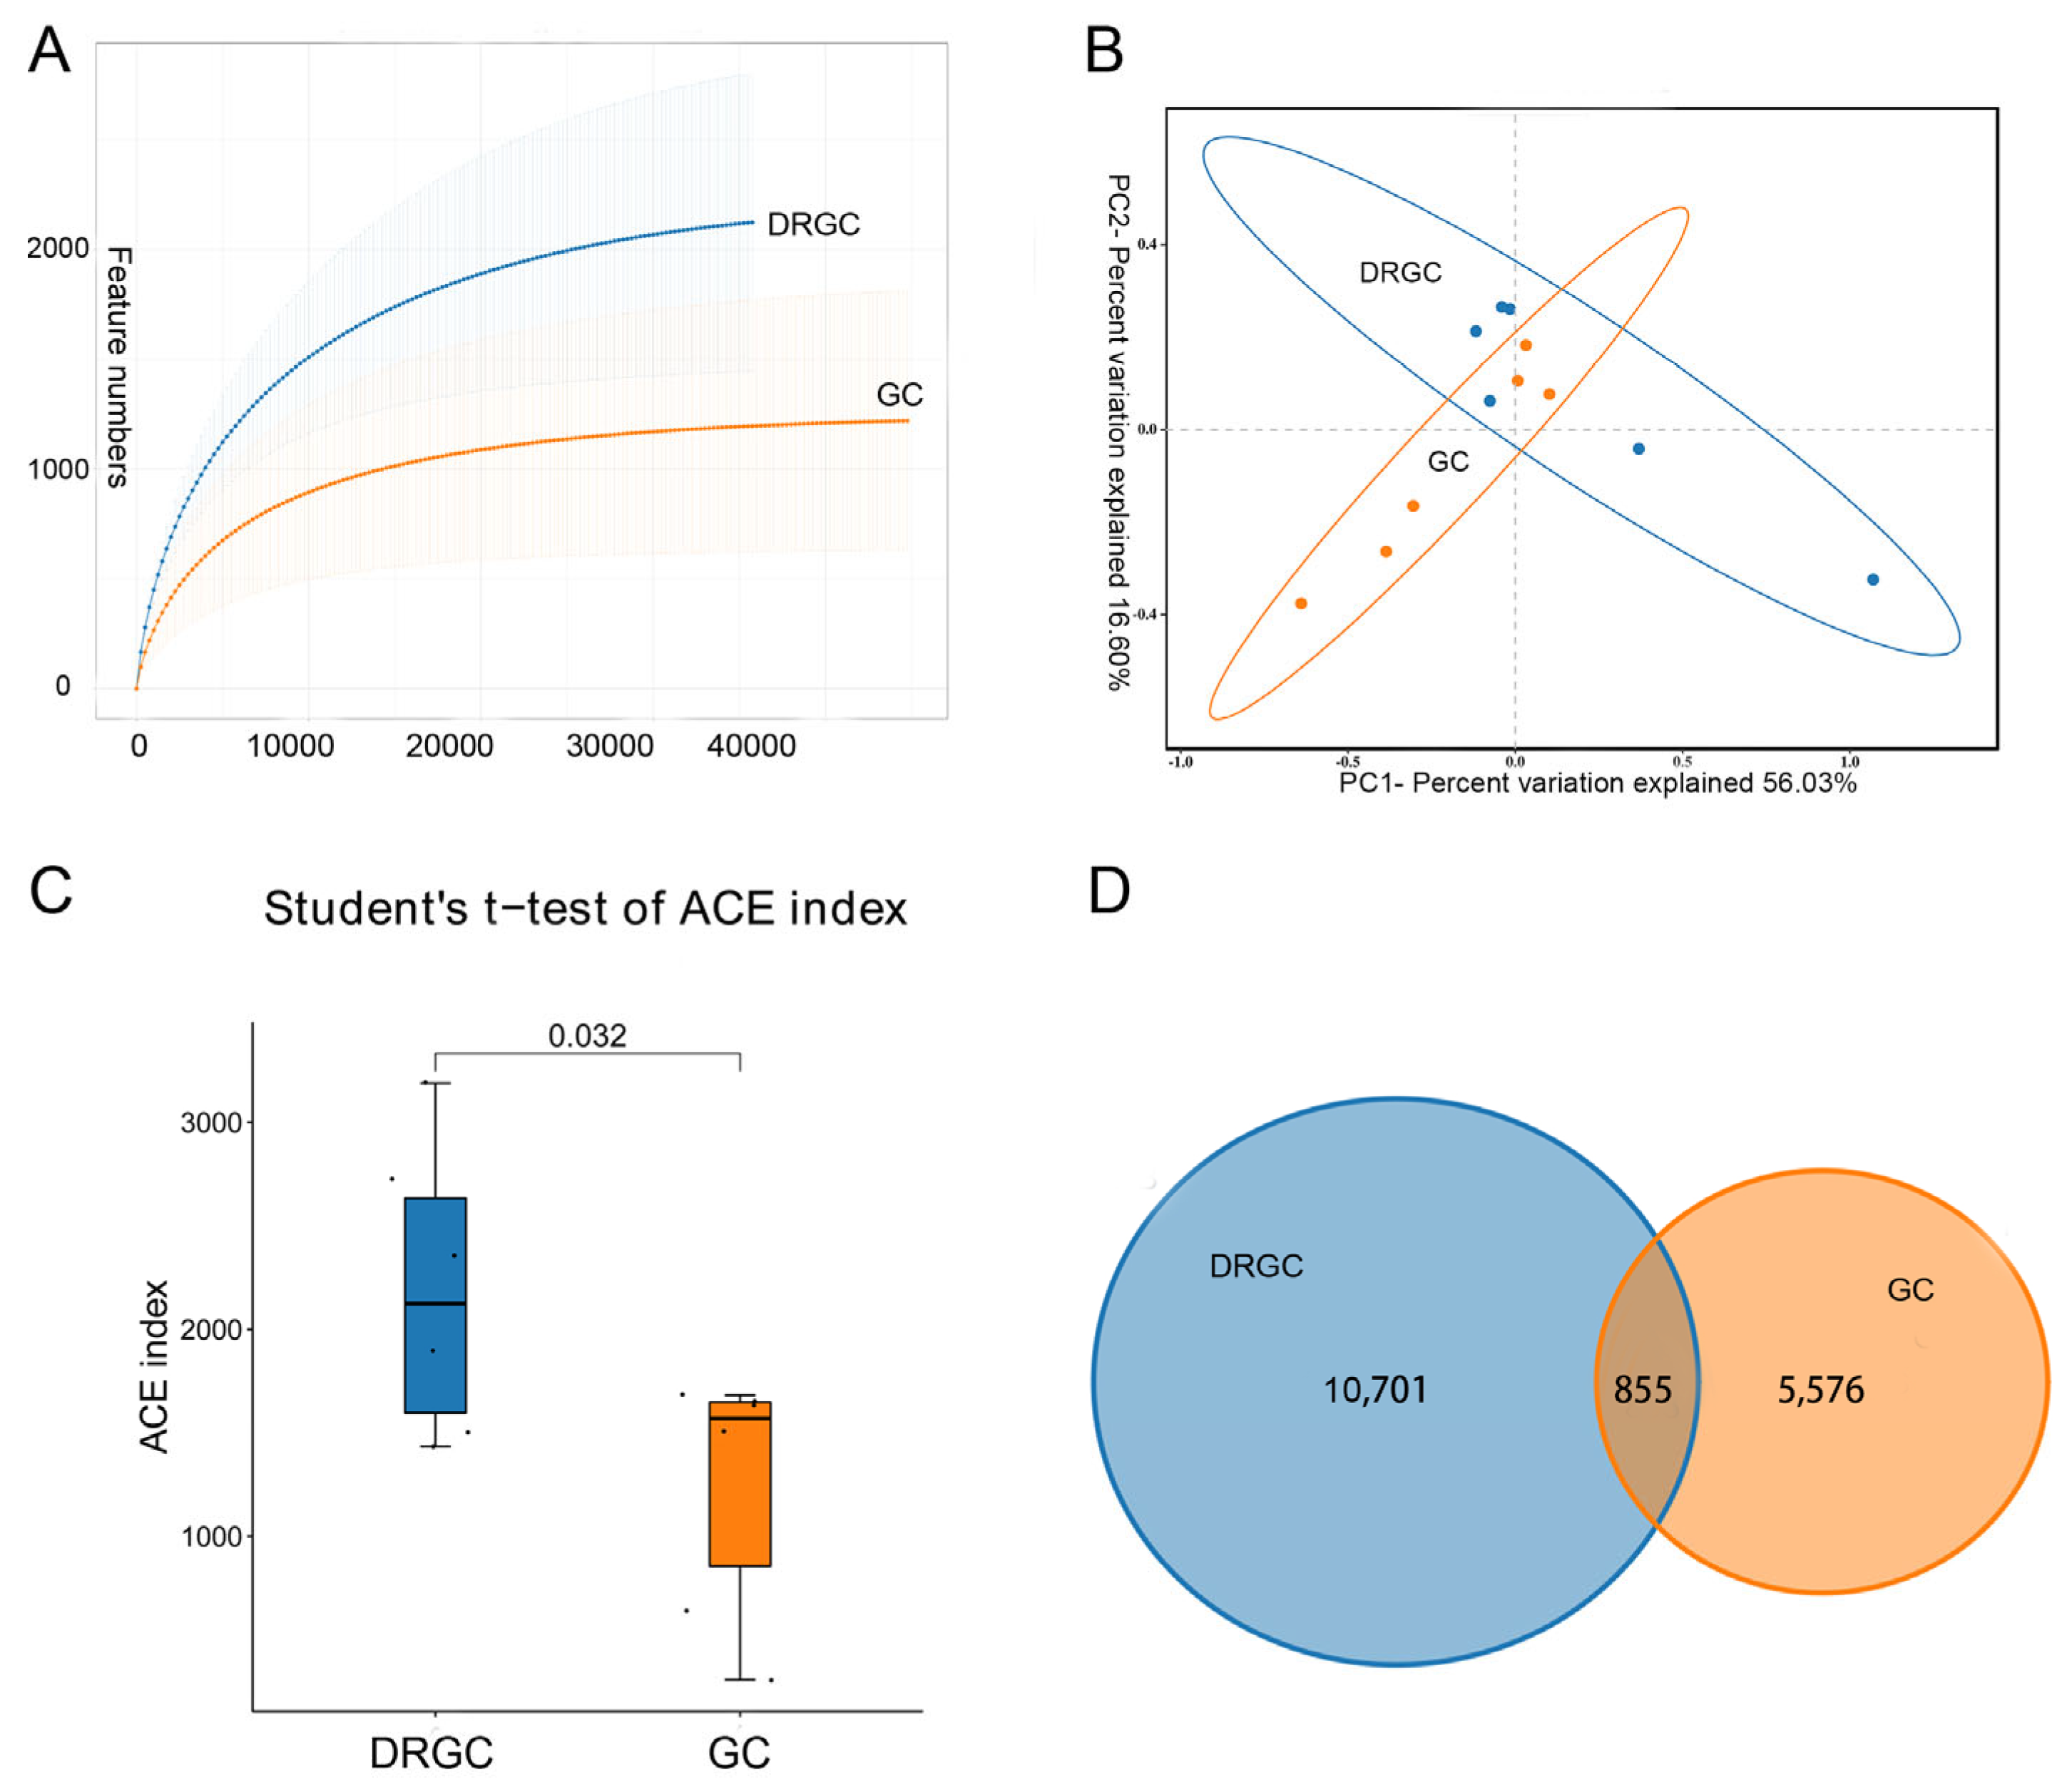
2.2. 16S rRNA Sequencing Analysis and Taxonomic Annotation

A comprehensive analysis of all intestinal samples yielded 855,682 effective tags (Table S1). The sequence sparse curve revealed that the sample size adequately represents community richness, and further data analysis was performed (Figure 2A). The principal coordinate analysis (PCoA) indicated a greater degree between GC and DRGC (Figure 2B). A difference in the α diversity index of intestinal microbiota was found between the DRGC and GC groups (Figure 2C) (p < 0.05). In the DRGC group, 11,556 operational taxonomic units (OTUs) were identified, including 10,701 unique OTUs, while the GC group had 6431 OTUs, among which 5576 were unique (Figure 2D).

2.3. Intestinal Microbial Composition

Among all intestinal samples, Firmicutes and Proteobacteria were the predominant taxa (Figure 3A). In the DRGC group, the abundance of Fusobacteriota and Euryarchaeota decreased, whereas Firmicutes, Bacteroidota, Halobacterota, Actinobacteriota, and Chloroflexi increased compared to the GC group (Table S2). The gut of grass carp contained nine predominant bacterial families, including Fusobacteriaceae, Halomicrobiaceae, Brevinemataceae, Aeromonadaceae, and Lachnospiraceae (Figure 3B). Compared with the GC group, Halomicrobiaceae and Competibacteraceae showed increased abundance (Table S3). The functional prediction of the bacterial structure indicated that the DRGC group’s intestinal tract had a higher relative abundance of Gram-negative bacteria and a lower relative abundance of Gram-positive, facultatively anaerobic, and anaerobic bacteria compared to the GC group (Figure 4A–D). Moreover, microbiome phenotype predictions indicated that changes in bacterial diversity may primarily influence immune regulation (Figure 4E).

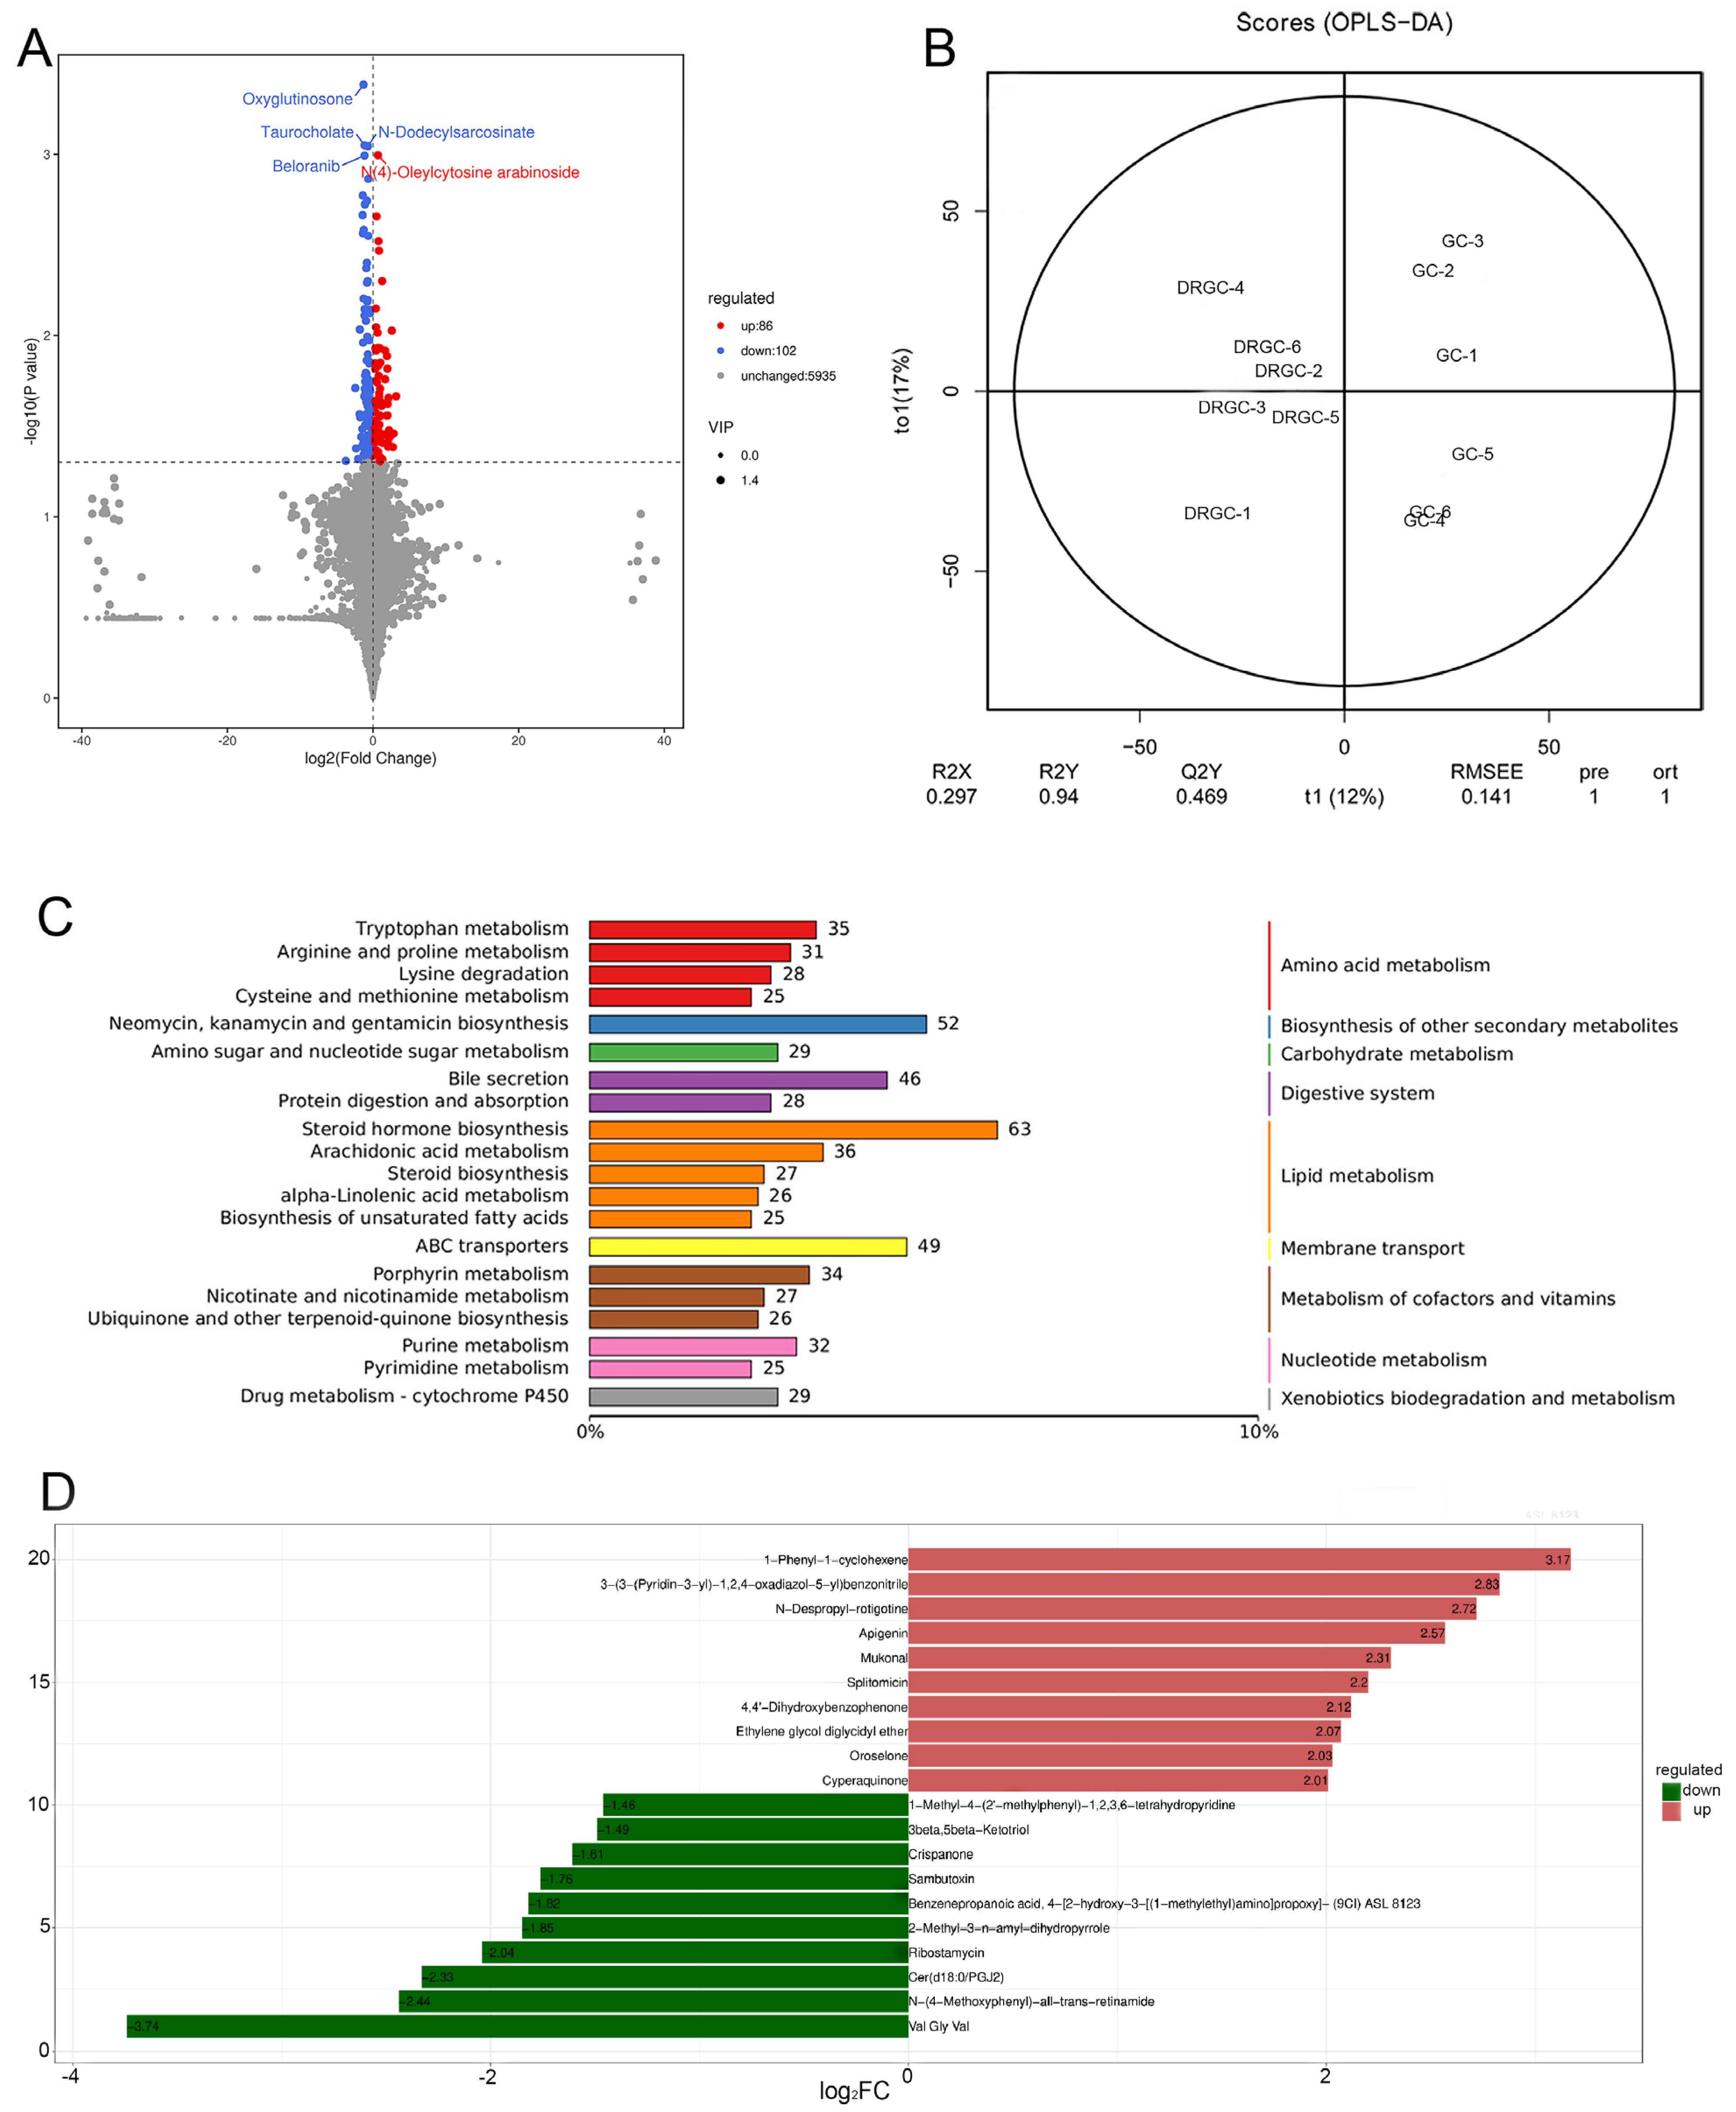
2.4. Metabolome Analysis
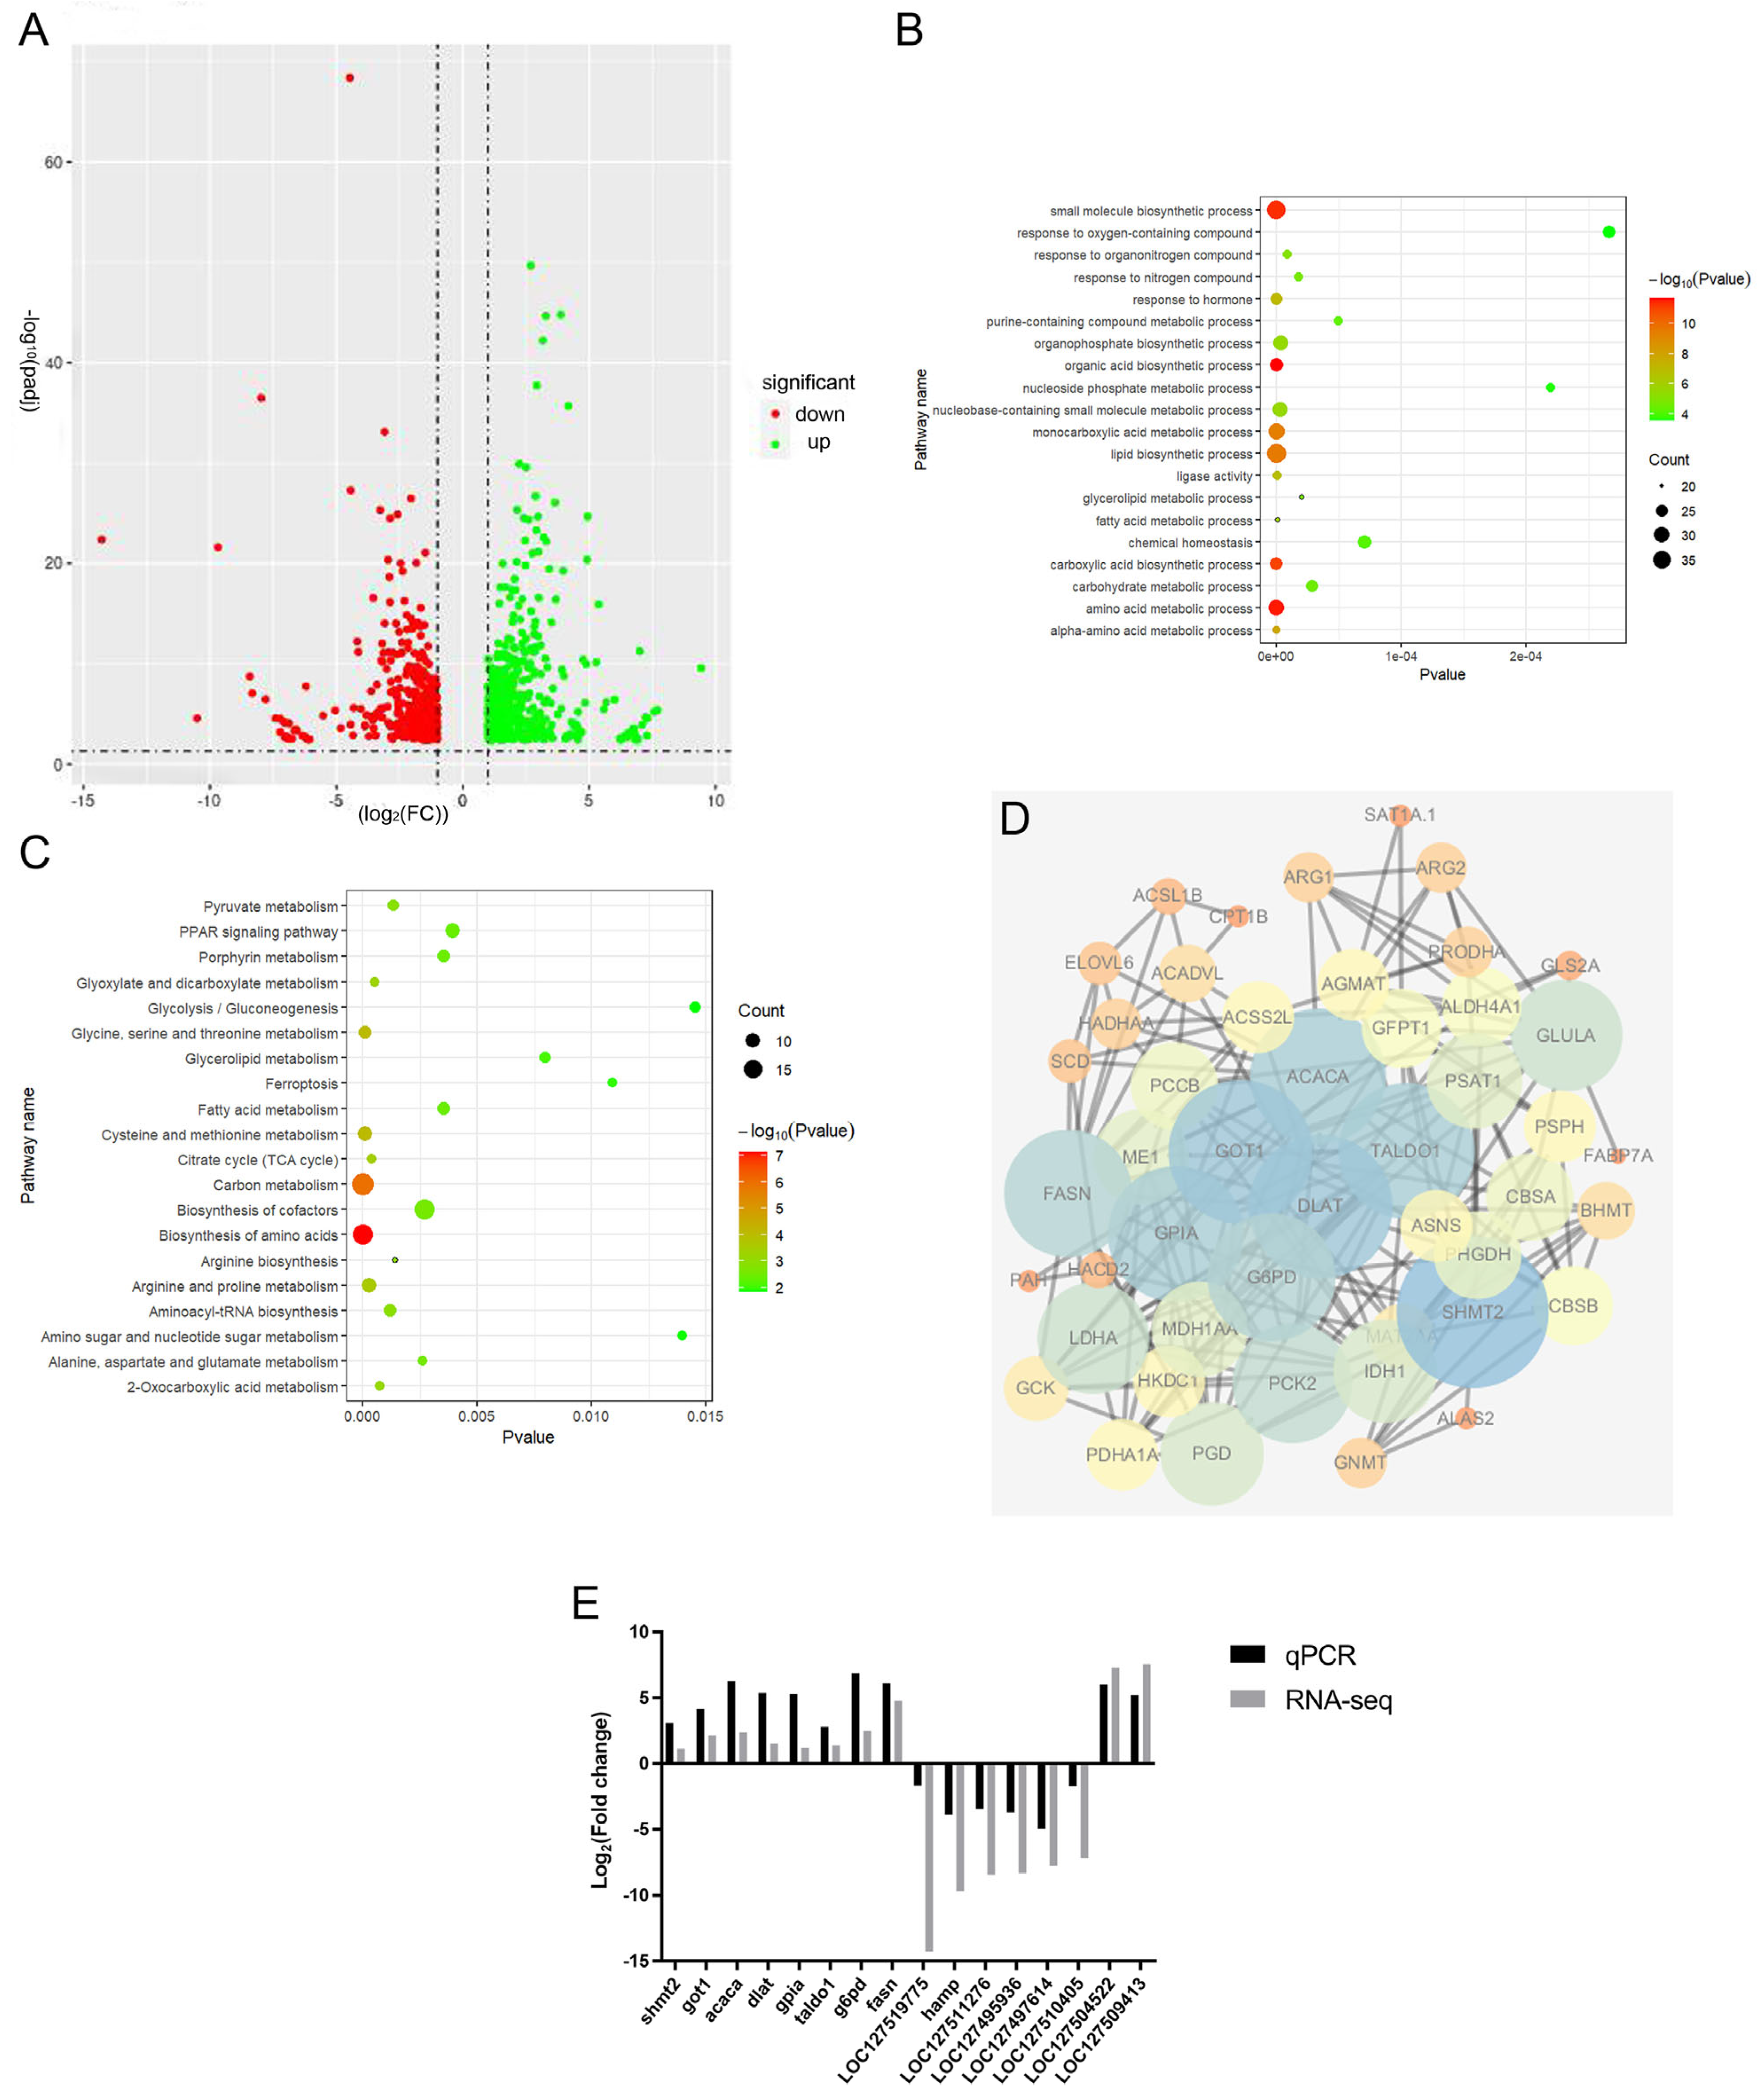
Twelve fecal samples from the DRGC and GC groups were subjected to non-targeted metabolomics analysis using liquid chromatography–mass spectrometry (LC-MS). According to the mass spectrometry analysis, 3628 metabolites were identified in the positive ion mode (Table S4), and 2495 metabolites were found in the negative ion mode (Table S5). Orthogonal partial least squares–discriminant analysis (OPLS-DA) highlighted a clear differentiation between the two groups (Figure S1 and Figure 2). In comparison to the GC group, the DRGC group exhibited a significantly higher count of downregulated metabolites compared to upregulated ones (Figure 5A). The partial least squares–discriminant analysis (PLS-DA) score chart visually demonstrates the model’s classification effectiveness. The DRGC and GC group samples were distinctly separated, suggesting a significant classification effect (Figure 5B). The Kyoto Encyclopedia of Genes and Genomes (KEGG) pathway analysis revealed notable enrichment in lipid, nucleotide, and amino acid metabolism (Figure 5C). The study analyzed differential metabolites between the DRGC and GC groups, exploring the contribution of these metabolites to the observed differences. The primary differential metabolites between the two groups were Val Gly Val, 1-Phenyl-1-cyclohexene, 3-(3-(Pyridin-3-yl)-1,2,4-oxadiazol-5-yl) benzonitrile, N-Despropyl-rotigotine, and Apigenin (Figure 5D).

2.5. Transcriptome

Six cDNA libraries were constructed and sequenced. Table 2 displays a summary of the characteristics of these libraries. Post-quality control, each library contained between 43,187,696 and 50,043,924 clean reads, with Q30 values exceeding 96.15%. Subsequently, the clean reads were mapped to the grass carp reference genome, with mapping rates ranging from 91.04% to 92.5% across different libraries.

2.6. Identification of Differentially Expressed Genes (DEGs)

DEGs between the GC and DRGC groups were identified by DESeq2 differential expression analysis and visualized with volcano plots (Figure 6A). A total of 954 DEGs were identified, including 396 that were upregulated and 558 that were downregulated. Thereafter, Gene Ontology (GO) and KEGG pathway enrichment analyses were conducted to identify the biological functions of DEGs between the GC and DRGC groups. The predominant GO terms included lipid biosynthetic process, small-molecule biosynthetic process, and monocarboxylic acid metabolic process (Figure 6B). Based on the KEGG pathway classification, twenty-five pathways were associated with metabolism; in contrast, one pathway each was linked to genetic information processing, cellular processes, and organismal systems. KEGG enrichment analysis revealed that DEGs were predominantly associated with pathways such as carbon metabolism, amino acid biosynthesis, glycine, serine, and threonine metabolism, cysteine and methionine metabolism, arginine and proline metabolism, the citrate cycle (TCA cycle), and glyoxylate and dicarboxylate metabolism (Figure 6C). Hub genes linked to DRGC immunity were identified, and a PPI network of immune-related genes detected in the GO and KEGG analyses and the previous literature was constructed using the STRING tool and analyzed with Cytoscape software (v3.7.1). Following the PPI network analysis, eight genes (SHMT2 (serine hydroxymethyltransferase 2), GOT1 (glutamic-oxaloacetic transaminase 1), ACACA (acetyl-CoA carboxylase alpha), DLAT (dihydrolipoamide S-acetyltransferase), GPIA (glucose-6-phosphate isomerase a), TALDO1 (transaldolase 1), G6PD (glucose-6-phosphate dehydrogenase), and FASN (fatty acid synthase)) were identified as hub genes due to their interaction degrees exceeding 16 (Figure 6D, Table S6).

2.7. Verification

To ensure the accuracy of the RNA-seq results, the expression of 16 DEGs was measured by qRT-PCR using the same RNA samples that were used for the sequencing database. The primer sequences of the identified DEGs are listed in Table S7. The analysis of the 16 DEGs using qRT-PCR showed similar results to the RNA-seq analysis (Figure 6E).

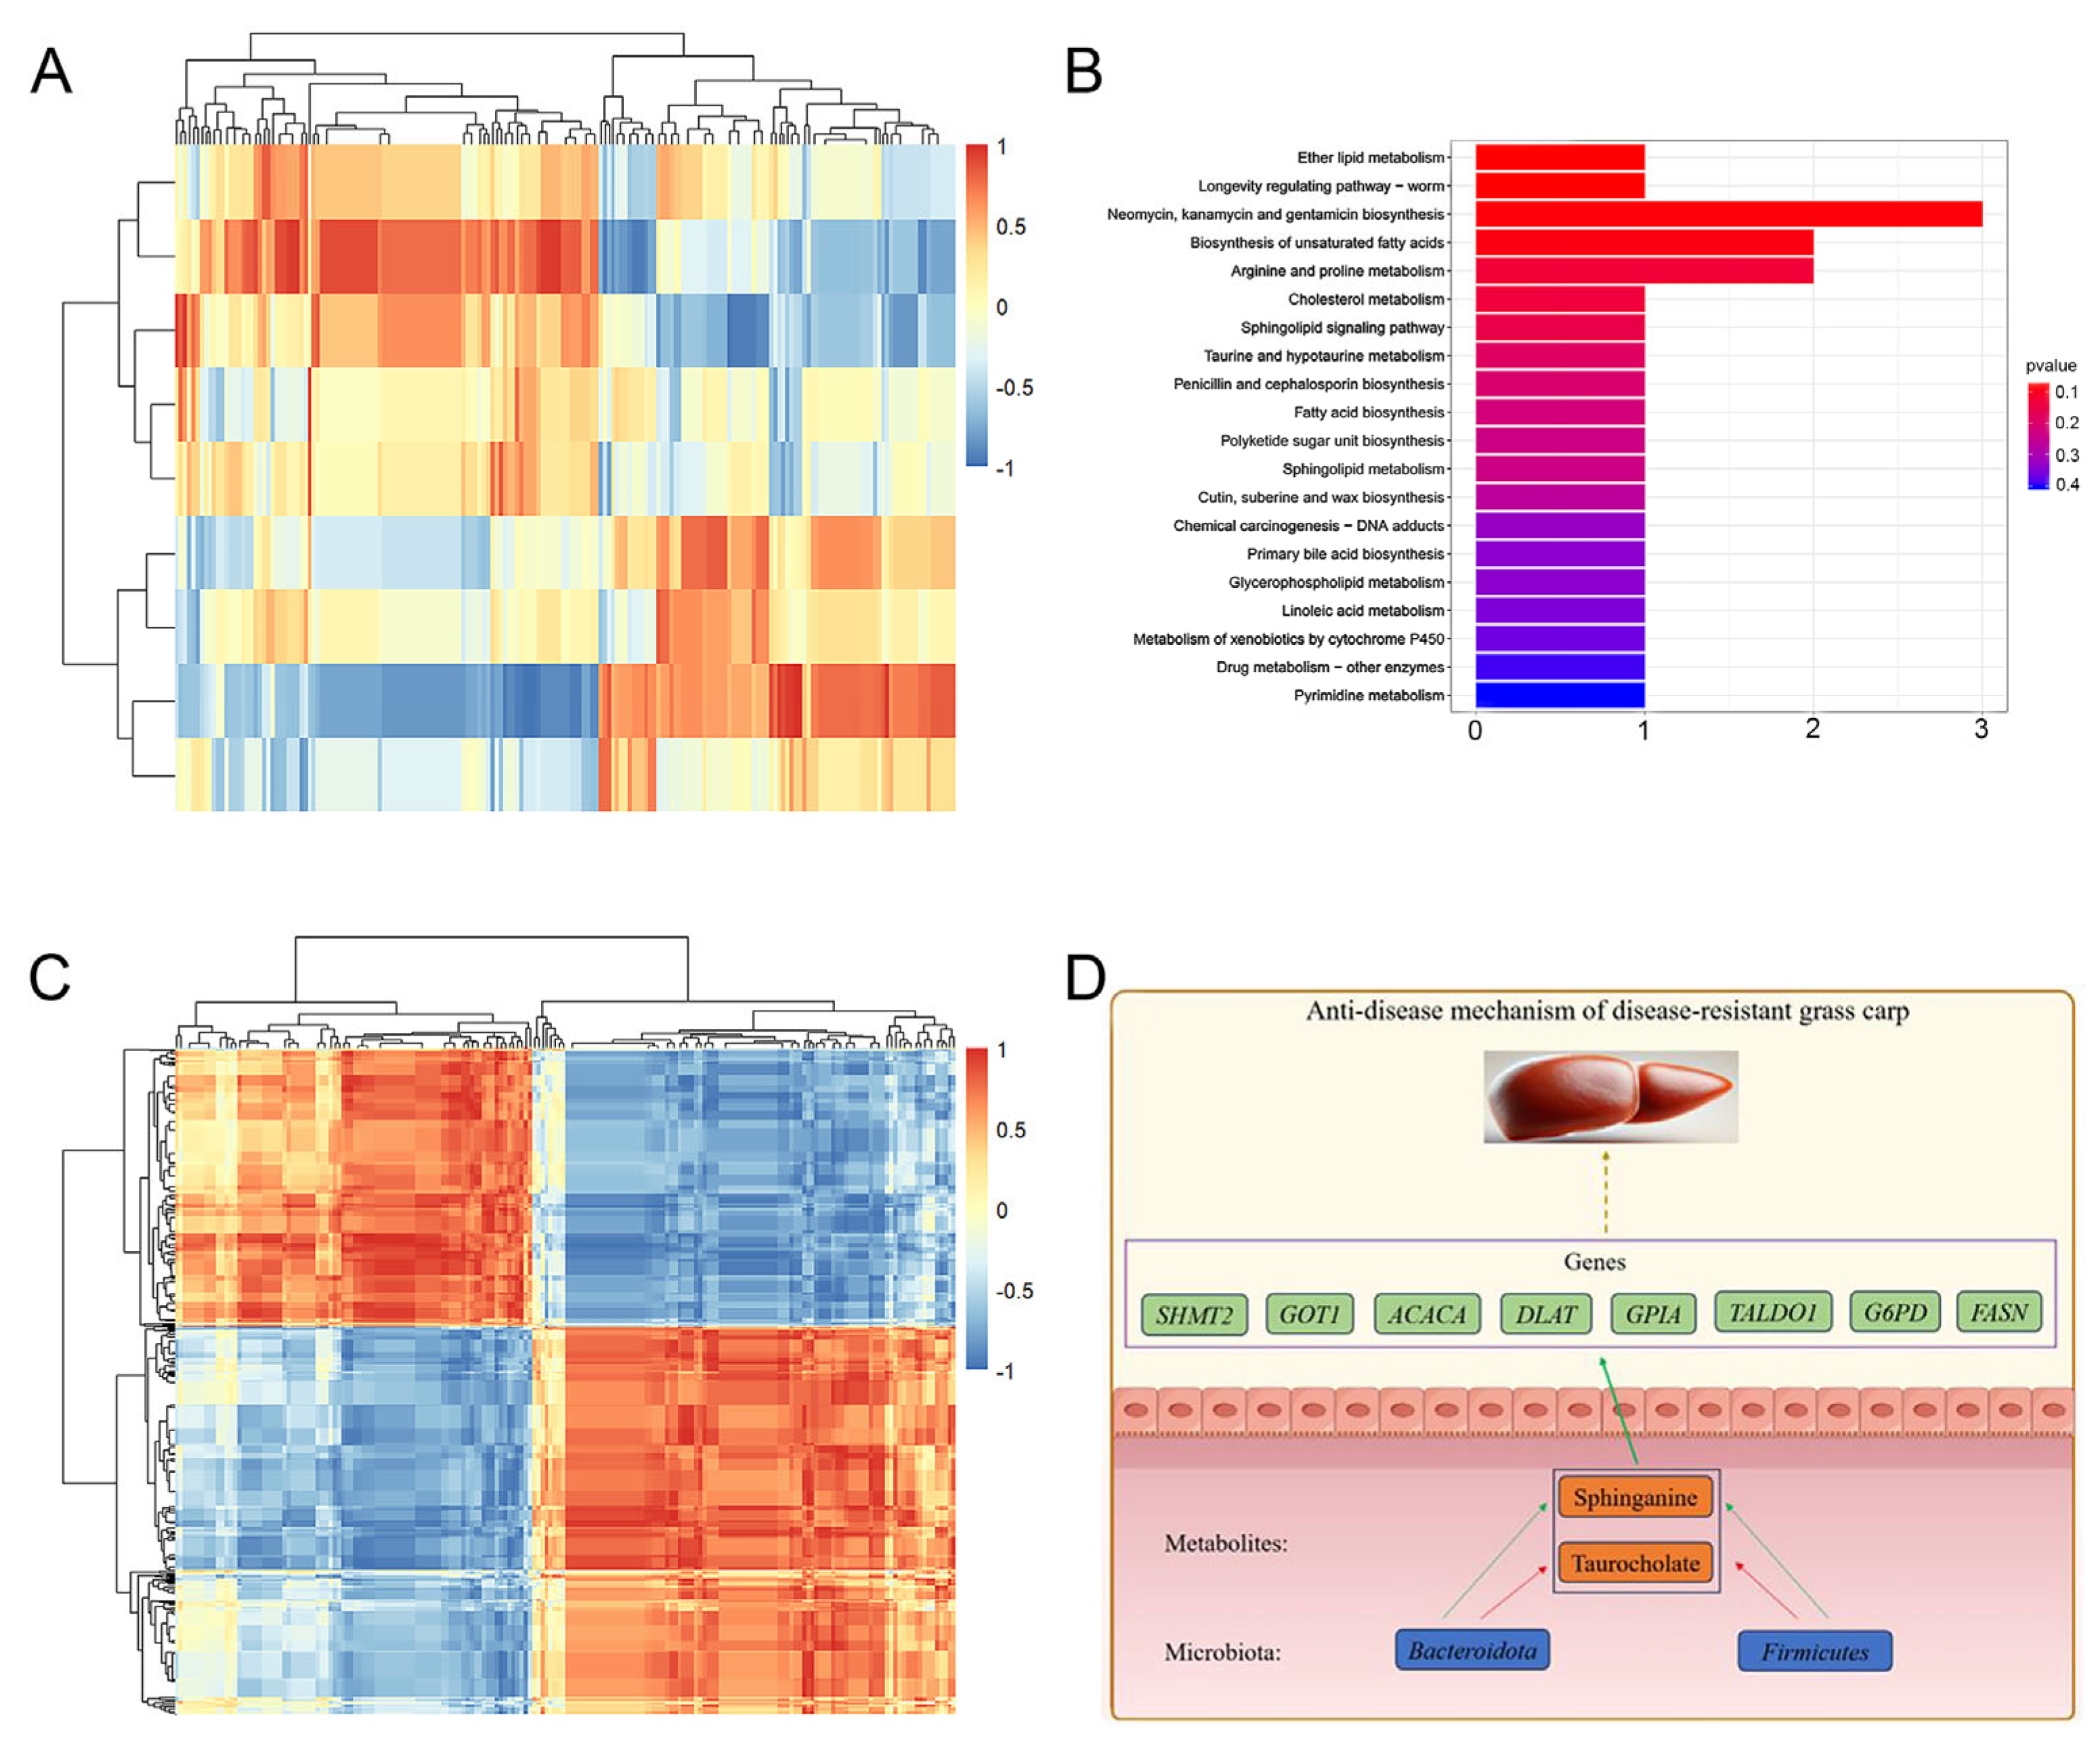
2.8. Multi-Omic Joint Analysis

2.8.1. Correlation Analysis Between Microbiome and Metabolome

Differences were observed in the gut microbiota and metabolic characteristics between GC and DRGC. A correlation analysis was performed to investigate the relationship between potential metabolites and key gut microbiota at the phylum level. Figure 7A illustrates a heatmap showing Spearman’s correlation analysis between gut microbiota at the phylum level and metabolites (Table S8). The study revealed a significant association between 9 gut microbiota phyla and 188 metabolites. As shown in Figure 7B, 18 metabolites associated with immune-related pathways were identified, including those involved in ether lipid metabolism, neomycin, kanamycin, and gentamicin biosynthesis, unsaturated fatty acid biosynthesis, arginine and proline metabolism, cholesterol metabolism, sphingolipid signaling, taurine and hypotaurine metabolism, penicillin and cephalosporin biosynthesis, fatty acid biosynthesis, sphingolipid metabolism, primary bile acid biosynthesis, glycerophospholipid metabolism, linoleic acid metabolism, and pyrimidine metabolism. Taurocholate showed a negative correlation with Firmicutes and a positive correlation with Bacteroidota among the metabolites in these pathways. Sphinganine demonstrated a positive correlation with both Firmicutes and Bacteroidota.

2.8.2. Correlation Analysis Between Metabolome and Transcriptome

To explore the relationship between metabolites and genes, a correlation analysis was performed on the metabolome and transcriptome. In addition, a correlation analysis between metabolites and differentially expressed genes was carried out using Spearman’s correlation coefficient (Figure 7C) (Table S9). Taurocholate and sphinganine showed positive associations with the eight immune-related genes (SHMT2, GOT1, ACACA, DLAT, GPIA, TALDO1, G6PD, and FASN). These genes can be enriched in the immune-related pathway of arginine and proline metabolism.

3. Discussion

Fish intestinal traits are influenced not only by feeding habits but also by host genetics [27,28]. In our study, we observed significant differences in intestinal morphology (e.g., villus length and gut wall thickness) between DRGC and GC, which aligns with the findings of Li et al. [29] on gut structural alterations in hybrid fish progenies. We further demonstrate that these hybridization-induced morphological changes may drive shifts in gut microbiota composition [30], as evidenced by distinct microbial community structures between DRGC and GC. Our results corroborate the findings of previous studies [31,32] showing host genetics as a key determinant of microbial diversity.
The gut microbiota plays a pivotal role in immune homeostasis [33,34]. In the present study, we identified Firmicutes and Bacteroidetes as dominant phyla in DRGC, consistent with reports in healthy aquaculture species [35,36,37]. Notably, we observed a significant increase in Firmicutes (including probiotic genera Bacillus and Lactobacillus) and Bacteroidetes in DRGC compared to GC. This finding is particularly relevant because Bacillus and Lactobacillus are well-documented enhancers of disease resistance and immune function in fish [38,39,40,41]. For example, dietary supplementation with Bacillus amyloliquefaciens improved immune responses in yellow catfish [42], while Lactobacillus strains boosted immunity in Nile tilapia and Penaeus vannamei [43,44]. Our data extend these observations by showing that the DRGC’s enriched Firmicutes/Bacteroidetes may synergistically enhance immune capacity through microbial–host interactions.
Through integrated metabolomic and transcriptomic analyses, we identified taurocholate and sphinganine as key immune-modulating metabolites in DRGC. Specifically, taurocholate exhibited anti-inflammatory properties akin to its role in murine colitis models [45], while sphinganine influenced immune cell dynamics via sphingolipid synthesis [46,47]. Importantly, we discovered that these metabolites were strongly correlated (Spearman’s analysis) with eight immune-related genes in DRGC: SHMT2, GOT1, ACACA, DLAT, GPIA, TALDO1, G6PD, and FASN (Figure 7D). SHMT2, a key enzyme in one-carbon metabolism, may be associated with the immunotherapy response in patients with renal cancer [48]. Additionally, GOT1 encodes cytosolic aspartate aminotransferase, a key MAS enzyme facilitating the reversible amino group transfer between glutamate and aspartate [49]. Xu et al. [50] demonstrated that the metabolic enzyme GOT1 is crucial for the proliferation and effector functions of effector CD8+ T cells, particularly under serine-free conditions, due to its upregulation. In triploid crucian carp, GOT1 potentially regulates innate immunity by influencing the biosynthesis and transformation of key antibiotics and antimicrobial peptides [51]. ACACA is typically found in lipogenic tissues such as liver and adipose [52] and is associated with immune response [53]. DLAT expression showed a positive correlation with various immunological features, including immune cell infiltration, the cancer-immunity cycle, pathways predicted for immunotherapy, and inhibitory immune checkpoints [54]. Furthermore, Chen et al. [55] reported that the DLAT and LDHA genes potentially modulate the immune microenvironment in dilated cardiomyopathy by affecting activated dendritic cells, activated mast cells, and M0 macrophages. Glycoprotein Ia (GPIA), or integrin alpha 2 (ITGA2) [56], facilitates cell adhesion to the extracellular matrix and is crucial for bidirectional signaling, cell motility, stemness, and angiogenesis [57]. Variations in ITGA2 expression subtly and dynamically influence the tumor immune microenvironment and immunogenicity [58]. ITGA2 is reported to significantly influence the innate immune response in fish [59]. TALDO1, an essential enzyme in the pentose phosphate pathway, facilitates the production of ribo-5-phosphate (R5P) for nucleic acid synthesis and nicotinamide adenine dinucleotide phosphate (NADPH) for lipid biosynthesis [60]. Cen and Lu [61] performed functional enrichment and immune infiltration analysis and revealed that TALDO1 negatively regulates the immune response. The liver’s production of plasma proteins, such as acute phase reactants, cytokines, and complement factors, highlights the importance of G6PD function in systemic immunity [62]. G6PD-deficient hepatocytes show altered transcriptomic networks in redox and immune response pathways when exposed to oxidant stress [63]. FASN is a crucial enzyme for the de novo synthesis of long-chain fatty acids [64]. FASN regulates immune cell survival, activation, differentiation, and function. Consequently, FASN contributes to the onset and progression of various conditions, including tumors, cardiovascular diseases, inflammatory diseases, autoimmune diseases, infectious diseases, and other pathological states [65]. Comparative analysis revealed significant upregulation of the eight immune-associated genes in DRGC compared to GC, suggesting their collective contribution to enhanced immunocompetence against pathogenic challenges. This integrated gene–metabolite network provides mechanistic insights into DRGC’s superior disease resistance, potentially mediated through synergistic regulation of immune–metabolic pathways, antimicrobial peptide synthesis, and cellular immunity optimization.
Our study highlights the gut–liver axis as a critical mediator of DRGC immunity. The observed correlations between gut microbiota (Firmicutes/Bacteroidetes), liver metabolites (taurocholate/sphinganine), and liver immune genes suggest bidirectional crosstalk. While previous studies focused on toxin-induced gut–liver axis disruption [66,67,68,69,70,71], our work uniquely demonstrates its physiological role in hybrid fish immunity. Specifically, we propose that DRGC’s enriched probiotics (Firmicutes and Bacteroidetes) may prime hepatic immune gene expression via metabolite signaling and that taurocholate/sphinganine act as molecular bridges between intestinal microbes and liver immunity (Figure 7D). This model diverges from toxin-centric studies by emphasizing immune optimization through host–microbe coevolution.
In conclusion, our multi-omic investigation demonstrates that hybridization drives functional optimization of the gut–liver axis in DRGC through three interconnected mechanisms. Firstly, morphological adaptations in intestinal architecture facilitate the colonization of beneficial microbial communities. Secondly, metabolic reprogramming mediated by taurocholate and sphinganine reinforces immune modulation. Thirdly, transcriptional activation of key immune-related genes (SHMT2, FASN, etc.) enhances pathogen resistance (Figure 7D). Collectively, these findings establish a novel framework for understanding hybrid vigor in aquaculture species, wherein genetic hybridization orchestrates gut–liver axis remodeling to achieve superior disease resilience.

4. Materials and Methods

4.1. Animal Materials

Grass carp and disease-resistant grass carp (300 ± 20 g) were sourced from the Engineering Research Center of Polyploid Fish Reproduction and Breeding of the State Education, Ministry, College of Life Sciences, Hunan Normal University, China. Prior to the experiment, the fish were acclimated for one week in a pathogen-free laboratory environment maintained at 22 ± 1 °C. Fecal samples from 6 grass carp and 6 disease-resistant grass carp were collected in sterile centrifuge tubes, rapidly frozen in liquid nitrogen, and stored at −80 °C for subsequent DNA extraction and microbiome/metabolomic analysis. Meanwhile, livers were collected from three randomly selected specimens in each grass carp group. The samples were promptly frozen using liquid nitrogen and stored at −80 °C for subsequent transcriptomic analysis.

4.2. Determination of the Morphological Structure of Intestinal Tissue

Six grass carp and six disease-resistant grass carp were chosen, and their midguts were removed and placed in 4% tissue fixative (P1110, Solarbio Corp., Beijing, China). The tissues were dehydrated, wax-embedded, sectioned, and stained with hematoxylin and eosin (H&E). NDP.view2 software facilitated the measurement and analysis of intestinal villus height, villus width, and intestinal wall thickness across the two groups.

4.3. 16S rRNA Gene Sequencing Analysis

Total genomic DNA was extracted from the samples following the manufacturer’s protocol of the TGuide S96 Magnetic Soil/Stool DNA Kit (Tiangen Biotech, Beijing, China). Subsequent 16S rRNA sequencing and bioinformatics analyses were conducted based on standardized methodologies adapted from previously published approaches [72]. Key experimental steps included the following:
The sequencing library was constructed by Biomarker Technologies Corporation (Beijing, China) for paired-end sequencing on the Illumina NovaSeq 6000 platform. Amplification of the V3-V4 hypervariable region of the 16S rRNA gene was achieved using universal primers 338F (5′-ACTCCTACGGGAGGCAGCAG) and 806R (5′-GGACTACHVGGGTWTCTAAT). Raw sequencing data underwent quality control processing through Trimmomatic (v0.33), followed by primer trimming with Cutadapt (v1.9.1). Paired-end reads were merged and subjected to chimera removal via UCHIME (v8.1) to generate high-quality clean reads. These sequences were clustered into operational taxonomic units (OTUs) at a 97% similarity threshold using the USEARCH pipeline (v10). Taxonomic classification of representative OTU sequences was performed in QIIME2 (v2020.6) through a naïve Bayesian algorithm against the SILVA database (Release 138). Beta diversity analysis was carried out via principal coordinate analysis (PCoA) to evaluate intergroup differences in microbial community composition. Alpha diversity indices, including ACE and Shannon metrics, were computed using QIIME2. Taxonomic abundance profiles at the order level were statistically analyzed and visualized as heatmaps through R software (v3.5.3). Functional annotation of OTUs was predicted by aligning KEGG pathway databases through PICRUSt: http://picrust.github.io (accessed on 23 October 2024).

4.4. Metabolomic Analysis

Untargeted metabolomic analysis of fish fecal samples was performed according to published methods [73], with specific procedures executed as follows: Fecal specimens (50 mg) were homogenized in 400 μL of ice-cold methanol/water (1:1, v/v) using a vortex shaker (QL-901, Qilin Bell Instruments, China) for 30 s, followed by sequential low-temperature ultrasonication (5 °C, 40 kHz, 30 min), static incubation at −20 °C (30 min), and centrifugation (13,000× g, 4 °C, 15 min) in a refrigerated centrifuge (5430R, Eppendorf, Germany). The collected supernatant was nitrogen-evaporated to dryness and reconstituted in 120 μL of acetonitrile/water (1:1, v/v), with subsequent ultrasonic centrifugation (5 min) prior to LC-MS analysis. Chromatographic separation utilized a Thermo UHPLC system equipped with an ACQUITY BEH C18 column (2.1 mm × 100 mm, 1.7 μm; Waters, USA), employing 0.1% formic acid (aqueous) and acetonitrile/isopropanol (1:1, v/v, 0.1% formic acid) as mobile phases under the following conditions: 2 μL injection volume, 0.4 mL/min flow rate, and 40 °C column temperature. Mass spectrometric detection was conducted via a Thermo UHPLC-Q instrument with electrospray ionization, configured with ion source parameters (400 °C temperature; sheath/auxiliary gas flows: 40/30 psi), voltage settings (−2800 V negative mode; 3500 V positive mode), and normalized collision energy gradients (20–40–60 V). Raw data processing through the BMK Cloud platform identified differential metabolites (VIP > 1, p < 0.05) using Student’s t-test and multivariate ANOVA statistical approaches.

4.5. Transcriptome Analysis

Total RNA extraction from liver tissues was conducted with TRIzol reagent (Invitrogen), followed by RNA integrity assessment (RIN > 8.0) and quantification using an Agilent 2100 Bioanalyzer (Santa Clara, CA, USA) coupled with a NanoDrop 2000 spectrophotometer (Thermo, MA, USA). Six RNA-seq libraries representing two experimental groups underwent polyadenylated mRNA enrichment, fragmentation, and double-stranded cDNA synthesis prior to paired-end sequencing (2 × 150 bp) on an Illumina NovaSeq 6000 platform. Raw sequencing reads were processed with Fastp (v0.23.4) for adapter trimming and quality filtering, followed by integrity validation through FastQC (v0.12.1). HISAT2 (v2.2.0) aligned clean reads to the Ctenopharyngodon idella reference genome (GenBank accession: GCF_019924925.1), with gene expression quantified as FPKM (fragments per kilobase million). Differential expression analysis between DRGC and GC groups was implemented via DEGSeq2 (v1.36) under thresholds of |log2(fold change)| > 1 and false discovery rate (FDR) < 0.05. Functional enrichment analyses (Gene Ontology and KEGG pathways) were performed with ClusterProfiler (v3.6.0), retaining terms with p < 0.05 after Benjamini–Hochberg correction. Immune-related DEGs were identified through integrated annotation from GO/KEGG analyses and literature mining. Protein–protein interaction networks were reconstructed using STRING (v11.5), with topological analysis in Cytoscape (v3.9.1) determining hub genes based on maximal connectivity degrees.

4.6. Verification of Transcriptome Data

To validate transcriptomic sequencing data from DRGC vs. GC comparisons, qRT-PCR was employed to assess 16 DEGs. First-strand cDNA synthesis was performed with the PrimeScriptTM RT reagent kit (Takara, China) following the manufacturer’s guidelines. Target-specific primers for selected DEGs and the reference gene β-actin (Table S7) were utilized to establish a 10 μL reaction system containing 5 μL SYBR Green qPCR Master Mix, 0.5 μL each of forward/reverse primers (20 μM), 1 μL diluted cDNA (1:5), and 3 μL nuclease-free water. Amplification protocols comprised an initial denaturation at 95 °C (2 min), followed by 40 cycles of 95 °C (15 s) and 60 °C (30 s) for annealing/extension. Each biological sample was analyzed in triplicate technical replicates. The relative quantification of mRNA expression levels was determined through the 2−ΔΔCt method, with β-actin serving as the endogenous normalization control.

4.7. Statistical Analysis

All quantitative data were statistically processed using IBM SPSS Statistics (v26.0, Armonk, NY, USA) under rigorous analytical protocols. Intergroup comparisons were evaluated through two-tailed Student’s t-test with Bonferroni correction, with significance defined at the α = 0.05 threshold. Continuous variables are presented as arithmetic mean ± standard deviation from six independent biological replicates. Bivariate correlations were quantified via Spearman’s rank-order coefficient, incorporating non-parametric adjustments for tied ranks.

Supplementary Materials

The supplementary information was uploaded to FigShare (https://doi.org/10.6084/m9.figshare.28216601; https://doi.org/10.6084/m9.figshare.28216748).

Author Contributions

Conceptualization, Q.Q. and C.W.; methodology, C.W. and Z.L. (Zeyang Li); software, X.H. and W.P.; validation, X.X. (Xidan Xu), K.Z. and Y.Z.; formal analysis, J.B. and L.X.; investigation, Z.L. (Zhengkun Liu) and Q.X.; data curation, S.L. (Siyang Li) and E.H.; writing—original draft preparation, C.W. and X.D.; writing—review and editing, Q.Q. and C.W.; visualization, Y.J. and S.L. (Shaojun Liu); supervision, Y.T. and Y.Y.; project administration, C.W. and X.X. (Xiaowei Xu); funding acquisition, Q.Q. All authors have read and agreed to the published version of the manuscript.

Funding

This research was funded by the National Key Research and Development Program of China (2023YFD2401601), the Earmarked Fund for HARS (HARS-07), the Aid Program for Science and Technology Innovative Research Team in Higher Educational Institutions of Hunan Province, the Special Science Found of Nansha-South China Agricultural University Fishery Research Institute, Guangzhou (NSYYKY202305), the Special Funds for the Construction of Innovative Province in Hunan (2023WK2001), and the Earmarked Fund for China Agriculture Research System (CARS-45).

Institutional Review Board Statement

The animal study protocol was approved by the Ethics Committee of Hunan Normal University (Approval Code: 675; Approval Date: 31 December 2023).

Informed Consent Statement

Not applicable.

Data Availability Statement

The original data presented in the study are openly available in the China National Center for Bioinformation (CNCB) database under accession number PRJCA034676.

Conflicts of Interest

The authors declare no conflicts of interest.

References

  1. O’Hara, A.M.; Shanahan, F. The gut flora as a forgotten organ. EMBO Rep. 2006, 7, 688–693. [Google Scholar] [CrossRef] [PubMed]
  2. Rajeev, R.; Dwivedi, A.P.; Sinha, A.; Agarwaal, V.; Dev, R.R.; Kar, A.; Khosla, S. Epigenetic interaction of microbes with their mammalian hosts. J. Biosci. 2001, 46, 94. [Google Scholar] [CrossRef] [PubMed]
  3. Marchesi, J.R.; Adams, D.H.; Fava, F.; Hermes, G.D.; Hirschfield, G.M.; Hold, G.; Quraishi, M.N.; Kinross, J.; Smidt, H.; Tuohy, K.M.; et al. The gut microbiota and host health: A new clinical frontier. Gut 2016, 65, 330–339. [Google Scholar] [CrossRef] [PubMed]
  4. Clemente, J.C.; Ursell, L.K.; Parfrey, L.W.; Knight, R. The impact of the gut microbiota on human health: An integrative view. Cell 2012, 148, 1258–1270. [Google Scholar] [CrossRef]
  5. Postler, T.S.; Ghosh, S. Understanding the holobiont: How microbial metabolites affect human health and shape the immune system. Cell Metab. 2017, 26, 110–130. [Google Scholar] [CrossRef]
  6. Kim, P.S.; Shin, N.R.; Lee, J.B.; Kim, M.S.; Whon, T.W.; Hyun, D.W.; Yun, J.H.; Jung, M.J.; Kim, J.Y.; Bae, J.W. Host habitat is the major determinant of the gut microbiome of fish. Microbiome 2021, 9, 166. [Google Scholar] [CrossRef]
  7. Nayak, S.K. Role of gastrointestinal microbiota in fish. Aquac. Res. 2010, 41, 1553–1573. [Google Scholar] [CrossRef]
  8. Cui, X.; Zhang, Q.; Zhang, Q.; Zhang, Y.; Chen, H.; Liu, G.; Zhu, L. Research progress of the gut microbiome in hybrid fish. Microorganisms 2022, 10, 891. [Google Scholar] [CrossRef]
  9. Hsu, C.L.; Schnabl, B. The gut-liver axis and gut microbiota in health and liver disease. Nat. Rev. Microbiol. 2023, 21, 719–733. [Google Scholar] [CrossRef]
  10. Wang, L.; Cao, Z.M.; Zhang, L.L.; Li, J.M.; Lv, W.L. The role of gut microbiota in some liver diseases: From an immunological perspective. Front. Immunol. 2022, 13, 923599. [Google Scholar] [CrossRef]
  11. Albillos, A.; de Gottardi, A.; Rescigno, M. The gut-liver axis in liver disease: Pathophysiological basis for therapy. J. Hepatol. 2020, 72, 558–577. [Google Scholar] [CrossRef] [PubMed]
  12. Rager, S.L.; Zeng, M.Y. The gut-liver axis in pediatric liver health and disease. Microorganisms 2023, 11, 597. [Google Scholar] [CrossRef] [PubMed]
  13. Marijani, E. Prevalence and antimicrobial cresistance of bacteria isolated from marine and freshwater fish in Tanzania. Int. J. Microbiol. 2022, 2022, 4652326. [Google Scholar] [CrossRef] [PubMed]
  14. Fariya, N.; Kaur, H.; Singh, M.; Abidi, R.; El-Matbouli, M.; Kumar, G. Morphological and molecular characterization of a new Myxozoan, Myxobolus grassi sp. nov. (Myxosporea), infecting the grass carp, Ctenopharyngodon idella in the Gomti river, India. Pathogens 2022, 11, 303. [Google Scholar] [CrossRef]
  15. Niu, H.; Pang, Y.; Xie, L.; Yu, Q.; Shen, Y.; Li, J.; Xu, X. Clustering pattern and evolution characteristic of microRNAs in grass carp (Ctenopharyngodon idella). BMC Genom. 2023, 24, 73. [Google Scholar] [CrossRef]
  16. Song, X.; Zhao, J.; Bo, Y.; Liu, Z.; Wu, K.; Gong, C. Aeromonas hydrophila induces intestinal inflammation in grass carp (Ctenopharyngodon Idella): An experimental model. Aquaculture 2014, 434, 171–178. [Google Scholar] [CrossRef]
  17. Rao, Y.; Su, J. Insights into the antiviral immunity against grass carp (Ctenopharyngodon idella) reovirus (GCRV) in grass carp. J. Immunol. Res. 2015, 2015, 670437. [Google Scholar] [CrossRef]
  18. Liu, S.; Wang, S.; Liu, X.; Wen, L.; Zou, J. Effects of dietary antimicrobial peptides on intestinal morphology, antioxidant status, immune responses, microbiota and pathogen disease resistance in grass carp Ctenopharyngodon idellus. Microb. Pathog. 2022, 165, 105386. [Google Scholar] [CrossRef]
  19. Chen, Z.; Feng, L.; Wu, P.; Jiang, W.D.; Jiang, J.; Zhou, X.Q.; Liu, Y. From growth promotion to intestinal inflammation alleviation: Unraveling the potential role of Lactobacillus rhamnosus GCC-3 in juvenile grass carp (Ctenopharyngodon idella). Fish Shellfish. Immunol. 2024, 148, 109511. [Google Scholar] [CrossRef]
  20. Yuan, Z.H.; Feng, L.; Jiang, W.D.; Wu, P.; Liu, Y.; Jiang, J.; Kuang, S.Y.; Tang, L.; Zhou, X.Q. Dietary choline-enhanced skin immune response of juvenile grass carp might be related to the STAT3 and NF-kB signaling pathway (Ctenopharyngodon idella). Front. Nutr. 2021, 8, 652767. [Google Scholar] [CrossRef]
  21. Ming, J.; Ye, J.; Zhang, Y.; Xu, Q.; Yang, X.; Shao, X.; Qiang, J.; Xu, P. Optimal dietary curcumin improved growth performance, and modulated innate immunity, antioxidant capacity and related genes expression of NF-κB and Nrf2 signaling pathways in grass carp (Ctenopharyngodon idella) after infection with Aeromonas hydrophila. Fish Shellfish Immunol. 2020, 97, 540–553. [Google Scholar] [CrossRef] [PubMed]
  22. Guo, W.; Han, R.; Xu, W.; Lu, Z.; Li, Y.; Dan, X.; Mo, Z. The protective effect of inactivated Flavobacterium columnare vaccine in grass carp (Ctenopharyngodon idellus). Front. Immunol. 2023, 14, 1162975. [Google Scholar] [CrossRef] [PubMed]
  23. Wang, Y.; Liao, A.; Tan, H.; Li, M.; Geng, C.; Wang, S.; Zhao, R.; Qin, Q.; Luo, K.; Zhang, C.; et al. The comparative studies on growth rate and disease resistance between improved grass carp and common grass carp. Aquaculture 2022, 560, 738476. [Google Scholar] [CrossRef]
  24. Yu, C.; Tang, H.; Jiang, Y.; Lu, H.; Chen, Q.; Gui, L.; Qiu, J.; Xu, X.; Li, J.; Shen, Y. Growth performance and selection signatures revealed by whole-genome resequencing in genetically selected grass carp (Ctenopharyngodon idella). Aquaculture 2024, 587, 740885. [Google Scholar] [CrossRef]
  25. Wang, Y.; Liu, W.; Li, Z.; Qiu, B.; Li, J.; Geng, G.; Hu, B.; Liao, A.; Cai, Y.; Wen, M.; et al. Improvement and application of genetic resources of grass carp (Ctenopharyngodon idella). Reprod. Breed. 2024, 4, 126–133. [Google Scholar] [CrossRef]
  26. Tan, H.; Hu, B.; Liu, W.; Liao, A.; Wang, Y.; He, W.; Zhang, Y.; Geng, C.; Luo, K.; Tao, M.; et al. Comprehensive analysis of the immunological differences in the intestinal barrier of improved grass carp and their parents. Aquaculture 2023, 577, 739931. [Google Scholar] [CrossRef]
  27. Elliott, J.P.; Bellwood, D.R. Alimentary tract morphology and diet in three coral reef fish families. J. Fish. Biol. 2003, 63, 1598–1609. [Google Scholar] [CrossRef]
  28. Horn, M.H.; Gawlicka, A.K.; German, D.P.; Logothetis, E.A.; Cavanagh, J.W.; Boyle, K.S. Structure and function of the stomachless digestive system in three related species of New World silverside fishes (Atherinopsidae) representing herbivory, omnivory, and carnivory. Mar. Biol. 2006, 149, 1237–1245. [Google Scholar] [CrossRef]
  29. Li, W.; Liu, J.; Tan, H.; Yang, C.; Ren, L.; Liu, Q.; Wang, S.; Hu, F.; Xiao, J.; Zhao, R.; et al. Genetic Effects on the gut microbiota assemblages of hybrid fish from parents with different feeding habits. Front. Microbiol. 2018, 9, 2972. [Google Scholar] [CrossRef]
  30. Shi, X.; Xu, W.; Che, X.; Cui, J.; Shang, X.; Teng, X.; Jia, Z. Effect of arsenic stress on the intestinal structural integrity and intestinal flora abundance of Cyprinus carpio. Front. Microbiol. 2023, 14, 1179397. [Google Scholar] [CrossRef]
  31. Fietz, K.; Rye Hintze, C.O.; Skovrind, M.; Kjærgaard Nielsen, T.; Limborg, M.T.; Krag, M.A.; Palsbøll, P.J.; Hestbjerg Hansen, L.; Rask Møller, P.; Gilbert, M.T.P. Mind the gut: Genomic insights to population divergence and gut microbial composition of two marine keystone species. Microbiome 2018, 6, 82. [Google Scholar] [CrossRef] [PubMed]
  32. Cortes-Ortiz, L.; Amato, K.R. Host genetics influence the gut microbiome. Science 2021, 373, 159–160. [Google Scholar] [CrossRef] [PubMed]
  33. López Nadal, A.; Ikeda-Ohtsubo, W.; Sipkema, D.; Peggs, D.; McGurk, C.; Forlenza, M.; Wiegertjes, G.F.; Brugman, S. Feed, Microbiota, and gut immunity: Using the zebrafish model to understand fish health. Front. Immunol. 2020, 11, 114. [Google Scholar] [CrossRef] [PubMed]
  34. Rasmussen, J.A.; Villumsen, K.R.; von Gersdorff Jørgensen, L.; Forberg, T.; Zuo, S.; Kania, P.W.; Buchmann, K.; Kristiansen, K.; Bojesen, A.M.; Limborg, M.T. Integrative analyses of probiotics, pathogenic infections and host immune response highlight the importance of gut microbiota in understanding disease recovery in rainbow trout (Oncorhynchus mykiss). J. Appl. Microbiol. 2022, 132, 3201–3216. [Google Scholar] [CrossRef]
  35. Sun, Y.; Zhang, S.; Nie, Q.; He, H.; Tan, H.; Geng, F.; Ji, H.; Hu, J.; Nie, S. Gut firmicutes: Relationship with dietary fiber and role in host homeostasis. Crit. Rev. Food Sci. Nutr. 2023, 63, 12073–12088. [Google Scholar] [CrossRef]
  36. Dehler, C.E.; Secombes, C.J.; Martin, S.A. Environmental and physiological factors shape the gut microbiota of Atlantic salmon parr (Salmo salar L.). Aquaculture 2017, 467, 149–157. [Google Scholar] [CrossRef]
  37. Schmidt, V.; Amaral-Zettler, L.; Davidson, J.; Summerfelt, S.; Good, C. Influence of fishmeal-free diets on microbial communities in Atlantic salmon (Salmo salar) recirculation aquaculture systems. Appl. Environ. Microbiol. 2016, 82, 4470–4481. [Google Scholar] [CrossRef]
  38. Balcázar, J.L.; de Blas, I.; Ruiz-Zarzuela, I.; Cunningham, D.; Vendrell, D.; Múzquiz, J.L. The role of probiotics in aquaculture. Vet. Microbiol. 2006, 114, 173–186. [Google Scholar] [CrossRef]
  39. Yi, Y.; Zhang, Z.; Zhao, F.; Liu, H.; Yu, L.; Zha, J.; Wang, G. Probiotic potential of Bacillus velezensis JW: Antimicrobial activity against fish pathogenic bacteria and immune enhancement effects on Carassius auratus. Fish Shellfish Immunol. 2018, 78, 322–330. [Google Scholar] [CrossRef]
  40. Giri, S.S.; Kim, H.J.; Jung, W.J.; Bin Lee, S.; Joo, S.J.; Gupta, S.K.; Park, S.C. Probiotics in addressing heavy metal toxicities in fish farming: Current progress and perspective. Ecotoxicol. Environ. Saf. 2024, 282, 116755. [Google Scholar] [CrossRef]
  41. Buruiana, C.T.; Georgiana, P.A.; Vizireanu, C. Effects of probiotic bacillus species in aquaculture—An overview. Ann. Univ. Dunarea De Jos Galati 2014, 38, 9–17. [Google Scholar]
  42. Xue, M.; Wu, Y.; Hong, Y.; Meng, Y.; Xu, C.; Jiang, N.; Li, Y.; Liu, W.; Fan, Y.; Zhou, Y. Effects of dietary Bacillus amyloliquefaciens on the growth, immune responses, intestinal microbiota composition and disease resistance of yellow catfish, Pelteobagrus fulvidraco. Front. Cell Infect. Microbiol. 2022, 12, 1047351. [Google Scholar] [CrossRef] [PubMed]
  43. Van Doan, H.; Wangkahart, E.; Thaimuangphol, W.; Panase, P.; Sutthi, N. Effects of Bacillus spp. Mixture on growth, immune responses, expression of immune-related genes, and resistance of Nile tilapia against Streptococcus agalactiae infection. Probiotics Antimicrob. Proteins 2023, 15, 363–378. [Google Scholar] [CrossRef] [PubMed]
  44. Huang, H.T.; Hu, Y.F.; Lee, B.H.; Huang, C.Y.; Lin, Y.R.; Huang, S.N.; Chen, Y.Y.; Chang, J.J.; Nan, F.H. Dietary of Lactobacillus paracasei and Bifidobacterium longum improve nonspecific immune responses, growth performance, and resistance against Vibrio parahaemolyticus in Penaeus vannamei. Fish Shellfish Immunol. 2022, 128, 307–315. [Google Scholar] [CrossRef]
  45. Yang, Y.; He, J.; Suo, Y.; Lv, L.; Wang, J.; Huo, C.; Zheng, Z.; Wang, Z.; Li, J.; Sun, W.; et al. Anti-inflammatory effect of taurocholate on TNBS-induced ulcerative colitis in mice. Biomed. Pharmacother. 2016, 81, 424–430. [Google Scholar] [CrossRef]
  46. Rivera, J.; Proia, R.L.; Olivera, A. The alliance of sphingosine-1-phosphate and its receptors in immunity. Nat. Rev. Immunol. 2018, 8, 753–763. [Google Scholar] [CrossRef]
  47. Ma, S.; Sandhoff, R.; Luo, X.; Shang, F.; Shi, Q.; Li, Z.; Wu, J.; Ming, Y.; Schwarz, F.; Madi, A.; et al. Serine enrichment in tumors promotes regulatory T cell accumulation through sphinganine-mediated regulation of c-Fos. Sci. Immunol. 2024, 9, eadg8817. [Google Scholar] [CrossRef]
  48. Kong, W.; Wang, Z.; Chen, N.; Mei, Y.; Li, Y.; Yue, Y. SHMT2 regulates serine metabolism to promote the progression and immunosuppression of papillary renal cell carcinoma. Front. Oncol. 2022, 12, 914332. [Google Scholar] [CrossRef]
  49. Subramanya, S.; Goswami, M.T.; Miller, N.; Weh, E.; Chaudhury, S.; Zhang, L.; Andren, A.; Hager, H.; Weh, K.M.; Lyssiotis, C.A.; et al. Rod photoreceptor-specific deletion of cytosolic aspartate aminotransferase, GOT1, causes retinal degeneration. Front. Ophthalmol. 2023, 3, 1306019. [Google Scholar] [CrossRef]
  50. Xu, W.; Patel, C.H.; Zhao, L.; Sun, I.H.; Oh, M.H.; Sun, I.M.; Helms, R.S.; Wen, J.; Powell, J.D. GOT1 regulates CD8+ effector and memory T cell generation. Cell Rep. 2023, 42, 111987. [Google Scholar] [CrossRef]
  51. Wang, L.; Dong, X.; Wu, Y.; Zhou, Q.; Xu, R.; Ren, L.; Zhang, C.; Tao, M.; Luo, K.; Zeng, Y.; et al. Proteomics-based molecular and functional characteristic profiling of muscle tissue in triploid crucian carp. Mol. Omics 2022, 18, 967–976. [Google Scholar] [CrossRef] [PubMed]
  52. Abu-Elheiga, L.; Almarza-Ortega, D.B.; Baldini, A.; Wakil, S.J. Human acetyl-CoA carboxylase 2. Molecular cloning, characterization, chromosomal mapping, and evidence for two isoforms. J. Biol. Chem. 1997, 272, 10669–10677. [Google Scholar] [CrossRef] [PubMed]
  53. Zhang, C.; Peng, L.; Zhang, Y.; Liu, Z.; Li, W.; Chen, S.; Li, G. The identification of key genes and pathways in hepatocellular carcinoma by bioinformatics analysis of high-throughput data. Med. Oncol. 2017, 34, 101. [Google Scholar] [CrossRef] [PubMed]
  54. Zhang, X.; Zhou, Y.; Hu, J.; Yu, X.; Xu, H.; Ba, Z.; Zhang, H.; Sun, Y.; Wang, R.; Du, X.; et al. Comprehensive analysis identifies cuproptosis-related gene DLAT as a potential prognostic and immunological biomarker in pancreatic adenocarcinoma. BMC Cancer 2023, 23, 560. [Google Scholar] [CrossRef]
  55. Chen, K.; Shi, Y.; Zhu, H. Analysis of the role of glucose metabolism-related genes in dilated cardiomyopathy based on bioinformatics. J. Thorac. Dis. 2023, 15, 3870–3884. [Google Scholar] [CrossRef]
  56. Kydonopoulou, K.; Rousso, D.; Ilonidis, G.; Mandala, E. Association of GPIa C807T polymorphism with unexplained female infertility and IVF implantation failure. J. Biol. Regul. Homeost. Agents 2019, 33, 883–887. [Google Scholar]
  57. Adorno-Cruz, V.; Liu, H. Regulation and functions of integrin α2 in cell adhesion and disease. Genes Dis. 2018, 6, 16–24. [Google Scholar] [CrossRef]
  58. Jin, L.; Duan, Y.; Li, X.; Li, Z.; Hu, J.; Shi, H.; Su, Z.; Li, Z.; Du, B.; Chen, Y.; et al. High expression ITGA2 affects the expression of MET, PD-L1, CD4 and CD8 with the immune microenvironment in pancreatic cancer patients. Front. Immunol. 2023, 14, 1209367. [Google Scholar] [CrossRef]
  59. Kausar, S.; Abbas, M.N.; Gul, I.; Liu, Y.; Tang, B.P.; Maqsood, I.; Liu, Q.N.; Dai, L.S. Integrins in the immunity of insects: A review. Front. Immunol. 2022, 13, 906294. [Google Scholar] [CrossRef]
  60. Jiang, P.; Du, W.; Wu, M. Regulation of the pentose phosphate pathway in cancer. Protein Cell 2014, 5, 592–602. [Google Scholar] [CrossRef]
  61. Cen, K.; Lu, C. Prognostic and immune infiltration analysis of transaldolase 1 (TALDO1) in hepatocellular carcinoma. Int. J. Gen. Med. 2023, 16, 5779–5788. [Google Scholar] [CrossRef] [PubMed]
  62. Shah, S.S.; Stone, E.F.; Francis, R.O.; Karafin, M.S. The global role of G6PD in infection and immunity. Front. Immunol. 2024, 15, 1393213. [Google Scholar] [CrossRef] [PubMed]
  63. Du, G.; Xiao, M.; Wei, X.; Zhou, C.; Li, S.; Cai, W. Hepatic transcriptional profiling response to fava bean-induced oxidative stress in glucose-6-phosphate dehydrogenase-deficient mice. Gene 2018, 652, 66–77. [Google Scholar] [CrossRef] [PubMed]
  64. Gonzalez-Bohorquez, D.; Gallego López, I.M.; Jaeger, B.N.; Pfammatter, S.; Bowers, M.; Semenkovich, C.F.; Jessberger, S. FASN-dependent de novo lipogenesis is required for brain development. Proc. Natl. Acad. Sci. USA 2022, 119, e2112040119. [Google Scholar] [CrossRef]
  65. Xiao, Y.; Yang, Y.; Xiong, H.; Dong, G. The implications of FASN in immune cell biology and related diseases. Cell Death Dis. 2024, 15, 88. [Google Scholar] [CrossRef]
  66. Deng, Y.; Zhang, Y.; Chen, H.; Xu, L.; Wang, Q.; Feng, J. Gut-liver immune response and gut microbiota profiling reveal the pathogenic mechanisms of Vibrio harveyi in pearl gentian grouper (Epinephelus lanceolatus♂ × E. fuscoguttatus♀). Front. Immunol. 2020, 11, 607754. [Google Scholar] [CrossRef]
  67. Yan, B.; Sun, Y.; Fu, K.; Zhang, Y.; Lei, L.; Men, J.; Guo, Y.; Wu, S.; Han, J.; Zhou, B. Effects of glyphosate exposure on gut-liver axis: Metabolomic and mechanistic analysis in grass carp (Ctenopharyngodon idellus). Sci. Total Environ. 2023, 902, 166062. [Google Scholar] [CrossRef]
  68. Del Piano, F.; Mateu, B.; Coretti, L.; Borrelli, L.; Piccolo, G.; Addeo, N.F.; Esposito, S.; Mercogliano, R.; Turco, L.; Meli, R.; et al. Polystyrene microplastic exposure modulates gut microbiota and gut-liver axis in gilthead seabream (Sparus aurata). Sci. Total Environ. 2024, 957, 177857. [Google Scholar] [CrossRef]
  69. Zhang, X.; Chen, J.; Wang, G.; Chen, H.; Cao, J.; Xie, L.; Luo, Y. Interactive effects of fluoride and seleno-l-methionine at environmental related concentrations on zebrafish (Danio rerio) liver via the gut-liver axis. Fish Shellfish Immunol. 2022, 127, 690–702. [Google Scholar] [CrossRef]
  70. Duan, Y.; Yang, Y.; Li, H.; Zhang, Z.; Chen, X.; Xiao, M.; Nan, Y. The toxic effects of tetracycline exposure on the physiological homeostasis of the gut-liver axis in grouper. Environ. Res. 2024, 258, 119402. [Google Scholar] [CrossRef]
  71. Song, Y.; Huang, H.; Jia, K.; Zou, S.; Yang, Y.; Yi, M. Multi-omics analysis reveals toxicity and gut-liver axis disruption induced by polychlorinated biphenyls exposure in yellowfin seabream (Acanthopagrus latus). J. Hazard. Mater. 2025, 487, 137296. [Google Scholar] [CrossRef] [PubMed]
  72. Wang, C.; Luo, X.; Zhang, Y.; Zhou, Y.; Xiao, Q.; Huang, X.; Xu, X.; Xu, X.; Qin, Q.; Liu, S. Triploidization modulates intestinal microbiota and promotes growth in Carassius auratus. Aquaculture 2023, 571, 739480. [Google Scholar] [CrossRef]
  73. Liao, Y.; Wang, C.; Gao, Z.; Pan, Z.; Peng, M.; Ma, J.; Qian, Y.; Guo, J.; Fu, F. Anti-obesity mechanism of Ganpu tea revealed by microbiome, metabolome and transcriptome analyses. Food Chem. 2023, 412, 135048. [Google Scholar] [CrossRef] [PubMed]
Figure 1. Intestinal histology in grass carp (GC) (A) and disease-resistant grass carp (DRGC) (B). VL: villus length; TW: thickness of gut wall; VW: villus width. Scale bars: 100 μm.
Ijms 26 03619 g001
Figure 2. Rarefaction curves of grass carp (GC) and disease−resistant grass carp (DRGC) intestinal microbial samples (A); principal coordinate analysis (PCoA) of samples from two groups (B); alpha diversity based on the ACE index of the operational taxonomic unit (OTU) level (C), n = 6; and Venn diagram of OTU distribution (D).
Ijms 26 03619 g002
Figure 3. Relative abundances of dominant bacterial phyla (A) and families (B) in the intestines of disease-resistant grass carp (DRGC) and grass carp (GC) groups.
Ijms 26 03619 g003
Figure 4. Organism-level microbiome phenotypes were predicted by Bugbase (AD). Heatmap of functional prediction by PICRUSt (E). DRGC: disease-resistant grass carp; GC: grass carp.
Ijms 26 03619 g004
Figure 5. Metabolites between DRGC and GC groups. (A) Volcanic map (n = 6 fish per group); (B) orthogonal partial least squares−discriminant analysis (OPLS−DA); (C) Kyoto Encyclopedia of Genes and Genomes (KEGG) analysis; and (D) VIP bar graph. The top 20 differential metabolites were identified between the disease−resistant grass carp (DRGC) and grass carp (GC) groups.
Ijms 26 03619 g005
Figure 6. Summary of differentially expressed genes (DEGs) in disease-resistant grass carp. (A) Volcano plots of DEGs between disease−resistant grass carp (DRCG) and grass carp (GC) groups. Green and red dots indicate upregulated and downregulated genes, respectively. (B) Gene Ontology (GO) annotation of differentially expressed genes (DEGs). (C) Kyoto Encyclopedia of Genes and Genomes (KEGG) analysis. (D) PPI network and enrichment analysis of hub genes. (E) RT−qPCR validation of DEGs. SHMT2: serine hydroxymethyltransferase 2; GOT1: glutamic−oxaloacetic transaminase 1; ACACA: acetyl−CoA carboxylase alpha; DLAT: dihydrolipoamide S−acetyltransferase; GPIA: glucose-6-phosphate isomerase a; TALDO1: transaldolase 1; G6PD: glucose−6−phosphate dehydrogenase; FASN: fatty acid synthase.
Ijms 26 03619 g006
Figure 7. Correlation analysis amongst the microbiome, metabolome, and transcriptome. (A) Spearman’s correlation of phyla−level gut microbiota with differential metabolites; (B) Kyoto Encyclopedia of Genes and Genomes (KEGG) pathway enrichment analysis of metabolites; (C) Spearman’s correlation of metabolites with differential genes; and (D) anti−disease mechanism of disease-resistant grass carp. The green arrows represent positive correlations, and the red arrows represent negative correlations.
Ijms 26 03619 g007
Table 1. Intestinal histological results of disease-resistant grass carp (DRGC) and grass carp (GC) groups.
ParametersDRGCGC
Villus length (μm)533.35 ± 22.43 a376.81 ± 21.23
Thickness of gut wall (μm)77.36 ± 4.22 a57.81 ± 4.77
Villus width (μm)79.60 ± 6.53 a109.45 ± 9.30
Values are presented as mean ± SD (n = 6). a indicates significant difference (p < 0.05).
Table 2. Summary statistics of transcriptome sequences.
SampleClean ReadsGC Content (%)Q30 (%)Uniquely Mapped Reads
(Ratio)
Multiple Mapped Reads
(Ratio)
Total Mapped Reads
(Ratio)
DRGC-150,043,924 (99.80%)46.5296.1643,520,258 (86.96%)2,771,962 (5.54%)46,292,220 (92.5%)
DRGC-247,104,516 (99.79%)46.4196.2040,953,442 (86.94%)2,490,242 (5.29%)43,443,684 (92.23%)
DRGC-345,800,350 (99.81%)46.5696.2539,678,432 (86.63%)2,449,190 (5.35%)42,127,622 (91.98%)
GC-144,884,616 (99.82%)46.5796.1938,596,774 (85.99%)2,267,454 (5.05%)40,864,228 (91.04%)
GC-247,683,850 (99.80%)46.7096.2240,773,060 (85.51%)2,640,728 (5.54%)43,413,788 (91.05%)
GC-343,187,696 (99.85%)46.6296.5637,276,028 (86.31%)2,461,866 (5.70%)39,737,894 (92.01%)
DRGC, disease-resistant grass carp; GC, grass carp.
Disclaimer/Publisher’s Note: The statements, opinions and data contained in all publications are solely those of the individual author(s) and contributor(s) and not of MDPI and/or the editor(s). MDPI and/or the editor(s) disclaim responsibility for any injury to people or property resulting from any ideas, methods, instructions or products referred to in the content.

