Article

Genome-Wide Identification and Expression Analysis of m6A Methyltransferase Family in Przewalskia tangutica Maxim.

1
The College of Pharmacy, Qinghai Minzu University, Xining 810007, China
2
Key Laboratory for Tibet Plateau Phytochemistry of Qinghai Province, Xining 810007, China
3
Key Laboratory of Adaptation and Evolution of Plateau Biota (AEPB), Northwest Institute of Plateau Biology, Chinese Academy of Sciences, Xining 810008, China
*
Author to whom correspondence should be addressed.
Int. J. Mol. Sci. 2025, 26(8), 3593; https://doi.org/10.3390/ijms26083593
Submission received: 7 March 2025 / Revised: 30 March 2025 / Accepted: 3 April 2025 / Published: 11 April 2025
(This article belongs to the Section Molecular Genetics and Genomics)

Abstract

N6-methyladenosine (m6A) RNA modification plays important regulatory roles in plant development and adaptation to the environment. However, there has been no research regarding m6A RNA methyltransferases (MT-A70) in Przewalskia tangutica Maxim. Here, we performed a comprehensive analysis of the MT-A70 family in Przewalskia tangutica (PtMTs), including gene structures, phylogenetic relationships, conserved motifs, gene location, promoter analysis, GO enrichment analysis, and expression profiles. We identified seven PtMT genes. Phylogeny analysis indicated that the seven PtMT genes could be divided into three groups; two MTA genes, three MTB genes, and two MTC genes, and domains and motifs exhibited similar patterns within the same group. These PtMT genes were found to contain a large number of cis-acting elements associated with plant hormones, light response, and stress response, suggesting their widespread regulatory function. Furthermore, the expression profiling of different tissues was investigated using RNA-seq data, and the expression of seven genes was further validated by qPCR analysis. These results provided valuable information to further elucidate the function of m6A regulatory genes and their epigenetic regulatory mechanisms in Przewalskia tangutica.

1. Introduction

Over 160 RNA modifications have been recognized in eukaryotes, with prevalent modifications comprising N6-adenylated methylation (m6A), N1-adenylate methylation (m1A), and cytosine hydroxylation (m5C) [1,2,3]. Among these, m6A is the predominant internal modification in eukaryotic RNA, extensively present in mRNA, tRNA, miRNA, and long non-coding RNA [4]. As a dynamic and reversible modification, m6A is essential in post-transcriptional regulation and affects multiple facets of RNA metabolism, such as gene expression regulation, RNA editing, and the management of mRNA stability and degradation, rendering it a focal point of considerable research interest [5,6,7,8].
m6A is a highly conserved chemical modification that arises when the hydrogen at the N6 position of adenosine is substituted with a methyl group (CH3) [9]. This alteration was initially discovered in Novikoff liver carcinoma cells in 1974 [10]. Subsequently, m6A RNA methylation has been documented in multiple species, including mouse (Mus musculus) [11], Drosophila melanogaster [12], wheat (Triticum aestivum) [13], oats (Avena sativa) [14], and Saccharomyces cerevisiae [15]. The enzymes implicated in m6A modification are classified into three categories: “writers”, “erasers”, and “readers” [16,17]. The “writers” denote m6A methyltransferases that assemble into a complex to identify and methylate target mRNAs. This complex in animals consists of METTL3, METTL14, WTAP, KIAA1429, and VIRILIZER [18,19,20]. In plants, the METTL3 homolog MTA (adenosine methylase) and the METTL14 homolog MTB (methyltransferase B) function as essential subunits of the plant m6A methyltransferase complex. Both possess conserved MT-A70 structural domains, are situated in the nucleus, and form heterodimers [18,21].
MTA and MTB are intricately linked to m6A synthesis. Although the majority of m6A-related research has been performed in animals, especially humans [22,23], investigations in plants are still comparatively scarce. Nevertheless, advancements in detection methodologies have led to a gradual increase in plant-related research, particularly involving Arabidopsis thaliana and rice (Oryza sativa) [24]. A homology-based search identified 5 m6A writers, 13 readers, and 13 erasers in Arabidopsis thaliana [25,26]. Zhong et al. [27] employed two-dimensional thin-layer chromatography (TLC) to verify the existence of m6A modifications in MTA-deficient seeds. The m6A modification level was diminished by roughly 50% in the RNAi strain of Arabidopsis MTB relative to the wild type [21]. In rice, four genes homologous to Arabidopsis MTA were identified, with only the MTA2 mutation significantly diminishing m6A levels, whereas the other three genes did not influence overall m6A levels [28]. Homologous proteins of MTA and MTB have recently been identified in strawberries (Fragaria vesca), where they also function as m6A methyltransferases [29]. These findings collectively demonstrate that m6A serves a crucial regulatory function in plant growth, development, and responses to abiotic stresses.
Przewalskia tangutica Maxim. (P. tangutica), a perennial species within the Solanaceae family, predominantly resides in high-altitude areas ranging from 3200 to 5000 m. This plant has been used as a medicinal remedy for centuries, with its roots, seeds, and entire structure employed for analgesic, antispasmodic, and anti-inflammatory purposes [30]. Previous study has shown that the roots of P. tangutica are abundant in scopolamine and anisodamine [31]. The comprehension of m6A methyltransferases in P. tangutica is still constrained. This study involved a comprehensive genome-wide characterization of PtMT genes using recently published genomic data [32]. We conducted an exhaustive analysis of their phylogenetic relationships, gene and protein structures, chromosomal organization, cis-regulatory elements, expression patterns, and physicochemical properties. This study seeks to create a foundational framework for investigating the functional roles of m6A regulatory pathway genes in plants like P. tangutica.

2. Results

2.1. Identifying the PtMT Genes

By screening the whole genome data of P. tangutica, seven PtMT genes were finally identified (Table 1), the length of the seven PtMT genes ranged from 867 to 3285 bp, with an average of 2324 bp. The amino acid lengths varied from 288 to 1094 aa, with an average number of amino acids of 773aa. The average molecular weight (Mw) is 86.63 kDa, the theoretical pI ranged from 5.12 to 7.1, and the seven PtMT genes are essentially acidic. The instability index is greater than 40 and the aliphatic index ranged from 48.39 to 83.26. The grand average of hydropathicity (GRAVY) analysis showed that PtMT proteins were hydrophilic proteins. Subcellular localization prediction displayed that four genes (57.1%) were located in the nucleus, two genes (PtMTA1, PtMTA2) (28.6%) were located in the chloroplast, and one gene (PtMTC2) (14.3%) was located in the cytoplasm.

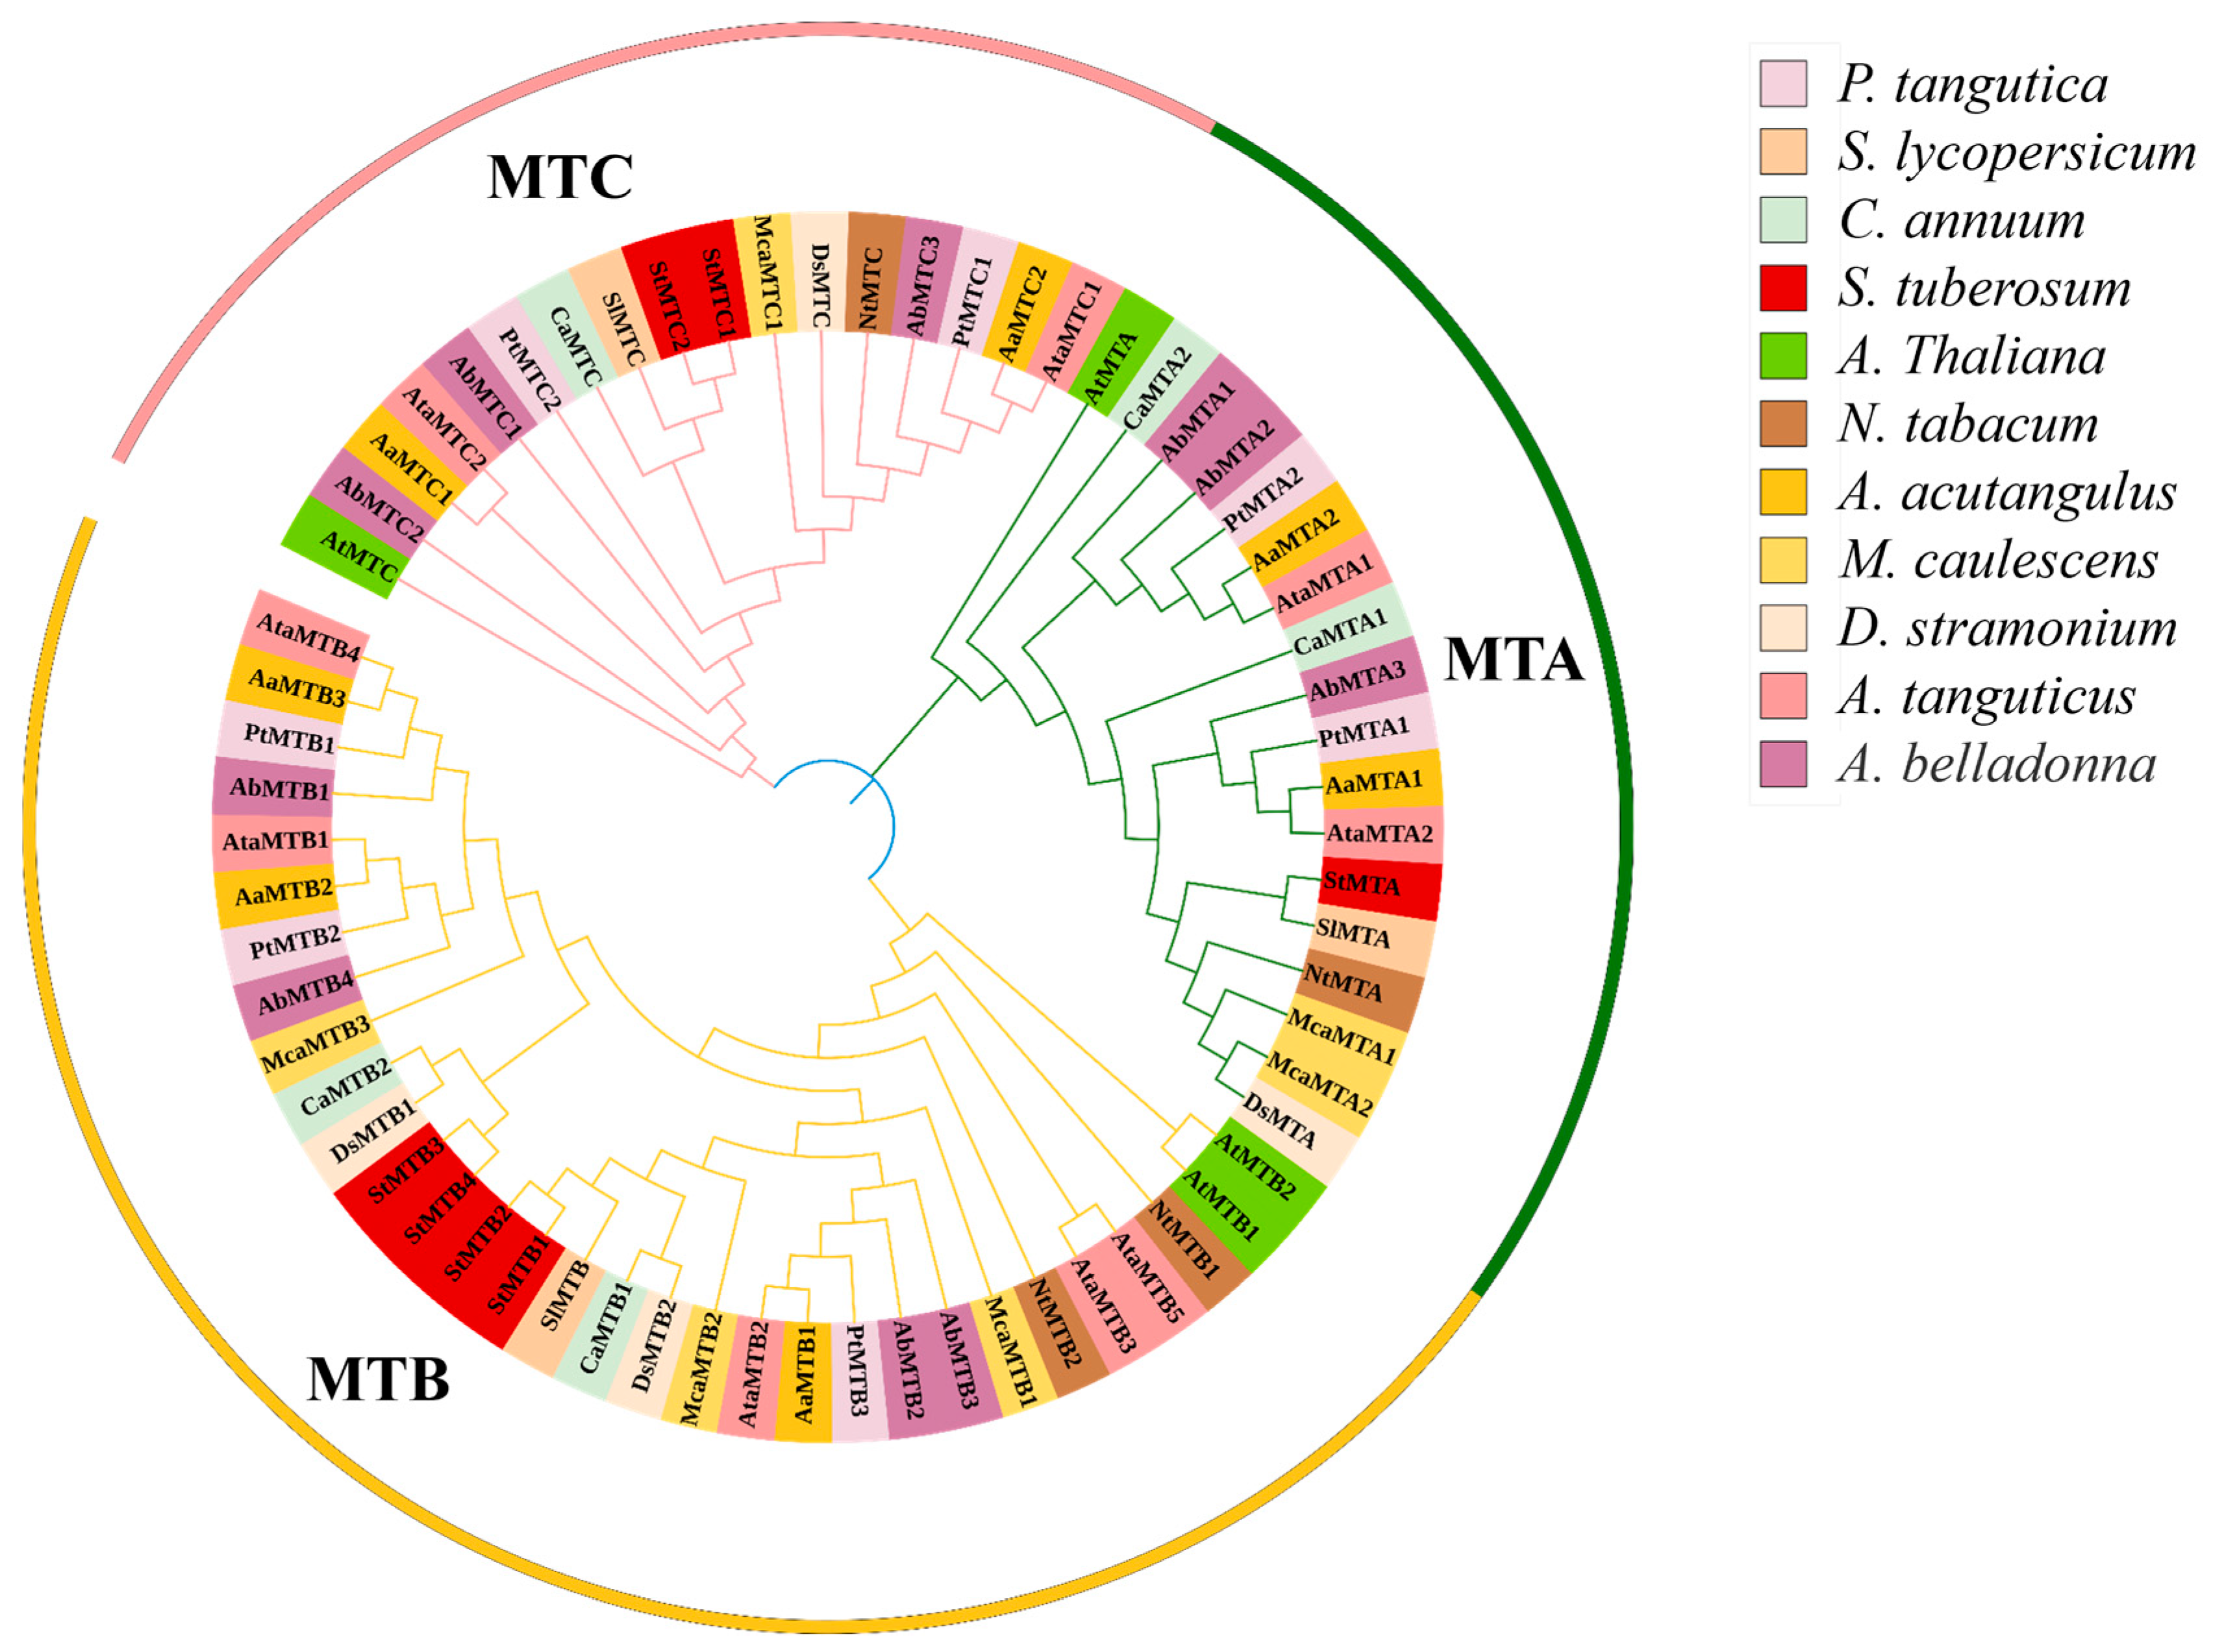
2.2. Phylogenetic Relationship Analysis

We first identified m6A methyltransferases (MT-A70 like proteins) in P. tangutica and other species, then constructed a phylogenetic tree using these proteins (Figure 1). The results showed that the seven PtMT genes in P. tangutica could be categorized into three subfamilies, MTA, MTB, and MTC, and each subfamily contained at least two PtMT genes, of which the MTB subfamily was the largest, accounting for nearly half of the total. In terms of kinship, P. tangutica is closest to the Anisodus acutangulus and Atropa belladonna PtMT gene families.

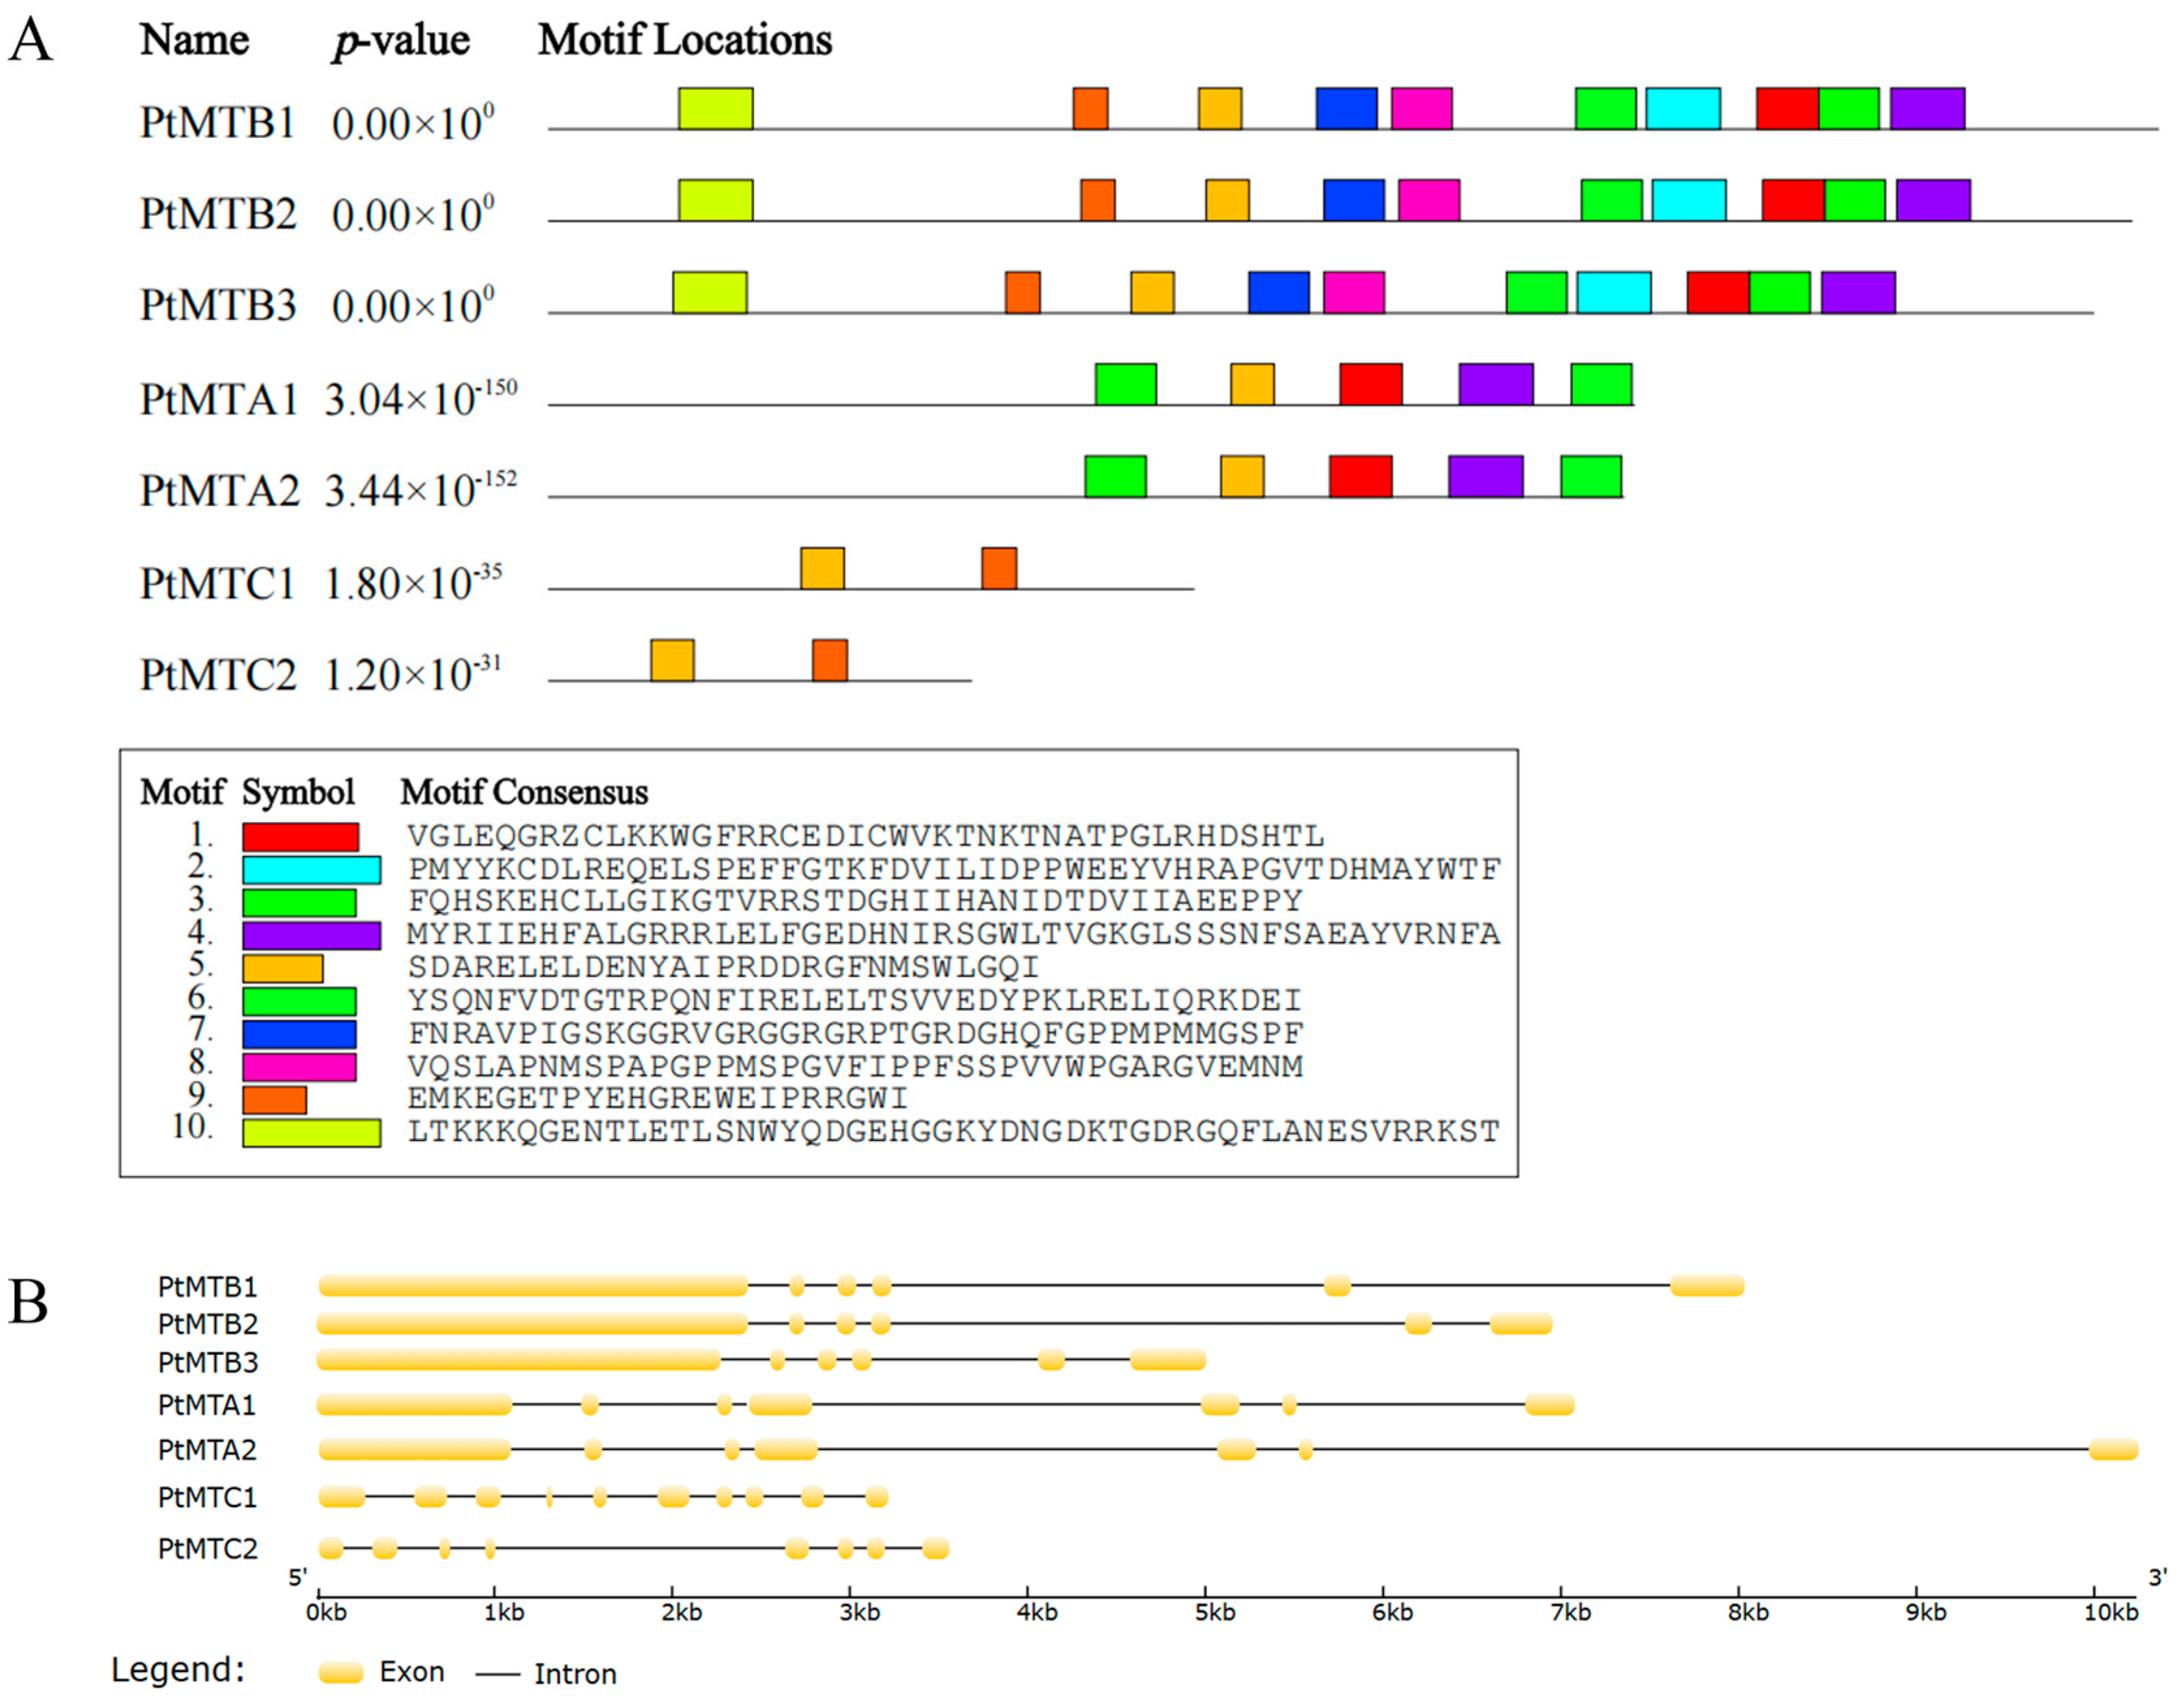
2.3. Structural Features Analysis

To analyze the diversity and distribution patterns of conserved motifs, we applied the MEME online software (https://meme-suite.org/meme/, accessed on 15 February 2024) to analyze the amino acid sequences of seven MT-A70 proteins (Figure 2A). We identified ten different motifs, named Motif 1 to Motif 10 (Figure S1), respectively. These motifs were highly similar and had the same arrangement order within the same subfamily, indicating that all the proteins were highly conserved. However, there were certain differences among different subfamilies. Among them, Motif 5 was detected in all the proteins of the family, suggesting that Motif 5 was the most conserved motif in the MT-A70 protein sequences.
We conducted an analysis of the exon–intron structure of the seven PtMT genes. The results showed (Figure 2B) that the numbers of exons and introns in the three subfamilies were not consistent, while the numbers within the same subfamily were relatively conserved. In addition, most of the introns of the PtMT genes were longer than those in the corresponding Arabidopsis thaliana, which is consistent with the fact that P. tangutica has a larger genome. The numbers of exons of the seven PtMT genes ranged from 6 to 10. Among them, the PtMTB1, PtMTB2, and PtMTB3 genes contained 6 exons, PtMTA1 and PtMTA2 contained 7 exons, PtMTC1 contained 10 exons, and PtMTC2 contained 8 exons. This indicates that the members of the PtMT genes family have differentiated during the process of evolution, and there have been phenomena of exon increase or deletion. The analysis of conserved domains showed that the PtMT genes family all contained the typical MT-A70 domain (Figure S2).

2.4. Chromosomal Location and GO Enrichment Analysis

To further understand the evolutionary relationships of the 7 PtMT genes, we determined the positions of these genes on the chromosomes. The results showed that these genes were distributed across five chromosomes (Figure 3A). Specifically, chrA01 and chrA12 each contained two genes, while chrA08, chrA19, and chr20 each contained one gene. Most of the PtMT genes were located at the distal ends of the chromosomes (PtMTA1, PtMTB1, PtMTA2, and PtMTC1), and very few were located in the central regions. The GO enrichment analysis revealed that the seven PtMT genes played roles in molecular functions, cellular components, and biological processes (Figure 3B and Table S1).

2.5. Promoter Analysis of PtMT Genes

Cis-regulatory element analysis showed that a total of 147 cis-elements were identified in PtMT genes (Figure 4). When grouped according to the biological processes in which they participate, the cis-elements were classified into six categories (Table S2). The largest group was hormone response related, including 72 (48.98%) elements, such as abscisic acid (ABA) response elements (ABRE), methyl jasmonate (MeJA) response elements (CGTCA-motif), gibberellin (GA) response elements (GARE-motif and TATC-box), and salicylic acid (SA) response elements (TCA-element). Among the plant-hormones-related elements, MeJA-responsive elements and ABA response elements were the largest two groups. The second largest group was light response related, comprising 43 (29.25%) elements, such as AE-box, Box 4, Gap-box, G-box, MRE, Sp1, and CAG-motif.

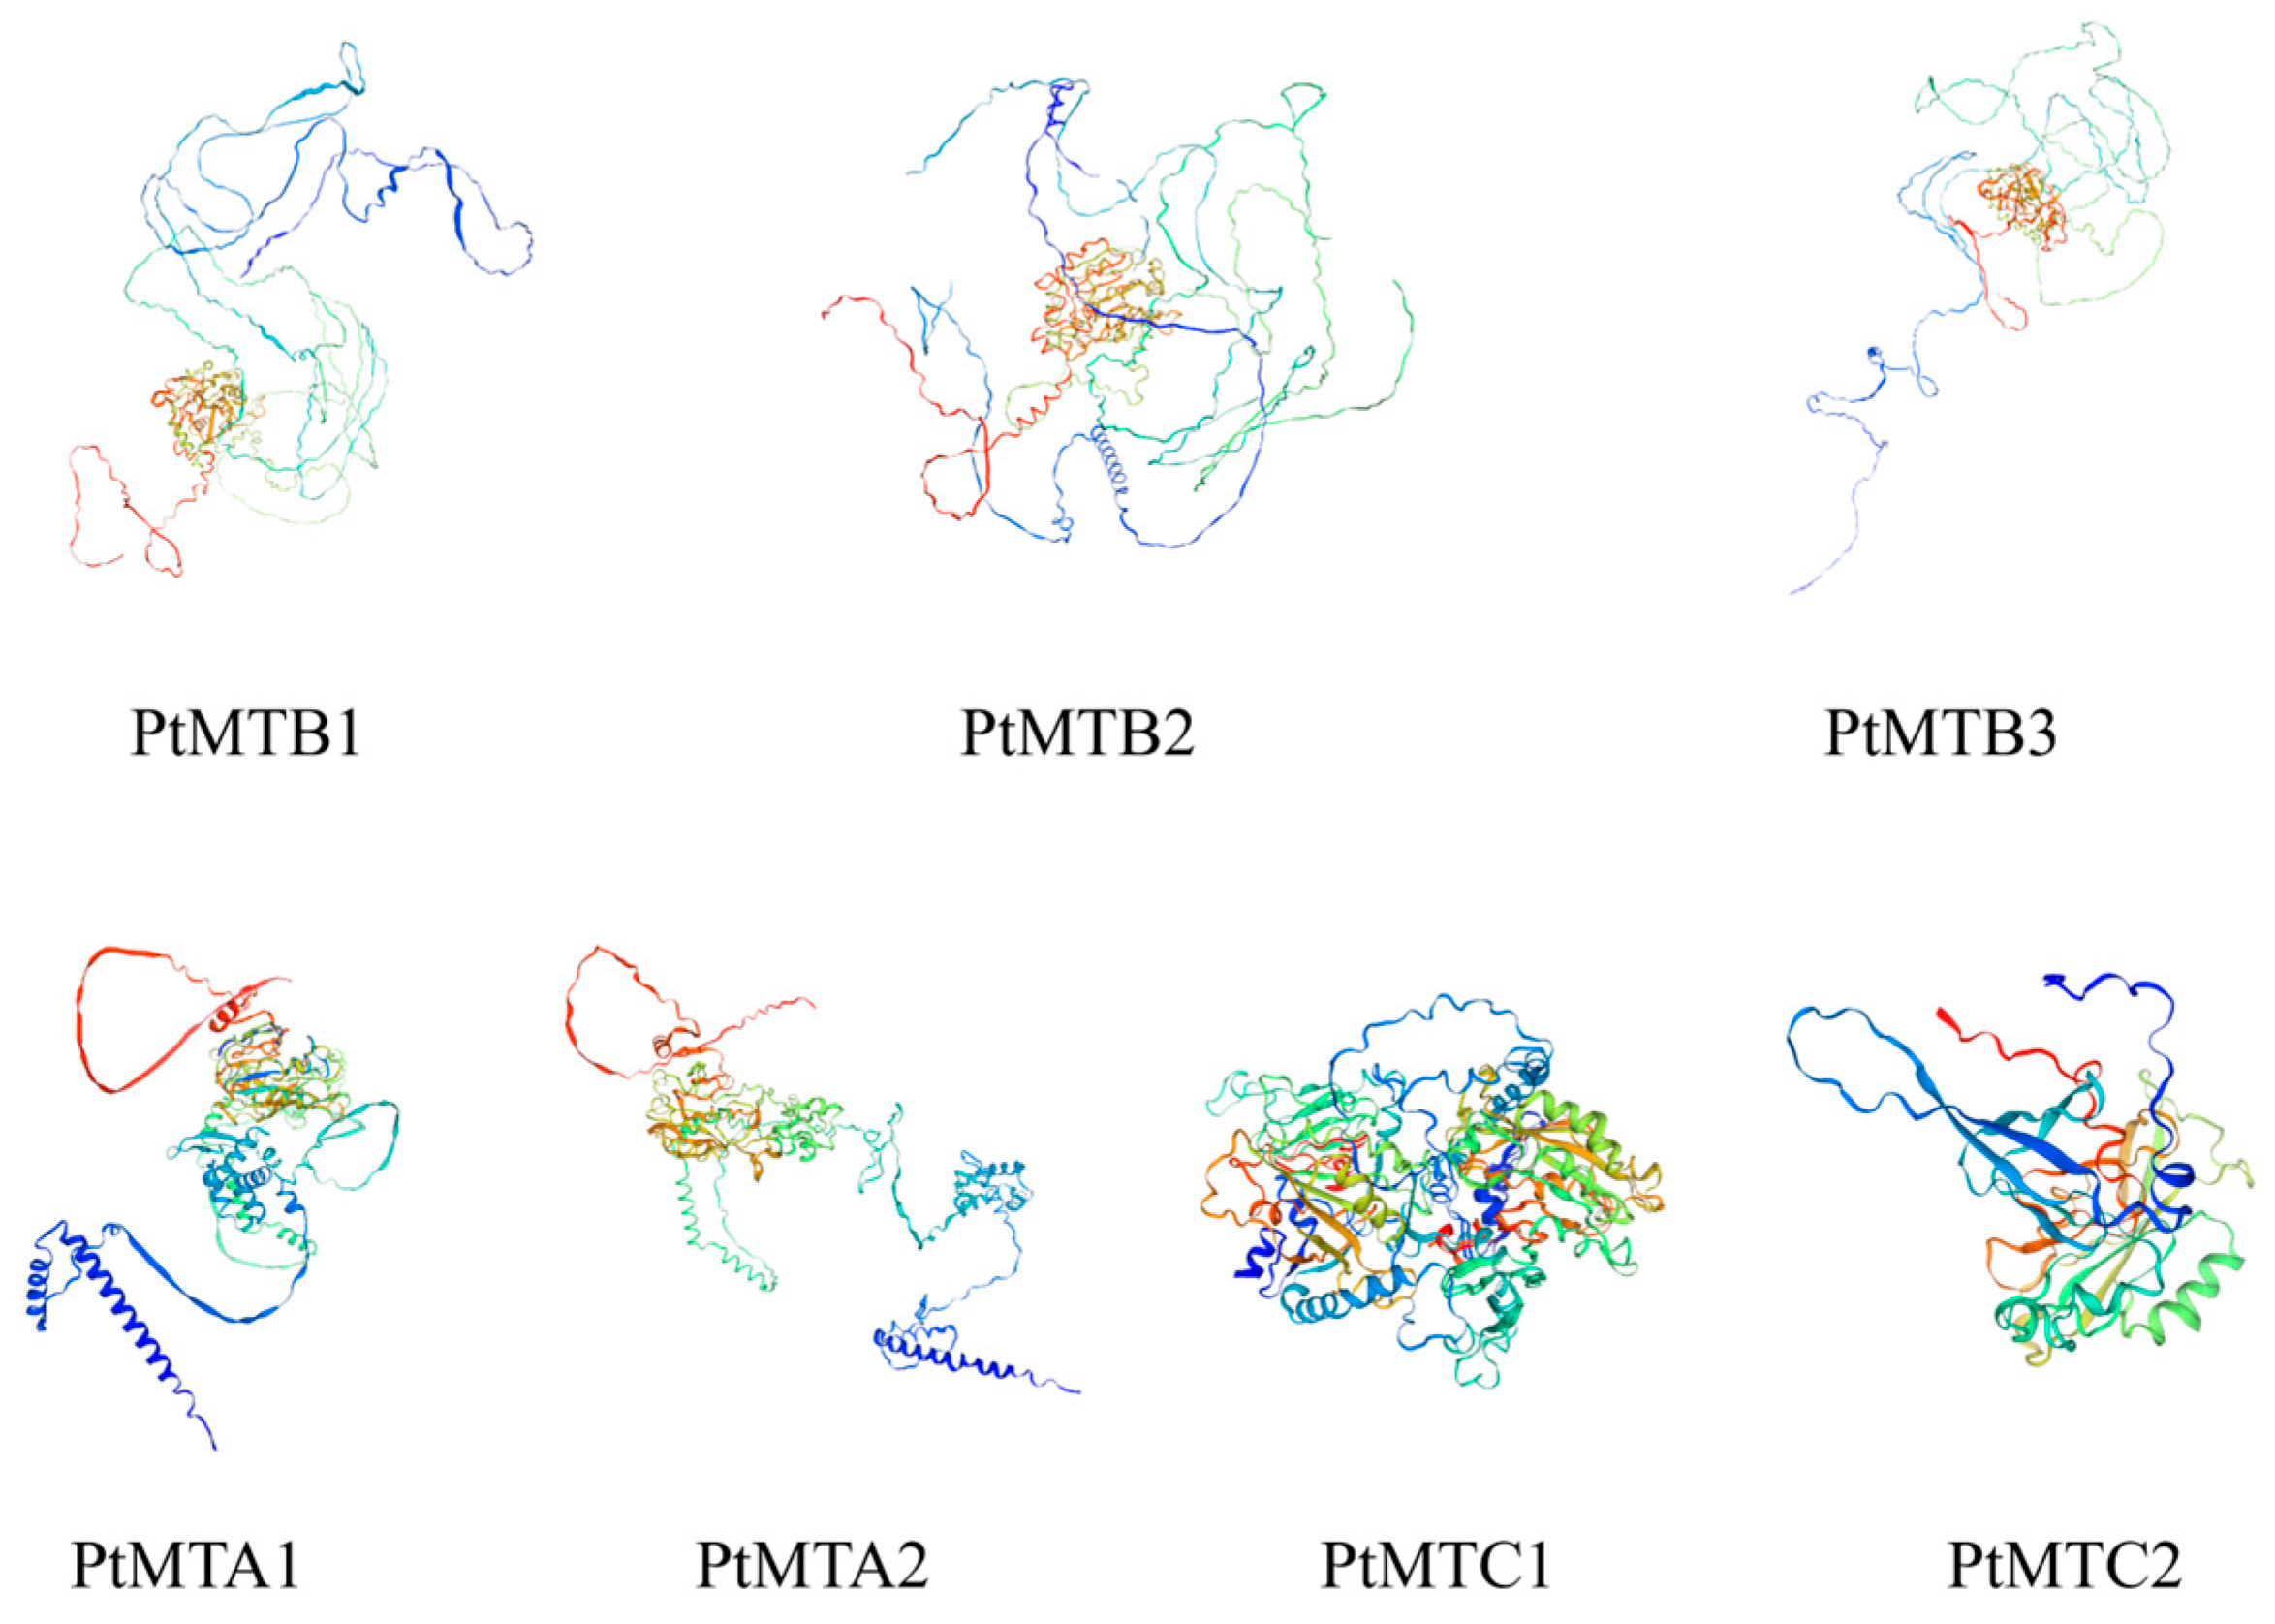
2.6. The 3D Protein Structure Analysis

The seven proteins encoded by the PtMT genes were subjected to secondary structure prediction using GOR IV, and the results are shown in Table S3. The secondary structure analysis indicated that the proteins encoded by the PtMT genes were mainly composed of alpha-helices (Hh), extended strands (Ee), and random coils (Cc). Among them, random coils accounted for the largest proportion (50.68%~66.67%), followed by alpha-helices (19.13%~31.71%) and extended strands (14.67%~31.25%). The secondary structures of the screened proteins were approximately the same. The PtMTB3 protein had the highest proportion of random coils (66.67%) and the PtMTC2 protein had the lowest proportion of random coils (48.61%), it is speculated that these two proteins may have special functions. The three-dimensional structure prediction showed that the structures of PtMTA1 and PtMTA2 proteins were similar, and the structures of PtMTB1, PtMTB2, and PtMTB3 proteins were similar, indicating that they had the same functions (Figure 5).

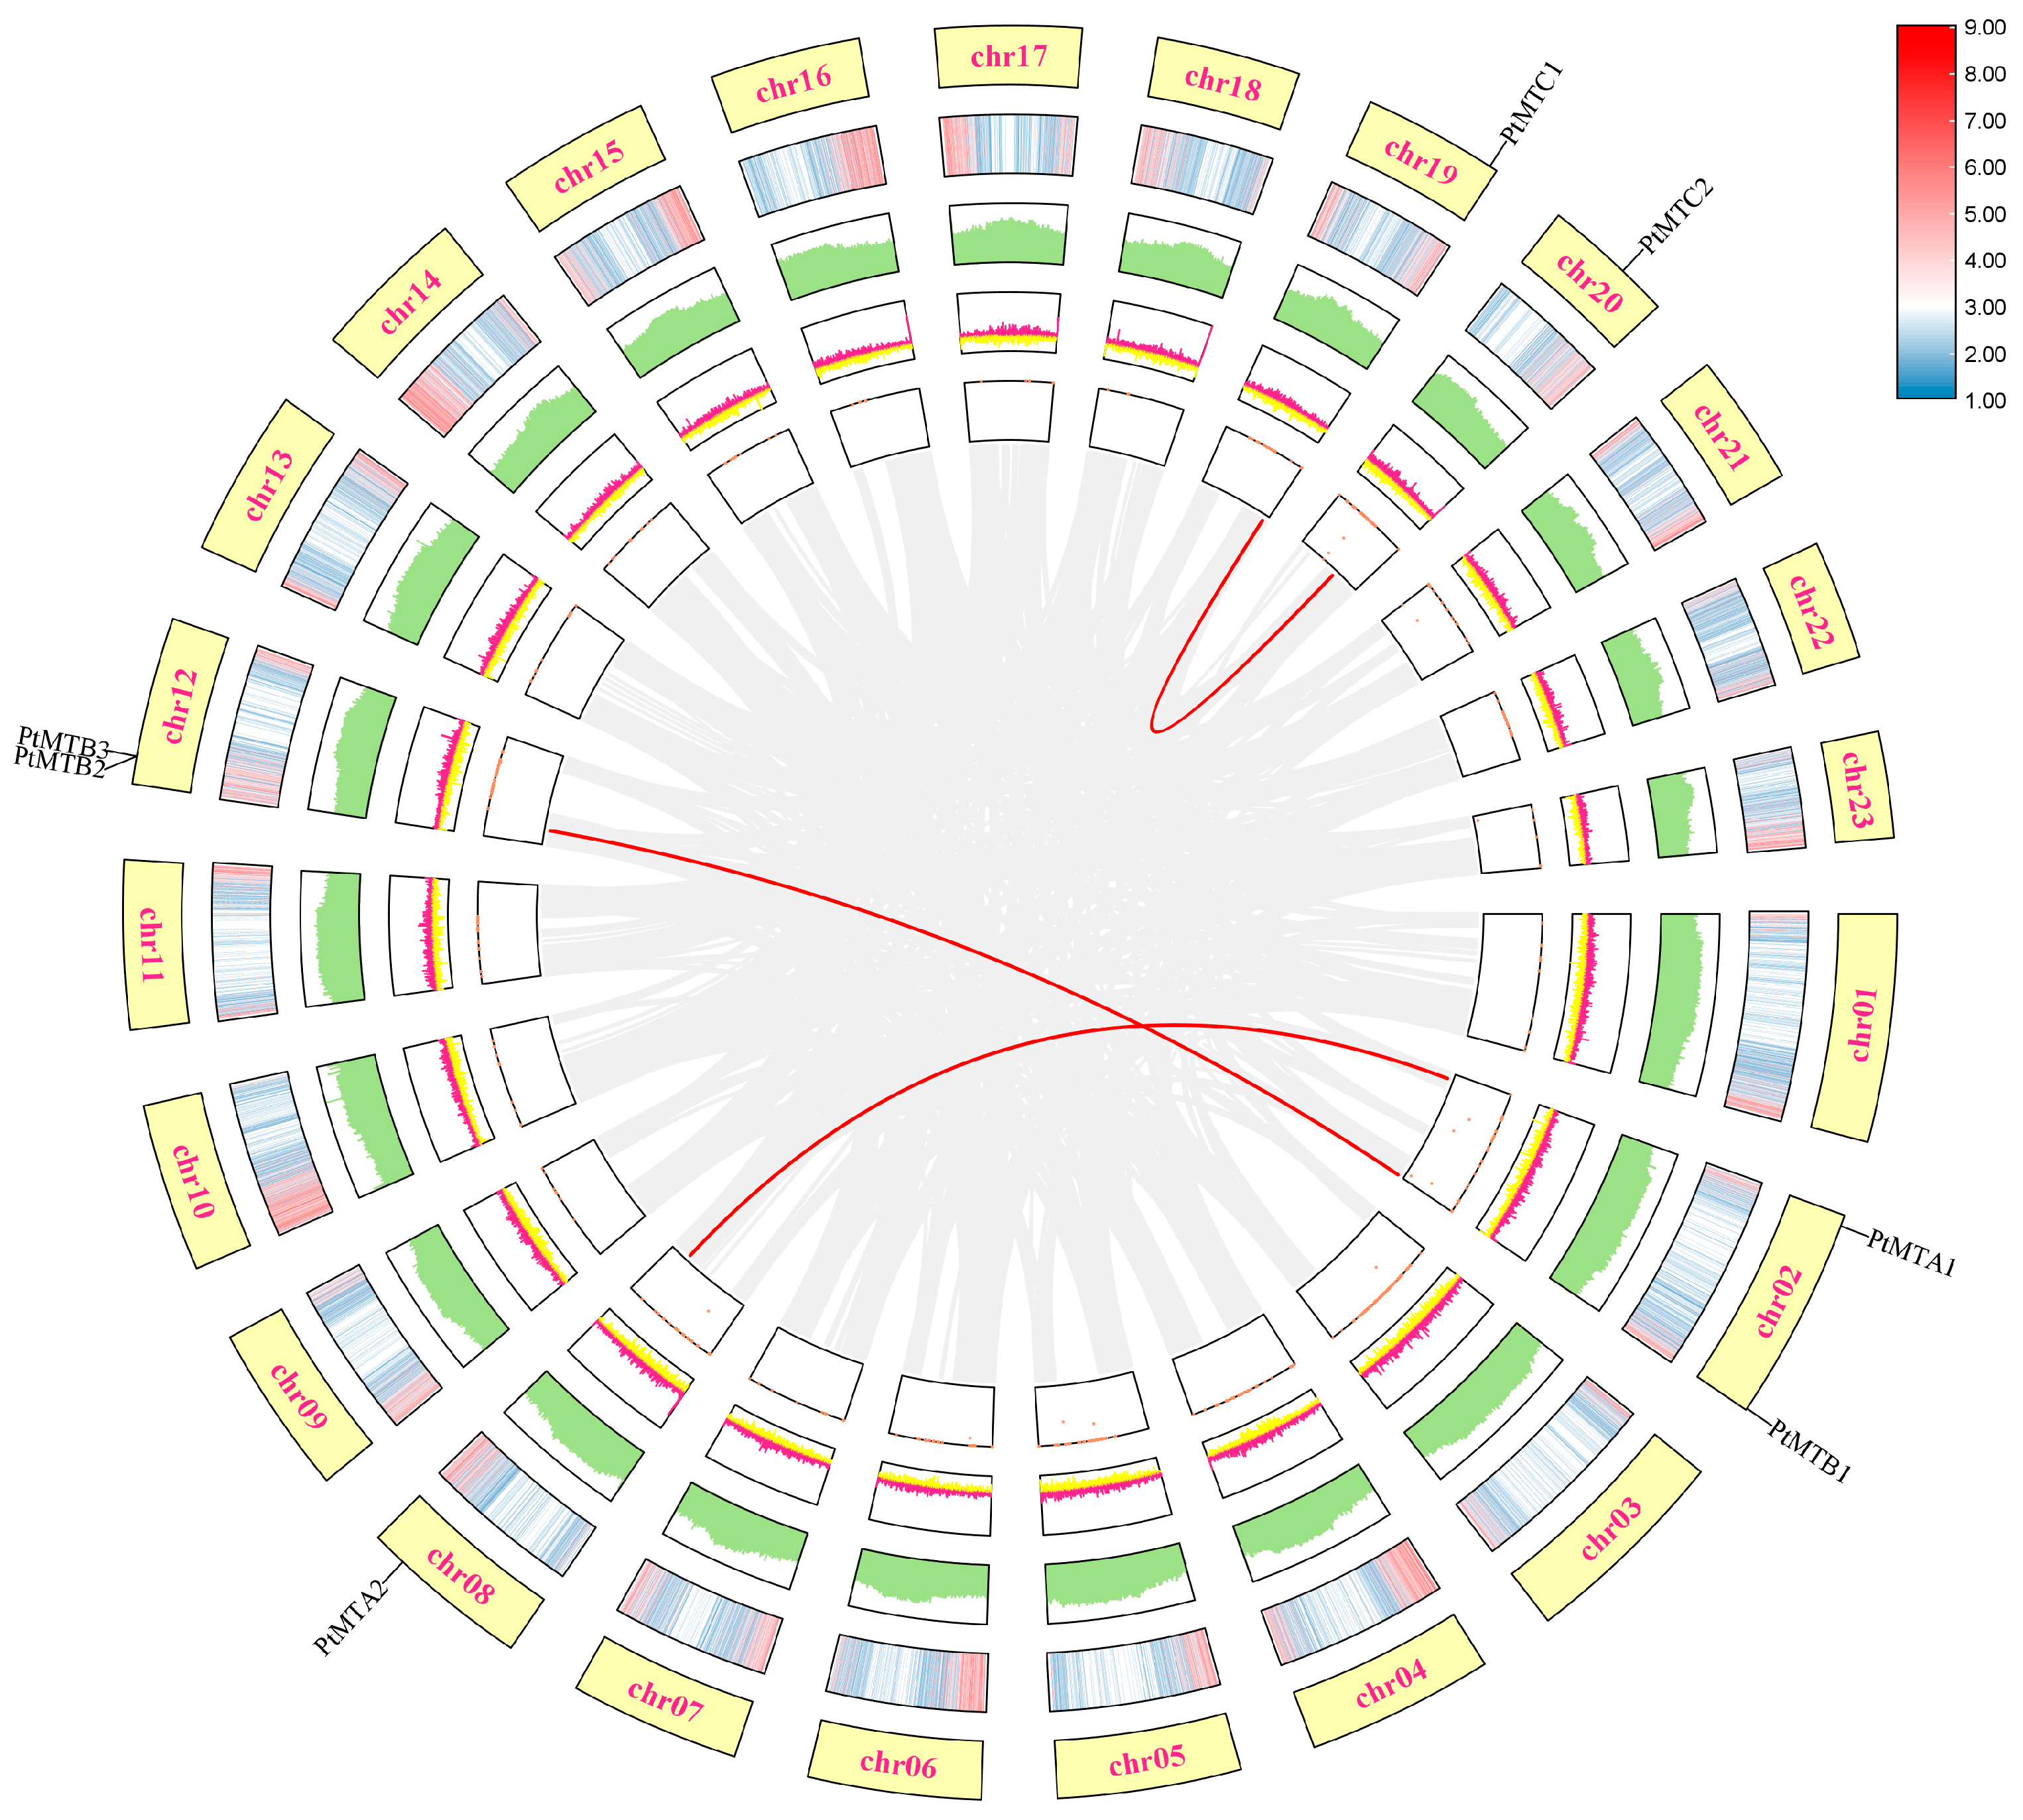
2.7. Collinearity Analysis

The results of collinearity analysis of PtMT genes are shown in Figure 6. PtMTA1 and PtMTB1 genes were distributed on chr02, PtMTB2, and PtMTB3 genes on chr12, PtMTA2, PtMTC1, and PtMTC2 genes on chr08, chr19, and chr20, respectively. Three gene pairs existed in a collinearity relationship, PtMTA1 and PtMTA2, PtMTB1 and PtMTB2, and PtMTC1 and PtMTC2. The collinearity of PtMT gene families was further illustrated using DotPlot (Figure S3). To better understand the evolutionary history of PtMT gene families, the Ka/Ks values of the three collinear gene pairs were calculated using the TBtools software (v2.096) (Table S4), The results showed that the three collinear gene pairs belong to segmental duplication, and the Ka/Ks values of the three pairs were all less than 0.5, indicating that purifying selection has always existed during the evolutionary process of the PtMT gene family.

2.8. Expression Profiles of MT-A70 Genes
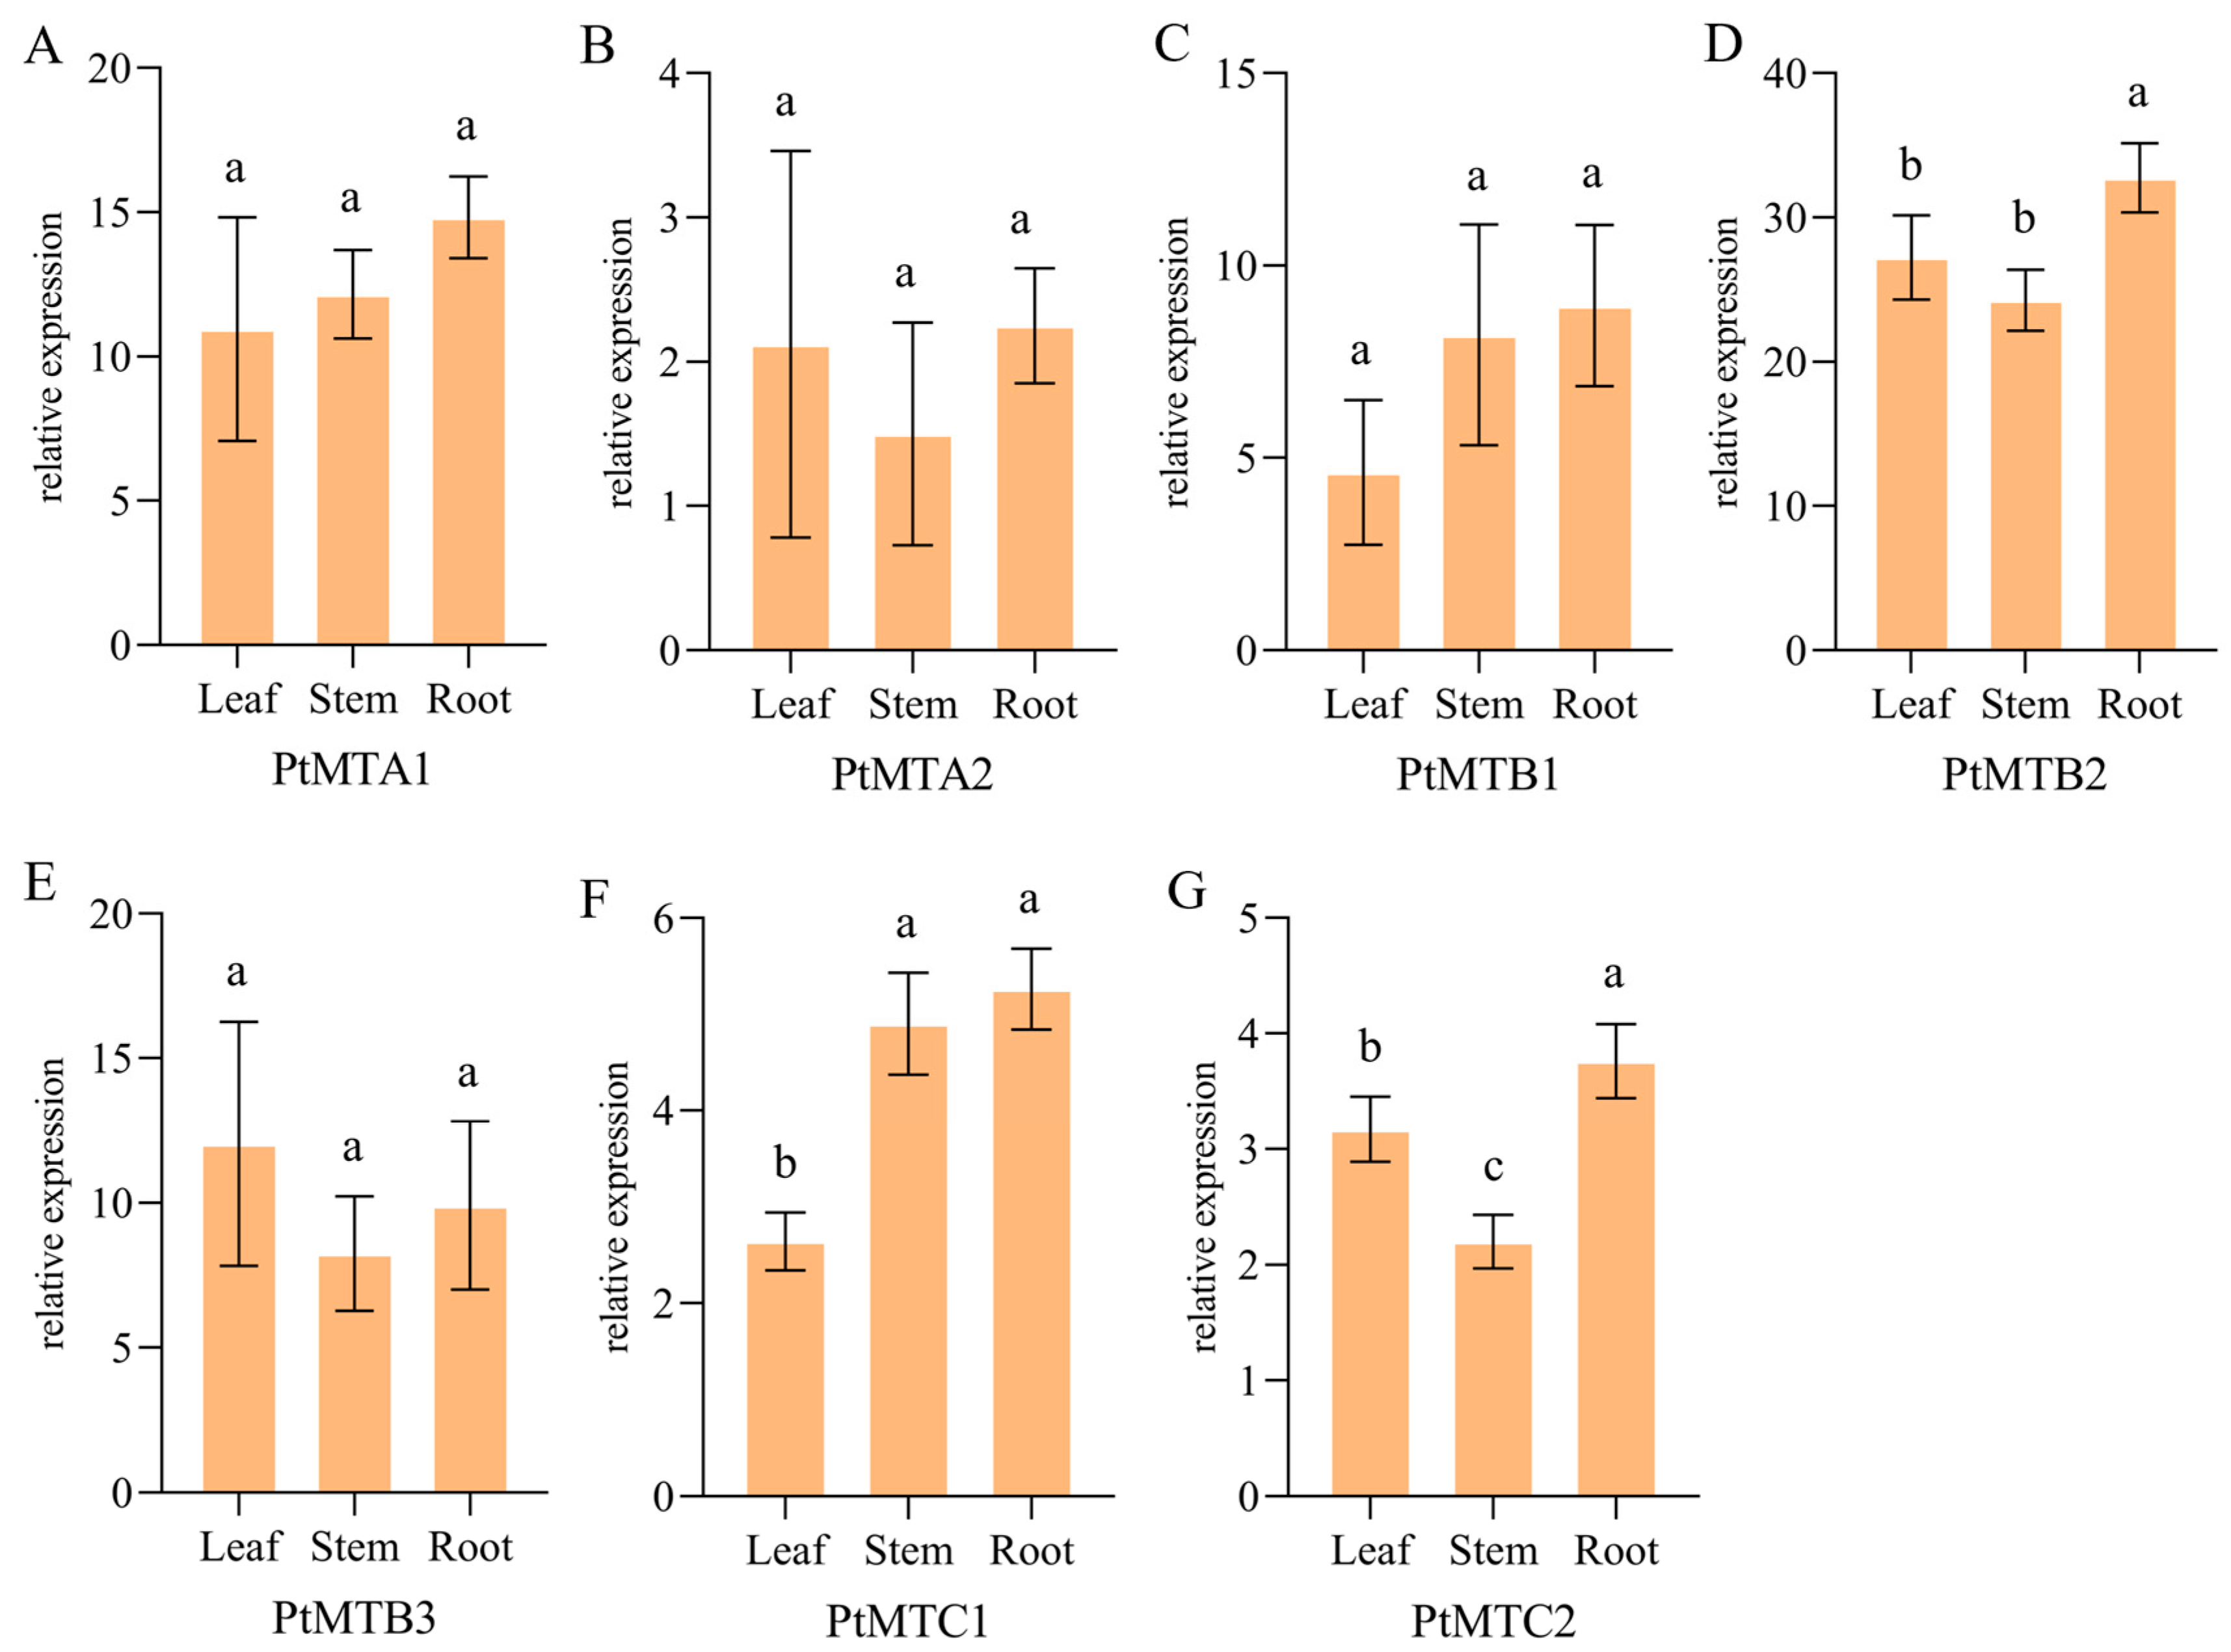
The expression of MT-A70 gene family members in different tissues of P. tangutica was analyzed. The data obtained from NCBI were used to draw a heat map of specific expression (Figure 7), which showed that PtMTA1 and PtMTB2 showed higher expression in flowers and sepals, and the other six genes, except for the PtMTC1 gene, were more highly expressed in sepals. PtMTC2 had lower expression in all tissues of P. tangutica. In leaves, the relative expression of all seven PtMT genes was low (Table S5).

2.9. qRT-PCR

The expression of PtMT genes in different tissues was investigated using qPCR (Figure 8). The results showed that the expression of these genes displayed differential expression patterns. All the PtMT genes were highly expressed in roots, especially the PtMTB1 gene which had the highest expression in roots.

3. Discussion

m6A RNA methylation is the predominant intermediate chemical modification implicated in post-transcriptional gene regulation in eukaryotes. It is essential in governing mRNA processing and metabolism, encompassing translation, degradation, splicing, and transport [33]. Consequently, m6A plays a role in the regulation of numerous biological processes. This study utilized a bioinformatics approach to identify and characterize seven members of the MT-A70 gene family in P. tangutica, which constitutes a relatively small gene family. Comparable results have been observed in other species, including Populus alba × Populus glandulosa (Poplar 84K), which possesses eight MT-A70 genes [34], whereas Litchi (Litchi chinensis Sonn.) [35] and Aegilops tauschii [36] each harbor two MT-A70 genes. Phylogenetic analyses indicated that the MT-A70 gene family in P. tangutica encodes proteins classified into three subclades, with PtMTBs representing the largest group, consisting of three genes. This distribution resembles that observed in Arabidopsis. MTA has been thoroughly investigated in Arabidopsis. A backfill mutant strain (mta-ABI3 prom: MTA) that selectively expresses MTA during embryogenesis displays phenotypes including diminished apical dominance, malformed floral organs, augmented epidermal hair meristems, stunted root growth, modified root primordial xylem development, and gravitropic defects [37]. Considering that P. tangutica contains two MTA genes that cluster within the same phylogenetic branch as AtMTA, it is reasonable to assume they may execute analogous methylation functions.
The ratio of nonsynonymous to synonymous substitutions (Ka/Ks) is a crucial metric for evaluating selective pressure on protein-coding genes. This study found that the Ka/Ks values for three collinear gene pairs, PtMTA1 and PtMTA2 genes, PtMTB1 and PtMTB2, and PtMTC1 and PtMTC2 were all under 0.5. This indicates that the PtMT gene family has experienced significant purifying selection throughout evolution [38], reflecting the preservation of their structure and function.
Recent studies have emphasized the significance of PtMT genes in responses to abiotic stresses, such as drought, salinity, and hormonal regulation [39,40,41]. The expression levels of OsMTA and OsMTB in rice diminished under drought stress. The overexpression of PtrMTA in poplar markedly augmented trichome density and promoted root system development, consequently enhancing drought tolerance [42,43]. Furthermore, m6A methylation is essential for salt stress tolerance in Arabidopsis thaliana [44], as evidenced by the salt-sensitive phenotypes observed in MTA and MTB mutants. Drought stress similarly prompts the expression of ClMTB, a m6A methyltransferase in watermelon. The overexpression of ClMTB in tobacco plants augments drought tolerance by enhancing reactive oxygen species scavenging activity [45]. The examination of cis-regulatory elements in the promoters of PtMT genes indicated that their transcriptional initiation is predominantly governed by light, phytohormones (ABA, GA, MeJA, and SA), environmental stresses, and developmental signals (Figure 4 and Table S2). Gene Ontology annotation and enrichment analyses revealed that the seven PtMT genes predominantly exhibit methyltransferase activity (molecular function), localize to the nucleus (cellular component), and participate in mRNA methylation (biological process) (Figure 3B and Table S1).
In this study, we analyzed the expression of MT-A70 genes in six tissues of flower, leaf, sepal, early_calyx, mid_calyx, and late_calyx. The results showed that these genes were expressed in all six tissues of P. tangutica, but there were differences in the expression profiles with the lowest expression in late_calyx tissues, and that genes clustered on the same branch showed similar expression patterns, suggesting that they may play similar roles in plant growth and development. Previous studies reported that in cotton [46], RNA-seq data showed that GhMETTL14 and GhMETTL3 were highly expressed in roots, stems, leafs, torus, petals, stamens, pistils, and calycle tissues, which is consistent with our results. The m6A modification level is closely related to the expression of methyltransferase in rice panicles and flag leaves [47], with a more significant difference between different organs than between the same organ at different stages. Therefore, it is necessary to further study the detailed functions of MT-A70 genes in the growth and development of P. tangutica.

4. Materials and Methods

4.1. Identification of PtMTs Gene Family

The reference genome and annotated protein sequences of P. tangutica were sourced from the NCBI database (https://www.ncbi.nlm.nih.gov/, accessed on 25 November 2023) [32]. TAIR provided the amino acid sequences of the four MT-A70 proteins from Arabidopsis thaliana. Potential MT-A70 members were found by BLASTP analysis (E-value threshold of 1 × 10⁻⁵) of the P. tangutica genome using TBtools software (v2.096) [48]. Conserved structural domains were found using the NCBI-CDD database (http://www.ncbi.nlm.nih.gov/Structure/cdd/wrpsb.cgi/, accessed on 8 December 2023) [49] and the Pfam database (http://pfam.xfam.org/, accessed on 8 December 2023) [50]. Excluded were candidate members lacking the MT-A70 domain or with partial domains; the last PtMT gene sequences were assigned sequentially according to their chromosomal sites.

4.2. Physicochemical Properties Analysis

PtMT proteins’ physicochemical characteristics, including grand average hydropathicity (GRAVY), aliphatic index, molecular weight (MW), instability index, and isoelectric point (pI), were investigated using the ExPASy website (http://web.expasy.org/protparam/, accessed on 12 February 2024). The WoLFPSORT website (https://wolfpsort.hgc.jp/, accessed on 12 February 2024) was used to predict subcellular localization [51].

4.3. Gene Structure, Conserved Motifs, and 3D Protein Analysis

GSDS 2.0 (http://gsds.cbi.pku.edu.cn/, accessed on 15 February 2024) was given CDS sequences and their related genomic sequences for the examination of exon–intron structures and visualization [52]. Using MEME (https://meme-suite.org/meme/, accessed on 15 February 2024) [53], conserved motifs in candidate protein sequences were predicted with a maximum of 10 motifs and default settings. Using GOR IV (https://npsa-prabi.ibcp.fr/cgi-bin/npsa_automat.pl?page=/NPSA/npsa_gor4.html/, accessed on 17 February 2024) [54], protein secondary structure was predicted; three-dimensional structural models were produced using the SWISS-MODEL online tool (https://swissmodel.expasy.org/, accessed on 17 February 2024) [55].

4.4. Phylogenetic Analysis

A multiple sequence alignment of m6A-related proteins from Solanum lycopersicum, Capsicum annuum, Solanum tuberosum, Arabidopsis thaliana, Nicotiana tabacum, Anisodus acutangulus, Mandragora chinghaiensis, Datura stramonium, Anisodus tanguticus, and Atropa belladonna was conducted utilizing ClustalW (https://www.genome.jp/tools-bin/clustalw, accessed on 21 February 2024) [56]. Using the neighbor-joining (NJ) technique in MEGA 11.0 software [57], a phylogenetic tree was produced with the bootstrap parameter set to 1000 and visualized using iTOL (https://itol.embl.de/, accessed on 22 February 2024) [58].

4.5. Enrichment Analysis Using Gene Ontology (GO) and Cis-Regulatory Elements

Promoter sequences of PtMT genes (2000 bp upstream of the translation initiation codon ‘ATG’) were extracted and analyzed utilizing the PlantCARE database (http://bioinformatics.psb.ugent.be/webtools/plantcare/html/, accessed on 6 March 2024) [59]. The distribution patterns of cis-regulatory elements were visualized with TBtools software [48]. TBtools was used to visualize the PtMT genes chromosomal location data obtained from P. tangutica genome annotation files [32]. PtMT genes were BLASTed against the uniprot_sprot.fasta file retrieved from the STRING database (https://cn.string-db.org/, accessed on 6 March 2024) for GO study [60] and TBtools was used to perform GO annotation and enrichment analysis.

4.6. Gene Expression Pattern and Collinearity Analysis

Sourced from the NCBI Sequence Read Archive (SRA) database, eighteen RNA-seq samples were acquired under BioProject accession number PRJNA791792 (https://www.ncbi.nlm.nih.gov/sra/, accessed on 8 March 2024). Using TBtools software [48], the samples acquired from six different P. tangutica tissues (Table S6) were processed for sequence transformation; Galaxy (https://usegalaxy.org/, accessed on 6 March 2024) was used for data analysis [61]. Using ChiPlot (https://www.chiplot.online/, accessed on 10 March 2024), a heatmap showing gene expression patterns was generated. While Advanced Circos of TBtools [62] was used to show the collinear connections inside the PtMT gene family, TBtools software was used to extract the PtMT gene location data and collinear gene pairs from the P. tangutica genome annotation file. The Simple Ka/Ks Calculator function in TBtools was used to calculate the non-synonymous (Ka) and synonymous (Ks) substitution rates for collinear gene pairs [47].

4.7. Quantitative Real-Time Reverse Transcription-PCR (qRT-PCR)

Total RNA was extracted from the stems, leaves, and roots of aseptic P. tangutica seedlings that were three months old using the SteadyPure Plant RNA Extraction Kit (Accurate Biology, Lanzhou, China). Using the Evo M-MLV RT for PCR Kit (Accurate Biology, China), reverse transcription produced cDNA. Adhering to standard procedures, the SYBR Green Premix Pro Taq HS qPCR Kit (Accurate Biology, China) was used to run qRT-PCR tests on PtMT genes. The reference gene [40] was PGK. Table S7 lists primer sequences for all genes; relative gene expression levels were calculated using the 2–ΔΔCt approach [63].

5. Conclusions

In this study, 7 PtMT genes were identified with the help of bioinformatics tools and the P. tangutica genome primarily, they belong to the subfamilies MTA, MTB, and MTC. Additionally, their physicochemical properties, including their phylogenetic relationship, gene and protein structure, chromosomal arrangement, and cis-regulatory elements, were analyzed as part of a comprehensive survey. Expression analysis revealed that different tissues of PtMT genes were differentially expressed. Our results will supply some insight into the characteristics of P. tangutica MT-A70 genes and their probable epigenetic regulation mechanism in P. tangutica.

Supplementary Materials

The following supporting information can be downloaded at: https://www.mdpi.com/article/10.3390/ijms26083593/s1.

Author Contributions

Conceptualization, D.Z.; data curation, X.Y.; formal analysis, X.Y. and X.H.; funding acquisition, D.Z.; investigation, K.Z., J.M., and H.D. methodology, X.Y.; resources, X.H.; supervision, D.Z.; writing—original draft, X.Y.; writing—review and editing, X.Y., X.H., K.Z., J.M., H.D., X.C. and D.Z. All authors have read and agreed to the published version of the manuscript. Qinghai Province commissioner special project.

Funding

This work was supported by grants from the Special Project for the Construction of Innovation Platform in Qinghai Province (2024-ZJ-T02).

Institutional Review Board Statement

Not applicable.

Informed Consent Statement

Not applicable.

Data Availability Statement

Data are contained within the article and Supplementary Materials.

Conflicts of Interest

The authors declare no conflict of interest.

References

  1. Kadumuri, R.V.; Janga, S.C. Epitranscriptomic code and its alterations in human disease. Trends Mol. Med. 2018, 24, 886–903. [Google Scholar] [PubMed]
  2. Liang, Z.; Riaz, A.; Chachar, S.; Ding, Y.; Du, H.; Gu, X. Epigenetic modifications of mRNA and DNA in plants. Mol. Plant 2020, 13, 14–30. [Google Scholar] [PubMed]
  3. Zhang, T.; Shi, C.; Hu, H.; Zhang, Z.; Wang, Z.; Chen, Z.; Feng, H.; Liu, P.; Guo, J.; Lu, Q. N6-methyladenosine RNA modification promotes viral genomic RNA stability and infection. Nat. Commun. 2022, 13, 6576. [Google Scholar]
  4. Luo, G.Z.; MacQueen, A.; Zheng, G.; Duan, H.; Dore, L.C.; Lu, Z.; Liu, J.; Chen, K.; Jia, G.; Bergelson, J.; et al. Unique features of the m6A methylome in Arabidopsis thaliana. Nat. Commun. 2014, 5, 5630. [Google Scholar]
  5. Fu, Y.; Dominissini, D.; Rechavi, G.; He, C. Gene expression regulation mediated through reversible m⁶A RNA methylation. Nat. Rev. Genet. 2014, 15, 293–306. [Google Scholar]
  6. Anderson, S.J.; Kramer, M.C.; Gosai, S.J.; Yu, X.; Vandivier, L.E.; Nelson, A.D.L.; Anderson, Z.D.; Beilstein, M.A.; Fray, R.G.; Lyons, E.; et al. N6-Methyladenosine Inhibits Local Ribonucleolytic Cleavage to Stabilize mRNAs in Arabidopsis. Cell Rep. 2018, 25, 1146–1157. [Google Scholar]
  7. Arribas-Hernández, L.; Rennie, S.; Schon, M.; Porcelli, C.; Enugutti, B.; Andersson, R.; Nodine, M.D.; Brodersen, P. The YTHDF proteins ECT2 and ECT3 bind largely overlapping target sets and influence target mRNA abundance, not alternative polyadenylation. Elife 2021, 10, e72377. [Google Scholar]
  8. Kramer, M.C.; Janssen, K.A.; Palos, K.; Nelson, A.D.L.; Vandivier, L.E.; Garcia, B.A.; Lyons, E.; Beilstein, M.A.; Gregory, B.D. N6-methyladenosine and RNA secondary structure affect transcript stability and protein abundance during systemic salt stress in Arabidopsis. Plant direct 2020, 4, e00239. [Google Scholar]
  9. Motorin, Y.; Helm, M. RNA nucleotide methylation. Wiley Interdiscip. Rev. RNA 2011, 2, 611–631. [Google Scholar]
  10. Desrosiers, R.; Friderici, K.; Rottman, F. Identification of methylated nucleosides in messenger RNA from Novikoff hepatoma cells. Proc. Natl. Acad. Sci. USA 1974, 71, 3971–3975. [Google Scholar]
  11. Schibler, U.; Kelley, D.E.; Perry, R.P. Comparison of methylated sequences in messenger RNA and heterogeneous nuclear RNA from mouse L cells. J. Mol. Biol. 1977, 115, 695–714. [Google Scholar] [CrossRef] [PubMed]
  12. Levis, R.; Penman, S. 5′-terminal structures of poly(A)+ cytoplasmic messenger RNA and of poly(A)+ and poly(A)- heterogeneous nuclear RNA of cells of the dipteran Drosophila melanogaster. J. Mol. Biol. 1978, 120, 487–515. [Google Scholar] [CrossRef] [PubMed]
  13. Kennedy, T.D.; Lane, B.G. Wheat embryo ribonucleates. XIII. Methyl-substituted nucleoside constituents and 5′-terminal dinucleotide sequences in bulk poly(AR)-rich RNA from imbibing wheat embryos. Can. J. Biochem. 1979, 57, 927–931. [Google Scholar] [CrossRef] [PubMed]
  14. Haugland, R.A.; Cline, M.G. Post-transcriptional modifications of oat coleoptile ribonucleic acids. 5′-Terminal capping and methylation of internal nucleosides in poly(A)-rich RNA. Eur. J. Biochem. 1980, 104, 271–277. [Google Scholar] [CrossRef]
  15. Zhu, J.; An, T.; Zha, W.; Gao, K.; Li, T.; Zi, J. Manipulation of IME4 expression, a global regulation strategy for metabolic engineering in Saccharomyces cerevisiae. Acta Pharm. Sin. B 2023, 13, 2795–2806. [Google Scholar] [CrossRef]
  16. Hu, J.; Xu, T.; Kang, H. Crosstalk between RNA m6A modification and epigenetic factors in plant gene regulation. Plant Commun. 2024, 5, 101037. [Google Scholar] [CrossRef]
  17. Zhang, J.; Wu, L.; Mu, L.; Wang, Y.; Zhao, M.; Wang, H.; Li, X.; Zhao, L.; Lin, C.; Zhang, H.; et al. Evolution and post-transcriptional regulation insights of m6A writers, erasers, and readers in plant epitranscriptome. Plant J. 2024, 120, 505–525. [Google Scholar] [CrossRef]
  18. Liu, J.; Yue, Y.; Han, D.; Wang, X.; Fu, Y.; Zhang, L.; Jia, G.; Yu, M.; Lu, Z.; Deng, X.; et al. A METTL3-METTL14 complex mediates mammalian nuclear RNA N6-adenosine methylation. Nat. Chem. Biol. 2014, 10, 93–95. [Google Scholar] [CrossRef]
  19. Ping, X.L.; Sun, B.F.; Wang, L.; Xiao, W.; Yang, X.; Wang, W.J.; Adhikari, S.; Shi, Y.; Lv, Y.; Chen, Y.S.; et al. Mammalian WTAP is a regulatory subunit of the RNA N6-methyladenosine methyltransferase. Cell Res. 2014, 24, 177–189. [Google Scholar] [CrossRef]
  20. Kan, L.; Grozhik, A.V.; Vedanayagam, J.; Patil, D.P.; Pang, N.; Lim, K.S.; Huang, Y.C.; Joseph, B.; Lin, C.J.; Despic, V.; et al. The m6A pathway facilitates sex determination in Drosophila. Nat. Commun. 2017, 8, 15737. [Google Scholar] [CrossRef]
  21. Růžička, K.; Zhang, M.; Campilho, A.; Bodi, Z.; Kashif, M.; Saleh, M.; Eeckhout, D.; El-Showk, S.; Li, H.; Zhong, S.; et al. Identification of factors required for m6A mRNA methylation in Arabidopsis reveals a role for the conserved E3 ubiquitin ligase HAKAI. New Phytol. 2017, 215, 157–172. [Google Scholar] [PubMed]
  22. Jiménez-Ramírez, I.A.; Pijeira-Fernández, G.; Moreno-Cálix, D.M.; De-la-Peña, C. Same modification, different location: The mythical role of N6-adenine methylation in plant genomes. Planta 2022, 256, 9. [Google Scholar] [PubMed]
  23. Kan, L.; Ott, S.; Joseph, B.; Park, E.S.; Dai, W.; Kleiner, R.E.; Claridge-Chang, A.; Lai, E.C. A neural m6A/Ythdf pathway is required for learning and memory in Drosophila. Nat. Commun. 2021, 12, 1458. [Google Scholar] [PubMed]
  24. Govindan, G.; Sharma, B.; Li, Y.F.; Armstrong, C.D.; Merum, P.; Rohila, J.S.; Gregory, B.D.; Sunkar, R. mRNA N6-methyladenosine is critical for cold tolerance in Arabidopsis. Plant J. 2022, 111, 1052–1068. [Google Scholar]
  25. Wang, X.; Zhao, B.S.; Roundtree, I.A.; Lu, Z.; Han, D.; Ma, H.; Weng, X.; Chen, K.; Shi, H.; He, C. N(6)-methyladenosine Modulates Messenger RNA Translation Efficiency. Cell 2015, 161, 1388–1399. [Google Scholar]
  26. Wang, X.; Lu, Z.; Gomez, A.; Hon, G.C.; Yue, Y.; Han, D.; Fu, Y.; Parisien, M.; Dai, Q.; Jia, G.; et al. N6-methyladenosine-dependent regulation of messenger RNA stability. Nature 2014, 505, 117–120. [Google Scholar]
  27. Zhong, S.; Li, H.; Bodi, Z.; Button, J.; Vespa, L.; Herzog, M.; Fray, R.G. MTA is an Arabidopsis messenger RNA adenosine methylase and interacts with a homolog of a sex-specific splicing factor. Plant Cell 2008, 20, 1278–1288. [Google Scholar]
  28. Zhang, K.; Zhuang, X.; Dong, Z.; Xu, K.; Chen, X.; Liu, F.; He, Z. The dynamics of N6-methyladenine RNA modification in interactions between rice and plant viruses. Genome Biol. 2021, 22, 189. [Google Scholar]
  29. Zhou, L.; Tang, R.; Li, X.; Tian, S.; Li, B.; Qin, G. N6-methyladenosine RNA modification regulates strawberry fruit ripening in an ABA-dependent manner. Genome Biol. 2021, 22, 168. [Google Scholar]
  30. Lu, J.; Tang, X.; Quan, H.; Lan, X. An overview of research on Przewalskia tangutica Maxim., an endangered tibetan medicinal plant. Agric. Sci. Technol. 2017, 18, 2320–2325. [Google Scholar]
  31. Xiao, P.; Xia, G.; He, L. The occurrence of some important tropane alkaloids in Chinese solanaceous plants. Acta Bot. Sin. 1973, 15, 187–194. [Google Scholar]
  32. Wu, Y.; Yang, J.; Yang, Y.; Liu, J. The genome sequence and demographic history of Przewalskia tangutica (Solanaceae), an endangered alpine plant on the Qinghai-Tibet Plateau. DNA Res. 2023, 30, dsad005. [Google Scholar] [CrossRef] [PubMed]
  33. Shi, H.; Wei, J.; He, C. Where, when, and how: Context-dependent functions of RNA methylation writers, readers, and erasers. Mol. Cell 2019, 74, 640–650. [Google Scholar] [CrossRef] [PubMed]
  34. Sun, X.; Wu, W.; Yang, Y.; Wilson, I.; Shao, F.; Qiu, D. Genome-Wide Identification of m6A Writers, Erasers and Readers in Poplar 84K. Genes 2022, 13, 1018. [Google Scholar] [CrossRef]
  35. Tang, L.; Xue, J.; Ren, X.; Zhang, Y.; Du, L.; Ding, F.; Zhou, K.; Ma, W. Genome-Wide Identification and Expression Analysis of m6A Writers, Erasers, and Readers in Litchi (Litchi chinensis Sonn.). Genes 2022, 13, 2284. [Google Scholar] [CrossRef]
  36. Lin, H.; Shi, T.; Zhang, Y.; He, C.; Zhang, Q.; Mo, Z.; Pan, W.; Nie, X. Genome-Wide Identification, Expression and Evolution Analysis of m6A Writers, Readers and Erasers in Aegilops_tauschii. Plants 2023, 12, 2747. [Google Scholar] [CrossRef]
  37. Bodi, Z.; Zhong, S.; Mehra, S.; Song, J.; Graham, N.; Li, H.; May, S.; Fray, R.G. Adenosine methylation in Arabidopsis mRNA is associated with the 3′ end and reduced levels cause developmental defects. Front. Plant Sci. 2012, 3, 48. [Google Scholar] [CrossRef]
  38. Yang, Z.; Nielsen, R. Estimating synonymous and nonsynonymous substitution rates under realistic evolutionary models. Mol. Biol. Evol. 2000, 17, 32–43. [Google Scholar] [CrossRef]
  39. Hasan, M.; Nishat, Z.S.; Hasan, M.S.; Hossain, T.; Ghosh, A. Identification of m6A RNA Methylation Genes in Oryza sativa and Expression Profiling in Response to Different Developmental and Environmental Stimuli. Biochem. Biophys. Rep. 2024, 38, 101677. [Google Scholar] [CrossRef]
  40. Liu, P.; Liu, H.; Zhao, J.; Yang, T.; Guo, S.; Chang, L.; Xiao, T.; Xu, A.; Liu, X.; Zhu, C.; et al. Genome-wide identification and functional analysis of mRNA m6A writers in soybean under abiotic stress. Front. Plant Sci. 2024, 15, 1446591. [Google Scholar] [CrossRef]
  41. Sheikh, A.H.; Tabassum, N.; Rawata, A.; Almeida Trapp, M.; Nawaz, K.; Hirt, H. m6A RNA Methylation Counteracts Dark-induced Leaf Senescence in Arabidopsis. Plant Physiol. 2024, 194, 2663–2678. [Google Scholar] [PubMed]
  42. Hu, J.; Manduzio, S.; Kang, H. Epitranscriptomic RNA Methylation in Plant Development and Abiotic Stress Responses. Front. Plant Sci. 2019, 10, 500. [Google Scholar] [CrossRef] [PubMed]
  43. Lu, L.; Zhang, Y.; He, Q.; Qi, Z.; Zhang, G.; Xu, W.; Yi, T.; Wu, G.; Li, R. MTA, an RNA m6A Methyltransferase, Enhances Drought Tolerance by Regulating the Development of Trichomes and Roots in Poplar. Int. J. Mol. Sci. 2020, 21, 2462. [Google Scholar] [CrossRef] [PubMed]
  44. Hu, J.; Cai, J.; Park, S.J.; Lee, K.; Li, Y.; Chen, Y.; Yun, J.; Xu, T.; Kang, H. N6-Methyladenosine mRNA methylation is important for salt stress tolerance in Arabidopsis. Plant J. 2021, 106, 1759–1775. [Google Scholar] [CrossRef]
  45. He, Y.; Li, Y.; Yao, Y.; Zhang, H.; Wang, Y.; Gao, J.; Fan, M. Overexpression of watermelon m6A methyltransferase ClMTB enhances drought tolerance in tobacco by mitigating oxidative stress and photosynthesis inhibition and modulating stress-responsive gene expression. Plant Physiol. Biochem. 2021, 168, 340–352. [Google Scholar]
  46. Cao, J.; Huang, C.; Liu, J.; Li, C.; Liu, X.; Zheng, Z.; Hou, L.; Huang, J.; Wang, L.; Zhang, Y.; et al. Comparative Genomics and Functional Studies of Putative m6A Methyltransferase (METTL) Genes in Cotton. Int. J. Mol. Sci. 2022, 23, 14111. [Google Scholar] [CrossRef]
  47. Wang, L.; Yang, C.; Shan, Q.; Zhao, M.; Yu, J.; Li, Y.-F. Transcriptome-wide profiling of mRNA N6-methyladenosine modification in rice panicles and flag leaves. Genomics 2023, 115, 110542. [Google Scholar]
  48. Chen, C.; Chen, H.; Zhang, Y.; Thomas, H.R.; Frank, M.H.; He, Y.; Xia, R. TBtools: An Integrative Toolkit Developed for Interactive Analyses of Big Biological Data. Mol. Plant 2020, 13, 1194–1202. [Google Scholar] [CrossRef]
  49. Lu, S.; Wang, J.; Chitsaz, F.; Derbyshire, M.K.; Geer, R.C.; Gonzales, N.R.; Gwadz, M.; Hurwitz, D.I.; Marchler, G.H.; Song, J.S.; et al. CDD/SPARCLE: The conserved domain database in 2020. Nucleic Acids Res. 2020, 48, D265–D268. [Google Scholar]
  50. Mistry, J.; Chuguransky, S.; Williams, L.; Qureshi, M.; Salazar, G.A.; Sonnhammer, E.L.L.; Tosatto, S.C.E.; Paladin, L.; Raj, S.; Richardson, L.J.; et al. Pfam: The protein families database in 2021. Nucleic Acids Res. 2021, 49, D412–D419. [Google Scholar]
  51. Horton, P.; Park, K.J.; Obayashi, T.; Fujita, N.; Harada, H.; Adams-Collier, C.J.; Nakai, K. WoLF PSORT: Protein localization predictor. Nucleic Acids Res. 2007, 35, W585–W587. [Google Scholar] [PubMed]
  52. Hu, B.; Jin, J.; Guo, A.Y.; Zhang, H.; Luo, J.; Gao, G. GSDS 2.0: An upgraded gene feature visualization server. Bioinformatics 2015, 31, 1296–1297. [Google Scholar] [PubMed]
  53. Bailey, T.L.; Boden, M.; Buske, F.A.; Frith, M.; Grant, C.E.; Clementi, L.; Ren, J.; Li, W.W.; Noble, W.S. MEME SUITE: Tools for motif discovery and searching. Nucleic Acids Res. 2009, 37, W202–W208. [Google Scholar]
  54. Kloczkowski, A.; Ting, K.L.; Jernigan, R.L.; Garnier, J. Combining the GOR V algorithm with evolutionary information for protein secondary structure prediction from amino acid sequence. Proteins 2002, 49, 154–166. [Google Scholar]
  55. Waterhouse, A.; Bertoni, M.; Bienert, S.; Studer, G.; Tauriello, G.; Gumienny, R.; Heer, F.T.; de Beer, T.A.P.; Rempfer, C.; Bordoli, L.; et al. SWISS-MODEL: Homology modelling of protein structures and complexes. Nucleic Acids Res. 2018, 46, W296–W303. [Google Scholar]
  56. Larkin, M.A.; Blackshields, G.; Brown, N.P.; Chenna, R.; McGettigan, P.A.; McWilliam, H.; Valentin, F.; Wallace, I.M.; Wilm, A.; Lopez, R.; et al. Clustal W and Clustal X version 2.0. Bioinformatics 2007, 23, 2947–2948. [Google Scholar]
  57. Tamura, K.; Stecher, G.; Kumar, S. MEGA11: Molecular evolutionary genetics analysis version 11. Mol. Biol. Evol. 2021, 38, 3022–3027. [Google Scholar] [CrossRef]
  58. Letunic, I.; Bork, P. Interactive Tree of Life (iTOL) v5: An online tool for phylogenetic tree display and annotation. Nucleic Acids Res. 2021, 49, W293–W296. [Google Scholar]
  59. Lescot, M.; Déhais, P.; Thijs, G.; Marchal, K.; Moreau, Y.; Van de Peer, Y.; Rouzé, P.; Rombauts, S. PlantCARE, a database of plant cis-acting regulatory elements and a portal to tools for in silico analysis of promoter sequences. Nucleic Acids Res. 2002, 30, 325–327. [Google Scholar]
  60. Szklarczyk, D.; Gable, A.L.; Nastou, K.C.; Lyon, D.; Kirsch, R.; Pyysalo, S.; Doncheva, N.T.; Legeay, M.; Fang, T.; Bork, P.; et al. The STRING database in 2021: Customizable protein-protein networks, and functional characterization of user-uploaded gene/measurement sets. Nucleic Acids Res. 2021, 49, D605–D612. [Google Scholar]
  61. Goecks, J.; Nekrutenko, A.; Taylor, J.; Galaxy Team. Galaxy: A comprehensive approach for supporting accessible, reproducible, and transparent computational research in the life sciences. Genome Biol. 2010, 11, R86. [Google Scholar]
  62. Chen, C.; Wu, Y.; Xia, R. A painless way to customize Circos plot: From data preparation to visualization using TBtools. Imeta 2022, 1, e35. [Google Scholar] [PubMed]
  63. Li, X.; Zhang, T.; Jiang, L.; Fan, G. Evaluation of Suitable Reference Genes for Quantitative Real-Time PCR in Various Tissues of Apocynum venetum. Genes 2024, 15, 231. [Google Scholar] [CrossRef]
Figure 1. Phylogenetic analysis of MT-70 homologous proteins from Solanum lycopersicum, Capsicum annuum, Solanum tuberosum, Arabidopsis thaliana, Nicotiana tabacum, Anisodus acutangulus, Mandragora chinghaiensis, Datura stramonium, Anisodus tanguticus and Atropa belladonna. The phylogenetic trees were constructed using MEGA 11.0 by the neighbor-joining (NJ) method with 1000 bootstrap replicates. The groups of m6A pathway genes from Przewalskia tangutica are shown in different colors.
Ijms 26 03593 g001
Figure 2. The gene structure and conserved motifs of PtMT genes. (A) Exons and intron phases are shown. (B) The distribution of conserved motifs.
Ijms 26 03593 g002
Figure 3. Chromosomal location and GO enrichment analysis of PtMT genes. (A) Chromosomal distribution. (B) GO enrichment analysis. The color of circles are colored according to the −Log10_Qvalue. The size of the circles is determined by the number of annotated genes.
Ijms 26 03593 g003
Figure 4. The cis-regulatory elements in the promoter of PtMT genes. The cis-regulatory elements were represented as rectangles in different colors.
Ijms 26 03593 g004
Figure 5. Prediction of the three-dimensional domain of PtMT proteins, the structure of the proteins is rainbow-colored, with the N-terminus shaded blue and C-terminus shaded red.
Ijms 26 03593 g005
Figure 6. Collinearity analysis of PtMT gene family members, the red line indicates that there are collinear relationships between PtMT gene family members.
Ijms 26 03593 g006
Figure 7. Expression profiles of PtMT genes under six different tissues.
Ijms 26 03593 g007
Figure 8. qRT-PCR validation of 7 PtMT genes in tissues. Figure (AG) showed the expression level of 7 genes in differential tissues. One-way ANOVA was calculated using IBM SPSS 27 software. The a, b, and c indicated whether the difference was significant. The same letter marked in the same gene among different tissues indicated no significant difference, and different letters indicated significant differences.
Ijms 26 03593 g008
Table 1. Sequences feature of PtMT genes.
GenesLength
(bp)
Length
(aa)
MW
(kDa)
pIInstability
Index
Aliphatic
Index
Grand Average of
Hydropathicity
(GRAVY)
Subcellular Localization Predicted
PtMTA1221773881.836.7242.0578.86−0.461chloroplast
PtMTA2219673180.636.4741.3379.48−0.391chloroplast
PtMTB132851094122.966.1657.5548.39−1.155nucleus
PtMTB232311076120.826.1458.248.84−1.163nucleus
PtMTB331531050117.536.7756.3650.99−1.102nucleus
PtMTC1132043950.137.149.481.3−0.389nucleus
PtMTC286728832.545.1245.7983.26−0.239cytoplasm
Disclaimer/Publisher’s Note: The statements, opinions and data contained in all publications are solely those of the individual author(s) and contributor(s) and not of MDPI and/or the editor(s). MDPI and/or the editor(s) disclaim responsibility for any injury to people or property resulting from any ideas, methods, instructions or products referred to in the content.

