Article

AcMYB176-Regulated AcCHS5 Enhances Salt Tolerance in Areca catechu by Modulating Flavonoid Biosynthesis and Reactive Oxygen Species Scavenging

1
Hainan Key Laboratory for Sustainable Utilization of Tropical Bioresources, School of Tropical Agriculture and Forestry, Hainan University, Haikou 570228, China
2
The Ministry of Education Key Laboratory for Ecology of Tropical Islands, Key Laboratory of Tropical Animal and Plant Ecology of Hainan Province, College of Life Sciences, Hainan Normal University, Haikou 571158, China
*
Author to whom correspondence should be addressed.
Int. J. Mol. Sci. 2025, 26(7), 3216; https://doi.org/10.3390/ijms26073216
Submission received: 10 February 2025 / Revised: 28 March 2025 / Accepted: 28 March 2025 / Published: 30 March 2025

Abstract

High-salinity stress induces severe oxidative damage in plants, leading to growth inhibition through cellular redox imbalance. Chalcone synthase (CHS), a pivotal enzyme in the flavonoid biosynthesis pathway, plays critical roles in plant stress adaptation. However, the molecular mechanisms underlying CHS-mediated salt tolerance remain uncharacterized in Areca catechu L., a tropical crop of high economic and ecological significance. Here, we systematically identified the CHS gene family in A. catechu and revealed tissue-specific and salt-stress-responsive expression patterns, with AcCHS5 exhibiting the most pronounced induction under salinity. Transgenic Arabidopsis overexpressing AcCHS5 displayed enhanced salt tolerance compared to wild-type plants, characterized by elevated activities of antioxidant enzymes: superoxide dismutase (SOD), catalase (CAT), and peroxidase (POD), increased flavonoid accumulation, and reduced reactive oxygen species (ROS) accumulation. Furthermore, we identified the transcription factor AcMYB176 as a direct activator of AcCHS5 through binding to its promoter. Our findings demonstrate that the AcMYB176-AcCHS5 regulatory module enhances salt tolerance by orchestrating flavonoid biosynthesis and ROS scavenging. This study provides functional evidence of CHS-mediated salt adaptation in A. catechu and highlights its potential for improving stress resilience in tropical crops.

1. Introduction

Salt stress is one of the most common abiotic stresses in nature, and soil salinization can constrain plant growth and development. When the soil salt concentration is too high, the water potential outside plant cells decreases, impairing the root system’s ability to absorb water normally [1]. Additionally, excessive sodium (Na+) and chloride (Cl) ions enter the cells, interfering with the plant’s absorption of essential nutrients such as potassium (K+) and calcium (Ca2+), leading to ionic toxicity [2]. Salt stress can further induce oxidative stress, resulting in the accumulation of reactive oxygen species (ROS), which affects plant metabolism and biochemical reactions [2]. To cope with salt stress, plants have evolved various adaptive mechanisms, such as using ion transport proteins to exclude excessive sodium ions or compartmentalize them in vacuoles [3]. Additionally, plants activate antioxidant enzyme systems, including superoxide dismutase (SOD), peroxidase (POD), and catalase (CAT), and synthesize osmoprotectants and antioxidants like proline (Pro), glycinebetaine, and flavonoid compounds [4]. These mechanisms help to scavenge reactive ROS generated by salt stress, reduce cellular damage, and enhance plant tolerance to salinity.
Chalcone synthase (CHS), a pivotal rate-limiting enzyme in the flavonoid biosynthesis pathway, governs the formation of chalcone—the foundational carbon skeleton for diverse flavonoid derivatives. In the phenylpropanoid pathway, CHS catalyzes the condensation of p-coumaroyl-CoA and malonyl-CoA to generate naringenin chalcone, which serves as the precursor for subsequent enzymatic modifications. Downstream metabolic reactions convert chalcone into flavanols, flavonols, anthocyanins, and other specialized metabolites through hydroxylation, glycosylation, and isomerization processes [5]. Beyond its biosynthetic role, CHS-mediated flavonoid production is integral to plant stress adaptation. These compounds function as antioxidants to neutralize reactive ROS under abiotic (e.g., salinity [6], drought [7], and chilling stress [8]) and biotic challenges (e.g., UV exposure and pathogen invasion [9]). Emerging evidence highlights CHS as a molecular determinant of stress resilience. For instance, transgenic tobacco overexpressing NtCHS1 exhibits elevated rutin accumulation under salt stress, which correlates with enhanced ROS scavenging capacity, reduced hydrogen peroxide (H2O2) and superoxide anion (O2·) levels, and improved survival rates [10]. Similarly, drought-stressed CpCHS1-overexpressing tobacco (derived from Prunus avium L.) demonstrates superior biomass retention, concomitant with upregulated antioxidant enzymes and Pro biosynthesis [11]. These findings underscore the dual role of CHS in fortifying redox homeostasis and osmotic adjustment during stress adaptation.
MYB transcription factors, a class of ubiquitously present regulatory proteins in plants, have been demonstrated to modulate flavonoid metabolism primarily by interacting with structural genes in the flavonoid biosynthetic pathway [12]. These structural genes typically encode key enzymes involved in flavonoid biosynthesis, including CHS, flavanone 3-hydroxylase (F3H), and flavonol synthase (FLS). Through this regulatory network, MYB transcription factors coordinate diverse secondary metabolic processes, thereby exerting precise control over the flavonol branch pathway [13]. Subsequent studies have cloned MYB genes in diverse plant species including arabidopsis (Arabidopsis thaliana L.) [14], potato (Solanum tuberosum L.) [15], nectarine (Prunus persica (L.) Batsch) [16], and ginkgo (Ginkgo biloba L.) [17], with functional characterization demonstrating their regulatory roles in the biosynthesis of flavonoids and other secondary metabolites. In soybean (Glycine max (L.) Merr.), GmMYB12B2 demonstrates the capacity to significantly upregulate multiple key enzyme-encoding genes within the flavonoid biosynthetic pathway, consequently enhancing flavonoid biosynthesis [18].
Areca catechu L., a tree-like tropical plant of the family Arecaceae and genus Areca, is globally recognized as one of the quintessential tropical cash crops. Originating from Malaysia, it is primarily cultivated in regions such as Hainan, Guangxi, Guangdong, Yunnan, and Taiwan in China [19]. Furthermore, areca, a masticatory commodity in China and one of the nation’s “Four Great Southern Medicinal Herbs”, contains diverse bioactive constituents including lipids (9.15%), alkaloids (5%), tannins (15%), and other phytochemicals, endowing it with significant industrial utility [20]. The phytochemical profiling of betel nuts has revealed a spectrum of compounds, predominantly alkaloids, flavonoids, tannins, triterpenoids, and fatty acids [21]. Salt stress significantly impairs the growth and development of A. catechu [22]. However, the regulatory mechanisms of CHS genes in the flavonoid metabolic pathway and their role in the salt tolerance of A. catechu remain elusive. Therefore, elucidating the molecular mechanisms underlying A. catechu’s response to high-salinity stress holds crucial significance for cultivating salt-tolerant A. catechu varieties. This study investigates the CHS gene family in A. catechu, functional characterization of CHS genes, and their upstream regulatory networks, aiming to decipher CHS-mediated flavonoid biosynthesis and salt stress resistance mechanisms.

2. Results

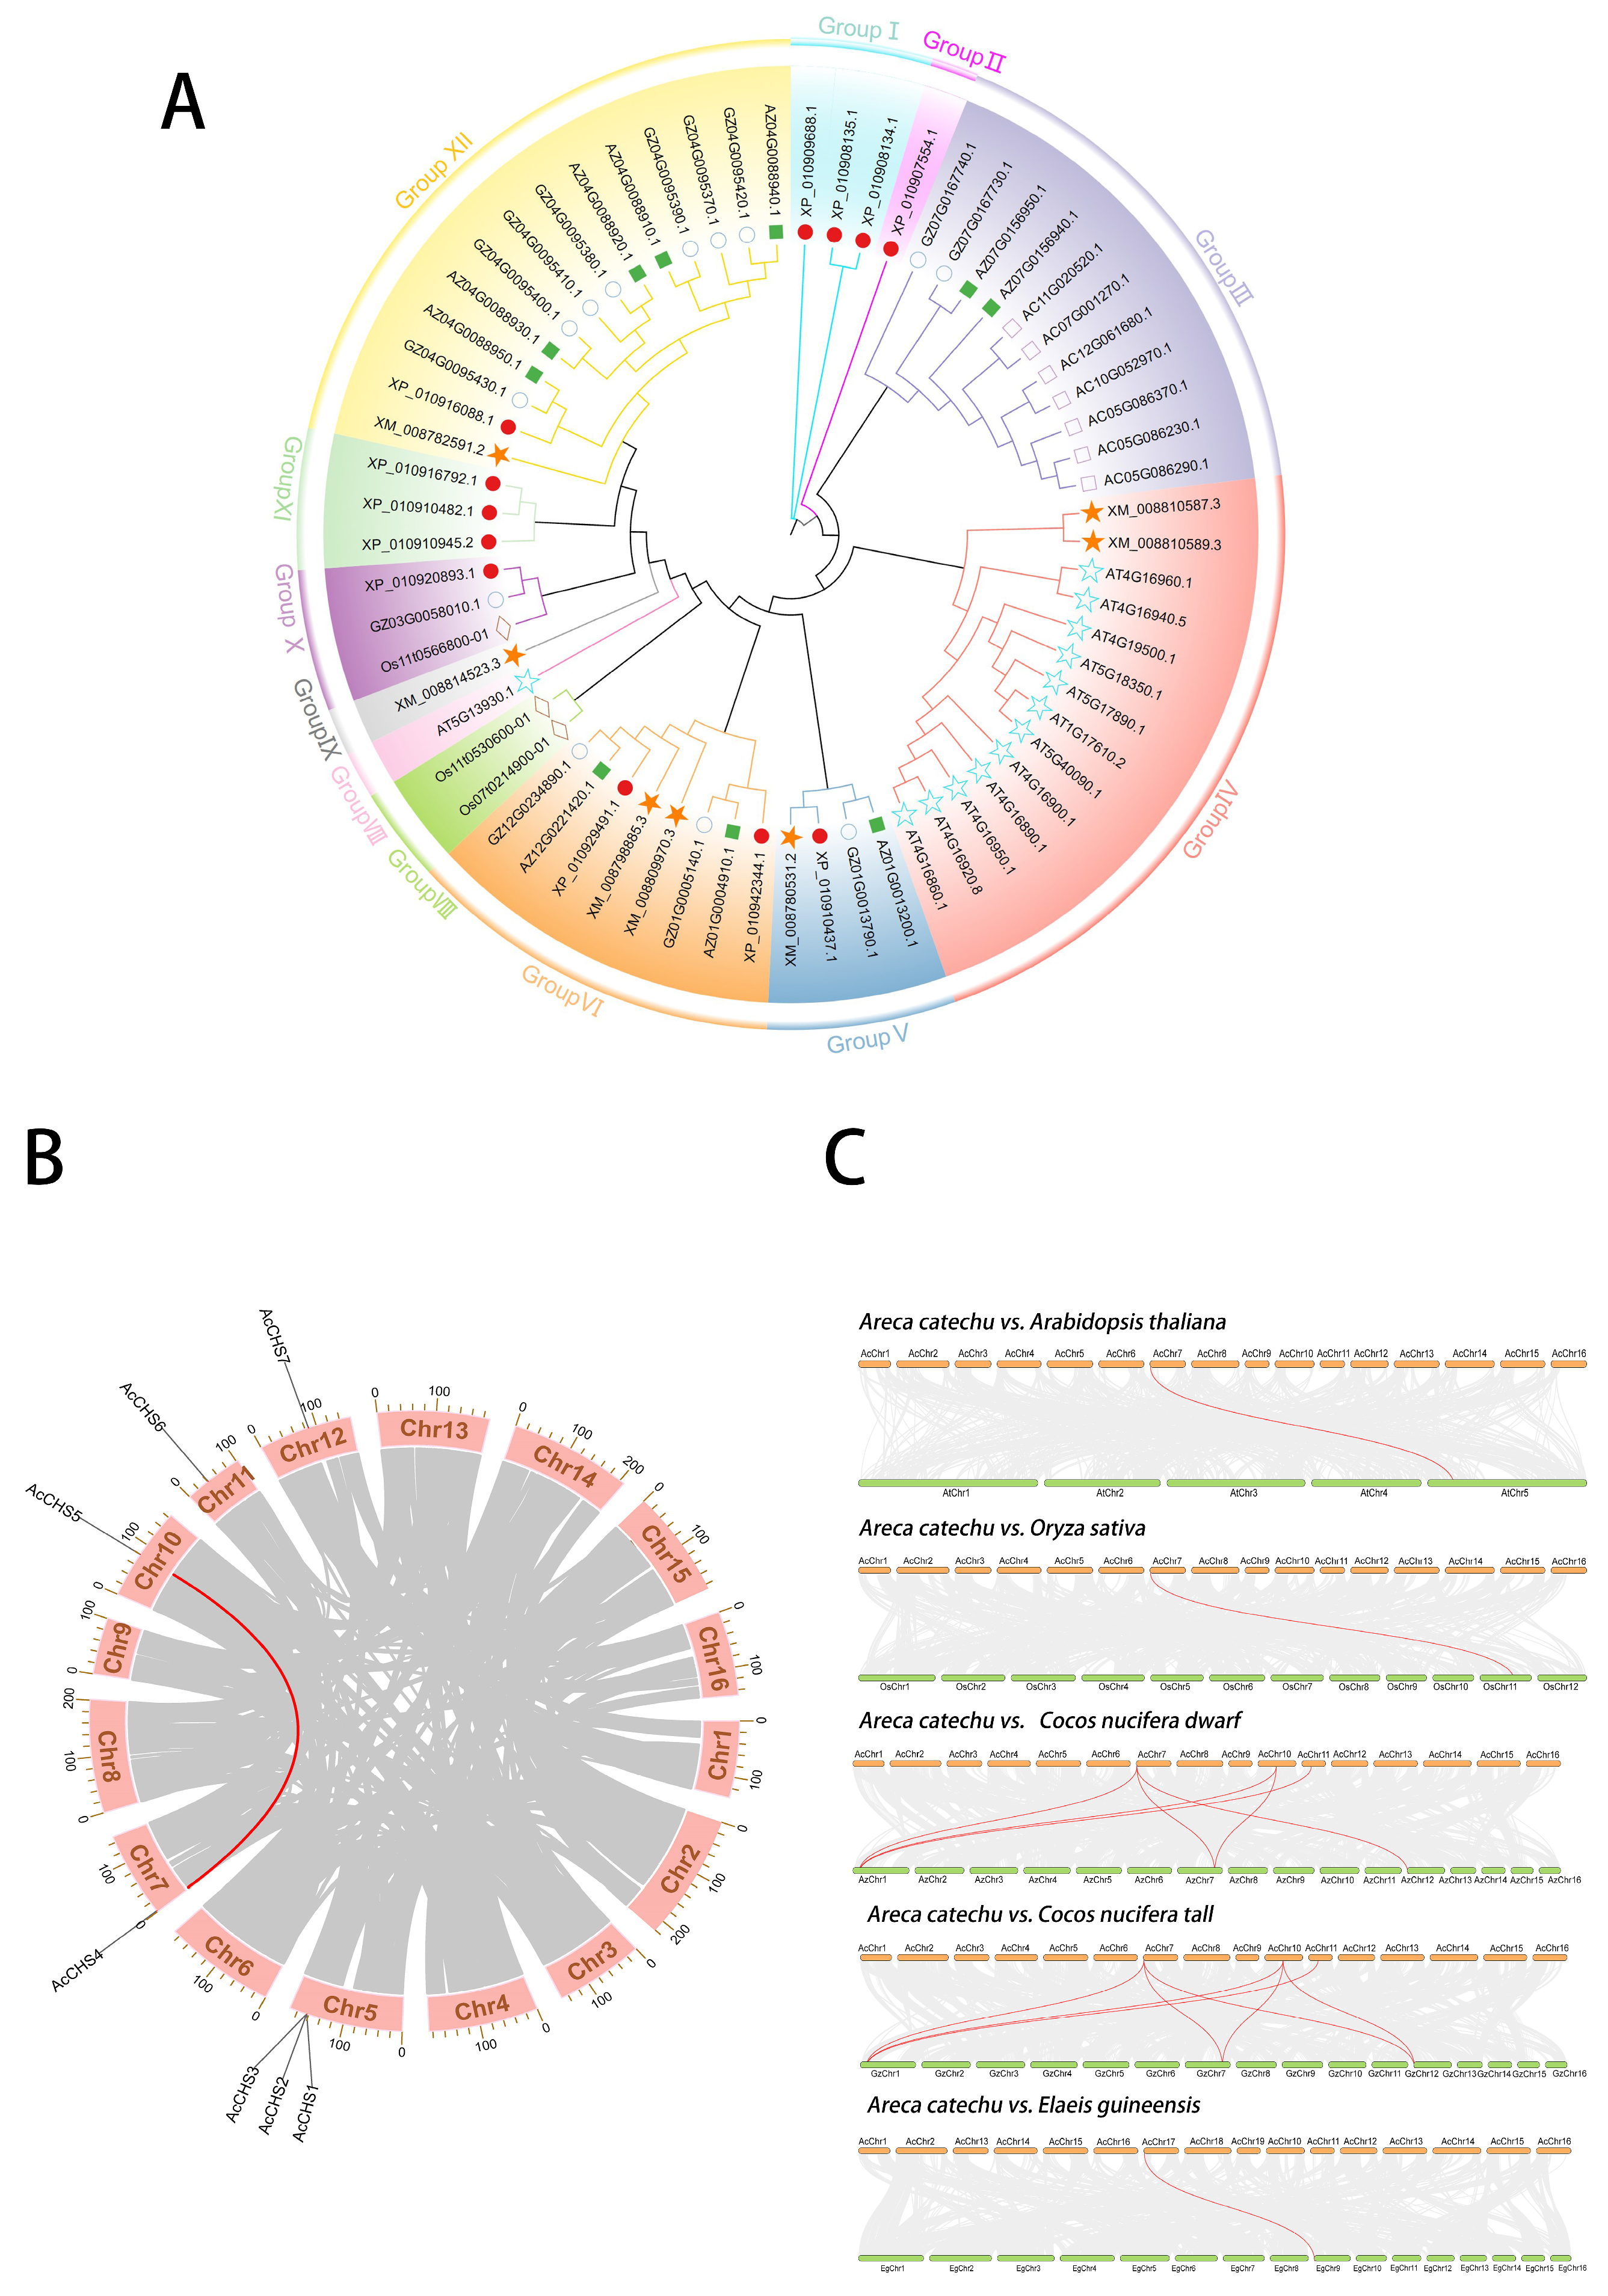
2.1. Phylogenetic Analysis of CHS Family

To investigate the evolutionary relationships between the CHS family genes of A. catechu and other plant species, a phylogenetic tree was constructed using the neighbor-joining (NJ) method in MEGA-X software. The analysis included seven species, A. catechu, rice (Oryza sativa L.), Arabidopsis (Arabidopsis thaliana L.), tall coconut (Cocos nucifera tall L.), dwarf coconut (Cocos nucifera dwarf L.), date palm (Phoenix dactylifera L.), and oil palm (Elaeis guineensis Jacq.), with 66 gene sequences (Table S1). The phylogenetic tree was divided into 12 distinct clades. The CHS genes of A. catechu exhibited close clustering with those of C. nucifera dwarf and C. nucifera tall, likely due to their shared taxonomic classification within the Arecaceae family, conserved structural features, and high sequence homology (Figure 1A).

2.2. Chromosomal Localization and Intra- and Interspecific Collinearity Analyses of A. catechu CHS Family

To determine the chromosomal distribution of CHS family genes in A. catechu, we mapped their genomic loci across all 16 chromosomes using TBtools (version 2.1025). Chromosomal assignments revealed the following patterns: AcCHS1, AcCHS2, and AcCHS3 clustered on chromosome 5, while AcCHS4, AcCHS5, AcCHS6, and AcCHS7 were distributed on chromosomes 7, 10, 11, and 12, respectively (Figure 1B). An evolutionary trajectory analysis identified a single intragenomic collinear gene pair (AcCHS5-AcCHS4) within the AcCHS family. Interspecific synteny analyses with representative species (A. thaliana, O. sativa) and Arecaceae members including (E. guineensis, C. nucifera dwarf, and C. nucifera tall) demonstrated distinct evolutionary conservation patterns. The highest collinearity was observed between A. catechu and C. nucifera tall (seven collinear pairs), followed by C. nucifera dwarf (six pairs). Single collinear pairs were detected between A. catechu and A. thaliana, O. sativa, or E. guineensis (Figure 1C). A Ka/Ks ratio analysis of all collinear gene pairs across species consistently yielded values <1 (Table 1), indicating the CHS gene was predominantly under purifying selection.

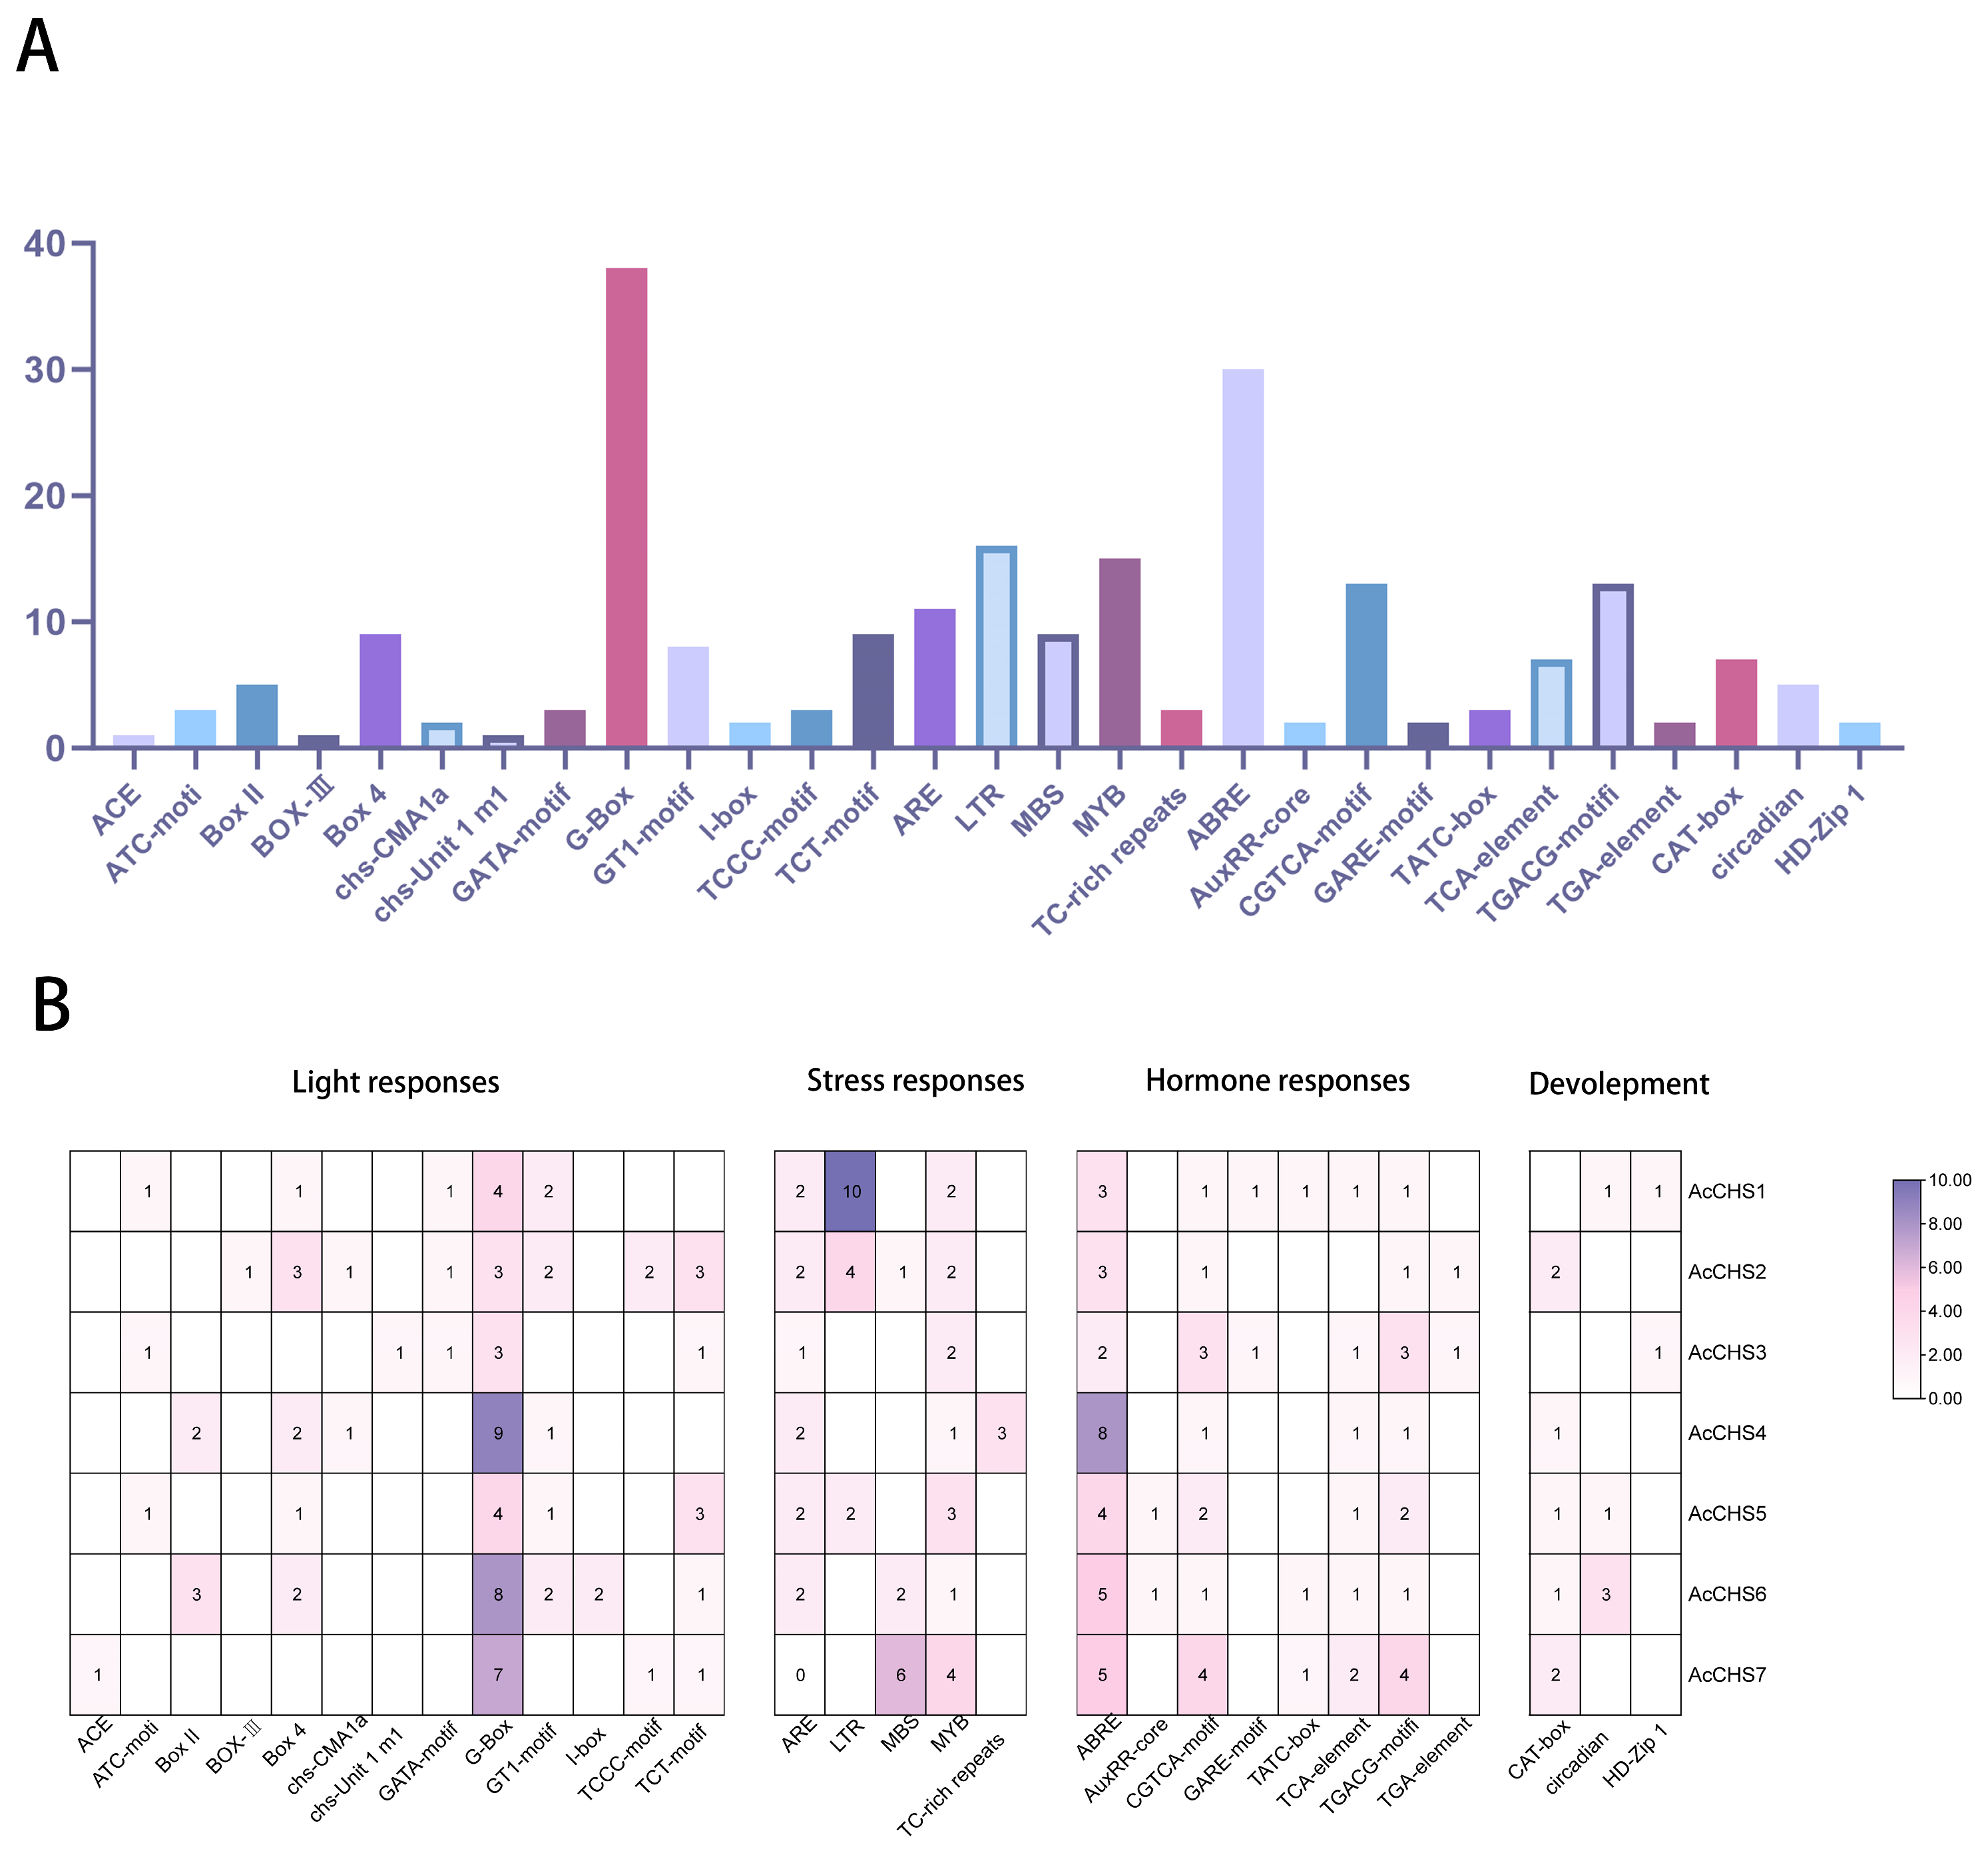
2.3. Cis-Acting Element Analysis of Areca CHS Family Members

A comprehensive analysis of cis-acting elements in the promoter regions of A. catechu CHS genes identified 225 functional motifs classified into four categories. Light-responsive elements formed the largest proportion (85 elements, 38%), comprising 13 photoperiod-regulated subtypes. Hormone-responsive elements (72 elements, 32%) included GA-box (gibberellin), AuxRR-core (auxin), and ABRE (abscisic acid) motifs. Stress-related elements (54 elements, 24%) contained drought-responsive MYB sites, hypoxia-activated ARE, and low-temperature-inducible LTR elements. Developmental regulators (14 elements, 6%), predominantly circadian rhythm-associated GATA-box motifs, constituted the smallest group (Figure 2A,B). These findings indicate that the transcriptional regulation of AcCHS genes integrates light perception, hormonal cues, stress adaptation, and developmental timing, elucidating their functional diversification in A. catechu.

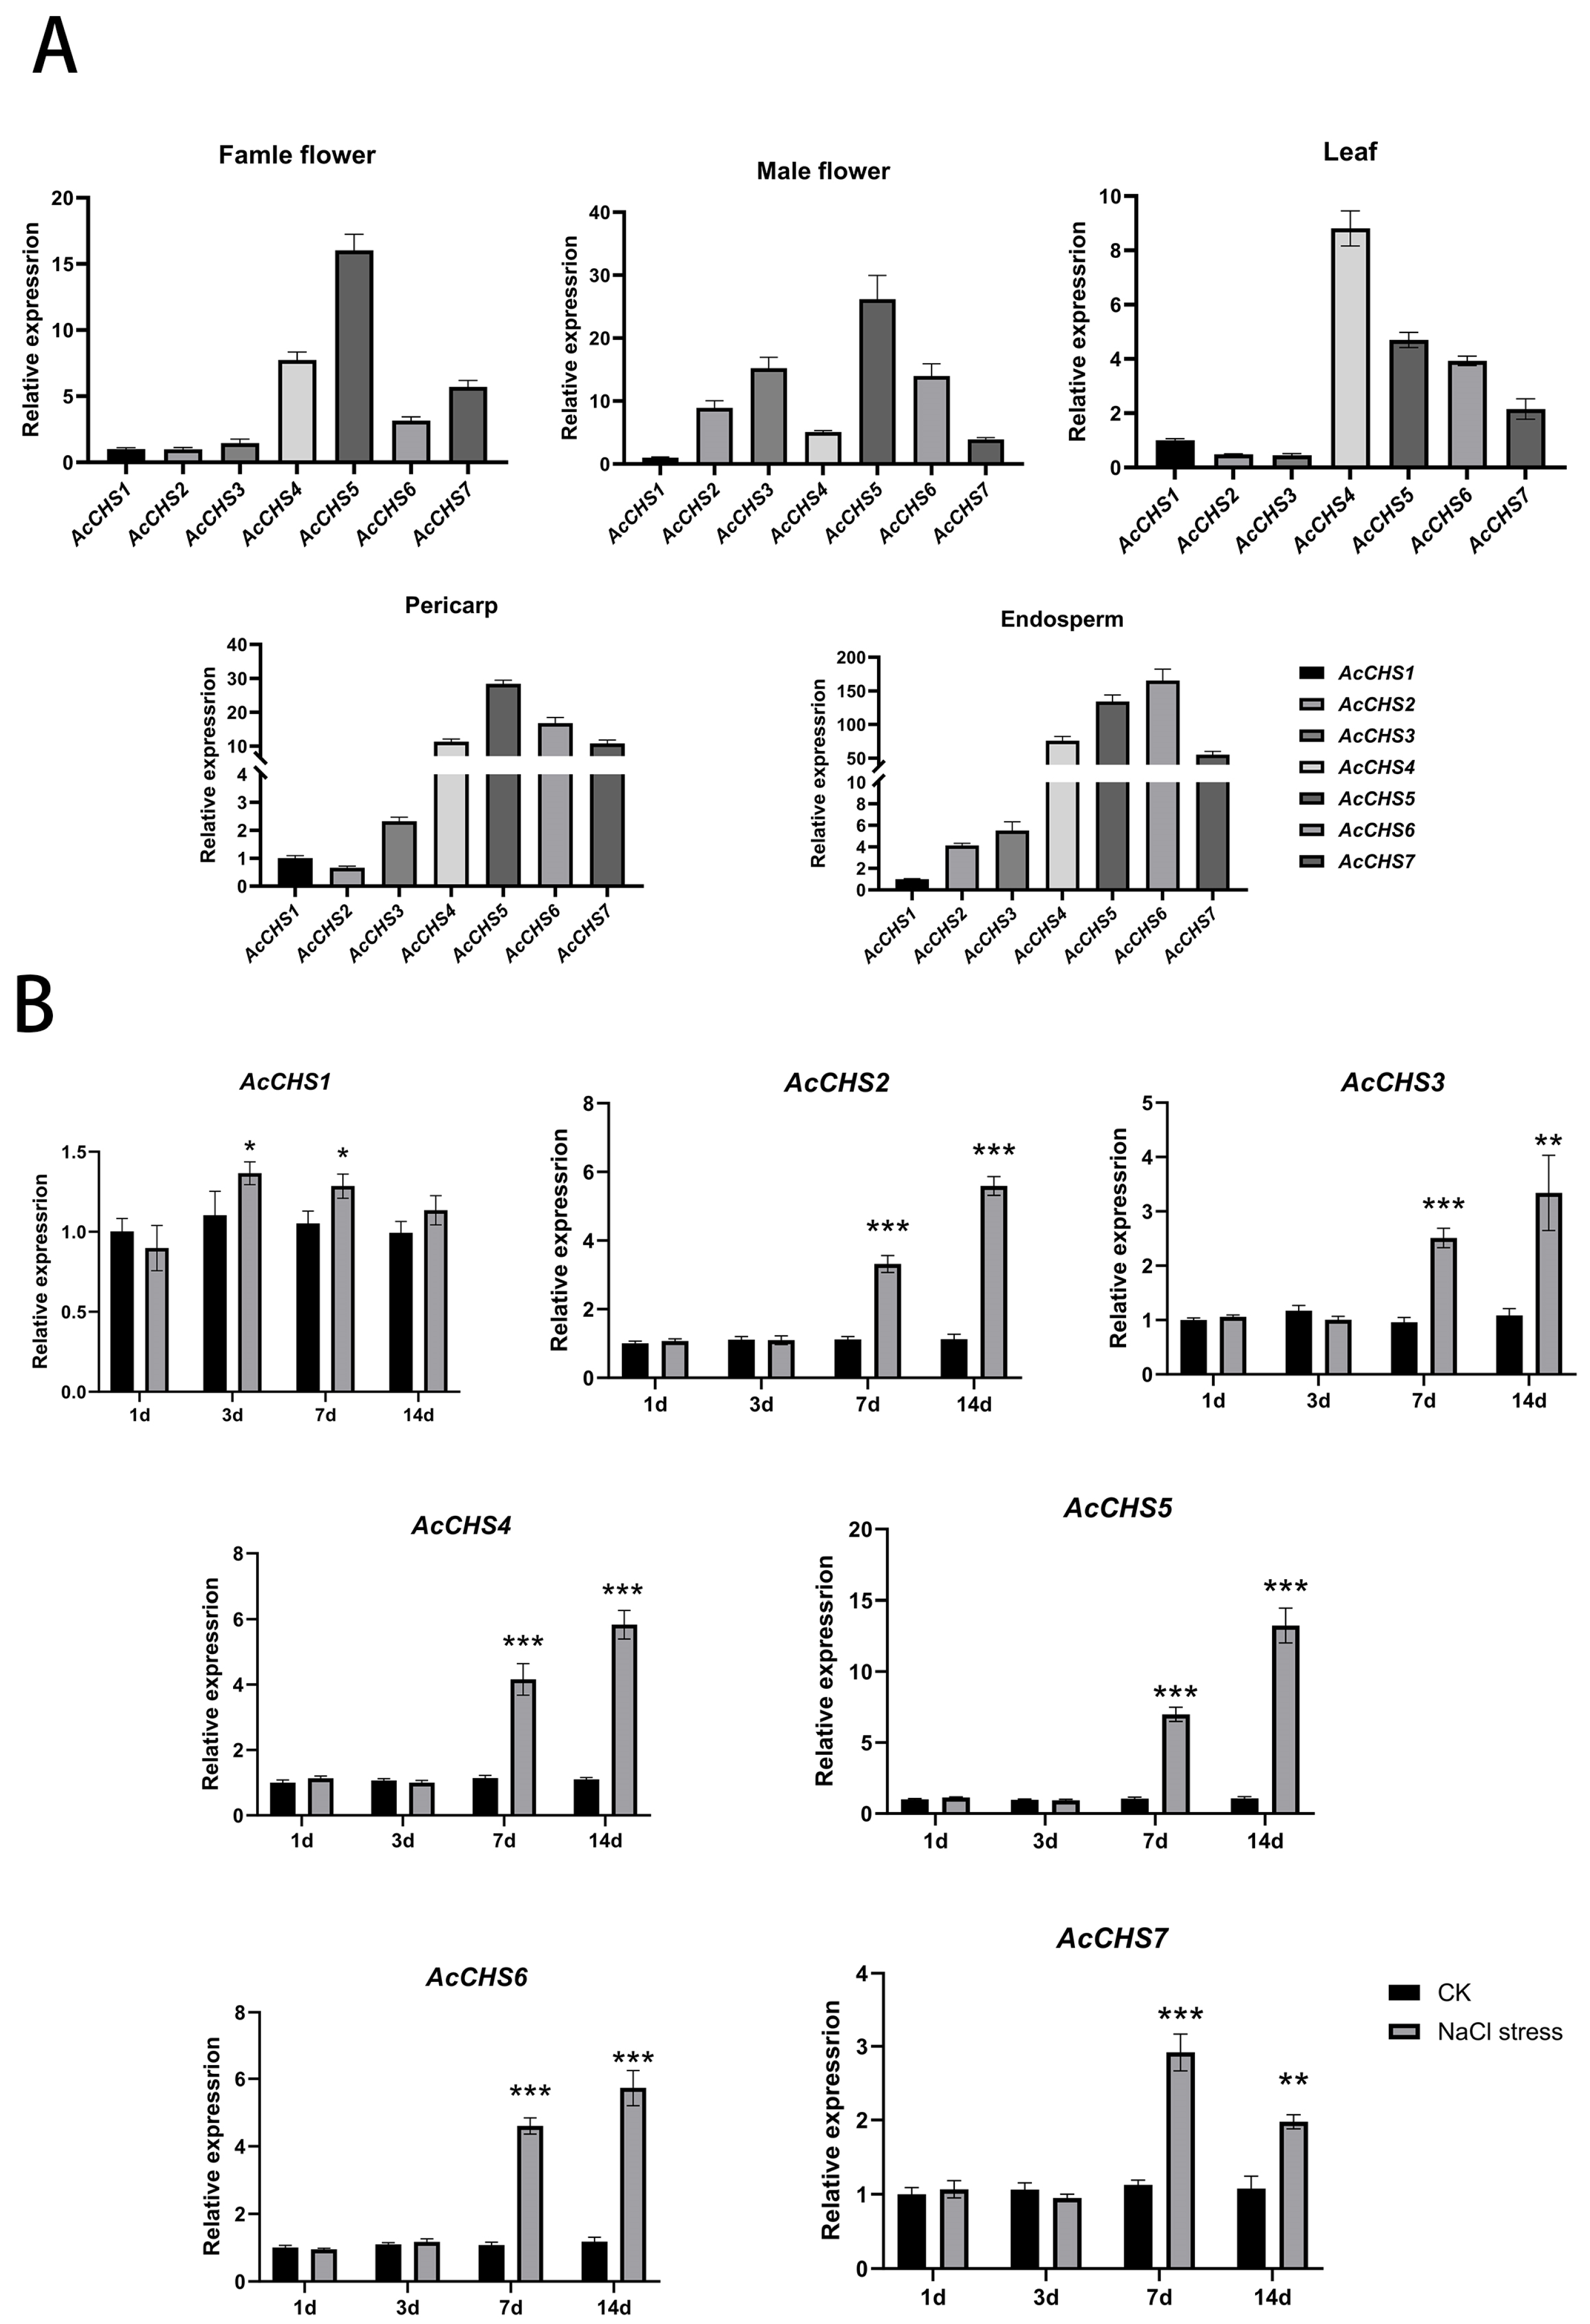
2.4. Expression Profiling of A. catechu CHS Genes

To delineate the tissue-specific expression patterns of CHS genes in A. catechu, we performed a quantitative real-time PCR (qRT-PCR) analysis of five tissues: leaf, female flower, male flower, pericarp, and endosperm (Figure 3A). A striking expression hierarchy was observed among AcCHS paralogs. AcCHS5 dominated in reproductive and fruit tissues, displaying 16.0-, 26.2-, and 28.4-fold higher expression levels than AcCHS1 in female flowers, male flowers, and pericarp, respectively. AcCHS4 showed leaf-specific predominance with an 8.8-fold increase relative to AcCHS1. Notably, AcCHS6 exhibited high expression in endosperm tissue, exceeding AcCHS1 expression 165.3-fold, while AcCHS5 ranked second in this tissue (134.0-fold). In contrast, AcCHS1, AcCHS2, and AcCHS3 maintained constitutively low expression levels across all tissues. These results demonstrate the functional diversification of AcCHS genes in organ-specific development and metabolic specialization in A. catechu.

2.5. Expression Patterns Under Salt Stress

To investigate the expression patterns of CHS genes under high salinity levels, we quantified the transcriptional levels of AcCHS1-7 in A. catechu leaves using qRT-PCR (Figure 3B). The temporal analysis revealed divergent expression profiles: AcCHS1 showed no significant changes throughout the salt treatment, while other genes exhibited progressive upregulation. AcCHS2 expression increased 3.0 fold compared to the control on Day 7 and peaked at 5.0 fold on Day 14. Similarly, AcCHS3 rose from 2.0 fold to 2.8 fold, and AcCHS4 escalated from 3.6 fold to 5.2 fold during the same period. AcCHS5 demonstrated the most pronounced induction, surging from 6.6 fold on Day 7 to 12.3 fold on Day 14—the highest magnitude among all the homologs. AcCHS6 exhibited moderate upregulation (4.2 fold to 4.8 fold). In contrast, AcCHS7 reached its maximum expression (2.5 fold) on Day 7 but declined to 1.8 fold by Day 14. The exceptional salt-responsive activation of AcCHS5, characterized by its sustained and dominant expression, warranted its selection for subsequent functional studies.

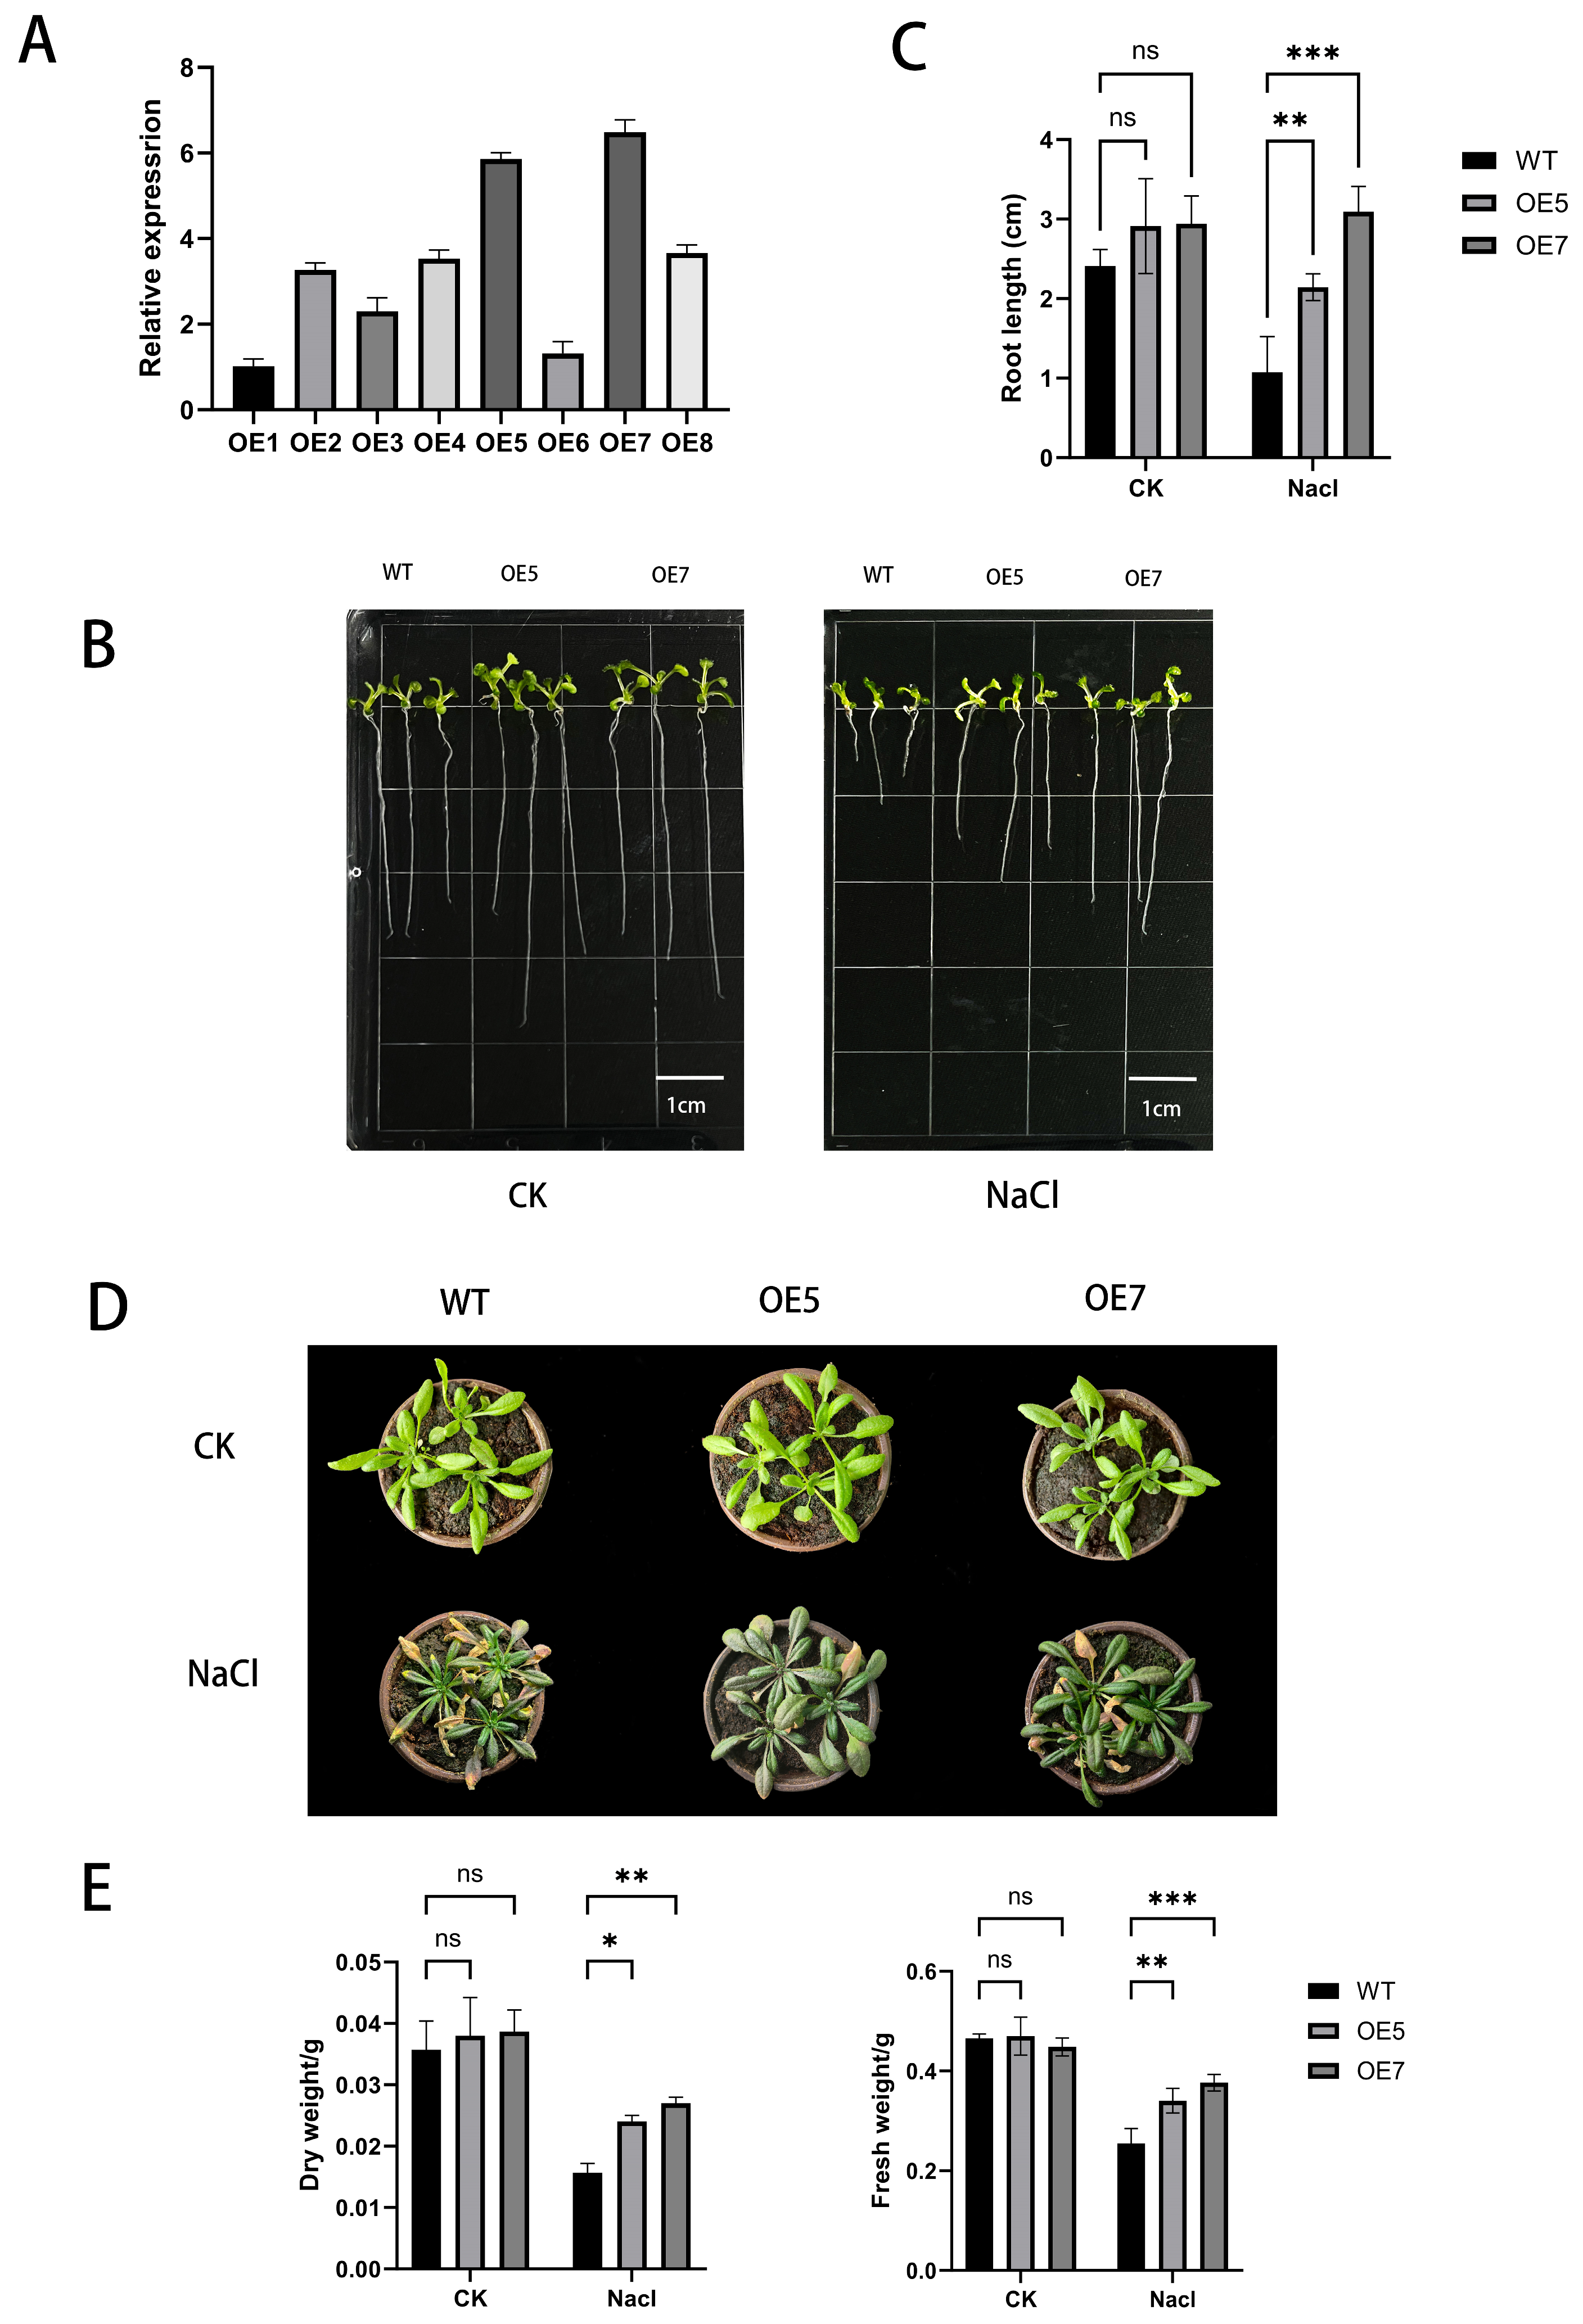
2.6. Identification of Transgenic A. thaliana

Through Agrobacterium tumefaciens-mediated floral dip transformation, we generated eight independent AcCHS5-overexpressing (OE) transgenic lines in A. thaliana. Three randomly selected T3-generation single-copy homozygous lines per construct were subjected to transcript-level validation. The total RNA extracted from leaves was reverse-transcribed into cDNA for qRT-PCR analysis. Lines OE5 and OE7 exhibited the highest AcCHS5 expression levels and were therefore selected for subsequent phenotypic and molecular analyses (Figure 4A).

2.7. Phenotypic Evaluation of A. thaliana Under Salt Stress

To assess the salt tolerance conferred by AcCHS5, wild-type (WT) and AcCHS5-OE-line A. thaliana seedlings were subjected to hydroponic culture in standard ½ strength Murashige and Skoog (MS) medium or ½ MS medium containing 200 mmol L1 NaCl. Under control conditions, the root lengths of the WT and OE lines showed no significant differences. Strikingly, under 200 mmol L1 NaCl stress, the AcCHS5-OE lines exhibited a significantly longer primary root length compared to the WT plants (Figure 4B,C). Soil-based salt stress assays revealed distinct morphological responses between the genotypes. While both lines showed similar growth phenotypes under non-stress conditions, the NaCl treatment (200 mmol L1) induced characteristic stress symptoms, including leaf chlorosis, necrosis, and curling, in all plants. However, the WT plants showed exacerbated wilting and chlorosis relative to the AcCHS5-OE lines (Figure 4D). Biomass quantification demonstrated that the AcCHS5-OE lines maintained a significantly higher fresh weight and dry weight relative to the WT lines under salt stress (Figure 4E). Collectively, these data demonstrate that AcCHS5 overexpression enhances salt tolerance in Arabidopsis.

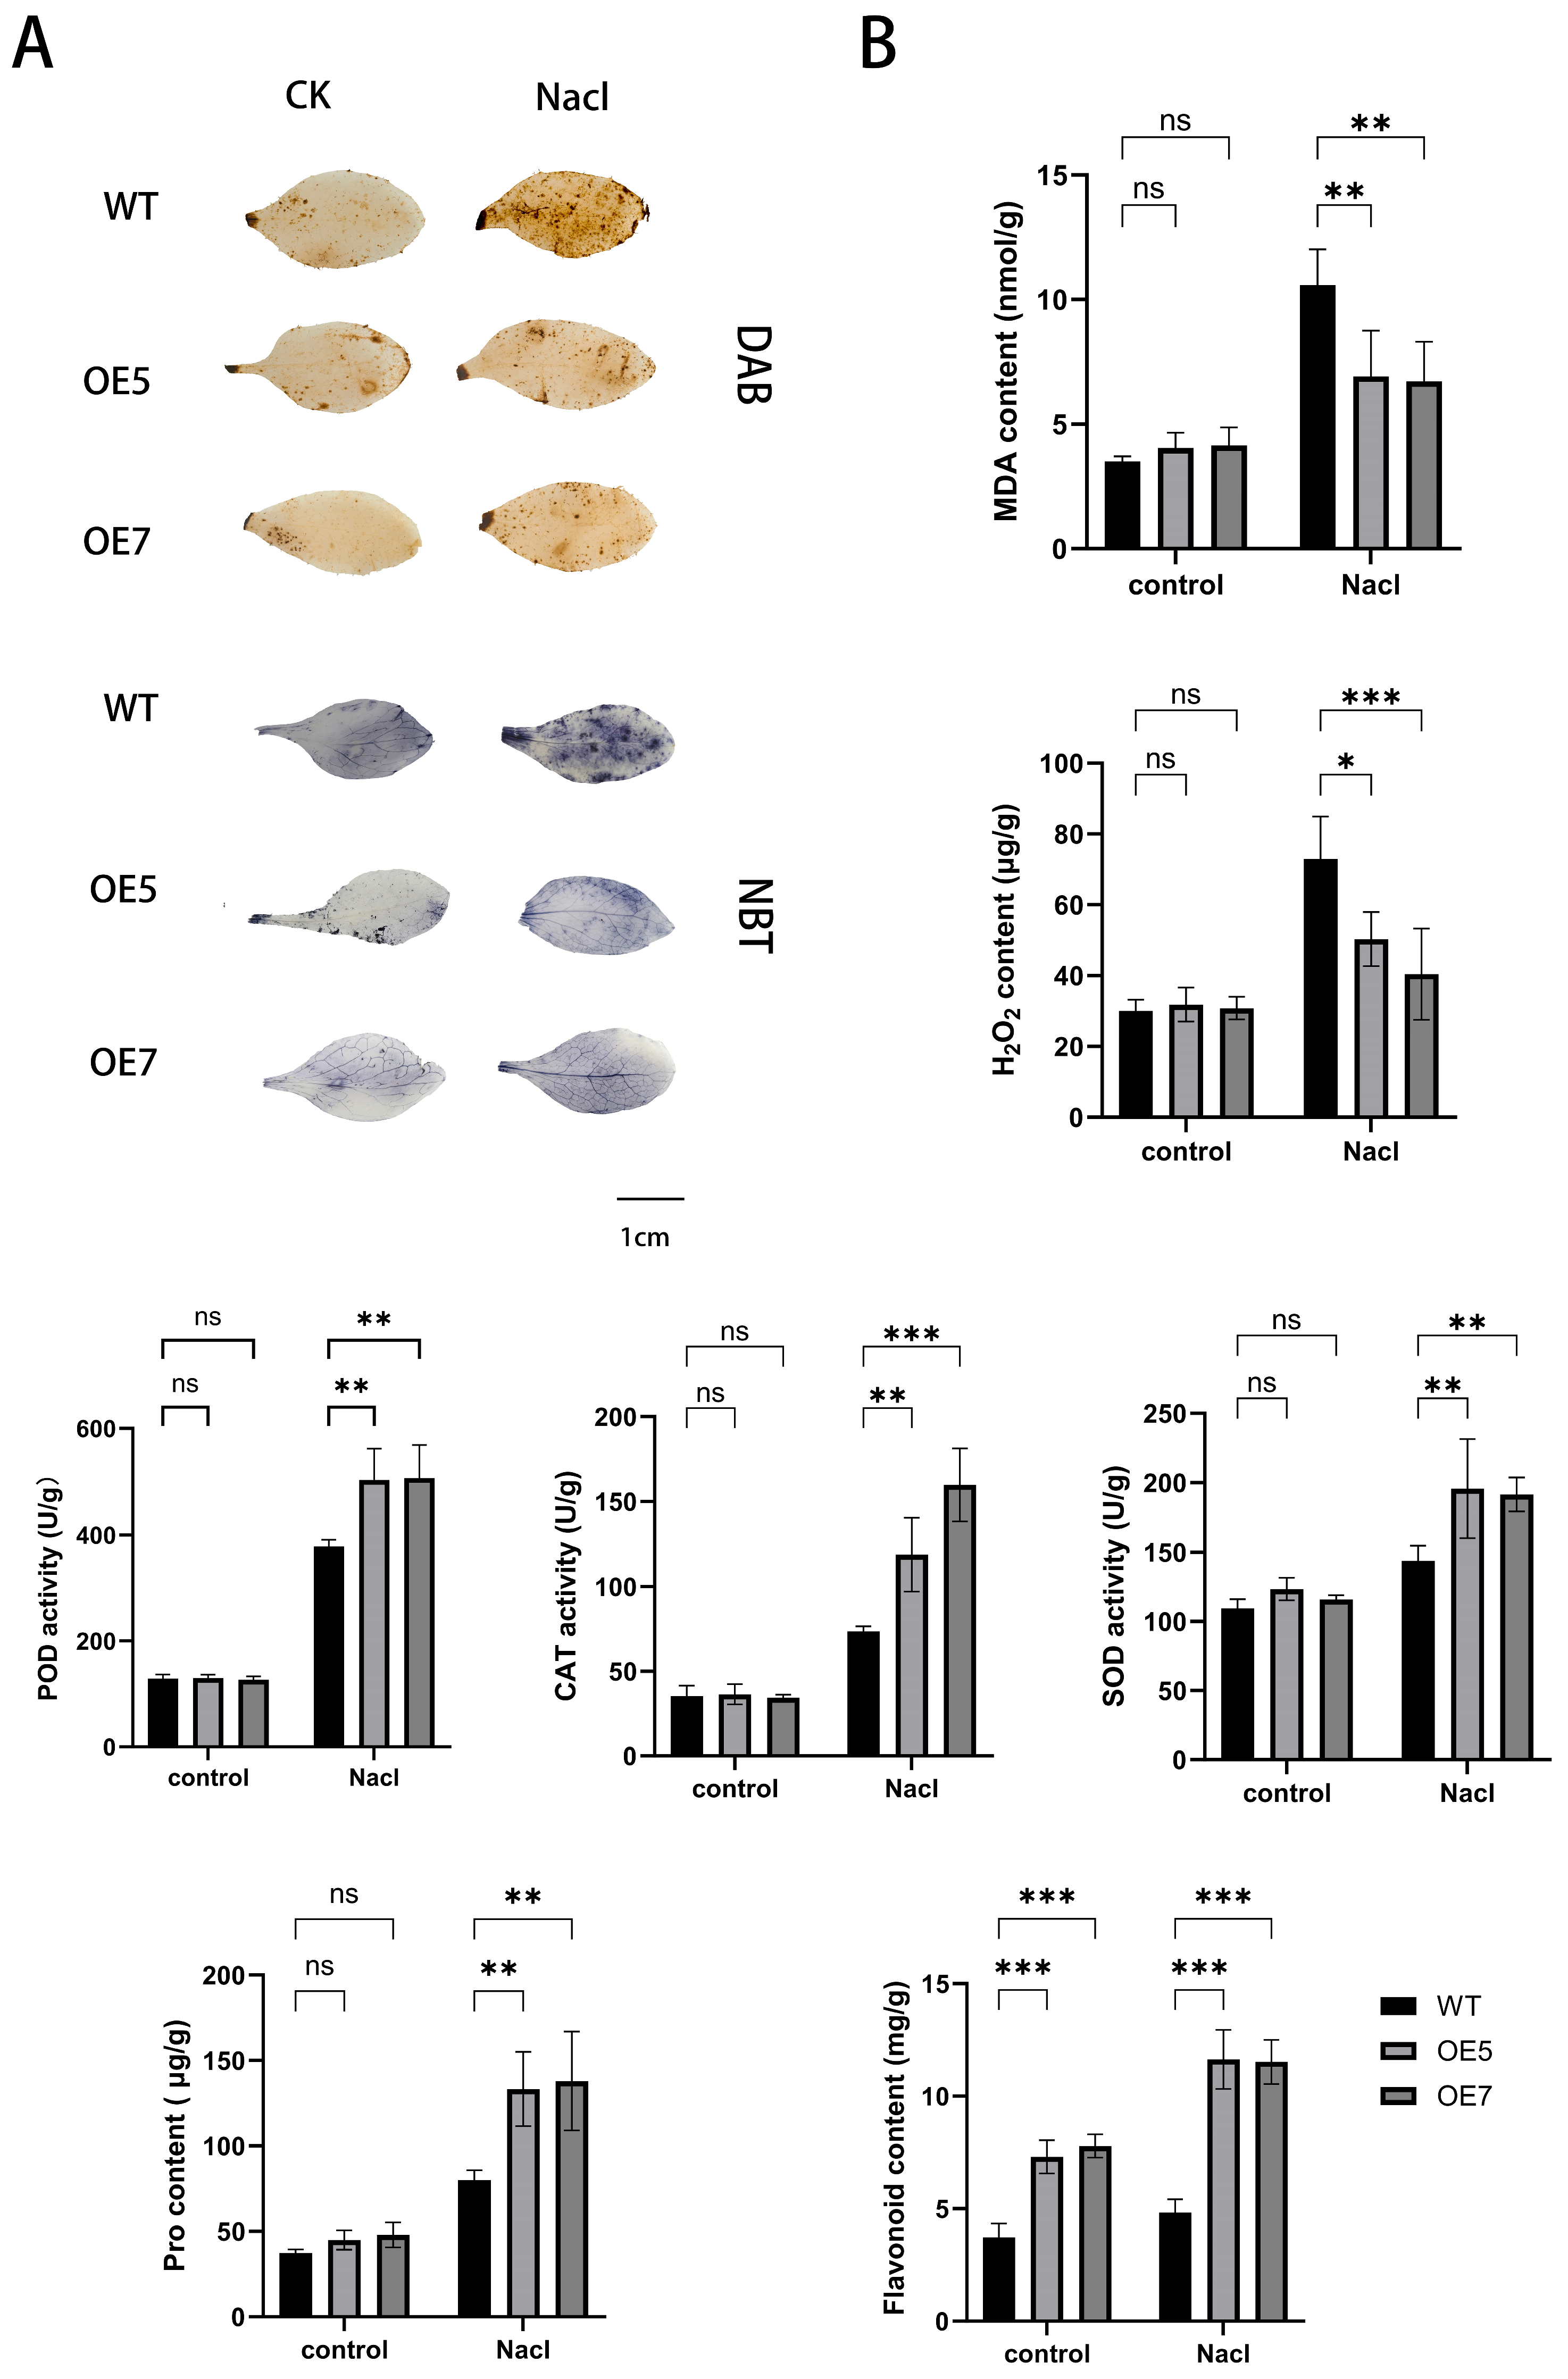
2.8. Detection of Stress-Resistant Physiological Indicators in A. thaliana Under Various Stress Treatments

Salt stress typically induces severe oxidative damage in plants, subsequently triggering a secondary stress-oxidative stress cascade. Under stress conditions, plants accumulate elevated levels of H2O2 and O2·, which can destabilize lipids, proteins, and nucleic acids, thereby disrupting normal cellular metabolism [23]. Following salt stress treatment, DAB(3,3′-Diaminobenzidine) and NBT (Nitroblue tetrazolium) staining of A. thaliana leaves from different transgenic lines revealed no significant chromatic differences between the wild-type (WT) and AcCHS5-OE lines under normal cultivation conditions. However, under salt stress, the AcCHS5-OE lines exhibited attenuated blue (NBT) and brown (DAB) staining intensities compared to the WT lines, indicating the reduced accumulation of H2O2 and O2· in leaves (Figure 5A).
Physiological parameters including flavonoid content, H2O2 content, Pro content, MDA content, and antioxidant enzyme activities (SOD, CAT, and POD) were quantified in both the WT and AcCHS5-OE lines under salt-stressed and control conditions. Under control conditions, the AcCHS5-OE lines exhibited a significantly higher flavonoid content compared to the WT lines. This differential was amplified under salt stress, with the AcCHS5-OE lines maintaining substantially elevated flavonoid levels relative to the WT lines. Upon the high-salinity challenge, both malondialdehyde (MDA) content and H2O2 content showed significant reductions, while antioxidant enzyme activities (SOD, CAT, and POD) and Pro accumulation demonstrated marked increases in the AcCHS5-OE lines compared to the WT lines (Figure 5B).

2.9. Correlation Analysis of MYB Transcription Factors and Flavonoid Biosynthesis Genes in A. catechu

Building upon our previous identification of the AcMYB gene family in A. catechu [24], this study investigated the regulatory roles of AcMYB transcription factors in flavonoid biosynthesis. Utilizing transcriptomic datasets and Pearson correlation coefficients (PCCs), we conducted a systematic correlation analysis between the AcMYB genes and flavonoid pathway genes. The top 100 positively/negatively correlated gene pairs were identified, with three MYB regulators (AcMYB176, AcMYB44, and AcMYB3) showing exceptionally strong positive correlations with AcCHS5 (AcMYB176-AcCHS5, PCC = 0.997; AcMYB3-AcCHS5, PCC = 0.986; and AcMYB44-AcCHS5, PCC = 0.975) (Figure 6A, Table S2). Subsequent studies will focus on the functional validation of these candidate regulators.

2.10. Yeast One-Hybrid Assay Validation

All yeast transformants grew successfully on SD/-Leu medium, validating the efficient transformation of the pGADT7 plasmid into bait yeast strains. When subjected to selective pressure on SD/-Leu medium supplemented with 500 ng/mL Aureobasidin A (AbA), the positive control (p53-pGADT7, a validated interaction pair) and the AcMYB176-pGADT7 construct exhibited sustained proliferation, whereas the negative control (empty pGADT7) failed to grow (Figure 6B). This stringent interaction assay confirmed the specific binding affinity between AcMYB176 and the AcCHS5 promoter (proAcCHS5).

2.11. Dual-Luciferase Assay Results Analysis

To investigate the transcriptional regulatory role of AcMYB176 on the AcCHS5 promoter, we employed an Agrobacterium GV3101-mediated transient expression system for genetic transformation. Recombinant constructs were introduced into the abaxial epidermis of Nicotiana benthamiana leaves through infiltration. Subsequent dual-luciferase reporter assays conducted 48 h post-transformation revealed distinct transcriptional activation patterns, quantified through the ratio of firefly luciferase (LUC) to Renilla luciferase (REN) enzymatic activities. The proAcCHS5 promoter was used to drive the LUC gene as the reporter, while AcMYB176 was cloned into the pGreenII 62-SK vector as the effector (Figure 6C). The result demonstrated a statistically significant 2.02-fold elevation (p < 0.01) in the LUC/REN activity ratio in the AcMYB176-expressing tissues relative to the empty vector control (Figure 6D). This evidence substantiates the specific binding capacity of transcription factor AcMYB176 to proAcCHS5 and its functional role in enhancing promoter-driven transcriptional activation.

3. Discussion

In this study, we conducted a genome-wide identification of the CHS gene family in A. catechu through a bioinformatics analysis and performed a functional characterization of AcCHS5. The MYB transcription factor AcMYB176 was demonstrated to act as a positive regulator by binding to the promoter region of AcCHS5, thereby promoting flavonoid biosynthesis and enhancing salt tolerance in A. catechu. These findings provide molecular insights into the regulatory network underlying salt stress adaptation in A. catechu, offering valuable references for the molecular breeding of stress-resistant cultivars. The results hold significant implications for developing innovative cultivation models for crops in tropical coastal saline-alkali lands and advancing ecological resource utilization.
This study identified seven CHS genes in A. catechu (Table S1), contrasting with reported counts in other species: four in cucumber (Cucumis sativus L.) [25], seven in eggplant (Solanum melongena L.) [26], and fourteen in common bean (Phaseolus vulgaris L.) [27], highlighting interspecific variation in the CHS family expansion. A phylogenetic reconstruction revealed the closest evolutionary relationships were between A. catechu and those of C. nucifera tall and C. nucifera dwarf, suggesting functional conservation between these palm species (Figure 1A). Comparative genomic analyses further demonstrated stronger syntenic conservation between A. catechu and C. nucifera dwarf and C. nucifera tall, than with A. thaliana, O. sativa, or E. guineensis, supporting their shared ancestry within the Arecaceae family (Figure 1C). The Ka/Ks ratio, a statistical metric quantifying evolutionary rates in gene sequences, was employed to assess selective pressures by comparing the frequency of nonsynonymous substitutions (Ka) to synonymous substitutions (Ks) [28]. To elucidate evolutionary selection patterns, we calculated nonsynonymous/synonymous substitution ratios (Ka/Ks) for syntenic CHS gene pairs. All analyzed pairs exhibited Ka/Ks < 1, indicative of pervasive purifying selection. This evolutionary constraint likely preserves the structural and functional integrity of CHS genes by eliminating deleterious nonsynonymous mutations during speciation (Table 1).
Cis-regulatory elements serve as key determinants in transcriptional control. Specific binding sites within promoter regions, particularly their interactions with transcription factors, critically determine the precision of transcriptional control [29]. Characterizing cis-regulatory elements within the AcCHS gene family revealed that their upstream promoter regions harbor multiple stress-responsive cis-regulatory motifs, including light-responsive elements (e.g., G-box), stress-responsive elements (e.g., MYB), hormone-responsive elements (e.g., AREB), and plant development elements (e.g., CAT-box) (Figure 2A,B). Similarly, previous studies have identified critical cis-acting elements in the CHS gene promoter regions, including AREB (ABA-responsive element binding) elements [30], G-box elements [31], and MYB recognition sites [32]. Notably, research has demonstrated that MYB transcription factors regulate CHS gene expression by binding to these MYB-specific cis-elements within the promoter region, thereby modulating plant salt tolerance through flavonoid biosynthesis pathways [33].
Salt stress exerts profound inhibitory effects on plant growth and development, typically manifested through growth retardation, dwarfism, and leaf chlorosis [34]. In this study, the AcCHS5-OE lines demonstrated superior phenotypic performance under salt stress compared to the WT plants, exhibiting significantly enhanced root elongation, increased biomass accumulation, and attenuated leaf chlorosis (Figure 4B–E). The observed morphological advantages suggest that AcCHS5 overexpression may improve water uptake efficiency and promote root system development, thereby mitigating salt-induced growth suppression.
Plants deploy sophisticated regulatory networks to counteract salt stress, including the activation of antioxidant enzymes and accumulation of antioxidants [35]. Our results corroborate previous studies in Iris halophila Pall., in which CHS gene overexpression enhanced salt tolerance through reduced membrane lipid peroxidation and increased flavonoid compound biosynthesis [36]. The current study extends these observations by demonstrating that AcCHS5-OE lines exhibit significantly lower oxidative damage markers (H2O2 and MDA content) alongside elevated antioxidase activities (SOD, CAT, and POD) and Pro accumulation (Figure 5B). This coordinated enhancement of the ROS scavenging system effectively maintains cellular redox homeostasis, reducing oxidative injury at both subcellular and whole-plant levels. Specifically, The SOD-CAT-POD enzymatic cascade synergistically interacts with the osmoprotectant (Pro) to regulate redox homeostasis via the sequential conversion of O2 to H2O2 and subsequent decomposition to water (H2O), accompanied by the concurrent scavenging of hydroxyl radicals (·OH). This integrated system operates in subcellular compartments: in chloroplasts, it mitigates photosystem II (PSII) photoinhibition to maintain photosynthetic efficiency, whereas in mitochondria, it preserves electron transport chain integrity to ensure ATP production. By coordinating ROS detoxification across cellular compartments, this mechanism attenuates salt-induced oxidative damage at both cellular and whole-plant levels, thereby conferring salt tolerance to plants [37].
The phenolic hydroxyl groups in flavonoid compounds significantly enhance their reductive capacity, conferring both radical-scavenging potential and antioxidant functionality [38]. Furthermore, flavonoids can induce the expression of multiple enzymatic systems in various cell types, including SOD, CAT, POD heme oxygenase-1 (HO-1), and glutathione peroxidase (GPX) [39]. In this study, the AcCHS5-OE lines exhibited substantially higher flavonoid accumulation compared to the WT plants under salt stress, corroborating the role of AcCHS5 in enhancing flavonoid biosynthesis and consequently improving salt tolerance in A. catechu (Figure 5B). These findings align with studies in tea plants (Camellia sinensis (L.) Kuntze), in which three CsCHS genes were identified and demonstrated to restore flavonoid synthesis in A. thaliana CHS mutants, with CsCHS-transgenic tobacco showing an elevated flavonoid content relative to wild-type controls [40]. Collectively, these studies demonstrate that CHS genes enhance plant oxidative stress tolerance by promoting flavonoid biosynthesis and regulating antioxidant enzyme systems, thereby maintaining ROS homeostasis.
Substantial evidence indicates that MYB transcription factors play pivotal roles in regulating flavonoid biosynthesis pathways. In Lilium lancifolium Thunb., the LlMYB3 transcription factor binds to MYB recognition motifs within the LlCHS promoter, functioning as an upstream regulator to enhance salinity tolerance in overexpression lines [41]. Similarly, A. thaliana studies have identified MYB111 as a positive regulator that interacts with cis-elements in the AtCHS promoter, promoting transcriptional activation and flavonoid accumulation under salt stress [42]. In this study, a correlation analysis of AcMYB genes and flavonoid biosynthesis-related genes predicted AcMYB176, AcMYB3, and AcMYB44 as potential regulatory candidates (Figure 6A). Our experimental validation confirmed that AcMYB176 directly interacts with the AcCHS5 promoter via yeast one-hybrid assays (Figure 6B). Furthermore, dual-luciferase reporter assays demonstrated that AcMYB176 acts as a transcriptional activator of AcCHS5, establishing its role in modulating flavonoid-mediated salt adaptation mechanisms (Figure 6C).

4. Materials and Methods

4.1. Phylogenetic Analysis of the CHS Gene Family in A. catechu

The genome of A. catechu was retrieved from the NCBI database (GenBank accession: JAHSVC000000000; BioSample: SAMN19591864). Genomic sequences of A. thaliana and O. sativa were obtained from Ensembl Plants database (https://plants.ensembl.org) (accessed on 10 November 2024), while palm species (C. nucifera tall, C. nucifera dwarf, P. dactylifera, and E. guineensis) data were sourced from the Arecaceae Genome Database (https://arecaceae-gdb.org) (accessed on 10 November 2024). The amino acid sequences of CHS gene family members in A. thaliana were downloaded from TAIR (https://www.arabidopsis.org) (accessed on 10 November 2024). CHS homologs in A. catechu were identified via BLASTP against A. thaliana references (E-value < 1 × 10⁵, identity > 40%), followed by domain validation using HMMER (version 3.0) with the Pfam CHS model (PF00195; E-value < 0.01). CHS protein sequences from seven species were aligned in TBtools (version 2.1025), and a neighbor-joining tree was constructed in MEGA11 (Poisson model, 1000 bootstraps). Final visualization was performed using iTOL (https://itol.embl.de) (accessed on 20 November 2024).

4.2. Inter- and Intra-Species Collinearity Analysis of the CHS Gene Family in A. catechu

The TBtools software was launched to extract chromosomal localization data of CHS genes using the Fasta Stats tool. Collinearity analysis was then conducted through the One-Step MCScanX module with default parameters, and the output files were saved for downstream analyses. The collinearity relationships were visualized at high resolution using the Advanced Circos toolkit. For evolutionary rate estimation, syntenic gene pairs were first identified with the Simple Ka/Ks Calculator, followed by Ka and Ks substitution rates. These quantitative metrics provide critical insights into the evolutionary constraints acting on CHS genes.

4.3. Cis-Acting Element Analysis of the CHS Gene Family in A. catechu

The TBtools software was initialized to extract 2000 bp upstream regions of coding sequences (CDS) from A. catechu CHS genes using the GFF3 Sequence Extraction module. The processed sequences were then submitted to the PlantCARE database (https://bioinformatics.psb.ugent.be/webtools/plantcare/html/) (accessed on 6 December 2024) for comprehensive prediction of cis-acting regulatory elements. The resulting data were systematically organized in Microsoft Excel and subsequently visualized through GraphPad Prism (version 9.0) and TBtools to elucidate spatial distribution patterns of regulatory elements across the CHS gene family.

4.4. Expression Pattern Analysis of CHS Genes in A. catechu

A. catechu cv. ‘ReYan No.1’ samples used in this study were naturally grown at the Danzhou Campus of Hainan University. Fresh tissues including leaves, flowers (male and female), pericarps, and endosperms were collected, flash-frozen in liquid nitrogen, and stored at −80 °C. Total RNA was isolated using the Plant RNA Extraction Kit (Accurate, Beijing, China) and subsequently reverse-transcribed into cDNA with the FastKing cDNA Synthesis Kit (Vazyme, Nanjing, China), which served as the template for subsequent quantitative analyses. Target-specific primers for qPCR were developed using Premier (version 5.0) (Table S3). Expression profiles of CHS genes were systematically analyzed in leaves, male flowers, female flowers, pericarps, and endosperms through qPCR with three biological replicates per sample.
Uniformly developed A. catechu seedlings were transplanted into 12 × 12 cm plastic pots filled with perlite substrate and maintained in a plant growth facility with precisely controlled conditions (14 h photoperiod and 10 h dark cycle). Plants were irrigated every 4 days. After 14 days of acclimatization, seedlings were divided into two groups: (1) a control group (normal irrigation); and (2) an experimental group subjected to salt stress via irrigation with 200 mmol·L1 NaCl solution. Foliar tissues of NaCl-stressed and untreated plants were harvested at 1, 3, 7, and 14 days after treatment, snap-frozen using liquid nitrogen, and maintained at −80 °C for preservation. Expression levels of CHS genes in leaves were quantified by qPCR to compare transcriptional responses between salt-stressed and untreated plants across time points, with three biological replicates per group.

4.5. Construction of AcCHS5 Overexpression Vector and Generation of Transgenic A. thaliana

Based on the coding sequence (CDS) of AcCHS5 and the multiple cloning sites of the pCAMBIA-1300 vector, restriction enzymes SpeI and XbaI were selected for gene cloning. Gene-specific primers were designed for molecular cloning (Table S4). The target fragment was PCR-amplified from A. Catechu cDNA with Vazyme’s high-fidelity polymerase, followed by purification via the manufacturer’s gel extraction kit (Vazyme). The purified fragment was ligated into the Blunt-Zero cloning vector (Vazyme) and transformed into Escherichia coli DH5α competent cells, followed by incubation at 37 °C. Positive clones were screened by colony PCR and sent to Sangon Biotech (Shanghai, China) for Sanger sequencing. Sequence-verified T-vectors were subjected to double digestion with SpeI/XbaI, and the excised fragment was gel-purified. The digested fragment was ligated into the linearized pCAMBIA-1300 expression vector, followed by restriction digestion verification to confirm successful insertion. The recombinant pCAMBIA-1300-AcCHS5 construct was introduced into Agrobacterium tumefaciens strain GV3101. A. thaliana (Col-0) inflorescences were dip-inoculated with the Agrobacterium suspension harboring the target construct. Seeds were harvested at maturity and surface-sterilized before sowing on ½ MS medium containing 30 mg/L hygromycin. Transgenic plants were selected over three generations (T3). Homozygous lines with high AcCHS5 expression levels, as confirmed by qRT-PCR, were retained for subsequent experiments.

4.6. Phenotypic Observation of A. thaliana Under Salt Stress Treatment

WT (Col-0) and T3-generation AcCHS5-OE Arabidopsis seeds underwent surface sterilization via sequential immersion in 75% ethanol (8 min) and 5% sodium hypochlorite (5 min), followed by triple rinsing with sterile distilled water. Seeds were sown on ½ MS agar medium and cultured in a growth chamber under controlled conditions (22 °C, 16 h photoperiod, and light intensity of 120 μmol·m2·s1). Stress treatments were applied to both seedlings and adult plants, with non-stressed wild-type and two transgenic lines serving as controls. All treatments included three biological replicates. Seedling stress treatment: ½ MS agar plates containing 200 mmol·L1 NaCl (Sigma-Aldrich, St. Louis, MO, USA) were prepared for salt stress induction. Seven-day-old A. thaliana seedlings were transferred to the stress medium and cultured for 7 days. ImageJ (version 2.9.0) was employed to analyze root length parameters. Adult plant stress treatment: A growth substrate was prepared by mixing Danish Pindstrup peat and vermiculite at a 3:1 ratio (v/v). Twenty-one-day-old plants were irrigated with 200 mmol·L1 NaCl solution for 14 days to induce salt stress.

4.7. Detection of Stress-Resistant Physiological Indices in A. thaliana Under Salt Stress

Whole plants were collected for physiological analysis after salt stress treatment. Pooled samples consisting of 3–6 wild-type (A. thaliana Col-0) plants and three plants per transgenic line were used for biochemical assays. The following stress-related indices were quantified using commercial assay kits (Solarbio, Beijing, China): flavonoid content, Pro content, MDA content, H2O2 accumulation, CAT activity, SOD activity, and POD activity.

4.8. NBT Staining and DAB Staining

NBT (Nitroblue tetrazolium) staining was employed to detect O2· accumulation, while DAB (3,3′-Diaminobenzidine) staining was used to visualize H2O2 distribution. The seventh leaf from 28-day-old A. thaliana seedlings were immersed in NBT and DAB staining solutions (Solarbio, Beijing, China), respectively, for 3–6 h. Subsequently, the stained leaves were decolorized in absolute ethanol for 8 h to remove residual pigments. After thorough rinsing to eliminate nonspecific staining, the samples were photographed under standardized imaging conditions.

4.9. Correlation Analysis of MYB Transcription Factors and Flavonoid Biosynthesis Genes in A. catechu

Utilizing transcriptomic data from A. catechu, we first identified transcript sequences of the AcMYB transcription factor family members and genes associated with the flavonoid biosynthetic pathway through genome annotation screening. Pearson correlation analysis was conducted using the stats package in R (version 4.2.1), with AcMYB genes designated as the query gene set and flavonoid synthesis-related genes as the target gene set for pairwise correlation calculation. A significance threshold of p < 0.05 (adjusted via the Benjamini–Hochberg method) was applied to select the top 100 high-confidence interaction pairs exhibiting both positive and negative correlations. Network visualization was subsequently generated using Cytoscape software (version 3.9.1).

4.10. Yeast One-Hybrid Vector Construction

The 2000 bp upstream sequence of AcCHS5 was extracted using TBtools and PCR-amplified using genomic DNA from A. catechu as the template (Table S4). Predicted transcription factor sequences were cloned from A. catechu cDNA (Table S4). The proAcCHS5 fragment was inserted into the pAbAi vector to construct the bait vector proAcCHS5-AbAi. Three predicted transcription factors (AcMYB176, AcMYB44, and AcMYB3) were ligated into the pGADT7 vector, generating prey vectors for subsequent interaction assays.

4.11. Screening of Bait Yeast Strain Sensitivity to AbA

Yeast colonies identified as positive on SD/-Ura plates were transferred to SD/-Ura liquid medium and grown for two days at 28 °C in a shaking incubator (200 rpm). The cells were resuspended in 0.9% NaCl solution and diluted to an OD600 of 0.002 (equivalent to 2000 cells per 100 μL suspension). Aliquots (100 μL) of the diluted culture were plated onto SD/-Ura agar plates containing varying concentrations of AbA: 100, 200, 300, 400, and 500 ng/mL. Following 3-day incubation at 28 °C, the minimum inhibitory concentration (MIC) of AbA required to suppress bait strain growth was determined based on colony viability assessment.

4.12. Yeast One-Hybrid Interaction Assay

The constructed plasmid AcMYB-pGADT7 was co-transformed into proAcCHS5-AbAi-containing yeast competent cells using the polyethylene glycol/lithium acetate (PEG/LiAc) method. Cell suspensions were adjusted to OD600 values of 0.2, 0.02, 0.002, and 0.0002 (ten-fold serial dilutions) and spotted onto both SD/-Leu medium and SD/-Leu medium supplemented with the MIC of AbA. Plates were transferred to a 30 °C incubator for a period of 3–5 days. Reporter gene activation, evidenced by yeast growth on selective media, occurred only if the target transcription factor (AcMYB) interacted with the proAcCHS5 promoter sequence. Observable colony development under AbA selection confirmed protein–DNA interaction.

4.13. Dual-Luciferase Reporter Assay (LUC)

The recombinant vectors proAcCHS5-pGreenII 0800-LUC and pGreenII 62-SK-AcMYB176 were constructed and independently transformed into GV3101 competent cells. Mature leaves of N. benthamiana plants at the 4-week growth stage were harvested for Agrobacterium-mediated transient expression assays. The bacterial cultures, following resuspension, were blended in a 1:1 volumetric ratio prior to syringe-mediated delivery into the abaxial leaf epidermis of tobacco plants. The following combinations were used: control group of proAcCHS5-pGreenII 0800-LUC +empty pGreenII 62-SK vector; and experimental group of proAcCHS5-pGreenII 0800-LUC + AcMYB176-pGreenII 62-SK. Infiltrated plants were incubated in the dark for 24 h followed by cultivation for 48 h photoperiod. Dual-luciferase activity was quantified using the Dual-Luciferase® Reporter Assay Kit (Puyintech, Qingdao, China). The relative transcriptional activity was calculated as the ratio of firefly luciferase (LUC) to Renilla luciferase (REN) luminescence signals. Three biological replicates were performed for each experimental condition.

4.14. Data Analysis

The experimental data were initially organized using Microsoft Excel, followed by statistical significance analysis performed with SPSS (version 21.0). Based on the experimental design, independent sample t-test and two-way analysis of variance (two-way ANOVA) were selected for hypothesis testing. Visualization of data and statistical significance annotations were subsequently conducted using GraphPad Prism (version 9.0). The asterisk (*) denotes a p-value < 0.05, (**) indicates p < 0.01, (***) represents p < 0.001, and ns means not significant.

5. Conclusions

Our findings demonstrate that AcMYB176 directly binds to the promoter of AcCHS5, positively activating and enhancing its transcriptional activity. This regulatory interaction promotes flavonoid biosynthesis, scavenges reactive ROS, and ultimately improves salt tolerance in A. catechu. Additionally, we propose a potential response model (Figure 6E). Elucidating the molecular mechanisms underlying salt tolerance and the regulatory network of flavonoid metabolism in A. catechu not only paves the way for genetic breeding improvements through molecular approaches, but also provides both the theoretical foundation and technical support for high-quality molecular breeding programs.

Supplementary Materials

The following supporting information can be downloaded at: https://www.mdpi.com/article/10.3390/ijms26073216/s1.

Author Contributions

Conceptualization, Y.J. and Y.W.; methodology, Y.J., N.M.K. and A.A.; software, Y.J., Y.Z. and G.Z.; validation, Y.J., Y.Z. and N.M.K.; formal analysis, Y.J., N.M.K. and A.A.; investigation, Y.J., G.Z., Y.Z. and N.M.K.; resources, Y.J., A.A. and P.L.; data curation, Y.J., Y.Z. and P.L.; writing—original draft preparation, Y.J.; writing—review and editing, Y.J., G.Z. and Y.W.; supervision, Y.W.; project administration, Y.W.; funding acquisition, Y.W. All authors have read and agreed to the published version of the manuscript.

Funding

This research was supported by the National Key R&D Program of China (2021YFA0909600) and the Hainan Normal University Talent Research Start-up Fund Project Funding (HSZK-KYQD-202436, HSZK-KYQD-202421).

Institutional Review Board Statement

Not applicable.

Informed Consent Statement

Not applicable.

Data Availability Statement

The data generated and analyzed in this study are available upon request.

Acknowledgments

We would like to thank BMK Cloud (www.biocloud.net, accessed on 10 November 2024) for its assistance with the gene expression analysis in this manuscript.

Conflicts of Interest

The authors declare no conflicts of interest.

References

  1. Kumar, N.; Haldar, S.; Saikia, R. Root Exudation as a Strategy for Plants to Deal with Salt Stress: An Updated Review. Environ. Exp. Bot. 2023, 216, 105518. [Google Scholar] [CrossRef]
  2. Munns, R.; Tester, M. Mechanisms of Salinity Tolerance. Annu. Rev. Plant Biol. 2008, 59, 651–681. [Google Scholar] [CrossRef] [PubMed]
  3. Gupta, B.; Huang, B. Mechanism of Salinity Tolerance in Plants: Physiological, Biochemical, and Molecular Characterization. Int. J. Genom. 2014, 2014, 701596. [Google Scholar] [CrossRef]
  4. Tebini, M.; Chieb, M.; Luu, D.T.; Dailly, H.; Lutts, S.; Ahmed, H.B.; Chalh, A. Assessment of Salt Stress Effects on Antioxidant Levels and Membrane Transport Protein in Amaranthus caudatus. J. Plant Growth Regul. 2025, 39, 105519. [Google Scholar] [CrossRef]
  5. Taylor, L.P.; Grotewold, E. Flavonoids as Developmental Regulators. Int. J. Mol. Sci. 2005, 8, 317–323. [Google Scholar] [CrossRef]
  6. Chen, L.; Guo, H.; Li, Y.; Chen, H. Chalcone Synthase EaCHS1 from Eupatorium adenophorum Functions in Salt Stress Tolerance in Tobacco. Plant Cell Rep. 2015, 34, 885–894. [Google Scholar] [CrossRef]
  7. Baldoni, E.; Genga, A.; Cominelli, E. Plant MYB Transcription Factors: Their Role in Drought Response Mechanisms. Int. J. Mol. Sci. 2015, 16, 15811–15851. [Google Scholar] [CrossRef]
  8. Liu, L.; Si, L.; Zhang, L.; Li, X.; Li, Y.; Wang, X.; Zhao, Q.; Gao, Y.; Zhang, J.; Liu, G. Metabolomics and Transcriptomics Analysis Revealed the Response Mechanism of Alfalfa to Combined Cold and Saline-Alkali Stress. Plant J. 2024, 119, 1900–1919. [Google Scholar] [CrossRef]
  9. Wang, X.; Yang, Y.; Zhang, H. Analysis of the CHS Gene Family Reveals Its Functional Responses to Hormones, Salinity, and Drought Stress in Moso Bamboo (Phyllostachys edulis). Plants 2025, 14, 161. [Google Scholar] [CrossRef]
  10. Chen, S.; Wu, F.; Li, Y.; Qian, Y.; Pan, X.; Li, F.; Yang, A. NtMYB4 and NtCHS1 Are Critical Factors in the Regulation of Flavonoid Biosynthesis and Are Involved in Salinity Responsiveness. Front. Plant Sci. 2019, 10, 178. [Google Scholar] [CrossRef]
  11. Hou, Q.; Li, S.; Shang, C.; Wen, Z.; Cai, X.; Hong, Y.; Qiao, G. Genome-Wide Characterization of Chalcone Synthase Genes in Sweet Cherry and Functional Characterization of CpCHS1 under Drought Stress. Front. Plant Sci. 2022, 13, 989959. [Google Scholar] [CrossRef] [PubMed]
  12. Cao, Y.; Li, K.; Li, Y.; Zhao, X.; Wang, L. MYB Transcription Factors as Regulators of Secondary Metabolism in Plants. Biology 2020, 9, 61. [Google Scholar] [CrossRef] [PubMed]
  13. Zhao, Y.; Zhang, G.; Tang, Q.; Song, W.; Gao, Q.; Xiang, G.; Zhai, C. EbMYBP1, a R2R3-MYB Transcription Factor, Promotes Flavonoid Biosynthesis in Erigeron breviscapus. Front. Plant Sci. 2022, 13, 946827. [Google Scholar] [CrossRef] [PubMed]
  14. Pandey, A.; Misra, P.; Trivedi, P.K. Constitutive Expression of Arabidopsis MYB Transcription Factor, AtMYB11, in Tobacco Modulates Flavonoid Biosynthesis in Favor of Flavonol Accumulation. Plant Cell Rep. 2015, 34, 1515–1528. [Google Scholar] [CrossRef]
  15. Jian, Y.; Gao, C.; Shang, Y.; Qin, J.; Duan, S.; Bian, C.; Li, G. Metabolomic and Transcriptomic Analyses Reveal MYB-Related Genes Involved in Drought Resistance in Grafted Potatoes via the Flavonoid Pathway. Plant Stress 2024, 14, 100665. [Google Scholar] [CrossRef]
  16. Ravaglia, D.; Espley, R.V.; Henry-Kirk, R.A.; Andreotti, C.; Ziosi, V.; Hellens, R.P.; Allan, A.C. Transcriptional Regulation of Flavonoid Biosynthesis in Nectarine (Prunus persica) by a Set of R2R3 MYB Transcription Factors. BMC Plant Biol. 2013, 13, 68. [Google Scholar] [CrossRef]
  17. Zhang, W.; Xu, F.; Cheng, S.; Liao, Y. Characterization and Functional Analysis of a MYB Gene (GbMYBFL) Related to Flavonoid Accumulation in Ginkgo biloba. Genes Genom. 2018, 40, 49–61. [Google Scholar] [CrossRef]
  18. Li, X.W.; Li, J.W.; Zhai, Y.; Zhao, Y.; Zhao, X.; Zhang, H.J.; Wang, Q.Y. A R2R3-MYB Transcription Factor, GmMYB12B2, Affects the Expression Levels of Flavonoid Biosynthesis Genes Encoding Key Enzymes in Transgenic Arabidopsis Plants. Gene 2013, 532, 72–79. [Google Scholar] [CrossRef]
  19. Wang, C.; Yin, Z.; Luo, R.; Qian, J.; Fu, C.; Wang, Y.; Xie, Y.; Liu, Z.; Qiu, Z.; Pei, H. Spatiotemporal Evolution and Impact Mechanisms of Areca Palm Plantations in China (1987–2022). Forests 2024, 15, 1679. [Google Scholar] [CrossRef]
  20. Ansari, A.; Mahmood, T.; Bagga, P.; Ahsan, F.; Shamim, A.; Ahmad, S.; Shariq, M.; Parveen, S. Areca catechu: A Phytopharmacological Legwork. Food Front. 2021, 2, 163–183. [Google Scholar] [CrossRef]
  21. Lai, J.; Li, C.; Zhang, Y.; Wu, Z.; Li, W.; Zhang, Z.; Yang, J. Integrated Transcriptomic and Metabolomic Analyses Reveal the Molecular and Metabolic Basis of Flavonoids in Areca catechu L. J. Agric. Food Chem. 2023, 71, 4851–4862. [Google Scholar] [CrossRef] [PubMed]
  22. Upadhyay, R.K. Does Salinity Stress Amend the Morphology and Physiological Appearance of Young Betel Nut (Areca catechu L.) Seedlings? J. Plant. Crops 2016, 44, 129–131. [Google Scholar]
  23. Fu, Z.W.; Feng, Y.R.; Gao, X.; Ding, F.; Li, J.H.; Yuan, T.T.; Lu, Y.T. Salt Stress-Induced Chloroplastic Hydrogen Peroxide Stimulates pdTPI Sulfenylation and Methylglyoxal Accumulation. Plant Cell 2023, 35, 1593–1616. [Google Scholar] [CrossRef] [PubMed]
  24. An, Q.; Jiang, Y.; Zhou, G. Genome-Wide Investigation of MYB Gene Family in Areca catechu and Potential Roles of AcDF in Transgenic Arabidopsis. Mol. Biol. Rep. 2024, 51, 1–13. [Google Scholar] [CrossRef]
  25. Ahmad, S.; Ali, S.; Shah, A.Z.; Khan, A.; Faria, S. Chalcone Synthase (CHS) Family Genes Regulate the Growth and Response of Cucumber (Cucumis sativus L.) to Botrytis cinerea and Abiotic Stresses. Plant Stress 2023, 8, 100159. [Google Scholar] [CrossRef]
  26. Wu, X.; Zhang, S.; Liu, X.; Shang, J.; Zhang, A.; Zhu, Z.; Zha, D. Chalcone Synthase (CHS) Family Members Analysis from Eggplant (Solanum melongena L.) in the Flavonoid Biosynthetic Pathway and Expression Patterns in Response to Heat Stress. PLoS ONE 2020, 15, e0226537. [Google Scholar] [CrossRef]
  27. Isıyel, M.; İlhan, E.; Kasapoğlu, A.G.; Muslu, S.; Öner, B.M.; Aygören, A.S.; Yıldırım, E. Identification and Characterization of Phaseolus vulgaris CHS Genes in Response to Salt and Drought Stress. Genet. Resour. Crop Evol. 2024, 72, 271–293. [Google Scholar] [CrossRef]
  28. Li, J.; Zhang, Z.; Vang, S.; Yu, J.; Wong, G.K.S.; Wang, J. Correlation Between Ka/Ks and Ks Is Related to Substitution Model and Evolutionary Lineage. J. Mol. Evol. 2009, 68, 414–423. [Google Scholar] [CrossRef]
  29. Walther, D.; Brunnemann, R.; Selbig, J. The Regulatory Code for Transcriptional Response Diversity and Its Relation to Genome Structural Properties in A. thaliana. PLoS Genet. 2007, 3, e11. [Google Scholar] [CrossRef]
  30. Sun, Y.; Oh, D.H.; Duan, L.; Ramachandran, P.; Ramirez, A.; Bartlett, A.; Dinneny, J.R. Divergence in the ABA Gene Regulatory Network Underlies Differential Growth Control. Nat. Plants 2022, 8, 549–560. [Google Scholar] [CrossRef]
  31. Dao, T.T.H.; Linthorst, H.J.M.; Verpoorte, R. Chalcone Synthase and Its Functions in Plant Resistance. Phytochem. Rev. 2011, 10, 397–412. [Google Scholar] [CrossRef] [PubMed]
  32. Lai, G.T.; Que, Q.X.; Pan, R.; Liu, Y.X.; Wang, Q.; Lai, P.F.; Lai, C.C. Response of Chalcone Synthase Gene (CHS) to Different Light Quality and Transcription Factor Regulation in Vitis davidii. Biotechnol. Bull. 2022, 38, 129. [Google Scholar] [CrossRef]
  33. Pan, L.; Ma, J.; Li, J.; Yin, B.; Fu, C. Advances of Salt Stress-Responsive Transcription Factors in Plants. Chin. J. Biotechnol. 2022, 38, 50–65. [Google Scholar] [CrossRef]
  34. Acosta-Motos, J.R.; Ortuño, M.F.; Bernal-Vicente, A.; Diaz-Vivancos, P.; Sanchez-Blanco, M.J.; Hernandez, J.A. Plant Responses to Salt Stress: Adaptive Mechanisms. Agronomy 2017, 7, 18. [Google Scholar] [CrossRef]
  35. von der Mark, C.; Ivanov, R.; Eutebach, M.; Maurino, V.G.; Bauer, P.; Brumbarova, T. Reactive Oxygen Species Coordinate the Transcriptional Responses to Iron Availability in Arabidopsis. J. Exp. Bot. 2021, 72, 2181–2195. [Google Scholar] [CrossRef]
  36. Liu, Q.; Gu, X.; Zhang, Y.; Zhang, T.; Wang, Y.; Dhankher, O.P.; Yuan, H. Molecular and Metabolomics Analysis Reveals New Insight into the Mechanism Underlying Iris halophila Pall. IhCHS1-Mediated Regulation of Plant Salt Tolerance. Environ. Exp. Bot. 2025, 229, 106080. [Google Scholar] [CrossRef]
  37. Cardona, T.; Shao, S.; Nixon, P.J. Enhancing photosynthesis in plants: The light reactions. Essays Biochem. 2018, 62, 85–94. [Google Scholar] [CrossRef]
  38. Mira, L.; Fernandez, M.T.; Santos, M.; Rocha, R.; Florêncio, M.H.; Jennings, K.R. Interactions of flavonoids with iron and copper ions: A mechanism for their antioxidant activity. Free Radic. Res. 2002, 36, 1199–1208. [Google Scholar] [CrossRef]
  39. Kobori, M.; Takahashi, Y.; Akimoto, Y.; Sakurai, M.; Matsunaga, I.; Nishimuro, H.; Ohnishi-Kameyama, M. Chronic high intake of quercetin reduces oxidative stress and induces expression of the antioxidant enzymes in the liver and visceral adipose tissues in mice. J. Funct. Foods 2015, 15, 551–560. [Google Scholar] [CrossRef]
  40. Li, M.; Wang, W.; Wang, Y.; Guo, L.; Liu, Y.; Jiang, X. Duplicated Chalcone Synthase (CHS) Genes Modulate Flavonoid Production in Tea Plants in Response to Light Stress. J. Integr. Agric. 2024, 23, 1940–1955. [Google Scholar] [CrossRef]
  41. Yong, Y.; Zhang, Y.; Lyu, Y. A MYB-Related Transcription Factor from Lilium lancifolium L. (LlMYB3) Is Involved in Anthocyanin Biosynthesis Pathway and Enhances Multiple Abiotic Stress Tolerance in Arabidopsis thaliana. Int. J. Mol. Sci. 2019, 20, 3195. [Google Scholar] [CrossRef]
  42. Li, B.; Fan, R.; Guo, S.; Wang, P.; Zhu, X.; Fan, Y.; Song, C.P. The Arabidopsis MYB Transcription Factor, MYB111 Modulates Salt Responses by Regulating Flavonoid Biosynthesis. Environ. Exp. Bot. 2019, 166, 103807. [Google Scholar] [CrossRef]
Figure 1. Phylogenetic and syntenic analyses of CHS genes in A. catechu. (A) Unrooted neighbor-joining phylogenetic tree of CHS proteins from A. catechu and six representative species (A. thaliana, O. sativa, C. nucifera dwarf, C. nucifera tall, P. dactylifera, and E. guineensis), constructed using MEGA 11. Twelve major clades (I–XII) are color coded. (B) Intra-species synteny of AcCHS loci (red pentagons) on A. catechu chromosomes. Paralogous duplication events are indicated by red connecting lines; gray lines represent collinear blocks. (C) Cross-species microsynteny networks between A. catechu and five plants. Conserved CHS orthologs (red stars) are embedded in macro-syntenic regions (gray ribbons).
Ijms 26 03216 g001
Figure 2. Distribution of cis-acting elements in the 2000 bp upstream promoter region of the AcCHS gene family. (A) Bar chart showing the abundance of regulatory elements across response types. The vertical axis indicates the number of elements, and the horizontal axis labels regulatory element categories (e.g., ACE-core, Box 4). (B) Heatmap partitioned into four functional categories: light response, stress response, hormone response, and development. Rows represent regulatory elements, columns correspond to AcCHS1–AcCHS7 genes, and numerical values in cells indicate the association frequency between genes and elements. Color gradient reflects element abundance (darker hues = higher counts).
Ijms 26 03216 g002
Figure 3. Expression profiles of AcCHS gene family members under tissue-specific and salt stress conditions. (A) Relative expression levels of AcCHS1–AcCHS7 in different tissues: female flower, male flower, leaf, pericarp, and endosperm. Bars shown in gray represent individual genes (left to right: AcCHS1 to AcCHS7). (B) Time-course expression changes of AcCHS1–AcCHS7 under control (CK, black bars) and NaCl stress (gray bars) 1, 3, 7, and 14 days post-treatment. Error bars represent mean ± SD from three biological replicates (n = 3). Statistical significance was determined using t-test (* p < 0.05, ** p < 0.01, *** p < 0.001).
Ijms 26 03216 g003
Figure 4. Phenotypic and physiological characterization of AcCHS5-OE lines under control and NaCl stress conditions. (A) The relative expression of AcCHS5 in different A. thaliana lines. (B) Seedling phenotypes of WT, OE5, and OE7 under control (CK, left) and NaCl stress (right). Scale bar = 1 cm. (C) Root length measurements of WT (black), OE5 (light gray), and OE7 (dark gray). (D) Mature plant phenotypes under CK (upper panel) and NaCl treatment (lower panel). (E) Dry weight (left) and fresh weight (right) of plants. Error bars represent mean ± SD from three biological replicates (n = 3). Statistical significance was determined using two-way ANOVA (ns, * p < 0.05, ** p < 0.01, *** p < 0.001).
Ijms 26 03216 g004
Figure 5. Oxidative stress responses and antioxidant enzyme activities in WT and AcCHS5-OE lines (OE5, OE7) under control and NaCl stress conditions. (A) Phenotypic visualization using DAB (brown coloration for H2O2 accumulation) and NBT (blue coloration for O2· detection) staining. Scale bar = 1 cm. (B) Biochemical quantification of MDA, H2O2 content, POD, CAT, SOD activities, Pro content, and flavonoid content. Black bars: WT; light gray: OE5; dark gray: OE7. Error bars represent mean ± SD from three biological replicates (n = 3). Statistical significance was determined using two-way ANOVA (ns, * p < 0.05, ** p < 0.01, *** p < 0.001).
Ijms 26 03216 g005
Figure 6. Molecular interaction and transcriptional regulation of AcCHS5 in flavonoid biosynthesis. (A) Correlation analysis network of flavonoid biosynthetic genes with MYB transcription factors. Central green node: AcCHS5; interacting partners (pink nodes): AcMYB3, AcMYB44, AcMYB176. (B) Yeast one-hybrid (Y1H) assay validating binding of MYB TFs (AcMYB176, AcMYB3, AcMYB44) to the AcCHS5 promoter (proAcCHS5). Controls: p53-AbAi + pGADT7-p53 (positive), proAcCHS5-AbAi + pGADT7-empty (negative). Yeast suspensions (100–10−3 dilutions) spotted on SD/-Leu ± 500 ng/mL AbA. (C) Schematic diagram of the dual-luciferase reporter and effector vectors. (D) Dual-luciferase assay showing transcriptional activation of AcCHS5 by AcMYB176. Control group: proAcCHS5-pGreenII 0800-LUC + empty-pGreenII 62-SK vector. Experimental group: proAcCHS5-pGreenII 0800-LUC + AcMYB176-pGreenII 62-SK. Error bars represent mean ± SD from three biological replicates (n = 3). Statistical significance was determined using t-test (** p < 0.01 vs. CK.). (E) Model of the AcMYB176-AcCHS5 module regulating flavonoid biosynthesis in response to salt stress. Salt stress induces the expression of the flavonoid biosynthetic gene AcCHS5 in A. catechu, where the transcription factor AcMYB176 transcriptionally activates AcCHS5 to enhance flavonoid biosynthesis, thereby scavenging ROS and ultimately regulating plant salt tolerance.
Ijms 26 03216 g006
Table 1. Non-synonymous (Ka) and synonymous (Ks) substitution rates with Ka/Ks ratios across species comparisons.
SpeciesSeq1Seq2KaKsKa/Ks
Ac vs. AzAC07G001270.1AZ01G0004910.10.0190080.340620.055803
Ac vs. AzAC07G001270.1AZ07G0156950.10.0601031.3750580.043709
Ac vs. AzAC07G001270.1AZ12G0221420.10.0121570.2490370.048816
Ac vs. AzAC10G052970.1AZ01G0004910.10.0530330.8893350.059633
Ac vs. AzAC10G052970.1AZ07G0156950.10.0119620.1801020.066416
Ac vs. AzAC11G020520.1AZ01G0004910.10.0770370.2639410.291871
Ac vs. GzAC07G001270.1GZ01G0005140.10.0190080.340620.055803
Ac vs. GzAC07G001270.1GZ07G0167730.10.0691421.2313820.05615
Ac vs. GzAC07G001270.1GZ12G0234890.10.0121570.2490370.048816
Ac vs. GzAC10G052970.1GZ01G0005140.10.0530330.8893350.059633
Ac vs. GzAC10G052970.1GZ07G0167730.10.0145590.1919210.07586
Ac vs. GzAC10G052970.1GZ12G0234890.10.0578151.0709420.053985
Ac vs. GzAC11G020520.1GZ01G0005140.10.0770370.2639410.291871
Ac vs. AtAC07G001270.1AT5G13930.10.1020252.0719490.049241
Ac vs. OsAC07G001270.1Os11t0530600-010.1020150.6977970.146195
Ac vs. EgAC07G001270.1XM_010931189.30.0153070.2113880.07241
Note: Species abbreviations: Ac (A. catechu), Az (C. nucifera dwarf), Gz (C. nucifera tall), At (A. thaliana), Os (O. sativa), Eg (E. guineensis). Seq1 and Seq2 denote compared gene pairs.
Disclaimer/Publisher’s Note: The statements, opinions and data contained in all publications are solely those of the individual author(s) and contributor(s) and not of MDPI and/or the editor(s). MDPI and/or the editor(s) disclaim responsibility for any injury to people or property resulting from any ideas, methods, instructions or products referred to in the content.

