Combining Fourier Transform Infrared and Raman Spectroscopy to Characterize Kerogen Molecular Structures: Insights into Their Thermal Maturity

Abstract
1. Introduction
2. Results
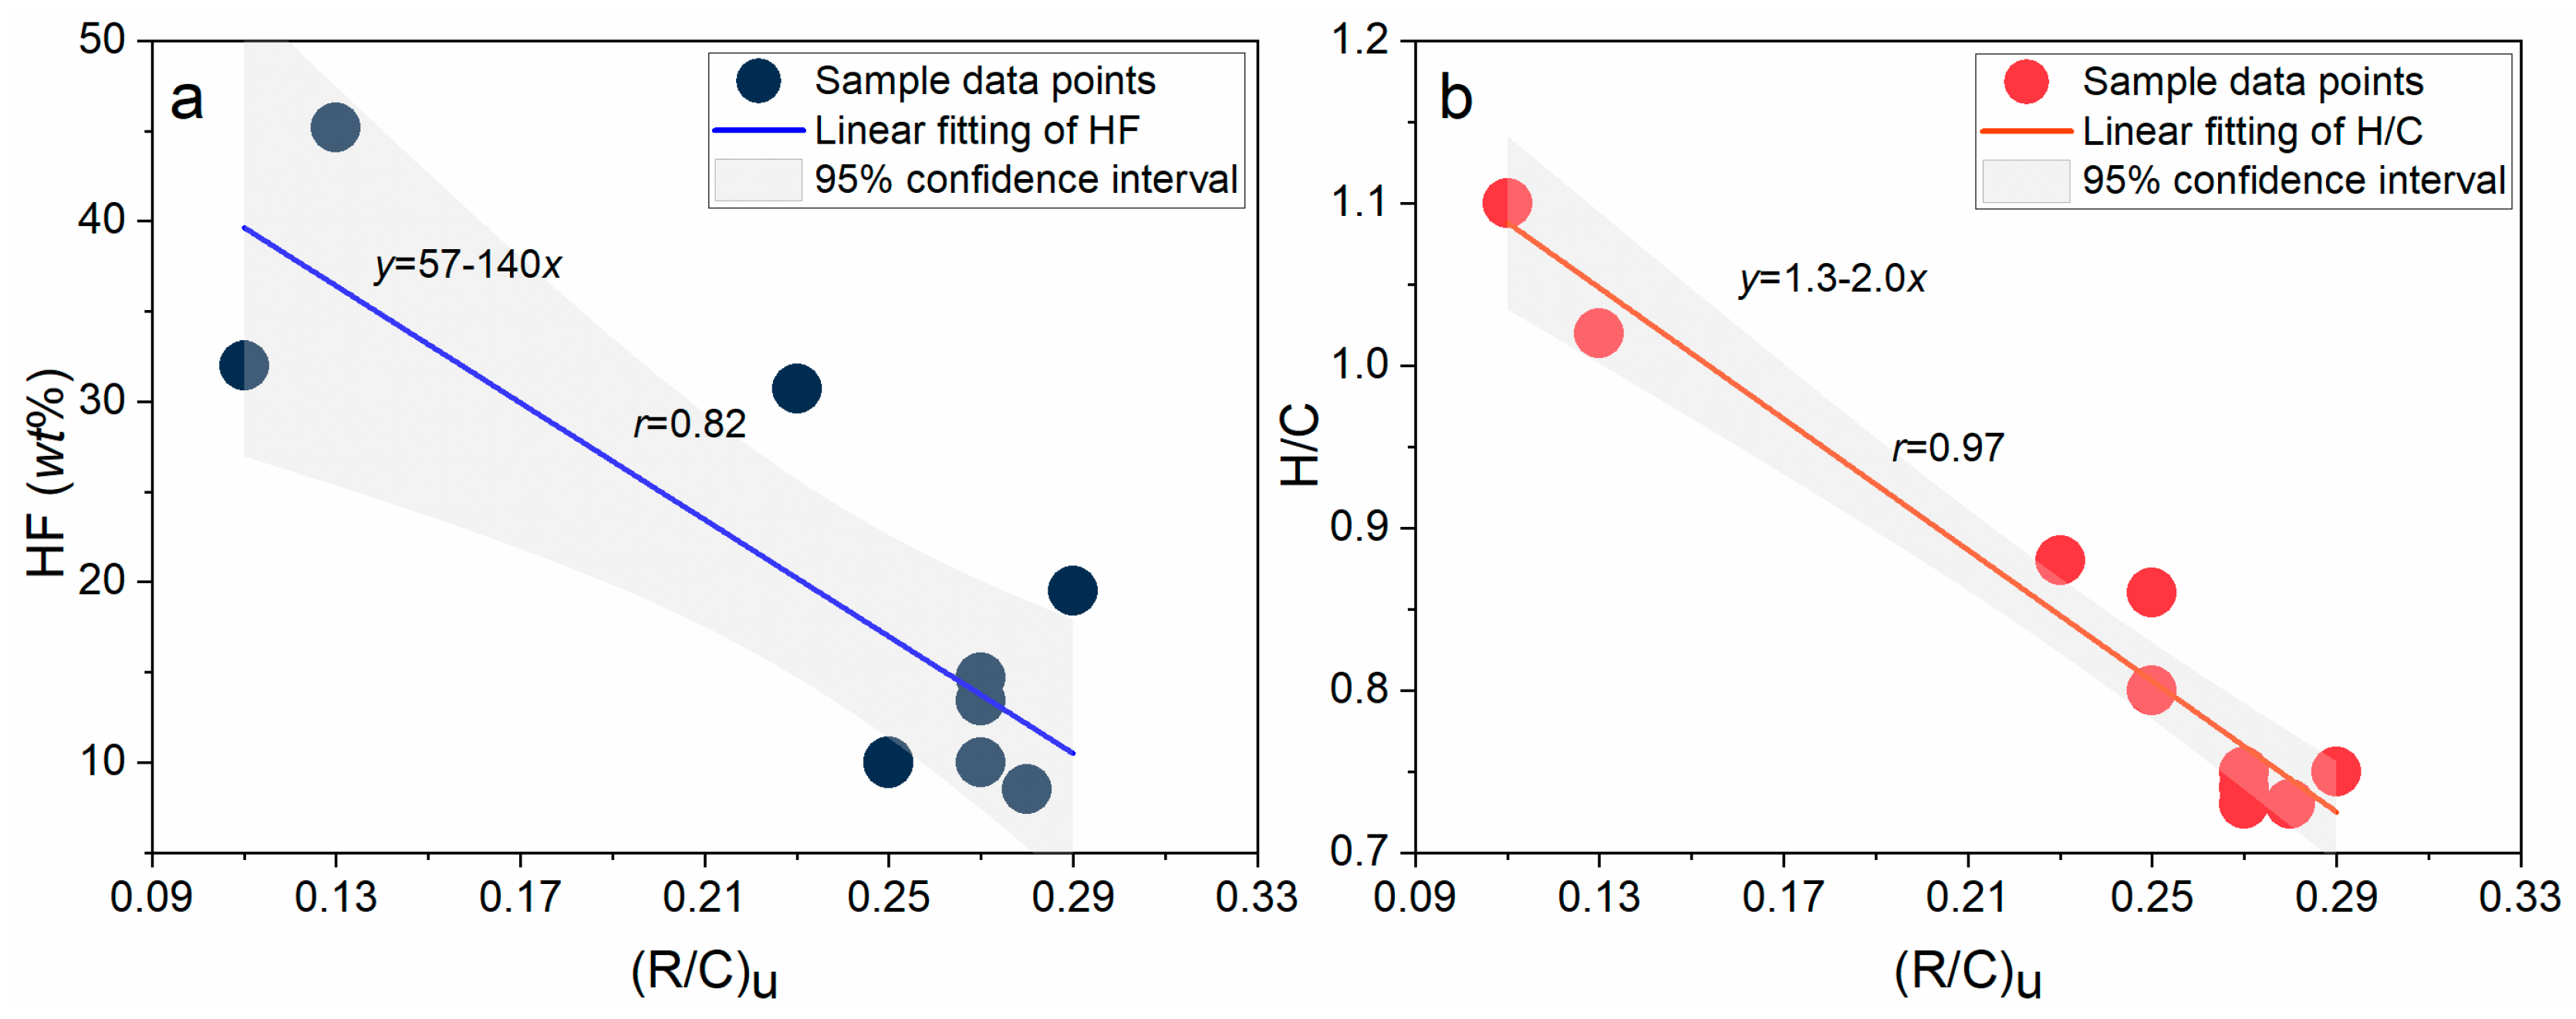
2.1. Basic Properties and Characteristics of Kerogen Samples
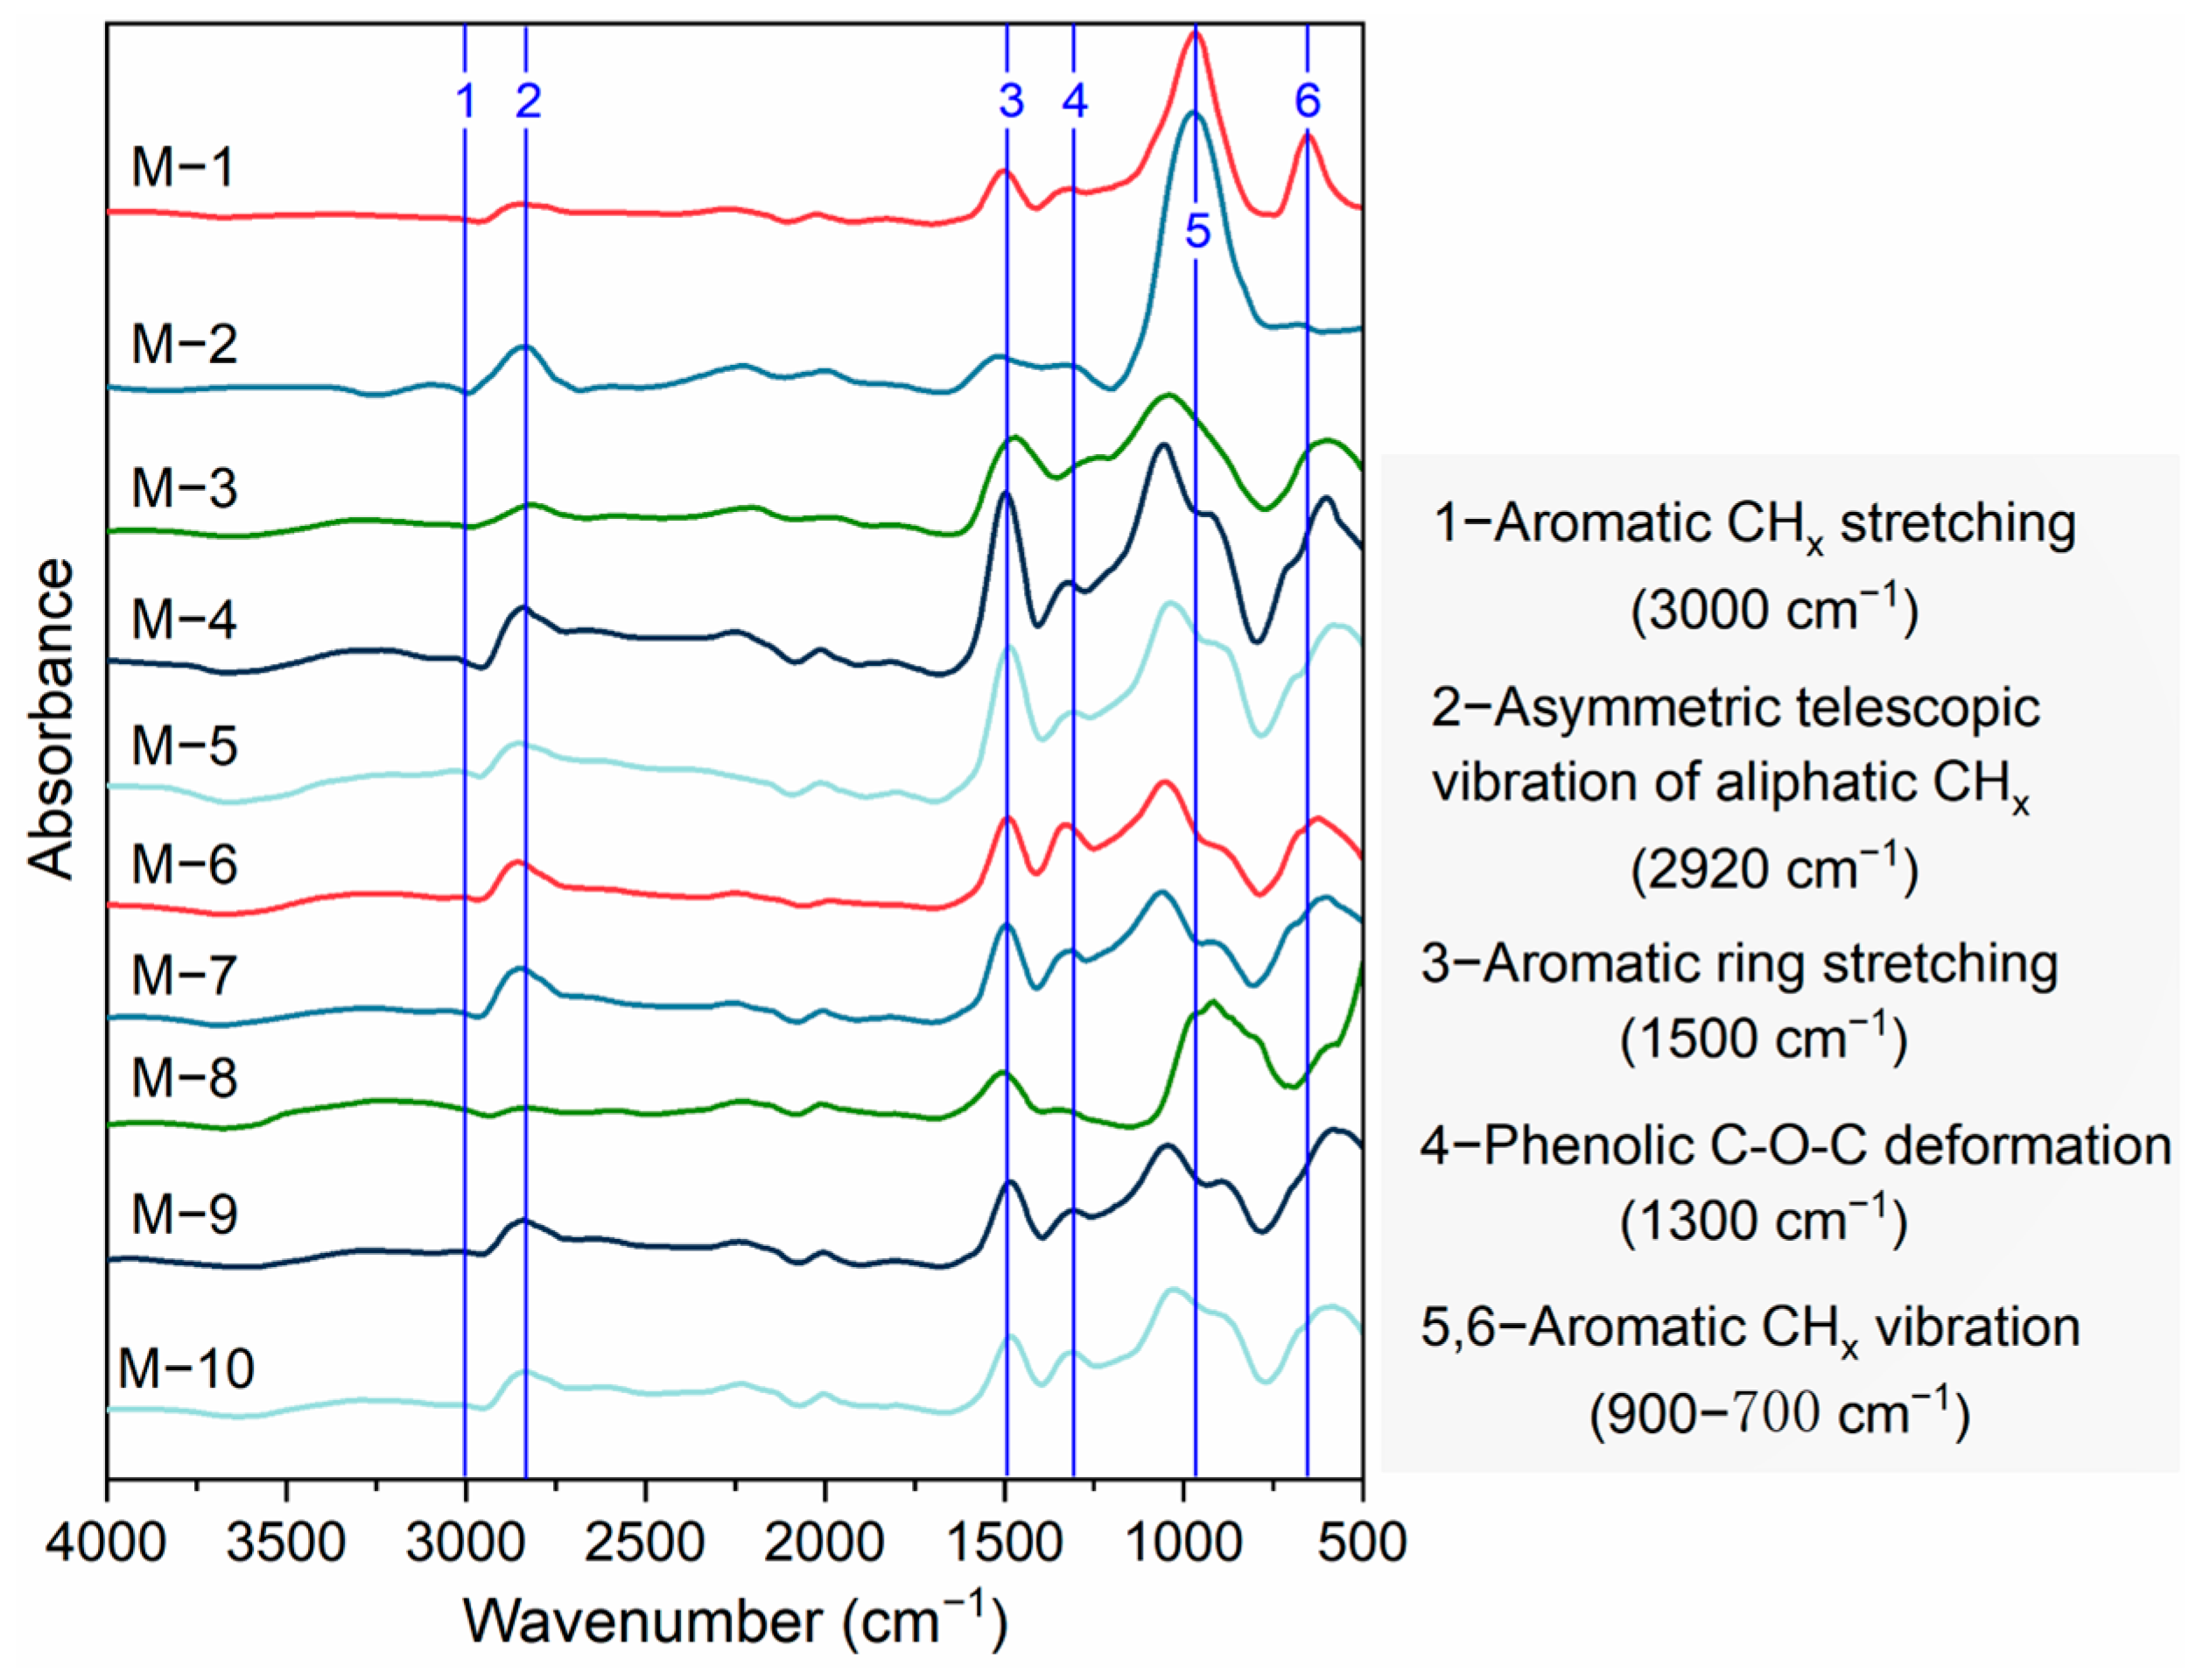
2.2. Infrared Spectral Characteristics of Kerogen
2.2.1. Evolution of Aromatic Compounds
2.2.2. Evolution of Aliphatic
2.2.3. Evolution of Oxygen-Containing Structures
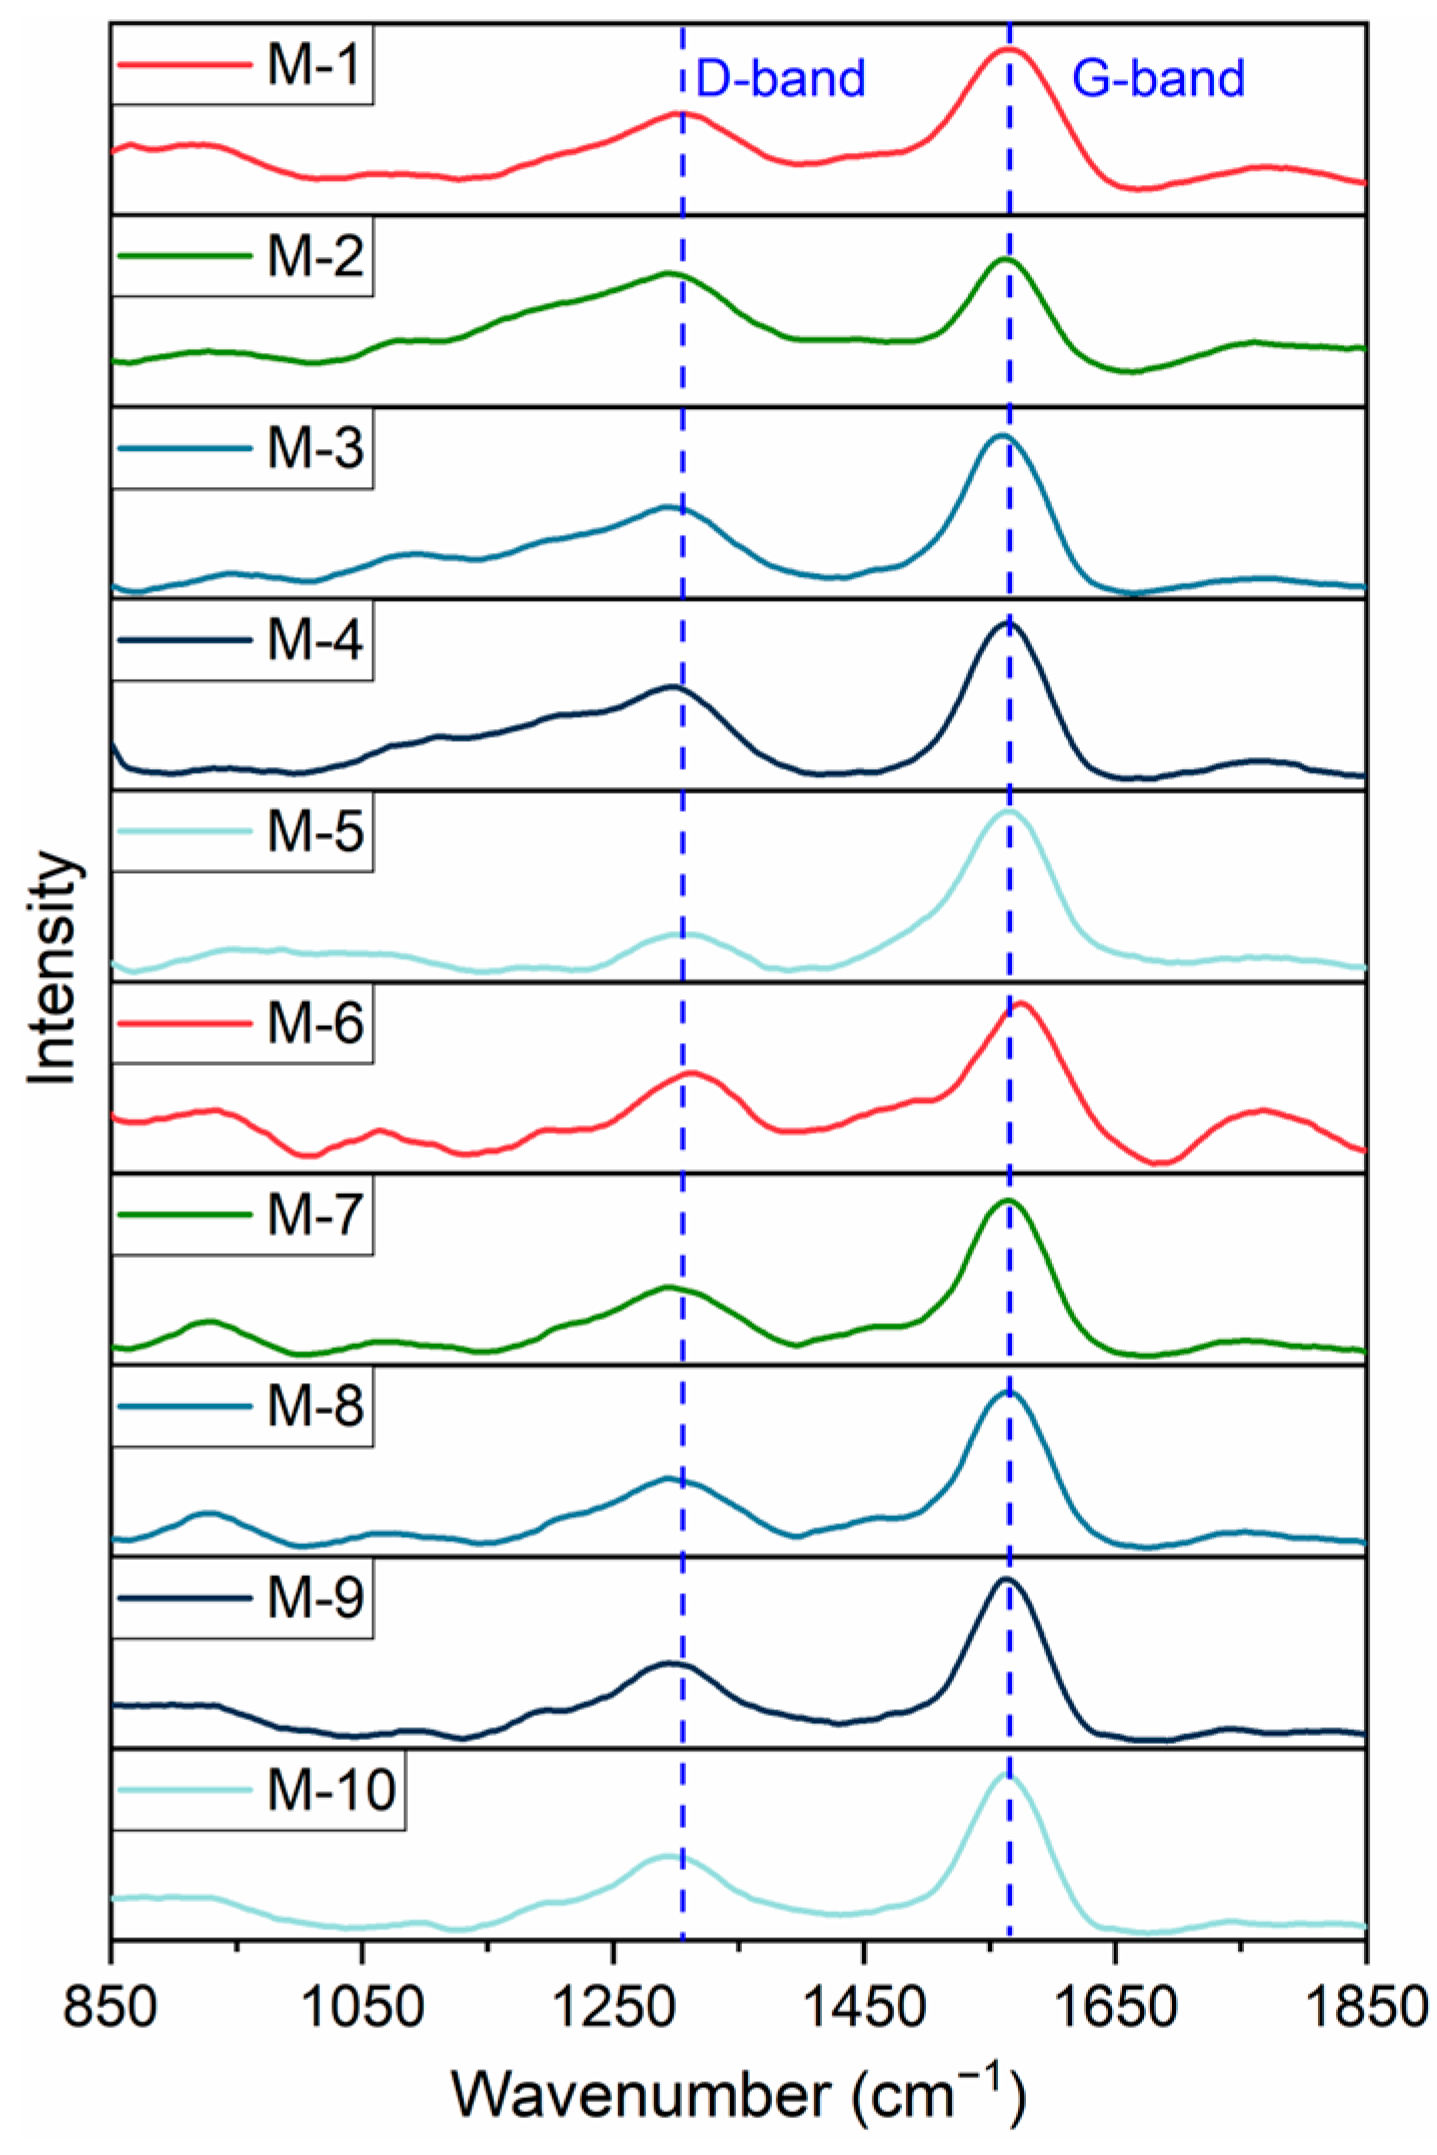
2.3. Raman Spectral Characteristics of Kerogen Samples
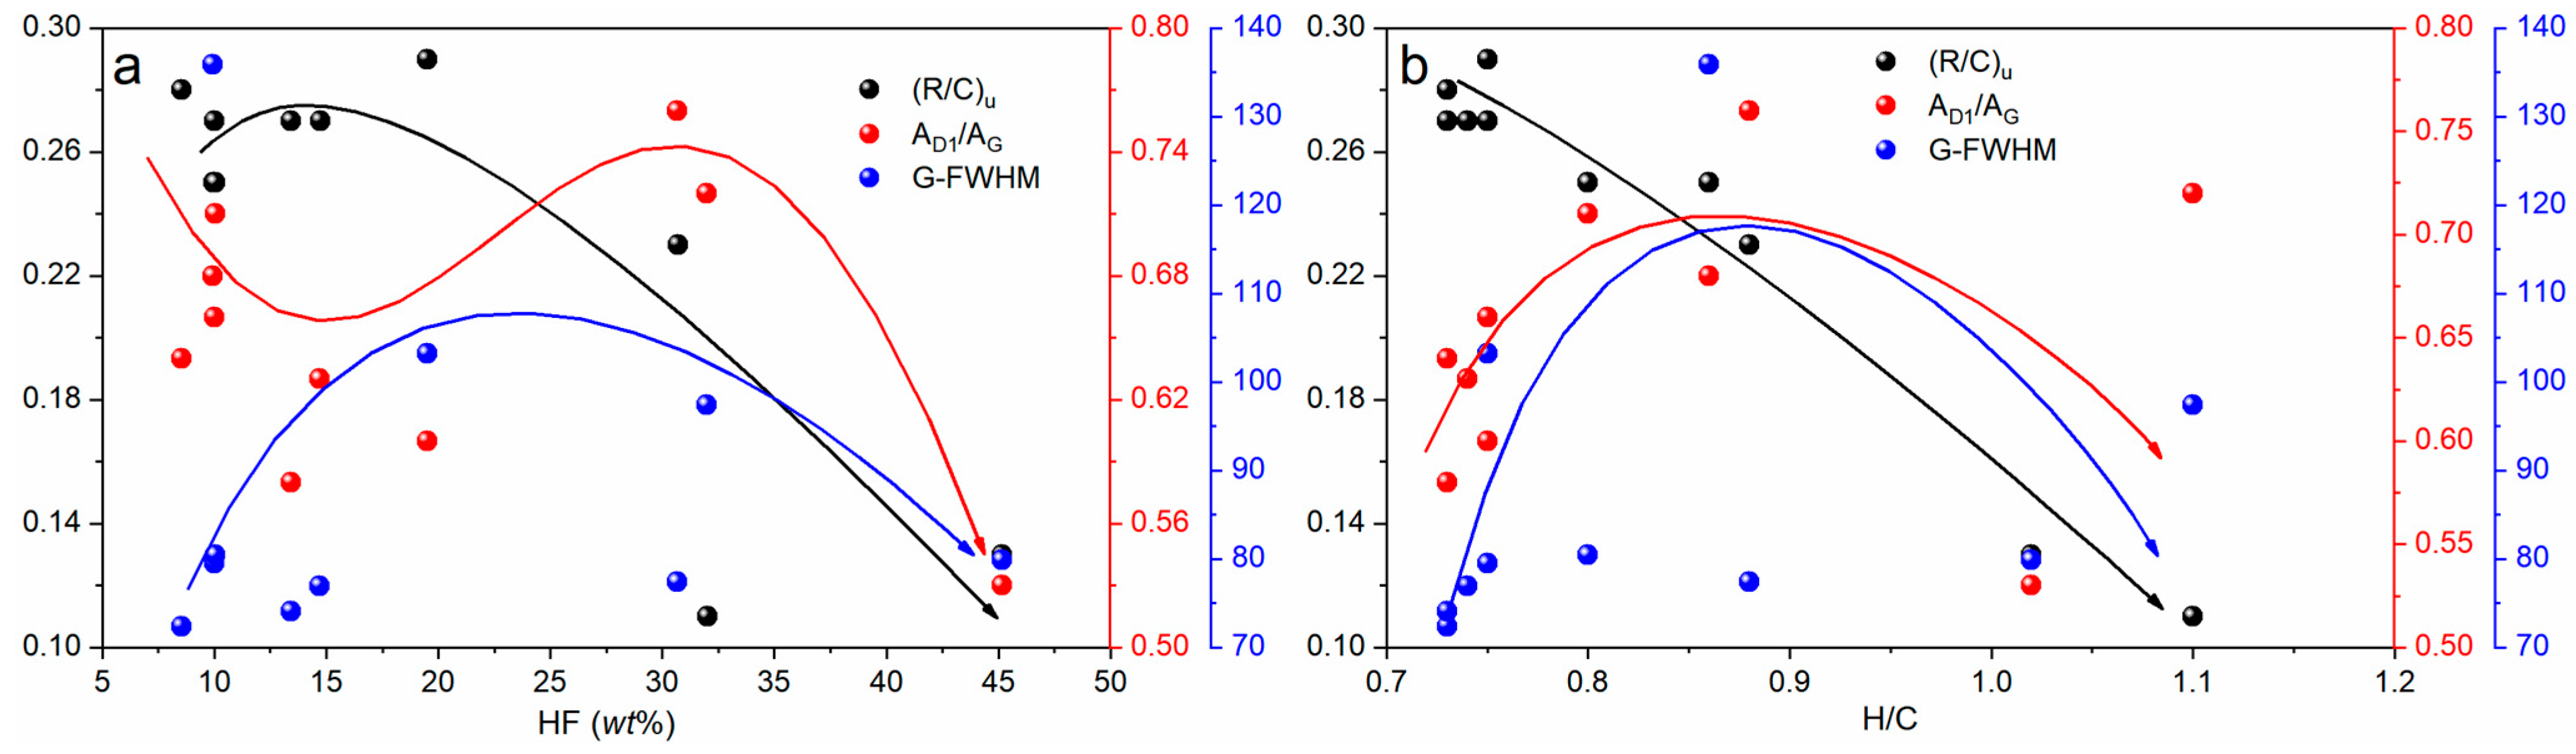
3. Discussion
4. Sample Collection and Experimental Analysis
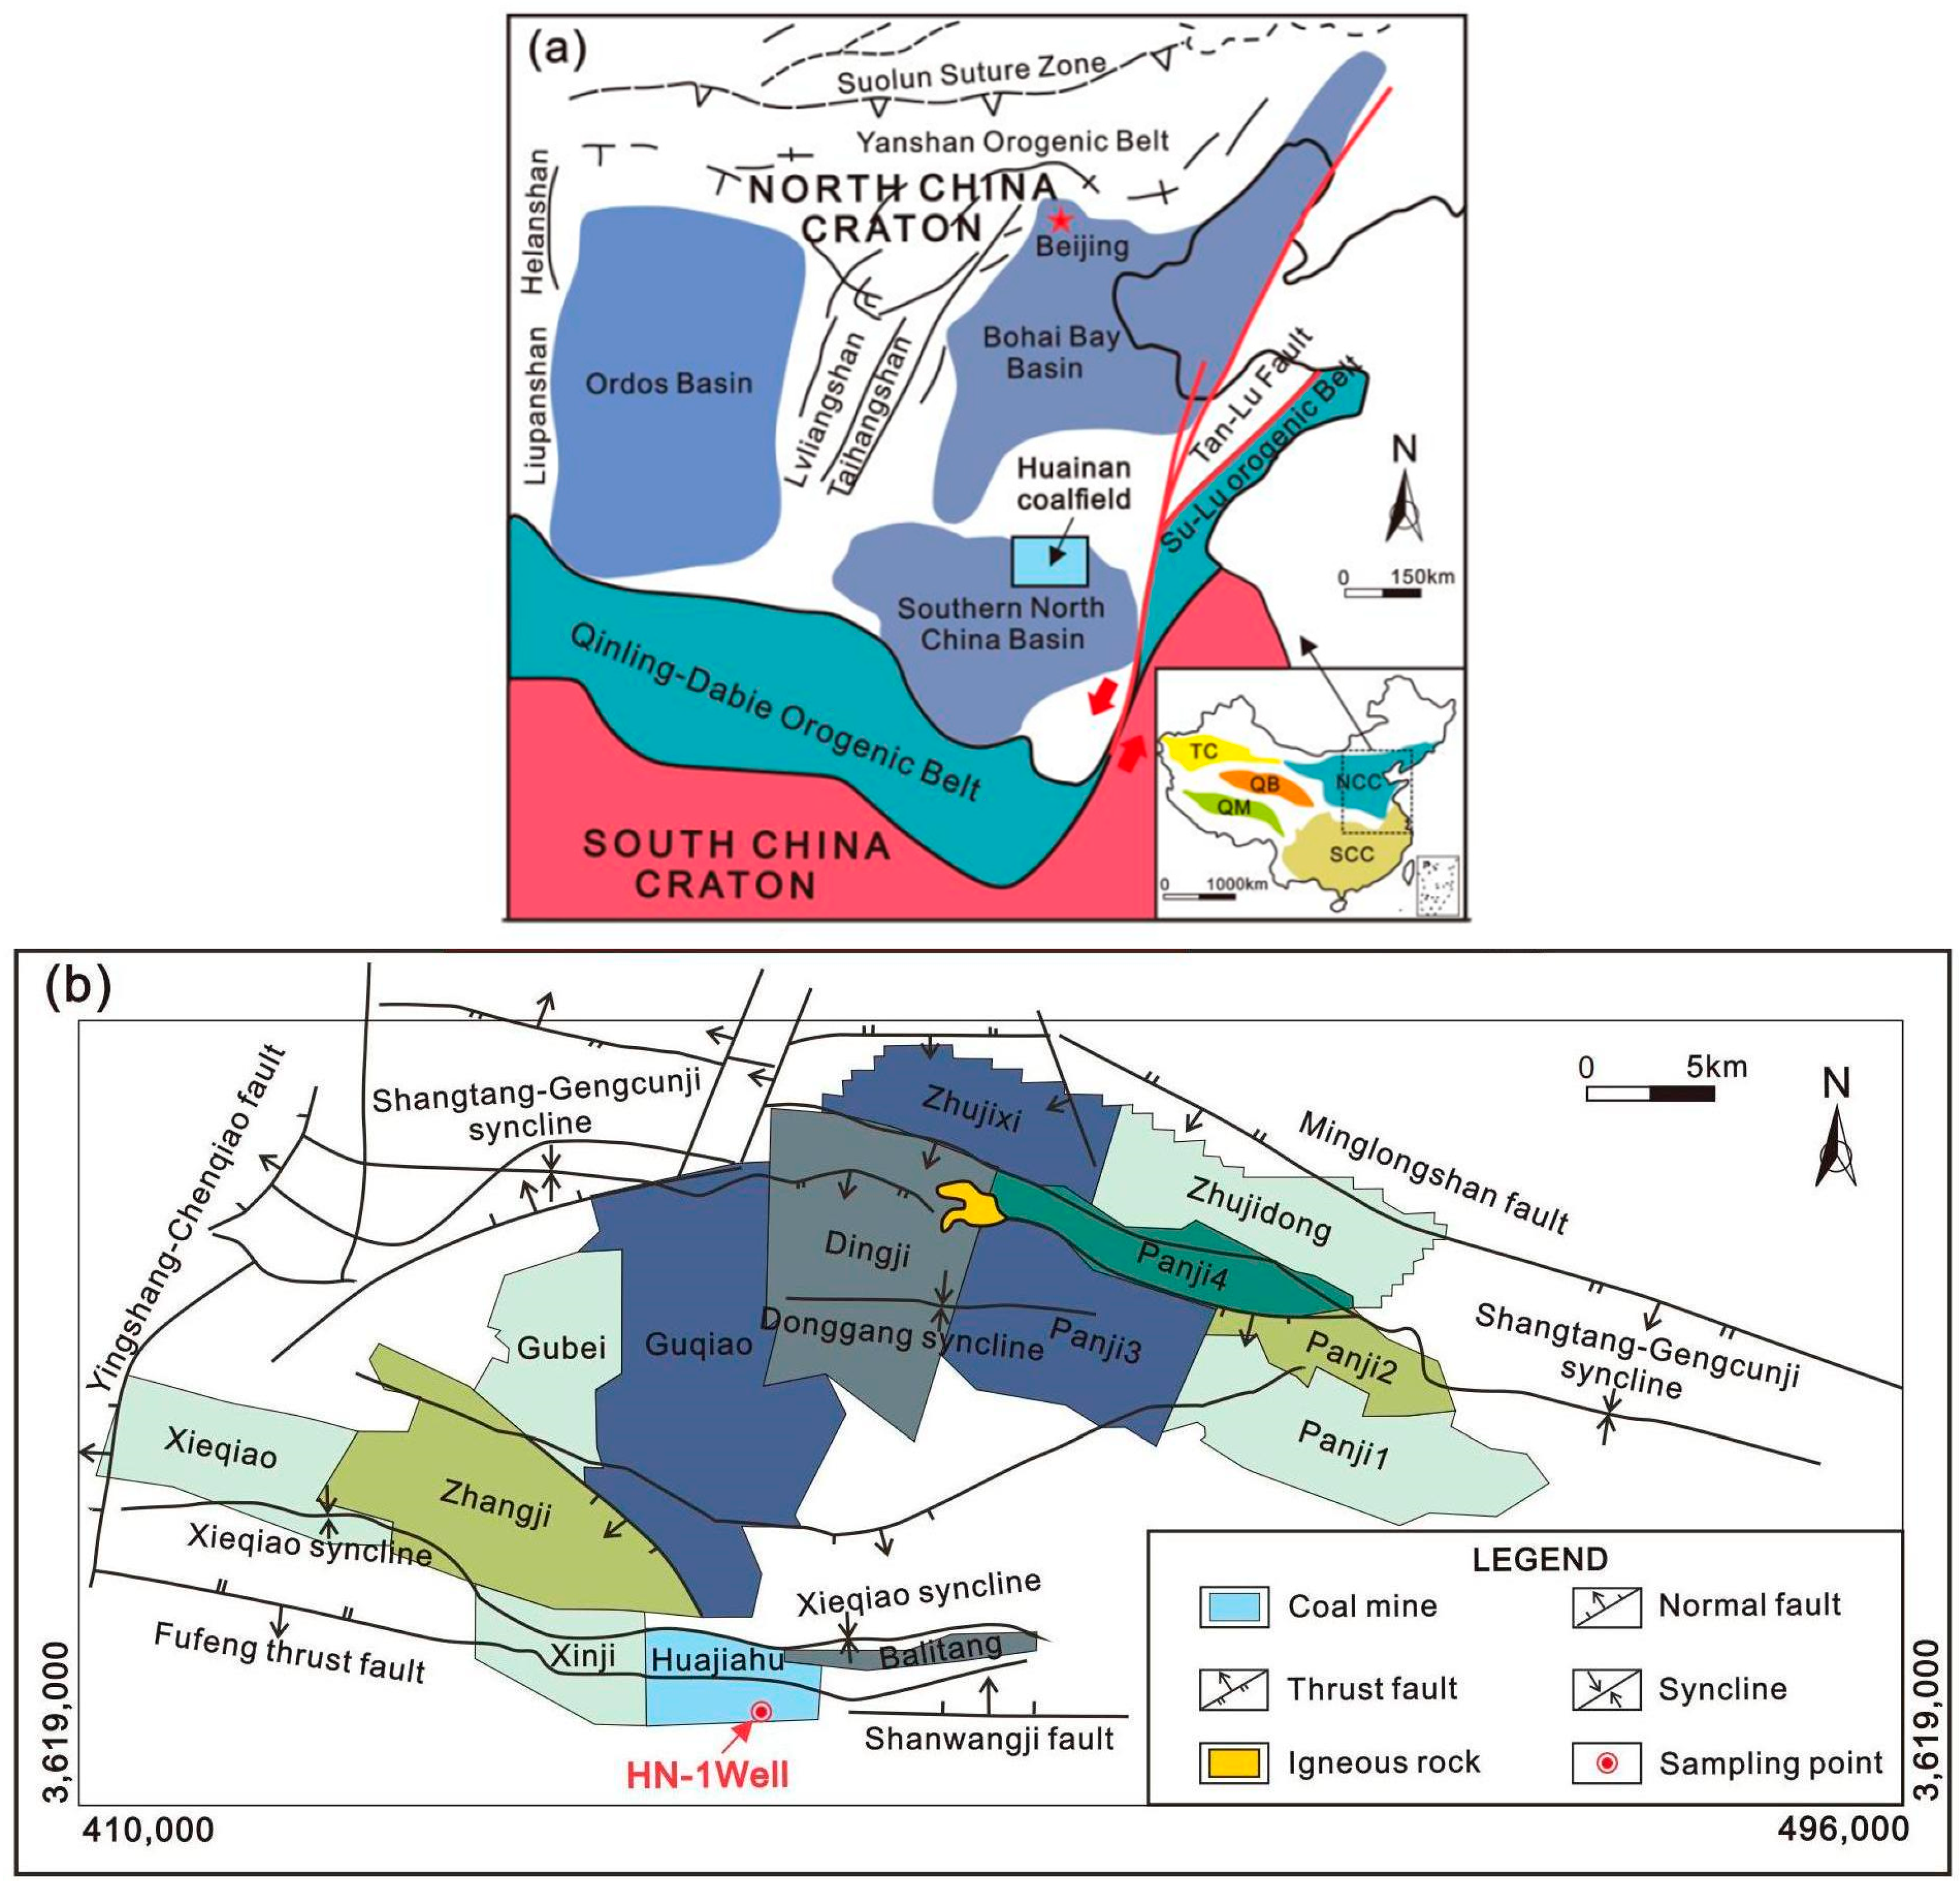
4.1. Geological Background
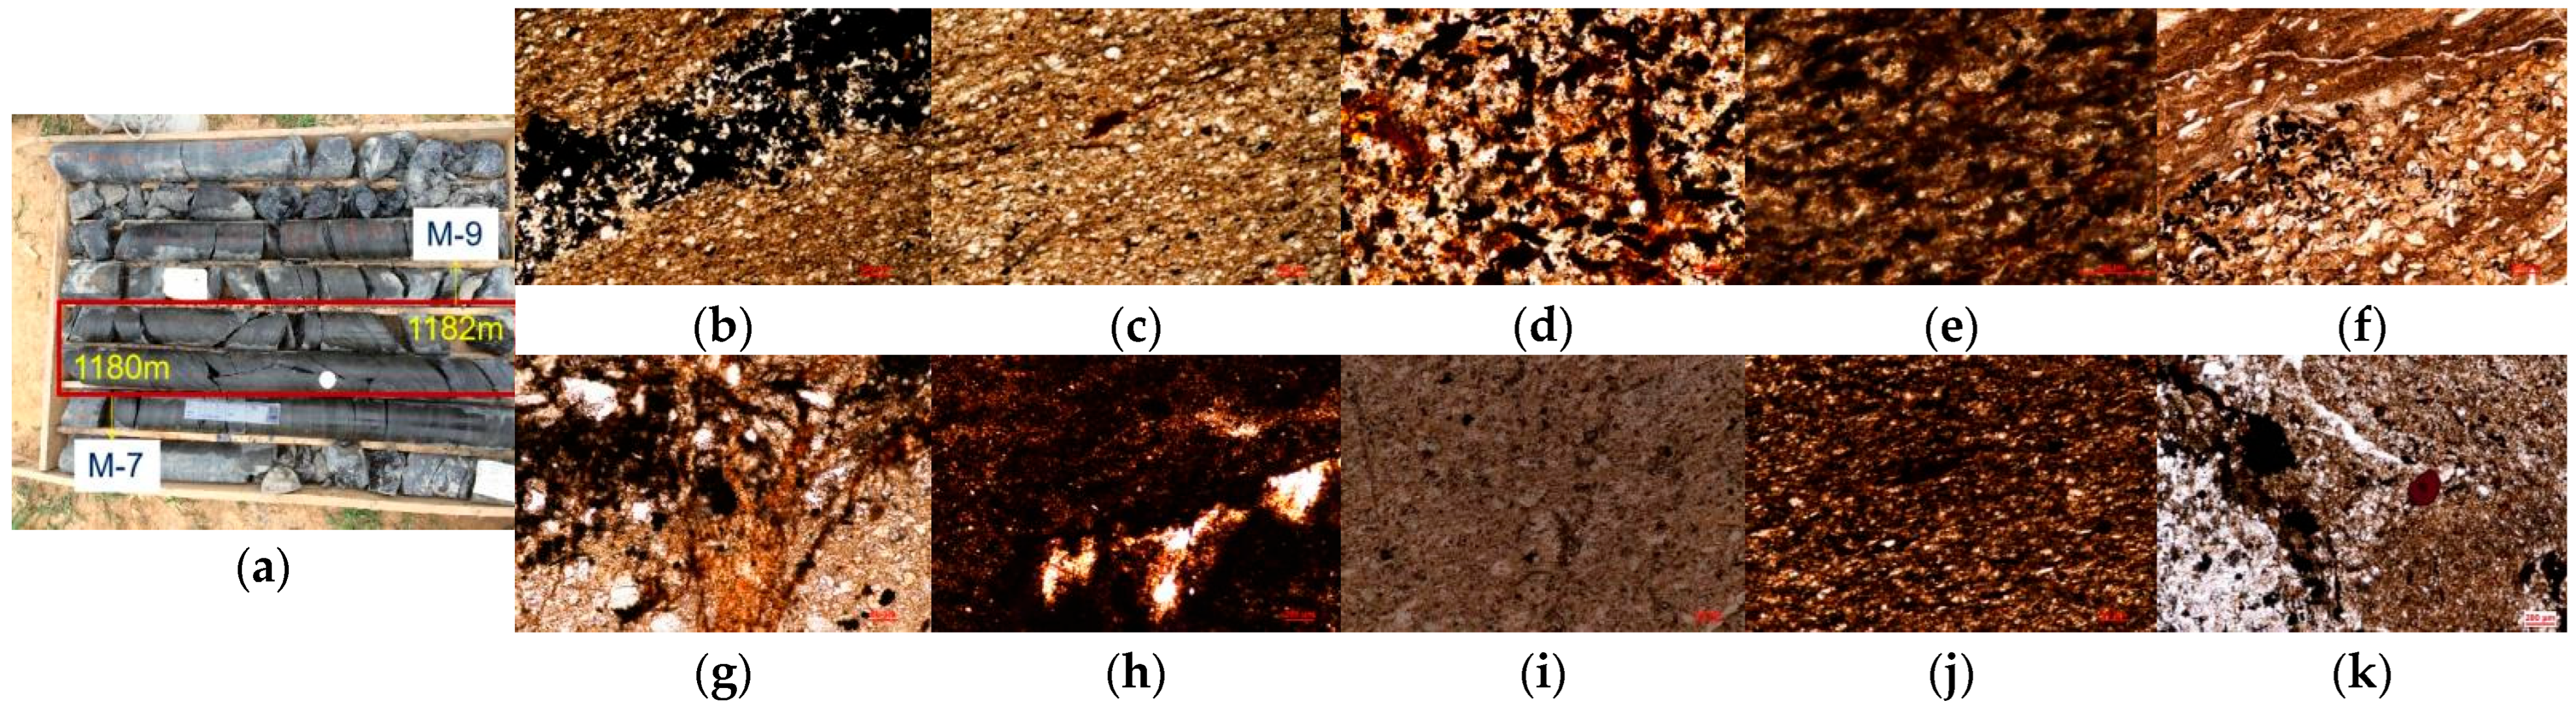
4.2. Sample Collection
4.3. Kerogen Extraction
4.4. Basic Properties of Kerogen
- (1)
- Basic calculation formula
- (2)
- Uncertainty analysis of category A
4.5. Preprocessing of Spectral Analysis Data
4.6. Infrared Spectrum Test and Analysis
4.6.1. Infrared Spectrum Test
4.6.2. Infrared Spectrum Analysis
4.6.3. Infrared Spectrum Fitting
- (1)
- Aromatic structural parameters
- (2)
- Aliphatic structural parameters
4.7. Raman Spectroscopy Testing and Analysis
4.7.1. Raman Spectroscopy Testing
4.7.2. Raman Spectroscopy Analysis
4.7.3. Raman Spectroscopy Fitting
5. Conclusions
Author Contributions
Funding
Institutional Review Board Statement
Informed Consent Statement
Data Availability Statement
Acknowledgments
Conflicts of Interest
References
- Vandenbroucke, M.; Largeau, C. Kerogen origin, evolution and structure. Org. Geochem. 2007, 38, 719–833. [Google Scholar] [CrossRef]
- Dow, W.G. Kerogen studies and geological interpretations. J. Geochem. Explor. 1977, 7, 79–99. [Google Scholar] [CrossRef]
- Pepper, A.S.; Corvi, P.J. Simple kinetic models of petroleum formation. Part I: Oil and gas generation from kerogen. Mar. Petrol. Geol. 1995, 12, 291–319. [Google Scholar] [CrossRef]
- Agrawal, V.; Sharma, S. Molecular characterization of kerogen and its implications for determining hydrocarbon potential, organic matter sources and thermal maturity in Marcellus Shale. Fuel 2018, 228, 429–437. [Google Scholar] [CrossRef]
- Ifticene, M.A.; Yuan, C.; Al-Muntaser, A.A. Behavior and kinetics of the conversion/combustion of oil shale and its components under air condition. Fuel 2022, 324, 124597. [Google Scholar] [CrossRef]
- Bolotov, A.V.; Yuan, C.; Varfolomeev, M.A.; Taura, U.H.; Al-Wahaibi, Y.M.; Minkhanov, I.F.; Derevyanko, V.K.; Al-Bahry, S.; Joshi, S.; Tazeev, A.R.; et al. In-situ combustion technique for developing fractured low permeable oil shale: Experimental evidence for synthetic oil generation and successful propagation of combustion front. Fuel 2023, 344, 127995. [Google Scholar] [CrossRef]
- Wang, Q.; Ye, J.; Yang, H. Chemical composition and structural characteristics of oil shales and their kerogens using Fourier Transform Infrared (FTIR) spectroscopy and solid-state 13C Nuclear Magnetic Resonance (NMR). Energy Fuels 2016, 30, 6271–6280. [Google Scholar] [CrossRef]
- Alstadt, K.N.; Katti, D.R.; Katti, K.S. An in situ FTIR step-scan photoacoustic investigation of kerogen and minerals in oil shale. Spectrochim. Acta Part A Mol. Biomol. Spectrosc. 2012, 89, 105–113. [Google Scholar] [CrossRef]
- Lis, G.P.; Mastalerz, M.; Schimmelmann, A. FTIR absorption indices for thermal maturity in comparison with vitrinite reflectance R0 in type-II kerogens from Devonian black shales. Org. Geochem. 2005, 36, 1533–1552. [Google Scholar] [CrossRef]
- Marshall, C.P.; Javaux, E.J.; Knoll, A.H. Combined micro-Fourier transform infrared (FTIR) spectroscopy and micro-Raman spectroscopy of Proterozoic acritarchs: A new approach to palaeobiology. Precambrian Res. 2005, 138, 208–224. [Google Scholar] [CrossRef]
- Yan, J.; Jiang, X.; Han, X. A TG–FTIR investigation to the catalytic effect of mineral matrix in oil shale on the pyrolysis and combustion of kerogen. Fuel 2013, 104, 307–317. [Google Scholar] [CrossRef]
- Tong, J.; Han, X.; Wang, S. Evaluation of structural characteristics of Huadian oil shale kerogen using direct techniques (solid-state 13C NMR, XPS, FT-IR, and XRD). Energy Fuels 2011, 25, 4006–4013. [Google Scholar] [CrossRef]
- Bustin, R.M.; Ross, J.V.; Rouzaud, J.N. Mechanisms of graphite formation from kerogen: Experimental evidence. Int. J. Coal Geol. 1995, 28, 1–36. [Google Scholar] [CrossRef]
- Hazra, B.; Varma, A.K.; Bandopadhyay, A.K. FTIR, XRF, XRD and SEM characteristics of Permian shales, India. J. Nat. Gas Sci. Eng. 2016, 32, 239–255. [Google Scholar] [CrossRef]
- Cartz, L.; Hirsch, P.B. Philos. A contribution to the structure of coals from X-ray diffraction studies. Philosophical Transactions of the Royal Society of London. Trans. R. Soc. Lond. 1960, 252, 557–602. [Google Scholar]
- Li, M.; Zeng, F.; Chang, H.; Bingshe, X.; Wang, W. Aggregate structure evolution of low-rank coals during pyrolysis by in-situ X-ray diffraction. Int. J. Coal Geol. 2013, 116, 262–269. [Google Scholar] [CrossRef]
- Khatibi, S.; Ostadhassan, M.; Tuschel, D. Raman spectroscopy to study thermal maturity and elastic modulus of kerogen. Int. J. Coal Geol. 2018, 185, 103–118. [Google Scholar] [CrossRef]
- Spötl, C.; Houseknecht, D.W.; Jaques, R.C. Kerogen maturation and incipient graphitization of hydrocarbon source rocks in the Arkoma Basin, Oklahoma and Arkansas: A combined petrographic and Raman spectrometric study. Org. Geochem. 1998, 28, 535–542. [Google Scholar] [CrossRef]
- Zeng, Y.; Wu, C. Raman and infrared spectroscopic study of kerogen treated at elevated temperatures and pressures. Fuel 2007, 86, 1192–1200. [Google Scholar] [CrossRef]
- Khatibi, S.; Ostadhassan, M.; Tuschel, D. Evaluating molecular evolution of kerogen by raman spectroscopy: Correlation with optical microscopy and rock-eval pyrolysis. Energies 2018, 11, 1406. [Google Scholar] [CrossRef]
- Wopenka, B.; Pasteris, J.D. Structural characterization of kerogens to granulite-facies graphite: Applicability of Raman microprobe spectroscopy. Am. Mineral. 1993, 78, 533–557. [Google Scholar]
- Cao, X.; Yang, J.; Mao, J. Characterization of kerogen using solid-state nuclear magnetic resonance spectroscopy: A review. Int. J. Coal Geol. 2013, 108, 83–90. [Google Scholar] [CrossRef]
- Burdelnaya, N.; Bushnev, D.; Mokeev, M. Experimental study of kerogen maturation by solid-state 13C NMR spectroscopy. Fuel 2014, 118, 308–315. [Google Scholar] [CrossRef]
- Kelemen, S.R.; Afeworki, M.; Gorbaty, M.L. Direct characterization of kerogen by X-ray and solid-state 13C nuclear magnetic resonance methods. Energy Fuels 2007, 21, 1548–1561. [Google Scholar] [CrossRef]
- Petsch, S.T.; Smernik, R.J.; Eglinton, T.I. A solid state 13C-NMR study of kerogen degradation during black shale weathering. Geochim. Cosmochim. Acta 2001, 65, 1867–1882. [Google Scholar] [CrossRef]
- Milliken, K.L.; Ko, L.T.; Pommer, M.J. SEM petrography of eastern Mediterranean sapropels: Analogue data for assessing organic matter in oil and gas shales. Sediment. Res. 2014, 84, 961–974. [Google Scholar] [CrossRef]
- Tian, S.; Dong, X.; Wang, T. Surface properties of organic kerogen in continental and marine shale. Langmuir 2018, 34, 13882–13887. [Google Scholar] [CrossRef]
- Zheng, H.; Shi, W.; Ding, D. Numerical simulation of in situ combustion of oil shale. Geofluids 2017, 1, 3028974. [Google Scholar] [CrossRef]
- Dun, W.; Guijian, L.; Ruoyu, S. Investigation of structural characteristics of thermally metamorphosed coal by FTIR spectroscopy and X-ray diffraction. Energy Fuels 2013, 27, 5823–5830. [Google Scholar] [CrossRef]
- Kelemen, S.R.; Fang, H.L. Maturity trends in Raman spectra from kerogen and coal. Energy Fuels 2001, 15, 653–658. [Google Scholar] [CrossRef]
- Mao, J.; Fang, X.; Lan, Y. Chemical and nanometer-scale structure of kerogen and its change during thermal maturation investigated by advanced solid-state 13C NMR spectroscopy. Geochim. Cosmochim. Acta 2010, 74, 2110–2127. [Google Scholar] [CrossRef]
- Liu, B.; Mastalerz, M.; Schieber, J. SEM petrography of dispersed organic matter in black shales: A review. Earth-Sci. Rev. 2022, 224, 103874. [Google Scholar] [CrossRef]
- Henry, G.D.; Jarvis, I.; Gillmore, G.; Stephenson, M. Raman spectroscopy as a tool to determine the thermal maturity of organic matter: Application to sedimentary, metamorphic and structural geology. Earth-Sci. Rev. 2019, 198, 102936. [Google Scholar] [CrossRef]
- He, X.; Liu, X.; Nie, B. FTIR and Raman spectroscopy characterization of functional groups in various rank coals. Fuel 2017, 206, 555–563. [Google Scholar] [CrossRef]
- Vandenbroucke, M. Kerogen: From types to models of chemical structure. Oil Gas Sci. Technol. 2003, 58, 243–269. [Google Scholar] [CrossRef]
- Behar, F.; Kressmann, S.; Rudkiewicz, J.L. Experimental simulation in a confined system and kinetic modelling of kerogen and oil cracking. Org. Geochem. 1992, 19, 173–189. [Google Scholar] [CrossRef]
- Wang, G.W.; Zhang, J.L.; Shao, J.G. Experimental and modeling studies on CO2 gasification of biomass chars. Energy 2016, 114, 143. [Google Scholar] [CrossRef]
- Jiang, J.; Yang, W.; Cheng, Y.; Liu, Z.; Zhang, Q.; Zhao, K. Molecular structure characterization of middle-high rank coal via XRD, Raman and FTIR spectroscopy: Implications for coalification. Fuel 2019, 239, 559–572. [Google Scholar] [CrossRef]
- Wu, D.; Chen, B.; Sun, R.J. Thermal behavior and Raman spectral characteristics of step-heating perhydrous coal: Implications for thermal maturity process. Anal. Appl. Pyrolysis 2017, 128, 143–155. [Google Scholar] [CrossRef]
- Liu, S.; Wang, W.; Zhu, W. Effects of indigenous microorganisms on the CO2 adsorption capacity of coal. Chem. Eng. J. 2024, 500, 156894. [Google Scholar] [CrossRef]
- Kouketsu, Y.; Mizukami, T.; Mori, H. A new approach to develop the Raman carbonaceous material geothermometer for low-grade metamorphism using peak width. Island Arc 2014, 23, 33–50. [Google Scholar] [CrossRef]
- Lünsdorf, N.K.; Dunkl, I.; Schmidt, B.C. Towards a higher comparability of geothermometric data obtained by Raman spectroscopy of carbonaceous material. Part I: Evaluation of biasing factors. Geostand. Geoanalytical Res. 2014, 38, 73–94. [Google Scholar] [CrossRef]
- Lünsdorf, N.K.; Dunkl, I.; Schmidt, B.C.; Rantitsch, G.; von Eynatten, H. Towards a higher comparability of geothermometric data obtained by Raman spectroscopy of carbonaceous material. Part 2: A revised geothermometer. Geostand. Geoanal. Res. 2017, 41, 593–612. [Google Scholar] [CrossRef]
- Lünsdorf, N.K.; Lünsdorf, A. Evaluating Raman spectra of carbonaceous matter by automated, iterative curve-fitting. Int. J. Coal Geol. 2016, 160–161, 51–62. [Google Scholar] [CrossRef]
- Zhou, Q.; Xiao, X.; Pan, L.; Tian, H. The relationship between micro-Raman spectral parameters and reflectance of solid bitumen. Int. J. Coal Geol. 2014, 121, 19–25. [Google Scholar] [CrossRef]
- Hara, H.; Kurihara, T.; Mori, H. Tectono-stratigraphy and low-grade metamorphism of Late Permian and Early Jurassic accretionary complexes within the Kurosegawa belt, Southwest Japan: Implications for mechanisms of crustal displacement within active continental margin. Tectonophysics 2013, 592, 80–93. [Google Scholar] [CrossRef]
- Beyssac, O.; Goffé, B.; Chopin, C.; Rouzaud, J.N. Raman spectra of carbonaceous material in metasediments: A new geothermometer. J. Metamorph. Geol. 2002, 20, 859–871. [Google Scholar] [CrossRef]
- Barker, C.E.; Pawlewicz, M.J. Calculation of vitrinite reflectance from thermal histories and peak temperatures-a comparison of methods; Vitrinite Reflectance as a Maturity Parameter, Applications and Limitations; American Chemical Society: Washington, DC, USA, 1994; pp. 216–229. [Google Scholar]
- Yu, K.; Gan, Y.; Ju, Y.; Shao, C.J. Influence of sedimentary environment on the brittleness of coal-bearing shale: Evidence from geochemistry and micropetrology. Pet. Sci. Eng. 2020, 185, 106603. [Google Scholar] [CrossRef]
- Liu, Y.; Liu, S.; Zhang, R. The molecular model of Marcellus shale kerogen: Experimental characterization and structure reconstruction. Int. J. Coal Geol. 2021, 246, 103833. [Google Scholar] [CrossRef]
- Durand, B. Kerogen: Insoluble Organic Matter from Sedimentary Rocks; Editions Technip: Paris, France, 1980; pp. 25–38. [Google Scholar]
- Fertl, W.H. Kerogen, insoluble organic matter from sedimentary rocks. Earth Sci. 1982, 18, 87–88. [Google Scholar] [CrossRef]
- GB/T 19143–2003; Analytical Method of Element for Carbon, Hydrogen and Oxygen in Rock Organics. General Administration of Quality Supervision, Inspection and Quarantine of the People’s Republic of China: Beijing, China, 2003.
- GB/T 16773–2008; Method of Preparing Coal Samples for the Coal Petrographic Analysis. General Administration of Quality Supervision, Inspection and Quarantine of the People’s Republic of China: Beijing, China, 2008.
- GB/T 19144–2010; Isolation Method for Kerogen from Sedimentary Rock. General Administration of Quality Supervision, Inspection and Quarantine of the People’s Republic of China: Beijing, China, 2010.
- Chen, Y.; Mastalerz, M.; Schimmelmann, A. Characterization of chemical functional groups in macerals across different coal ranks via micro-FTIR spectroscopy. Int. J. Coal Geol. 2012, 104, 22–33. [Google Scholar] [CrossRef]
- Lin, X.; Wang, C.; Ideta, K. Insights into the functional group transformation of a Chinese brown coal during slow pyrolysis by combining various experiments. Fuel 2014, 118, 257–264. [Google Scholar] [CrossRef]
- Xuguang, S. The investigation of chemical structure of coal macerals via transmitted-light FT-IR microspectroscopy. Spectrochim. Acta Part A Mol. Biomol. Spectrosc. 2005, 62, 557–564. [Google Scholar] [CrossRef] [PubMed]
- Kurig, H.; Russina, M.; Tallo, I. The suitability of infinite slit-shaped pore model to describe the pores in highly porous carbon materials. Carbon 2016, 100, 617–624. [Google Scholar] [CrossRef]
- Liu, J.; Luo, L.; Ma, J. Chemical properties of superfine pulverized coal particles. 3. Nuclear magnetic resonance analysis of carbon structural features. Energy Fuels 2016, 30, 6321–6329. [Google Scholar] [CrossRef]
- Zhou, F.; Liu, S.; Pang, Y.; Li, J.; Xin, H. Effects of coal functional groups on adsorption microheat of coal bed methane. Energy Fuels 2015, 29, 1550–1557. [Google Scholar] [CrossRef]
- Wang, S.; Tang, Y.; Schobert, H.H.; Guo, Y.N.; Su, Y. FTIR and 13C NMR investigation of coal component of late Permian coals from southern China. Energy Fuels 2011, 25, 5672–5677. [Google Scholar] [CrossRef]
- Ibarra, J.V.; Moliner, R.; Bonet, A.J. FTIR investigation on char formation during the early stages of coal pyrolysis. Fuel 1994, 73, 918–924. [Google Scholar] [CrossRef]
- Li, K.; Khanna, R.; Zhang, J.; Barati, M.; Liu, Z.; Xu, T.; Yang, T.; Sahajwalla, V. Comprehensive investigation of various structural features of bituminous coals using advanced analytical techniques. Energy Fuels 2015, 29, 7178–7189. [Google Scholar] [CrossRef]
- Abarghani, A.; Ardakani, O.H.; Hawthorne, S.B.; Smith, S.A.; Kurz, B.A.; Sorensen, J.A. Application of aromatic/aliphatic ratios analysis in revealing migration pathways in unconventional reservoirs: A case study of the Bakken Shale. Int. J. Coal Geol. 2022, 260, 104070. [Google Scholar] [CrossRef]
- Kastner, J.; Pichler, T.; Kuzmany, H.; Curran, S.; Blau, W.; Weldon, D.N.; Delamesiere, M.; Draper, S.; Zandbergen, H. Resonance Raman and infrared spectroscopy of carbon nanotubes. Chem. Phys. Lett. 1994, 221, 53–58. [Google Scholar] [CrossRef]
- Goodarzi, F.; Murchison, D.G. Optical properties of carbonized vitrinites. Fuel 1972, 51, 322–328. [Google Scholar] [CrossRef]
- Hinrichs, R.; Brown, M.T.; Vasconcellos, M.A.Z.; Abrashev, M.V.; Kalkreuth, W. Simple procedure for an estimation of the coal rank using micro-Raman spectroscopy. Int. J. Coal Geol. 2014, 136, 52–58. [Google Scholar] [CrossRef]
- Knight, D.S.; White, W.B. Characterization of diamond films by Raman spectroscopy. J. Mater. Res. 1989, 4, 385–393. [Google Scholar] [CrossRef]
- Dun, W.; Guijian, L.; Ruoyu, S. Influences of magmatic intrusion on the macromolecular and pore structures of coal: Evidences from Raman spectroscopy and atomic force microscopy. Fuel 2014, 119, 191–201. [Google Scholar] [CrossRef]
- Van Doorn, J.; Vuurman, M.A.; Tromp, P.J.J.; Stufkens, D.J.; Moulijn, J.A. Correlation between Raman spectroscopic data and the temperature-programmed oxidation reactivity of coals and carbons. Fuel Process. Technol. 1990, 24, 407–413. [Google Scholar] [CrossRef]
- Bar-ziv, E.; Zaida, A.; Salatino, P.; Senneca, O. Diagnostics of carbon gasification by Raman microprobe spectroscopy. Proc. Combust. Inst. 2000, 28, 2369–2374. [Google Scholar] [CrossRef]
- Eric, Q.; Rouzaud, J.N.; Bonal, L.; Montagnac, G. Maturation grade of coals as revealed by Raman spectroscopy: Progress and problems. Spectrochim. Acta Part A 2003, 61, 2368–2369. [Google Scholar]
- Jawhari, T.; Roid, A.; Casado, J. Raman spectroscopic characterization of some commercially available carbon black materials. Carbon 1995, 33, 1561–1565. [Google Scholar] [CrossRef]
- Chen, C.; Tang, Y.; Guo, X. Comparison of structural characteristics of high-organic-sulfur and low-organic-sulfur coal of various ranks based on FTIR and Raman spectroscopy. Fuel 2022, 310, 122362. [Google Scholar] [CrossRef]


| Sample Number | Element (wt%) | HF (wt%) | UA_HF | H/C | UA_H/C | O/C | UA_O/C | Ro (%) | Kerogen (g) | UA_Kerogen | ||||||||||
|---|---|---|---|---|---|---|---|---|---|---|---|---|---|---|---|---|---|---|---|---|
| Cdaf | UA_C | Hdaf | UA_H | Odaf | UA_O | Ndaf | UA_N | Sdaf | UA_S | |||||||||||
| M-1 | 62.15 | 0.44 | 3.91 | 0.22 | 7.46 | 0.33 | 4.03 | 0.02 | 2.95 | 0.04 | 19.50 | 0.35 | 0.75 | 0.42 | 0.09 | 0.01 | 1.15 | 0.01 | 12 | 0.33 |
| M-2 | 43.22 | 0.54 | 3.95 | 0.04 | 4.95 | 0.04 | 4.05 | 0.10 | 11.83 | 0.12 | 32.00 | 0.88 | 1.10 | 0.24 | 0.09 | 0.01 | 0.99 | 0.01 | 17 | 0.29 |
| M-3 | 68.88 | 1.47 | 4.19 | 0.13 | 8.24 | 0.17 | 4.23 | 0.16 | 5.92 | 0.06 | 8.54 | 0.22 | 0.73 | 0.56 | 0.09 | 0.01 | 1.06 | 0.02 | 14 | 0.27 |
| M-4 | 66.67 | 1.08 | 4.15 | 0.11 | 7.89 | 0.28 | 4.30 | 0.07 | 7.00 | 0.41 | 9.99 | 0.41 | 0.75 | 0.36 | 0.09 | 0.01 | 1.09 | 0.01 | 16 | 0.21 |
| M-5 | 59.97 | 0.64 | 3.62 | 0.44 | 8.04 | 0.03 | 4.54 | 0.07 | 10.40 | 0.28 | 13.43 | 0.30 | 0.73 | 0.48 | 0.10 | 0.01 | 1.08 | 0.01 | 32 | 0.48 |
| M-6 | 64.13 | 0.80 | 4.58 | 0.09 | 9.33 | 0.23 | 4.58 | 0.17 | 7.43 | 0.05 | 9.95 | 0.32 | 0.86 | 0.23 | 0.11 | 0.02 | 1.05 | 0.02 | 18 | 0.35 |
| M-7 | 67.16 | 0.38 | 4.48 | 0.10 | 9.85 | 0.21 | 4.54 | 0.11 | 3.92 | 0.71 | 10.05 | 0.74 | 0.80 | 0.18 | 0.11 | 0.01 | 1.14 | 0.02 | 15 | 0.18 |
| M-8 | 25.82 | 0.34 | 2.19 | 0.13 | 10.24 | 0.17 | 3.50 | 0.09 | 13.08 | 0.16 | 45.17 | 0.92 | 1.02 | 0.84 | 0.30 | 0.02 | 1.12 | 0.03 | 11 | 0.16 |
| M-9 | 61.54 | 0.55 | 3.81 | 0.08 | 7.44 | 0.31 | 4.11 | 0.12 | 8.38 | 0.27 | 14.72 | 0.25 | 0.74 | 0.32 | 0.09 | 0.01 | 1.07 | 0.02 | 22 | 0.41 |
| M-10 | 40.41 | 0.21 | 2.96 | 0.20 | 6.75 | 0.14 | 3.75 | 0.26 | 15.44 | 0.31 | 30.69 | 0.92 | 0.88 | 0.40 | 0.13 | 0.03 | 1.13 | 0.04 | 18 | 0.36 |
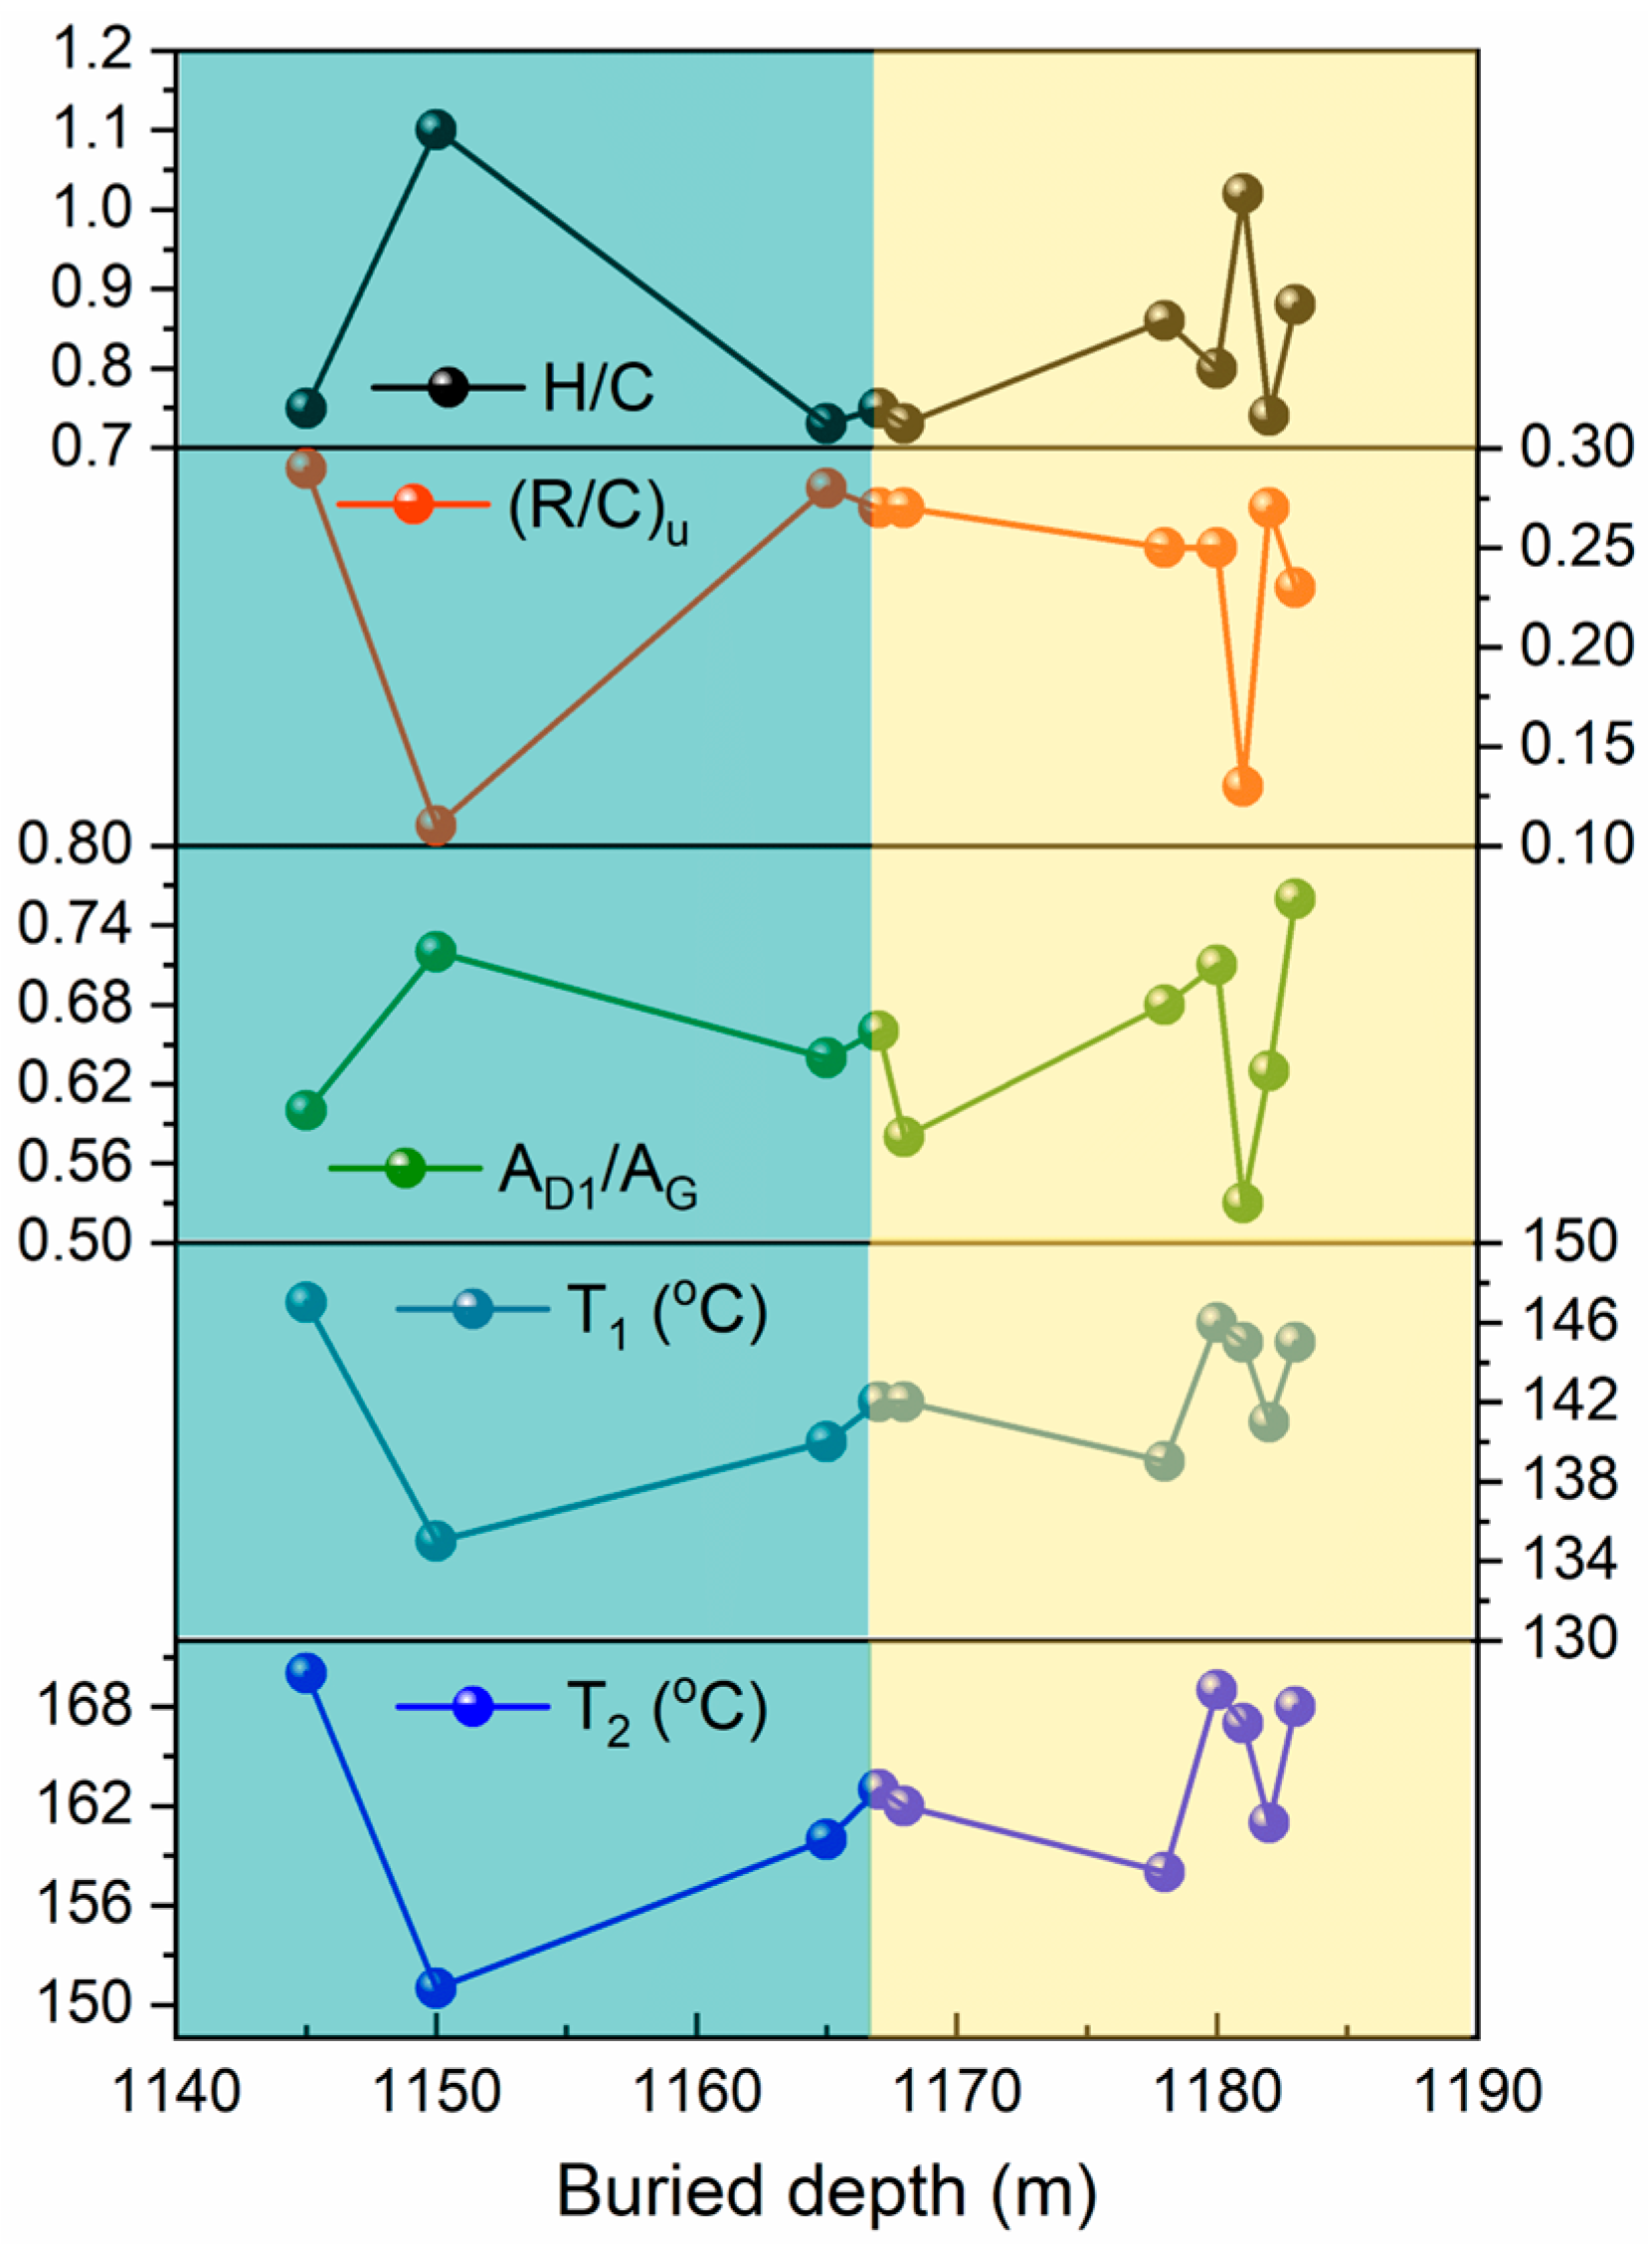
| Sample | Hal/H | fa(FTIR) | (R/C)u | CH2/CH3 | Aar/Aal |
|---|---|---|---|---|---|
| M-1 | 0.80 | 0.68 | 0.29 | 1.62 | 0.26 |
| M-2 | 0.55 | 0.67 | 0.11 | 2.24 | 0.67 |
| M-3 | 0.74 | 0.71 | 0.28 | 1.75 | 0.43 |
| M-4 | 0.72 | 0.71 | 0.27 | 1.52 | 0.38 |
| M-5 | 0.68 | 0.73 | 0.27 | 1.78 | 0.52 |
| M-6 | 0.76 | 0.65 | 0.25 | 1.97 | 0.30 |
| M-7 | 0.70 | 0.70 | 0.25 | 2.17 | 0.45 |
| M-8 | 0.50 | 0.72 | 0.13 | 2.03 | 0.72 |
| M-9 | 0.69 | 0.72 | 0.27 | 1.81 | 0.50 |
| M-10 | 0.70 | 0.67 | 0.23 | 2.41 | 0.41 |
| No. | Peak | Position (cm−1) | Area | FWHM (cm−1) | θ (cm−1) | AD1/AG | AD2/AG | AD4/AG |
|---|---|---|---|---|---|---|---|---|
| M-3 | G | 1562.78 | 5349.68 | 72.38 | 264.01 | 0.64 | 1.43 | |
| D1 | 1298.77 | 3431.70 | 120.29 | |||||
| D4 | 1210.00 | 7636.24 | 412.14 | |||||
| M-5 | G | 1565.95 | 5863.45 | 74.10 | 260.39 | 0.58 | 0.47 | |
| D1 | 1305.56 | 3404.93 | 117.75 | |||||
| D2 | 1506.05 | 2777.89 | 112.30 | |||||
| M-6 | G | 1592.36 | 12141.34 | 135.89 | 264.74 | 0.68 | 0.26 | |
| D1 | 1327.62 | 8199.13 | 157.18 | |||||
| D4 | 1186.33 | 3200.46 | 302.53 | |||||
| M-9 | G | 1567.72 | 6074.16 | 76.95 | 264.15 | 0.63 | 0.66 | |
| D1 | 1303.57 | 3868.11 | 162.29 | |||||
| D2 | 1490.62 | 4040.62 | 233.54 |
| Sample Number | RO | T1 (°C) | T2 (°C) |
|---|---|---|---|
| M-1 | 1.15 | 147 | 170 |
| M-2 | 0.99 | 135 | 151 |
| M-3 | 1.06 | 140 | 160 |
| M-4 | 1.09 | 142 | 163 |
| M-5 | 1.08 | 142 | 162 |
| M-6 | 1.05 | 139 | 158 |
| M-7 | 1.14 | 146 | 169 |
| M-8 | 1.12 | 145 | 167 |
| M-9 | 1.07 | 141 | 161 |
| M-10 | 1.13 | 145 | 168 |
| No. | Band Region (cm−1) | Functional Group | References |
|---|---|---|---|
| 1 | 3450~3300 | Hydrogen-bonded OH | [56,57] |
| 2 | 3050~3030 | CHx stretching vibration of aromatic ring | [57,58] |
| 3 | 3100~3000 | Aromatic CHx stretching | [56] |
| 4 | 2975~2955 | Asymmetric telescopic vibration of aliphatic CH3 | [29,56] |
| 5 | 2925~2919 | Asymmetric telescopic vibration of aliphatic CH2 | [29,56] |
| 7 | 1800~1650 | Oxygenated groups | [58] |
| 8 | 1650~1410 | Aromatic C=C ring stretching | [57] |
| 9 | 1300~1000 | Expansion deformation of phenolic resin (C-O-C) | [29,57] |
| 10 | 900~700 | Out-of-plane bending vibration of aromatic bond (C-H)ar | [56,57] |
| Band | Raman Shift (cm−1) | Vibration Mode |
|---|---|---|
| G | ~1590 cm−1 | A stretching vibration mode with E2g symmetry in the aromatic layers of the graphite crystalline [71] |
| D1 | ~1350 cm−1 | A graphitic lattice vibration mode with A1g symmetry in-plane imperfections [71,72] |
| D2 | ~1560 cm−1 | A lattice vibration analogous to E2g symmetry of the G band but involving graphene layers [73,74] |
| D4 | ~1208 cm−1 | sp3-sp2 mixed sites at the periphery of crystallites or to C-C and C=C stretching vibrations of polyene-like structures [73,74] |
Disclaimer/Publisher’s Note: The statements, opinions and data contained in all publications are solely those of the individual author(s) and contributor(s) and not of MDPI and/or the editor(s). MDPI and/or the editor(s) disclaim responsibility for any injury to people or property resulting from any ideas, methods, instructions or products referred to in the content. |
© 2025 by the authors. Licensee MDPI, Basel, Switzerland. This article is an open access article distributed under the terms and conditions of the Creative Commons Attribution (CC BY) license (https://creativecommons.org/licenses/by/4.0/).
Share and Cite
Wu, D.; Wang, C.; Liang, W.; Gao, X. Combining Fourier Transform Infrared and Raman Spectroscopy to Characterize Kerogen Molecular Structures: Insights into Their Thermal Maturity. Int. J. Mol. Sci. 2025, 26, 2696. https://doi.org/10.3390/ijms26062696
Wu D, Wang C, Liang W, Gao X. Combining Fourier Transform Infrared and Raman Spectroscopy to Characterize Kerogen Molecular Structures: Insights into Their Thermal Maturity. International Journal of Molecular Sciences. 2025; 26(6):2696. https://doi.org/10.3390/ijms26062696
Chicago/Turabian StyleWu, Dun, Chenglong Wang, Wenxu Liang, and Xia Gao. 2025. "Combining Fourier Transform Infrared and Raman Spectroscopy to Characterize Kerogen Molecular Structures: Insights into Their Thermal Maturity" International Journal of Molecular Sciences 26, no. 6: 2696. https://doi.org/10.3390/ijms26062696
APA StyleWu, D., Wang, C., Liang, W., & Gao, X. (2025). Combining Fourier Transform Infrared and Raman Spectroscopy to Characterize Kerogen Molecular Structures: Insights into Their Thermal Maturity. International Journal of Molecular Sciences, 26(6), 2696. https://doi.org/10.3390/ijms26062696