Article

Enhancing HCV NS3 Inhibitor Classification with Optimized Molecular Fingerprints Using Random Forest

Department of Computer Engineering, Faculty of Engineering and Architecture, Nevsehir Haci Bektas Veli University, 50300 Nevşehir, Turkey
Int. J. Mol. Sci. 2025, 26(6), 2680; https://doi.org/10.3390/ijms26062680
Submission received: 8 February 2025 / Revised: 9 March 2025 / Accepted: 11 March 2025 / Published: 17 March 2025
(This article belongs to the Special Issue Techniques and Strategies in Drug Design and Discovery, 2nd Edition)

Abstract

:
The classification of Hepatitis C virus (HCV) NS3 inhibitors is essential for identifying potential antiviral agents through computational methods. This study aims to develop an optimized machine learning (ML) model using random forest (RF) and molecular fingerprints to accurately classify HCV NS3 inhibitors. A dataset of 965 molecules was retrieved from the ChEMBL database, and 290 bioactive compounds were selected for model training. Twelve molecular fingerprint descriptors were tested, and the CDK graph-only fingerprint yielded the best performance. In addition to RF, performance comparisons of other classifiers such as instance-based k-nearest neighbor (IBk), logistic regression (LR), AdaBoost, and OneR were conducted using WEKA with various molecular fingerprint descriptors. The optimized RF model achieved an accuracy of 89.6552%, a mean absolute error (MAE) of 0.2114, a root mean square error (RMSE) of 0.3304, and a Matthews correlation coefficient (MCC) of 0.7950 on the test set. These results highlight the effectiveness of optimized molecular fingerprints in enhancing virtual screening (VS) for HCV inhibitors. This approach offers a data-driven method for drug discovery.

1. Introduction

Globally, hepatitis C affects 50 million people chronically, with 1 million new cases annually [1], highlighting its recognition as a severe public health issue and driving ongoing clinical research into direct-acting antivirals to combat the infection [2]. Current medicinal chemistry theory and practice focus on possible therapeutic compounds’ physicochemical qualities, which determine attrition [3]. Understanding the impact of physicochemical qualities on the biological activity of compounds requires a thorough investigation of their chemical functions and biological activity [4]. Advances in machine learning (ML) and data analysis have made drug discovery processes more efficient by providing new research opportunities and treatment options in bioinformatics. Methods such as in silico drug discovery, using molecular simulation and artificial intelligence, help solve the problems of the high cost and low success rate of traditional methods [5]. Computational methods are essential in interdisciplinary research for discovering new drugs. To make a genuine difference in drug discovery, it is vital to understand the science underpinning computational tools, both the limits and the potential they provide [4,6]. QSAR is a computational modeling technique that identifies significant correlations between a molecule’s structure and its biological function. Originating over a century ago, QSAR has become an essential predictive tool in pharmaceuticals [7]. The identification or encoding of a chemical structure by means of molecular descriptors, therefore, is a critical point in QSAR. Numerous cheminformatics software packages have been developed, which allow one to calculate thousands of molecular descriptors [8].
Many VS methods have been created with varying molecular representations, speeds, and accuracy [9]. Comparative studies have shown that ligand-based methods, especially 2D fingerprints, are faster and more effective in terms of hit enrichment than 3D shape similarity and structure-based methods, making them the preferred choice in VS workflows [10]. The application of different molecular descriptors yields an in silico model with outstanding performance [11] Thus, the objective of this investigation is to examine the impact of molecular fingerprints on the forecasting of bioactivity of hepatitis C virus NS3 inhibitors. The advantageous functions of QSAR models have led to the utilization of numerous HCV inhibitors as datasets to establish predictive models that facilitate rational drug design. A collection of 290 inhibitors possessing established IC50 values against HCV NS3 was compiled for the purposes of this study. Predictive models were constructed using the RF algorithm. The resulting QSAR model was adept at accurately classifying compounds as either “active” or “inactive” against the HCV NS3, as demonstrated by the accuracy, MAE, RMSE, and MCC, which proved to be statistically proficient. Consequently, this knowledge has the potential to be employed in the development of more potent and specific drugs aimed at combating HCV. The contribution of this work is to enhance the hepatitis C Virus NS3 inhibitor classification using molecular fingerprint descriptors and ML models.
A well-balanced dataset with appropriate activity labels is crucial for the reliable classification of HCV NS3 inhibitors. The selection of computational tools, including ML algorithms and molecular fingerprints, is guided by nature and distribution of available data. In this study, the dataset was carefully curated to ensure the accurate assignment of bioactivity labels. This approach helps reduce potential biases in model training. A systematic evaluation of 12 molecular fingerprint descriptors was conducted to determine their effectiveness for classification. Through this analysis, the CDK graph-only fingerprint was identified as the most effective. This finding highlights the importance of selecting the right molecular representation. The optimized RF model achieves high accuracy and strong performance metrics. These results emphasize the importance of data quality and descriptor selection in enhancing predictive models for virtual screening. These findings show that using well-organized datasets and suitable computational methods is important for improving drug discovery.

Literature Review

Considerable literature has been dedicated to exploring the current outlook of hepatitis C Virus NS3 inhibitors, encompassing various aspects such as the discovery of novel inhibitors and the understanding of NS3 protein function.
Musmuca et al. [12] demonstrated how a full computational method and biological research identified new molecular scaffolds for NS5B polymerase. Wang et al. [13] created classification models using the support vector machine (SVM) method. Structural analysis revealed a unique substructure such as cyclopropyl with the acylsulfonamide group found in active inhibitors. SVM models, especially Model 2B, which contains 11 descriptors representing basic structural information, showed strong classification ability. The SVM model (Model 2B) of this study may be valuable in VS to discover new HCV NS3 protease inhibitors by utilizing defined characteristic substructures. A research study [14], aimed at developing inhibitors for the HCV NS3/4A protease, a critical drug target in Hepatitis C virus, was conducted. These inhibitors exhibited effectiveness against both the wildtype and mutant forms of the protease, with compound 22 displaying the highest activity. Notably, these inhibitors demonstrated specificity towards the viral protease and showcased a therapeutic range in cell viability assays. In comparison, the approved drug simeprevir exhibited decreased potency against the mutant enzyme in comparison to the wildtype. The research conducted by Zhou et al. [15] revealed that HCV infection leads to a decrease in PPM1A levels in hepatoma cells through the action of NS3. Expression of PPM1A is notably reduced in tumor tissues of hepatocellular carcinoma (HCC). NS3 interacts with PPM1A, facilitating its degradation via ubiquitination. In their study, Iwai et al. [16] investigated the role of the NS3 protein. Through various experiments, the researchers demonstrated that NS3 interacts with the SRCAP and p400 proteins. Significantly, the ability of NS3 to activate the notch-mediated transcription of the Hes-1 promoter was markedly reduced when both SRCAP and p400 were silenced. Kamboj et al.’s study [17] discussed the development of an “Anti-HCV” platform that used ML. The models performed strongly on cross validation and independent validation datasets, and potential repurposed drugs were identified and further validated through molecular docking. These findings suggest that the identified drugs have the potential to be useful in the development of antiviral drugs against HCV. Hentabli et al.’s study [18] discussed the concept of molecular similarity in drug design based on the idea that structurally similar molecules will have similar properties. Graphic-based molecular descriptors demonstrated their superiority in identifying various datasets by comparing them with various standard descriptors in simulated virtual scan experiments and outperformed the previously proposed LWDOSM and Lingo-DOSM descriptors. Gong et al., [19] in their study for early prediction of nephrotoxicity, manually collected 777 valid drug data and created a classification model with different ML algorithms.
Inspired by these studies that described and considered the current need, it is assumed that the classification of the biological activity of HCV NS3 inhibitors can be predicted using the most appropriate ML method and molecular fingerprint descriptors sets.

2. Results and Discussion

In this section, we present a detailed overview of the results obtained from our proposed model. We begin by describing the experimental setup and outlining the process of dataset collection and preparation. Following this, we provide a comprehensive analysis of the experimental results, highlighting the performance metrics and the effectiveness of the proposed approach.

2.1. Experimental Setup

The implementation was carried out using WEKA 3.8.6 on a Windows 10 Pro system equipped with an Intel i9 core processor. The system operates on a 64-bit architecture, featuring 128 GB of RAM and an NVIDIA GeForce RTX 3080 GPU. All experiments were conducted within the WEKA environment, ensuring consistency and reproducibility throughout the evaluation process.

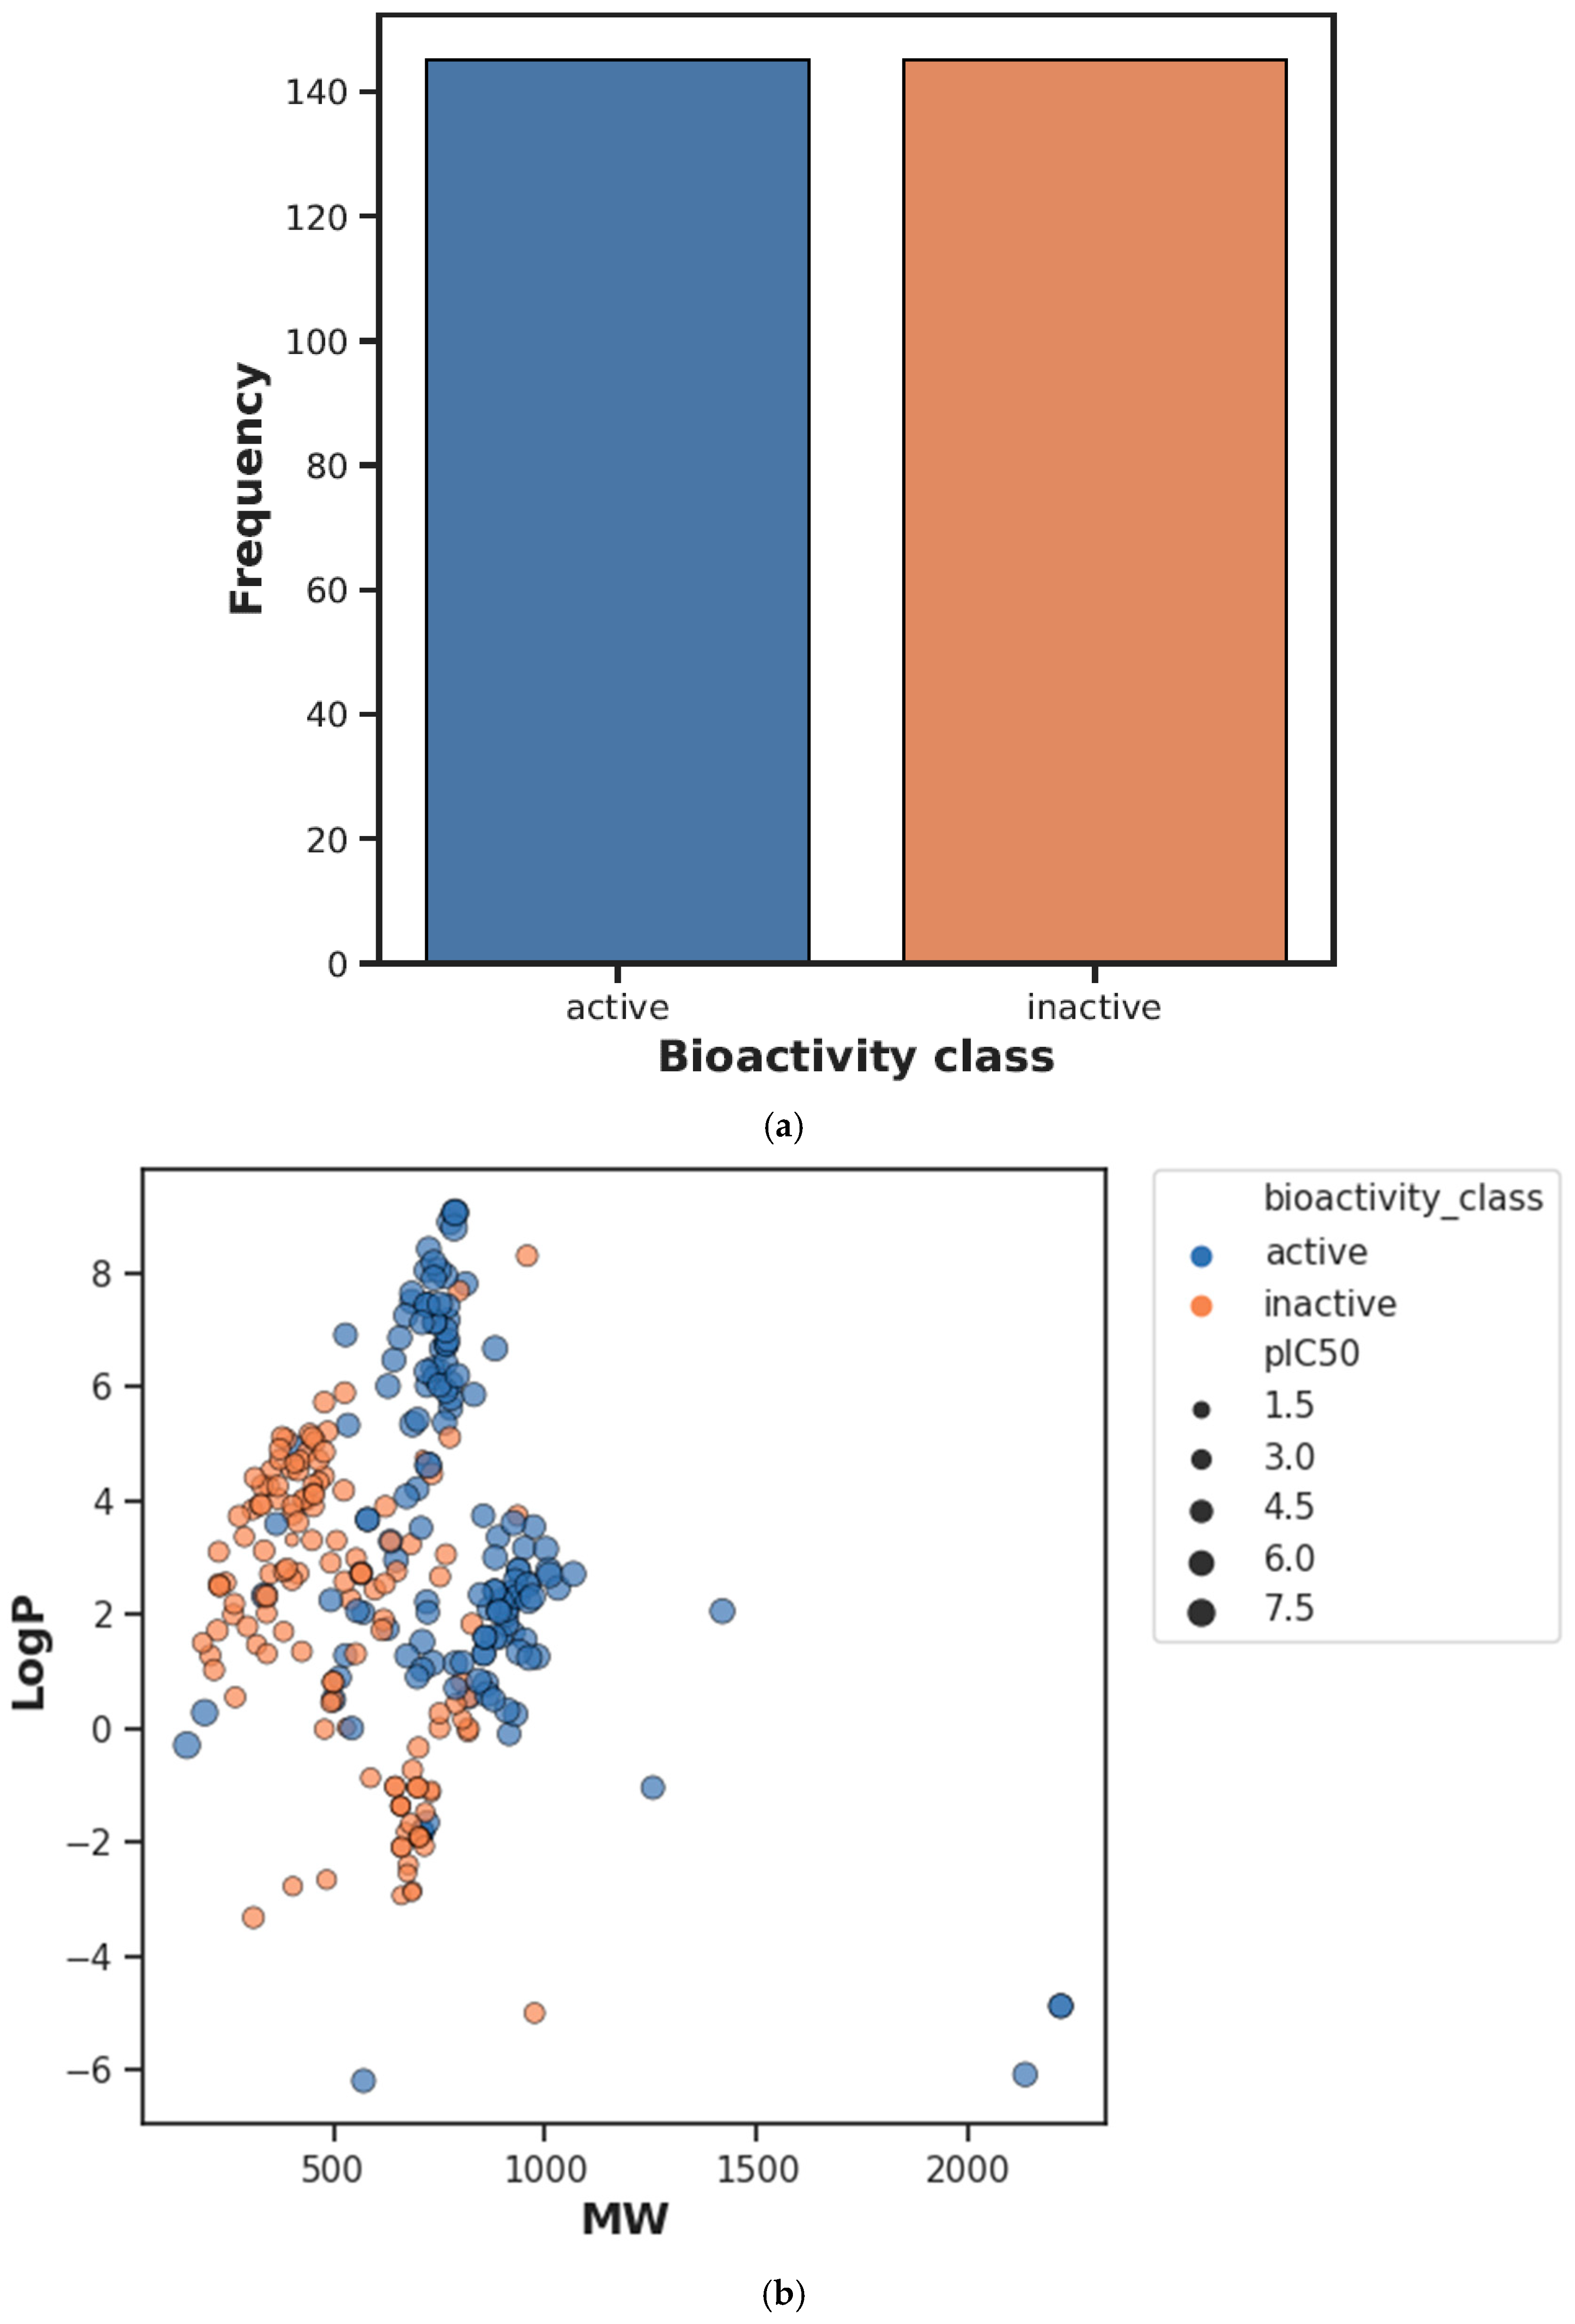
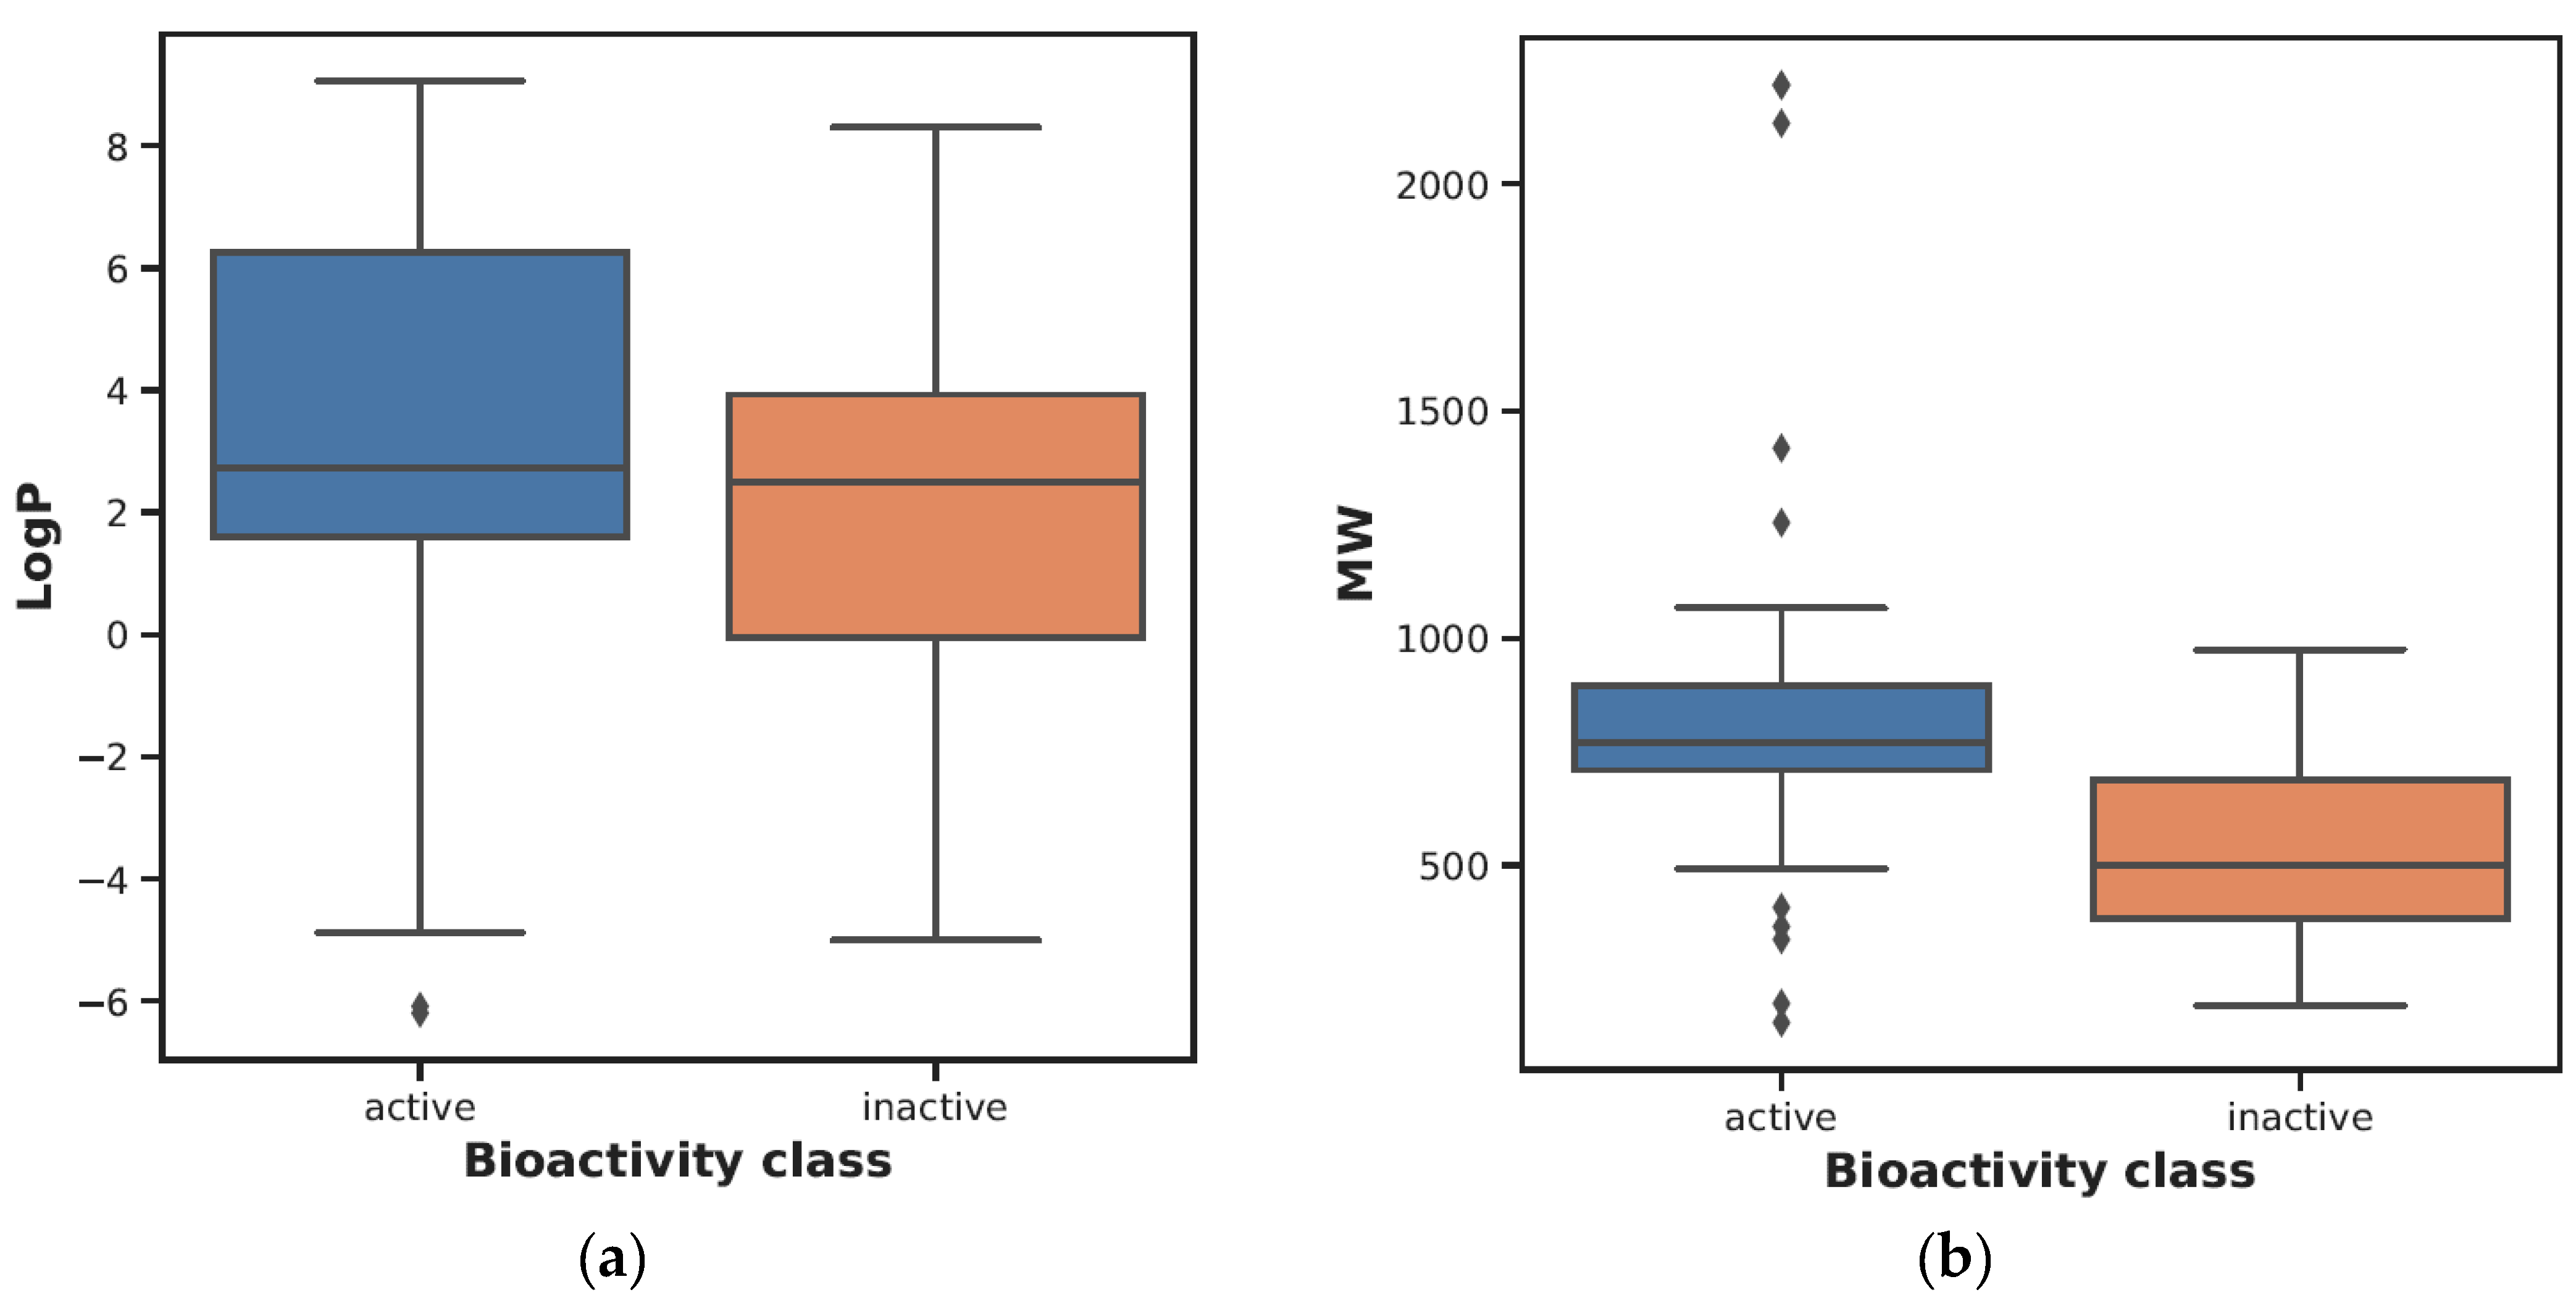
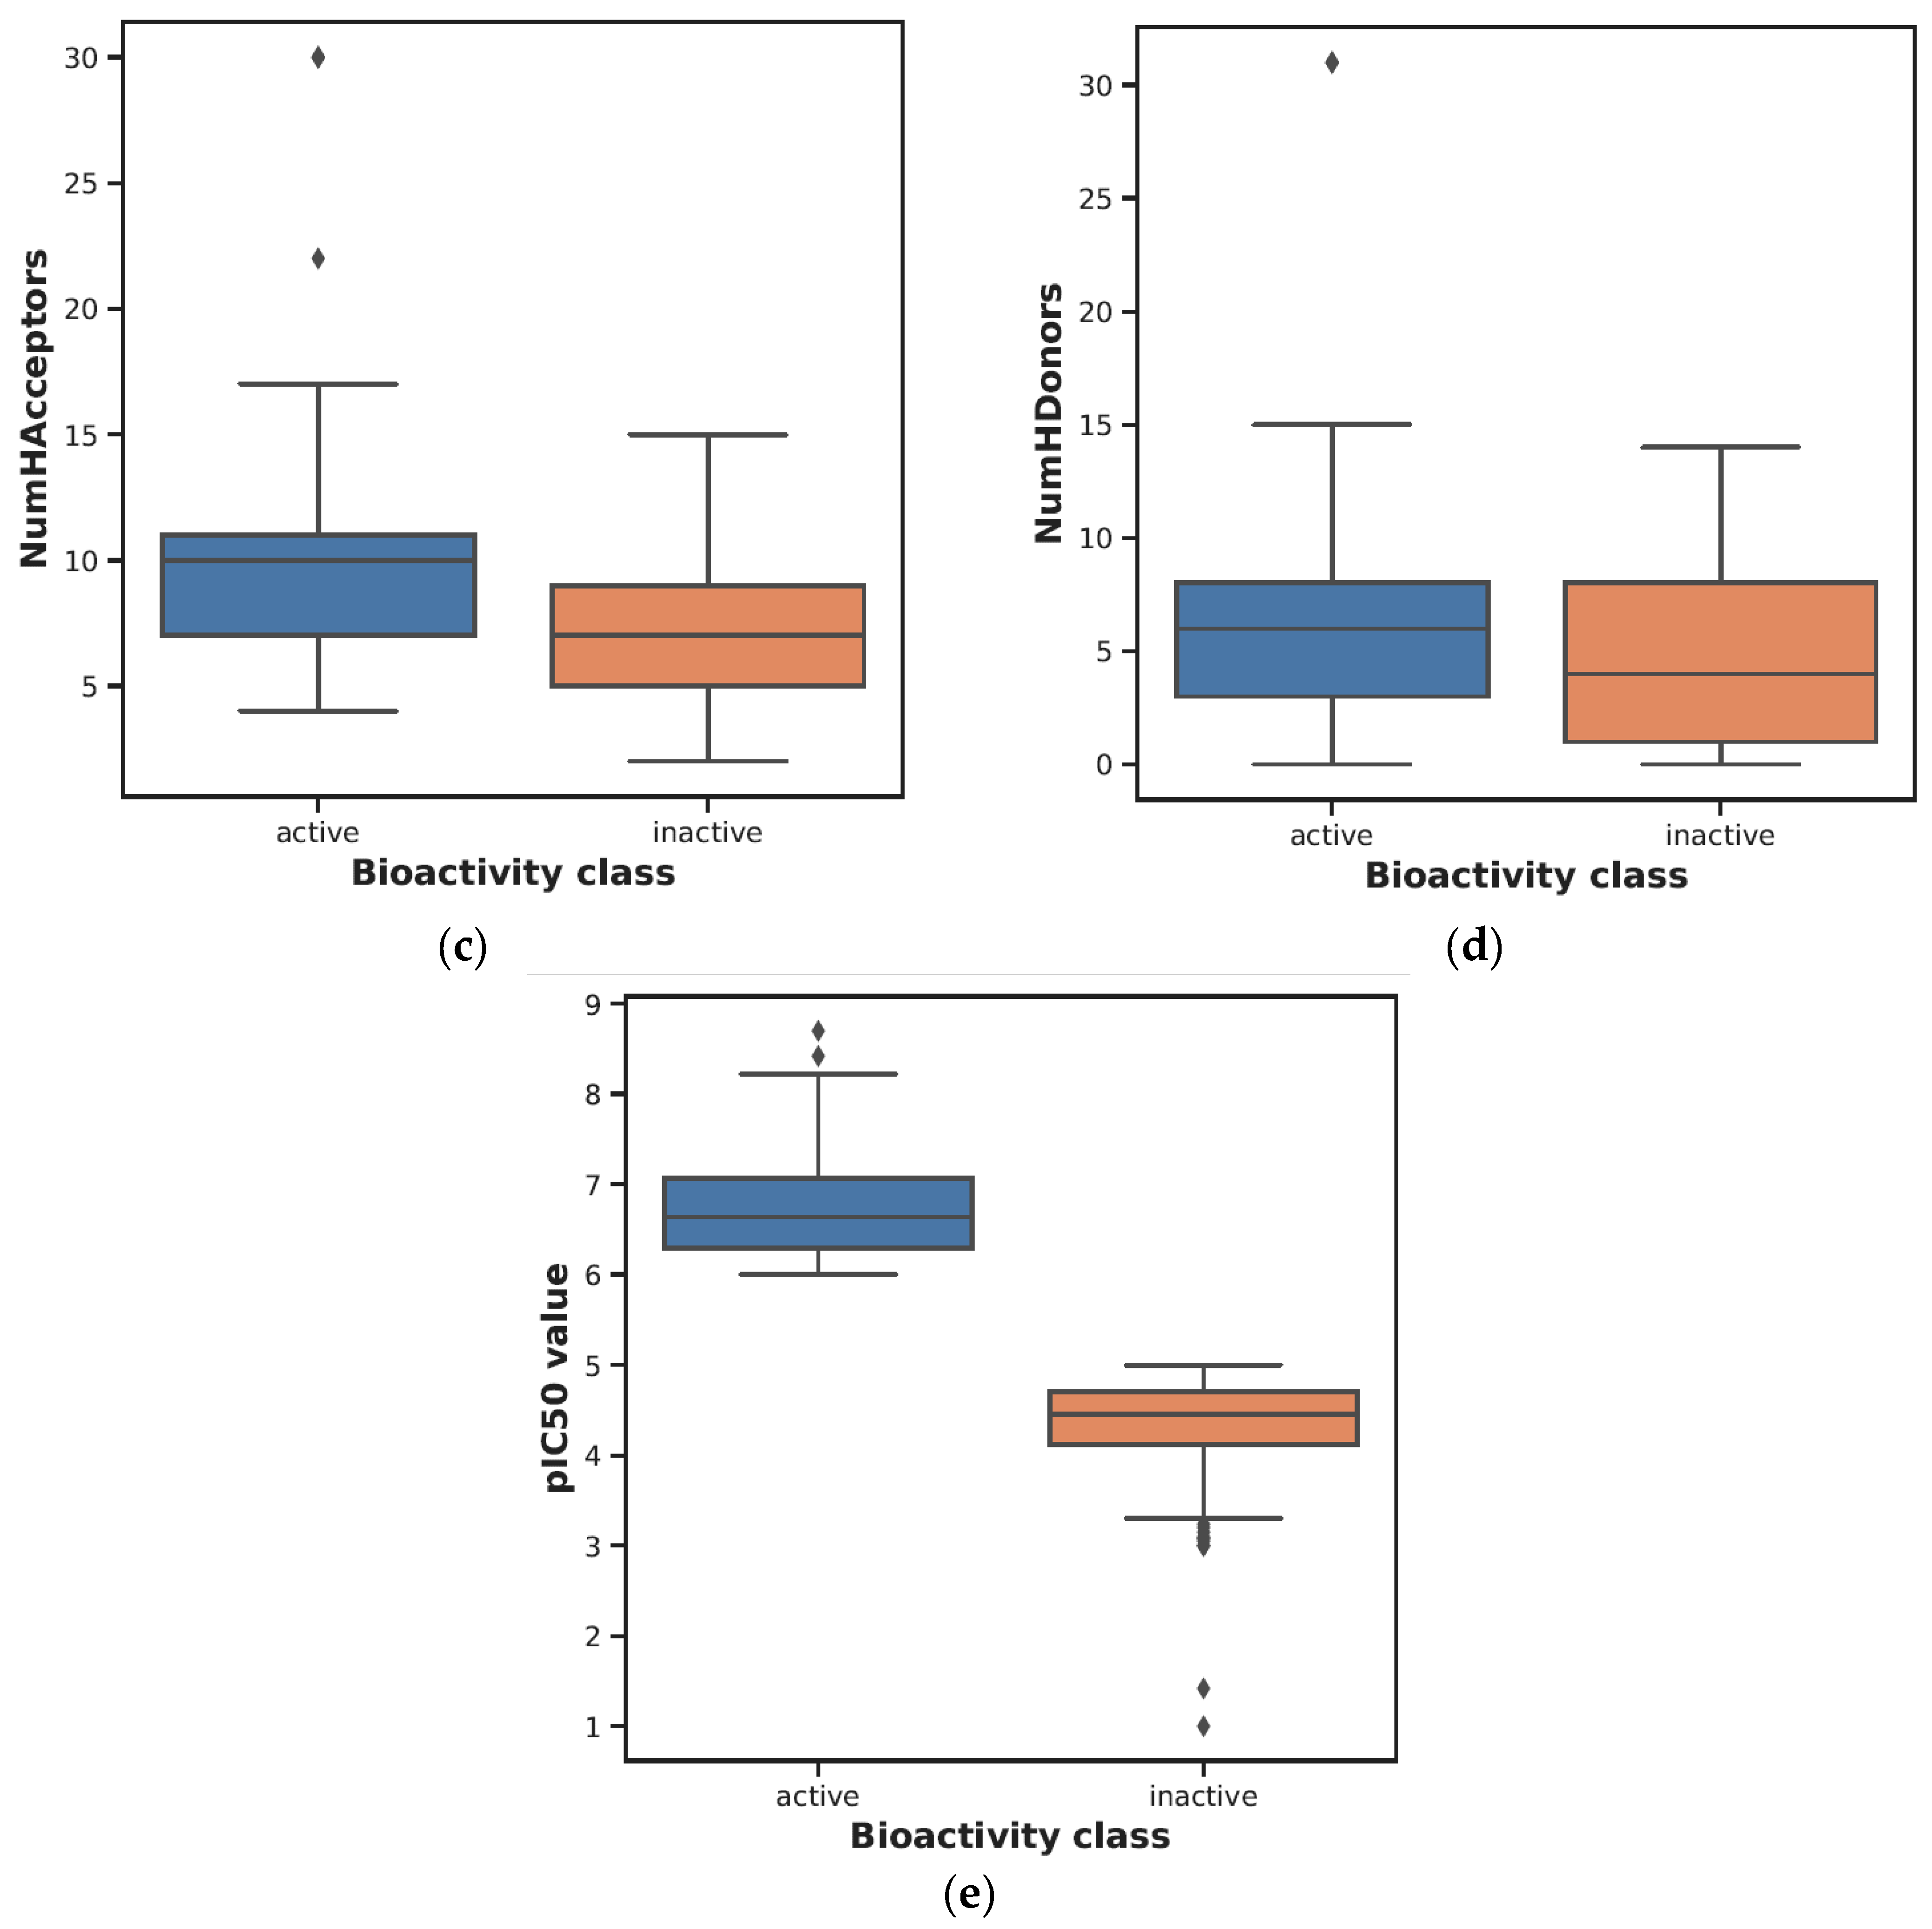
2.2. Chemical Space Analysis

Performing chemical space analysis is a crucial step in investigating the differences between active and inactive compounds. In this study, it was aimed to obtain information about the general chemical space by visualizing the distribution of actives and inactives according to MW versus LogP. Then, using Ro5 descriptors, the two groups were compared. These properties are based on the observation that most drugs are relatively large lipophilic molecules containing MW, LogP, hydrogen bond donor number (nHBDon), and hydrogen bond acceptor number (nHBAcc). The visualization of MW as a function of LogP is presented in Figure 1b. In addition, the statistical analysis results showed a significant distinction between active and inactive compounds using the Mann–Whitney U test (see Table 1). In addition, the LogP, MW, nHBAcc, and nHBDon values of the active compounds were higher than the inactive compounds (see Figure 2).

2.3. QSAR Modeling and Bioactivity Class Analysis

In this study, interpretable molecular fingerprints were generated using the PaDEL-Descriptor 2.21 software. A comprehensive inventory of these fingerprints, accompanied by their respective explications, can be perused in Table 2. To undertake EDA, the Ro5 descriptor was engaged, which led to the identification of a total of 456 bioactivity data points. To discern significant differences between bioactivity classes, the Mann–Whitney U test was employed. A summary of the Mann–Whitney U test outcomes about the significant dissimilarities observed in both bioactivity classes is presented in Table 1.
As can be seen in Table 1, the Mann–Whitney U test was used to determine whether the examined bioactive molecules differed according to their bioactivity classes. The interpretation of the five descriptors LogP, MW, NumHAcceptors, NumHDonors, and pIC50 highlights that both classes are significantly different.

2.4. Model Evaluation

The effectiveness of a QSAR model’s estimation performance is contingent upon the composite descriptors as well as the employed estimator. In this study, RF was implemented due to its interpretability in various applications and the success of previous models [4]. The dataset used to train the model was divided into an 80/20 ratio between training and testing. The evaluation of the performance of the RF model was conducted based on the accuracy, MAE, RMSE, and MCC. The RF model attained an accuracy score of 0.896552 for the test data, utilizing solely the CDK graph only molecular descriptor (see Table 3).
Table 3 presents a comparison of five different classifier algorithms’ performance using various molecular fingerprint descriptors in WEKA. These classifiers include RF, IBk, LR, AdaBoost, and OneR. According to the results presented in Table 3, the RF algorithm using the CDK graph-only fingerprint descriptor achieved the best performance, with the highest accuracy and robustness across various evaluation metrics. Table 3 focuses on various metrics including accuracy, MAE, RMSE, and MCC across training, 10-fold cross-validation, and test datasets. The analysis indicates that the CDK graph-only fingerprint descriptor exhibits superior performance among the evaluated classes. It achieves the highest accuracy on the test dataset at 89.6552%. This descriptor shows the lowest MAE (0.2114) and RMSE (0.3304) and the highest MCC (0.7950), proving its effectiveness in molecular classification tasks. The results from both the 10-fold CV, with an accuracy of 88.9655%, and the test set validation, confirm that the CDK graph-only fingerprint descriptor outperforms other classes in accuracy and reliability in model predictions. This enhanced performance can be attributed to the unique structural representation captured by the CDK graph-only descriptor, which possibly encodes molecular features more effectively than other descriptors. The consistent results across various metrics and datasets show how well the CDK graph-only fingerprint uses the RF algorithm’s predictive power for classifying molecules. A well-balanced dataset with appropriate activity labels is crucial for the reliable classification of HCV NS3 inhibitors. The selection of computational tools, including ML algorithms and molecular fingerprints, is guided by nature and distribution of available data. In this study, the dataset was carefully curated to ensure the accurate assignment of bioactivity labels. This approach helped to reduce potential biases in model training. A systematic evaluation of 12 molecular fingerprint descriptors was conducted to determine their effectiveness for classification. Through this analysis, the CDK graph-only fingerprint was identified as the most effective. This finding highlights the importance of selecting the right molecular representation. The optimized RF model achieved high accuracy and strong performance metrics. These results emphasize the importance of data quality and descriptor selection in enhancing predictive models for virtual screening. These findings show that using well-organized datasets and suitable computational methods is important for improving drug discovery.
An essential aspect of this study was the evaluation of molecular descriptors and their impact on model performance. Among the 12 molecular fingerprints tested, the CDK graph-only fingerprint demonstrated the highest predictive ability. This finding indicates that structural connectivity plays a key role in distinguishing active and inactive HCV NS3 inhibitors. The strong classification performance of the RF model, with an accuracy of 89.6552% and an MCC of 0.7950, highlights its effectiveness. This result underscores the relevance of descriptor selection in enhancing predictive capabilities. Similarly, the study by Phanus-Umporn et al. [27] demonstrated that substructure fingerprints, combined with the RF method, achieved the best performance. Moreover, this approach provides an interpretable set of descriptors, reinforcing the importance of feature selection in predictive modeling. The findings suggest that molecular features related to graph-based representations are particularly informative for this classification task.

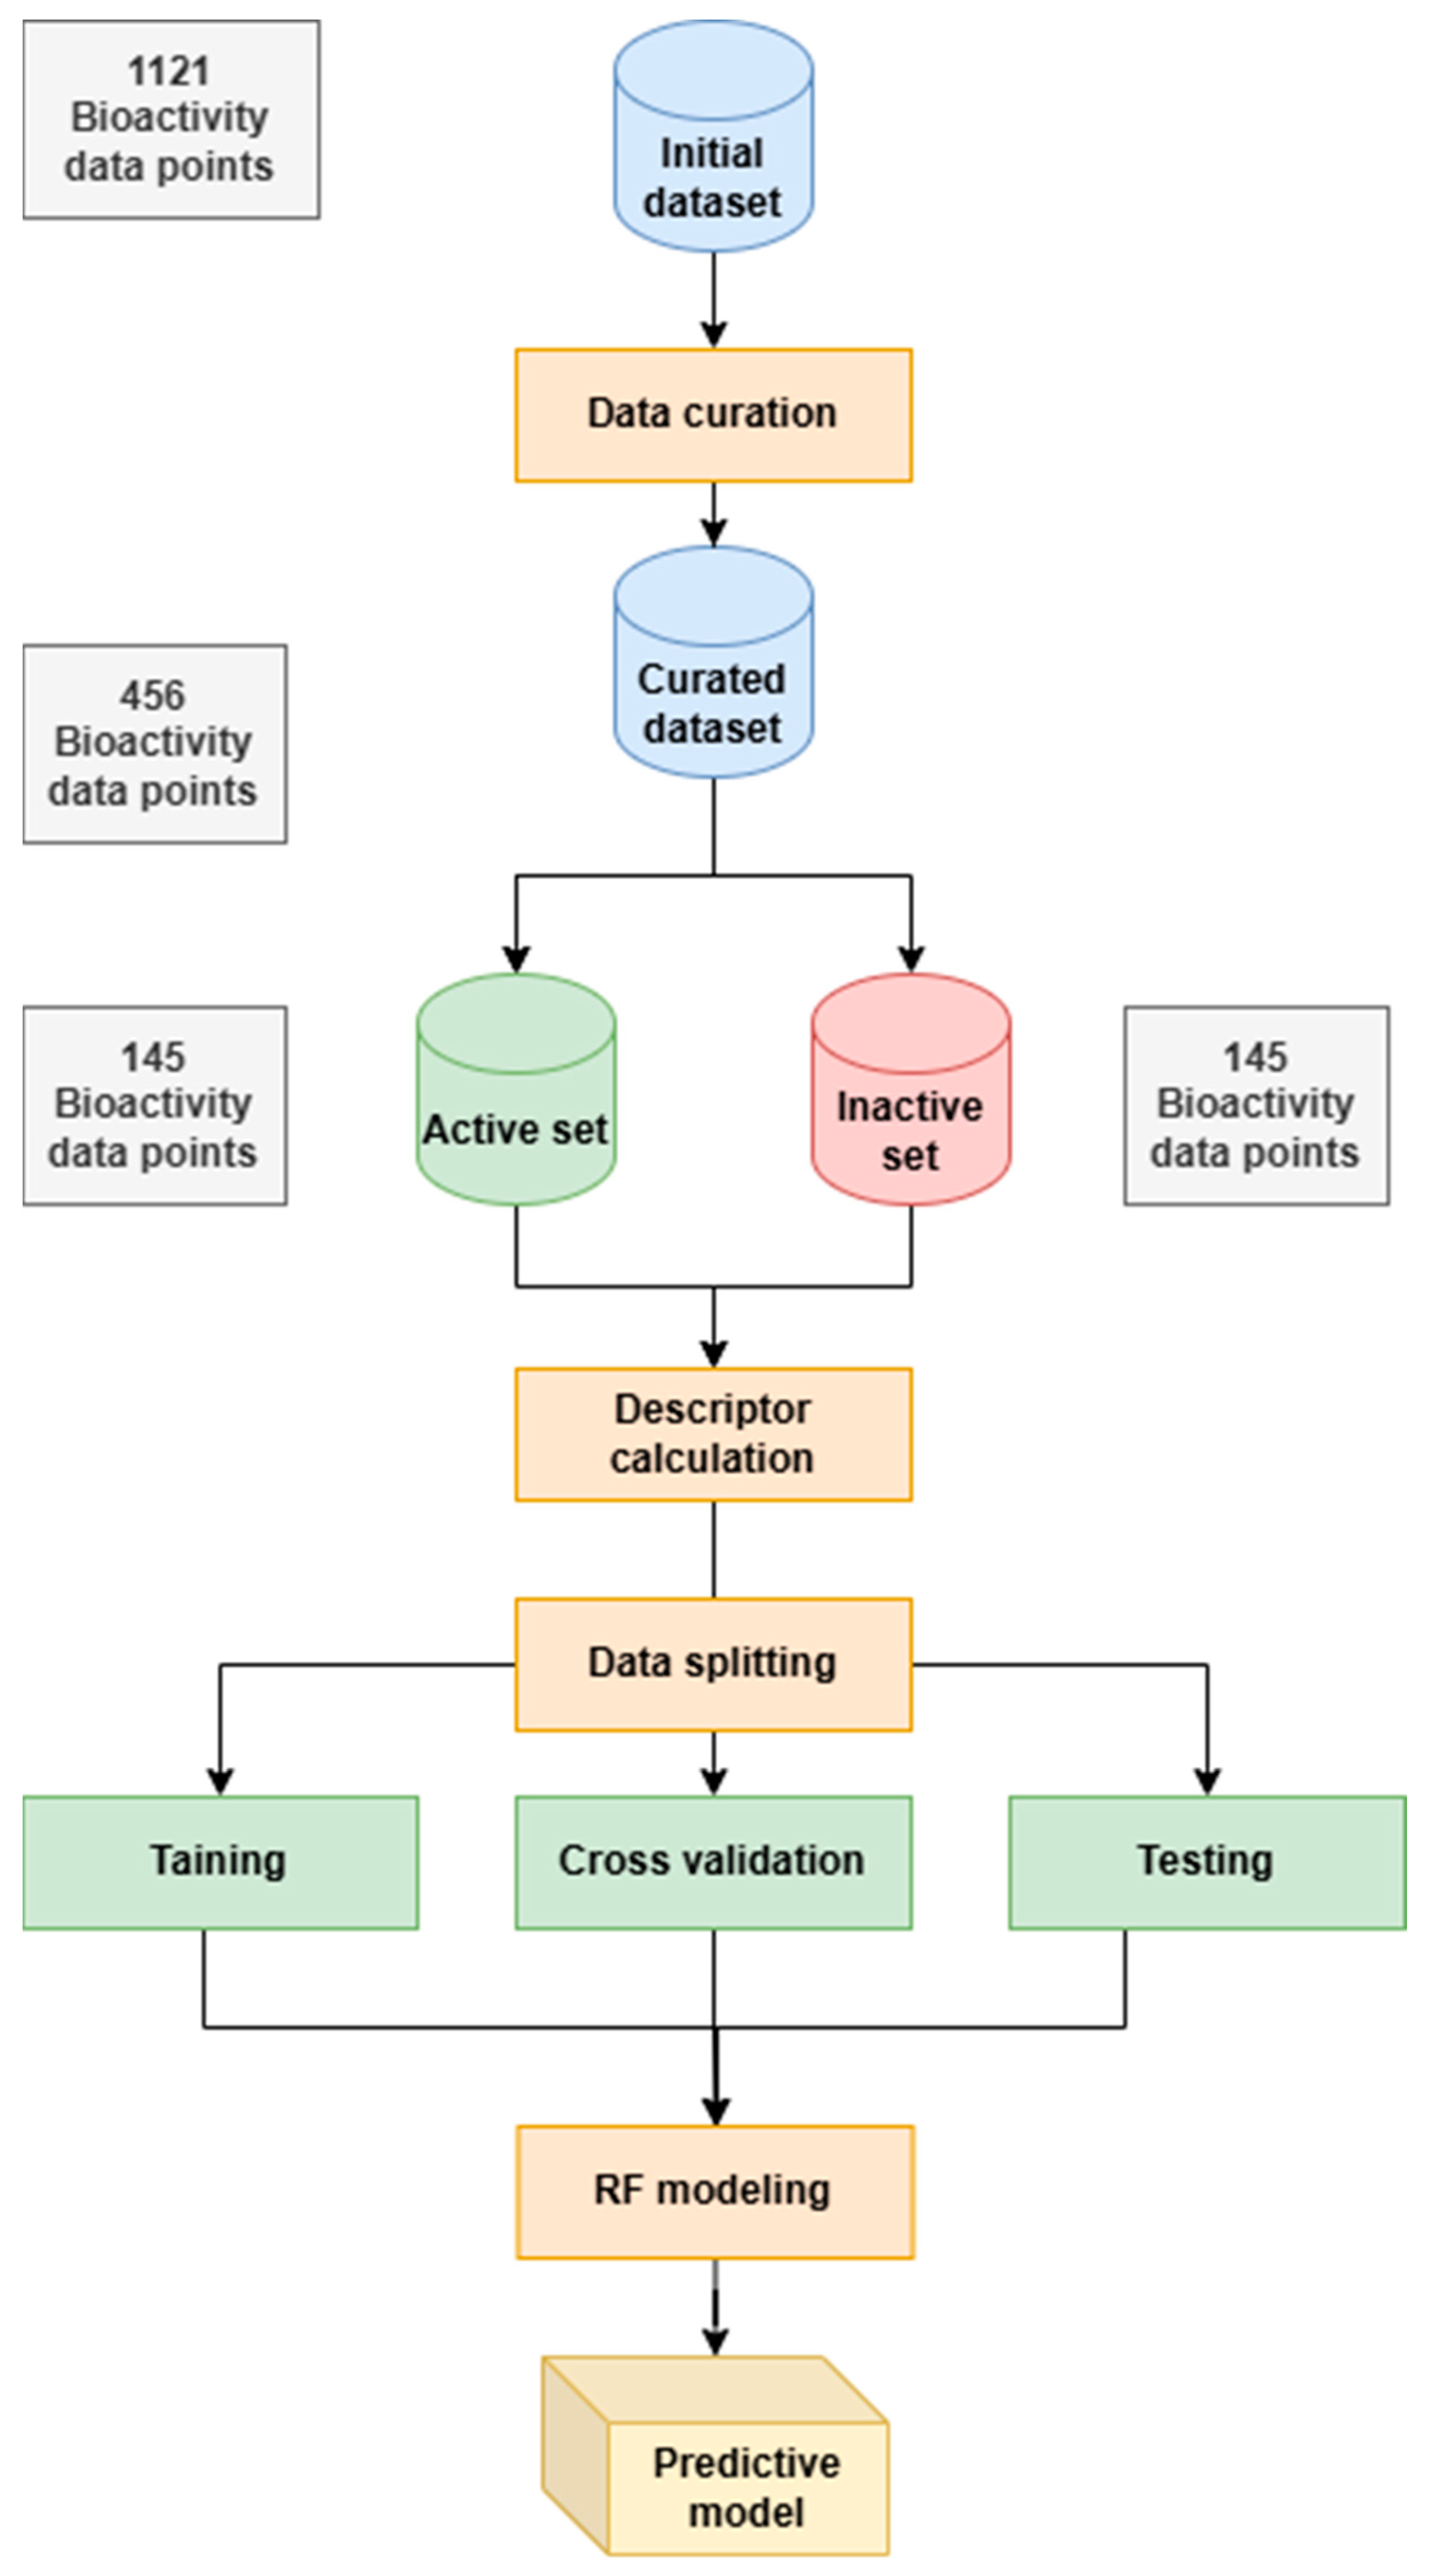
3. Materials and Methods

3.1. Dataset

The dataset used in this study was retrieved from the ChEMBL database (version 33) [28]. It specifically targets HCV NS3 (Target ChEMBL ID: CHEMBL1293269). The original dataset contained 1121 bioactivity data points from 965 compounds. To ensure data consistency, we applied a filtering process that retained only entries with standard type = ‘IC50’ and non-null standard value, resulting in 456 bioactivity data points.
To classify compounds, we categorized them based on their IC50 values:
Active: IC50 ≤ 1 μM;
Inactive: IC50 ≥ 10 μM;
Intermediate values (1–10 μM) were excluded.
This resulted in a curated dataset of 290 inhibitors, which was used for further analysis. The chemical space distributions of the dataset were evaluated using PaDEL-Descriptor 2.21 software [29], which calculates 12 groups of molecular descriptors and converts SMILES notation into molecular descriptors (see Figure 3).

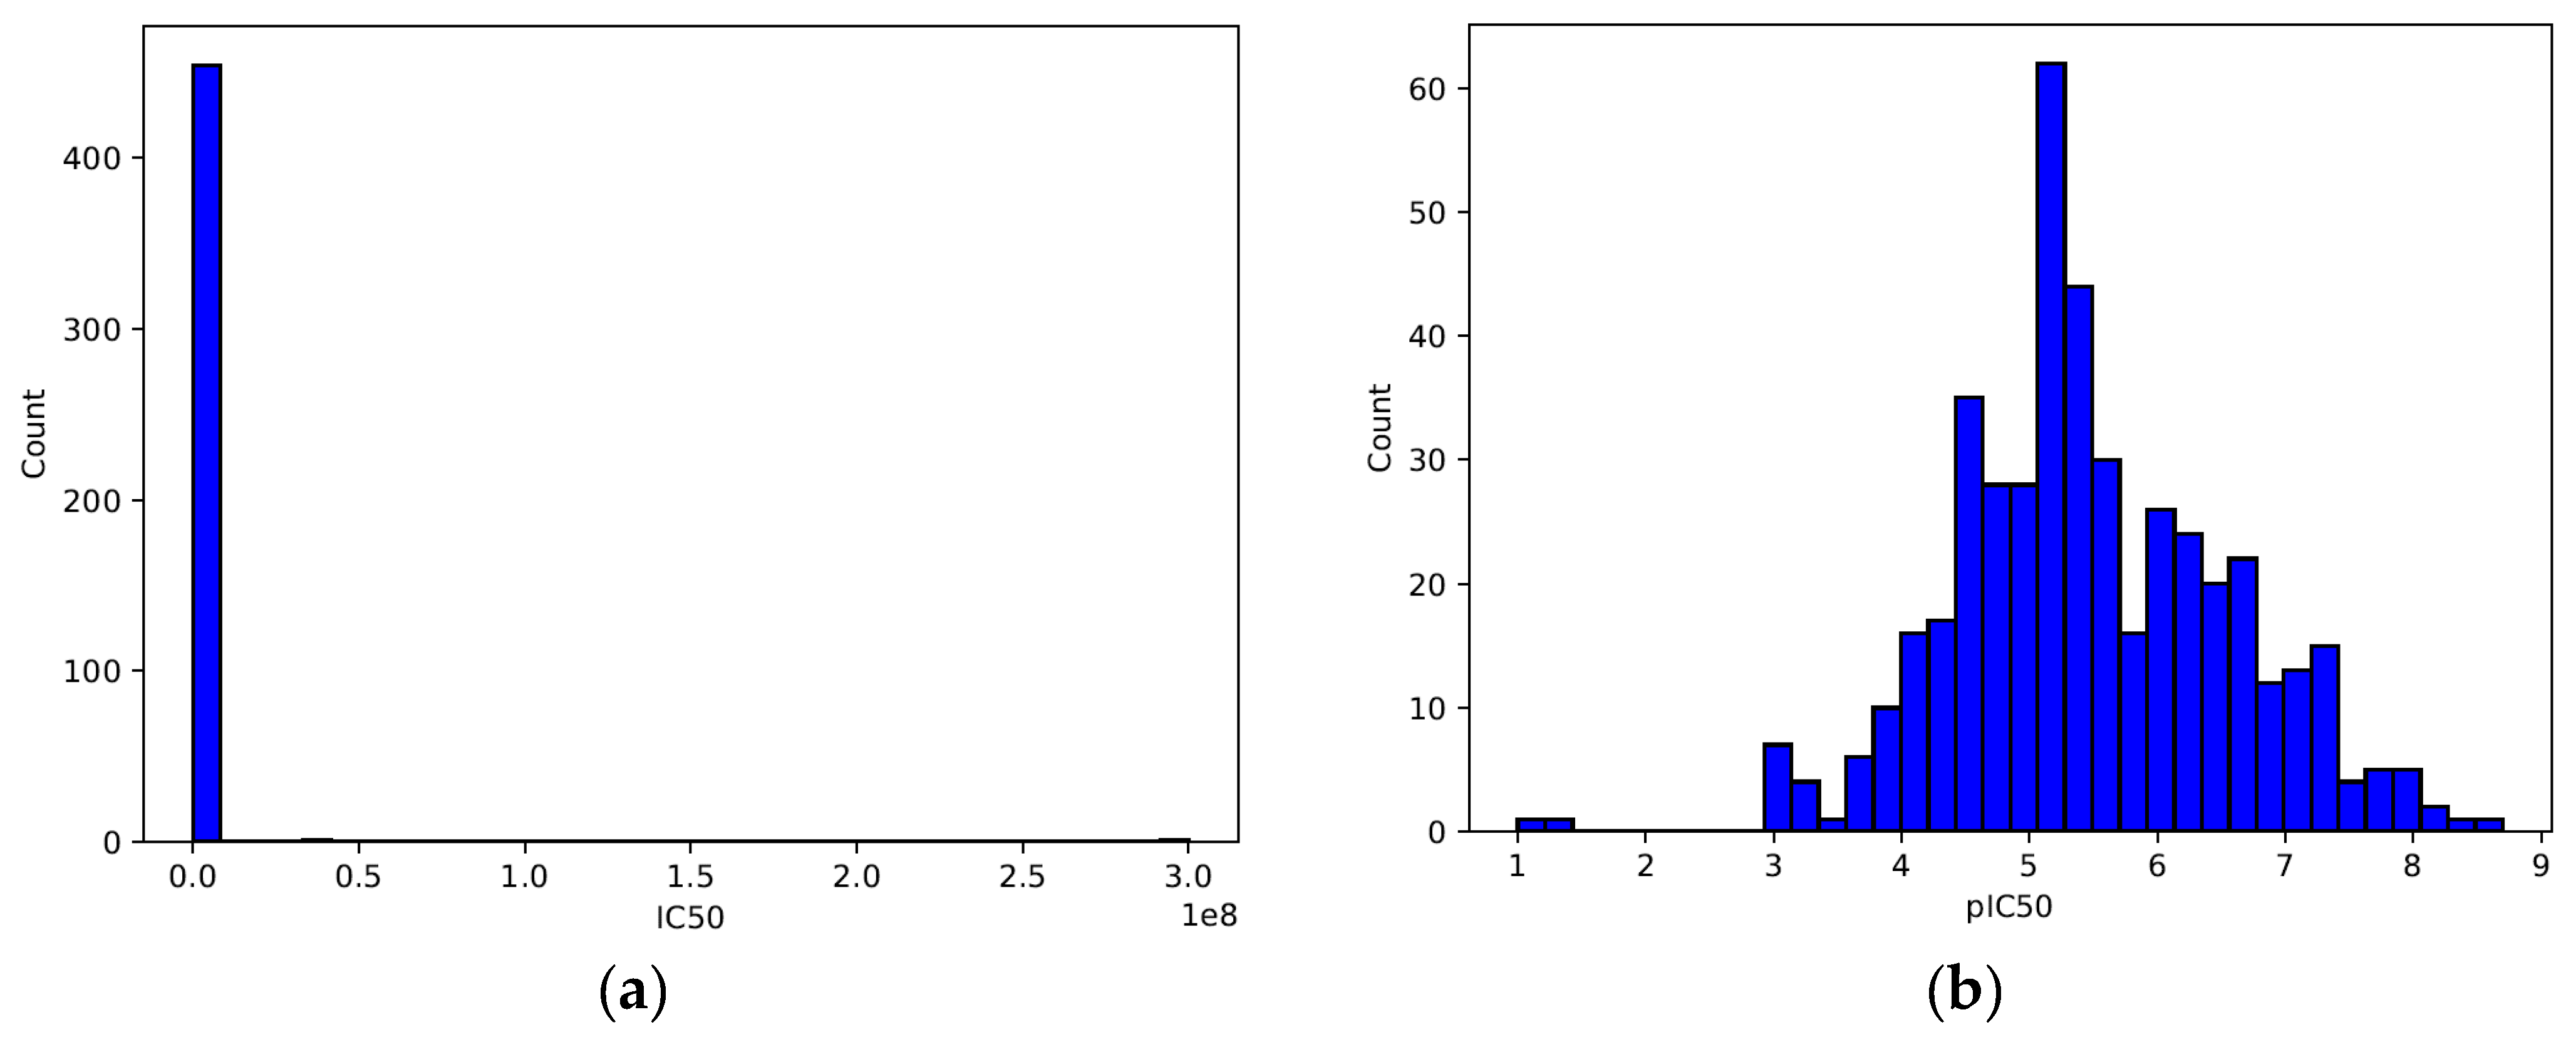
3.2. Data Preprocessing

For improved model performance, the IC50 values were transformed into pIC50 values using the following equation:
pIC50 = −log10(IC50 × 10−9).
Bioactive compounds were then labeled as active (≤1000 nM), inactive (≥10,000 nM), or intermediate classes (between 1000 and 10,000) according to their IC50 values [30].
The left plot (Figure 4a) shows the raw IC50 values in nanomoles (nM). The distribution appears highly skewed, with many values concentrated near the lower end and a few extreme values extending toward the right. This right-skewed distribution suggests that the dataset contains a wide range of IC50 values, with many compounds having low IC50 values but some compounds exhibiting extremely high IC50 values. Such skewness can create problems in modeling, as large-scale differences in IC50 values can dominate the learning process.
The right plot (Figure 4b) shows the distribution of the pIC50 values, which were obtained using Equation (1). Unlike the IC50 distribution, the pIC50 values follow a more normal-like (Gaussian) distribution, centered around 5–6 pIC50. The transformation compresses the large IC50 values, reducing the skewness and improving the numerical stability for ML models. This transformation is commonly used in cheminformatics and QSAR modeling, as it better represents biological activity on a logarithmic scale.
The decision to use classification instead of a regression approach was primarily guided by the characteristics of the data. Additionally, the intended application of the model played a crucial role in this choice. As shown in Figure 4b, the pIC50 values exhibit a near-Gaussian distribution, which could be suitable for regression. However, the original IC50 values (Figure 4a) were highly skewed, spanning several orders of magnitude. This skewness can introduce challenges in regression modeling. The transformation to pIC50 helped reduce the skewness. However, classification was ultimately chosen due to its practical advantages in drug discovery, where compounds are often categorized based on predefined activity thresholds. This approach aligns with common cheminformatics practices [31]. It also enhances interpretability by allowing the direct identification of active, intermediate, and inactive compounds. Nevertheless, future work could explore regression-based modeling to capture finer variations in activity levels.

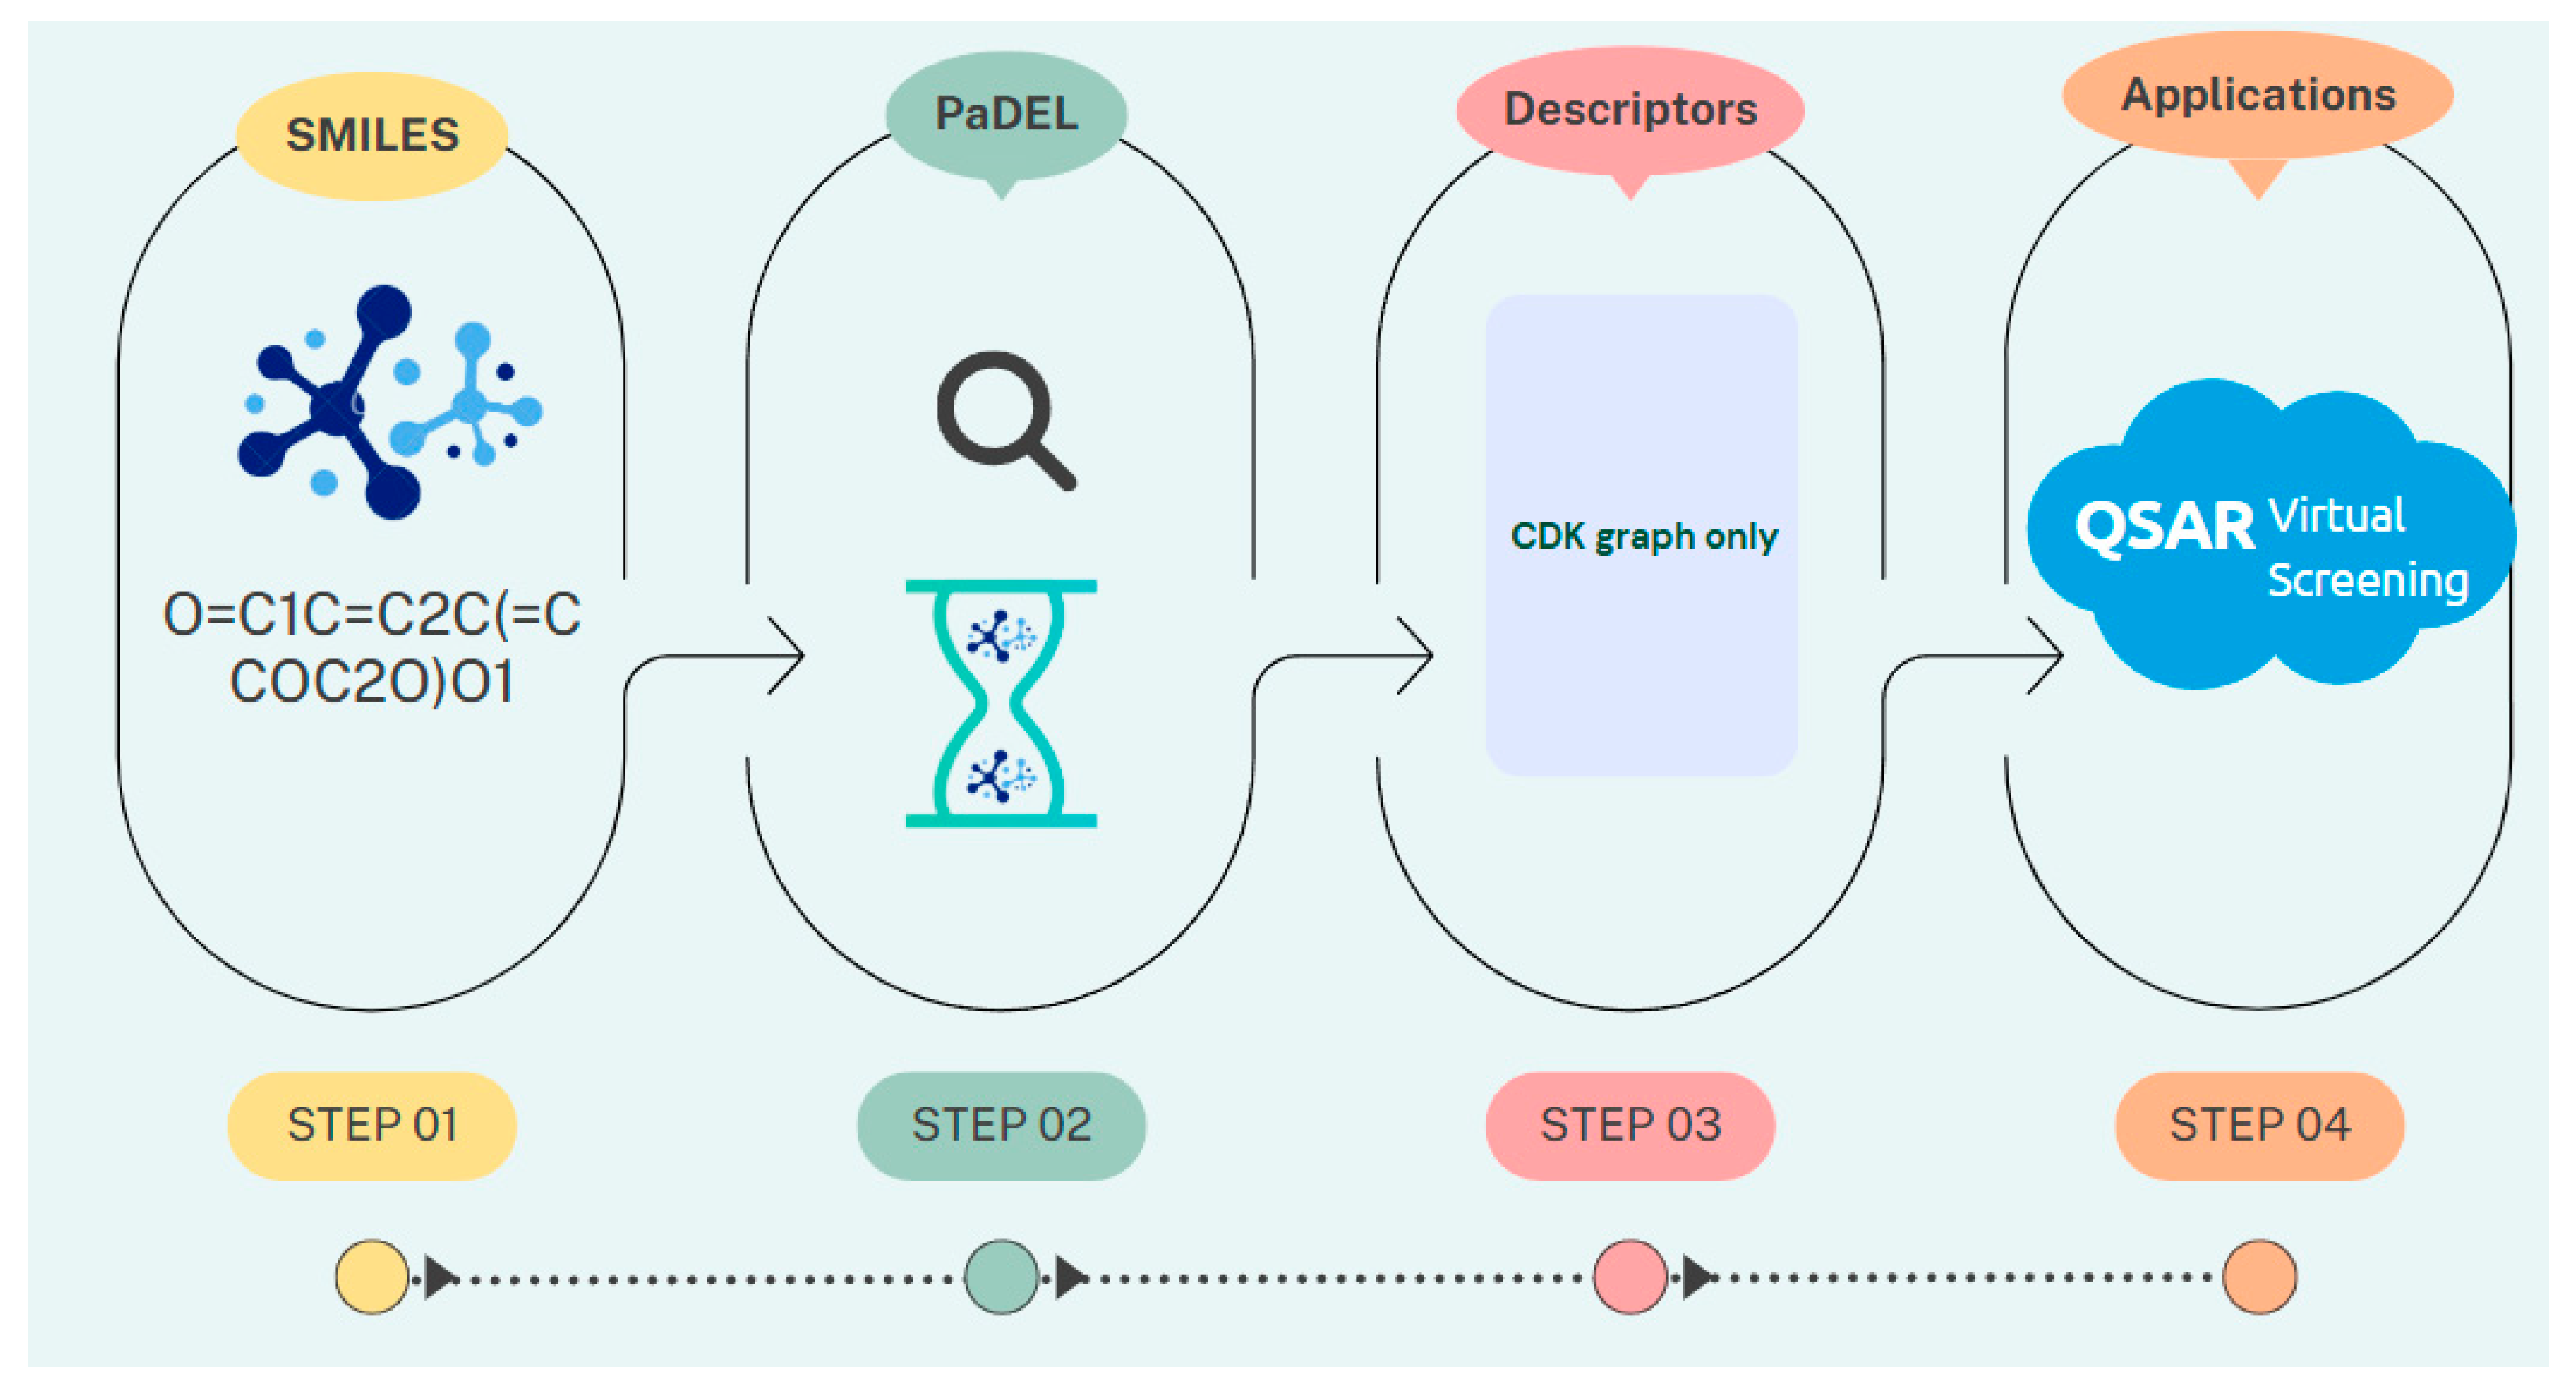
3.3. Molecular Fingerprint
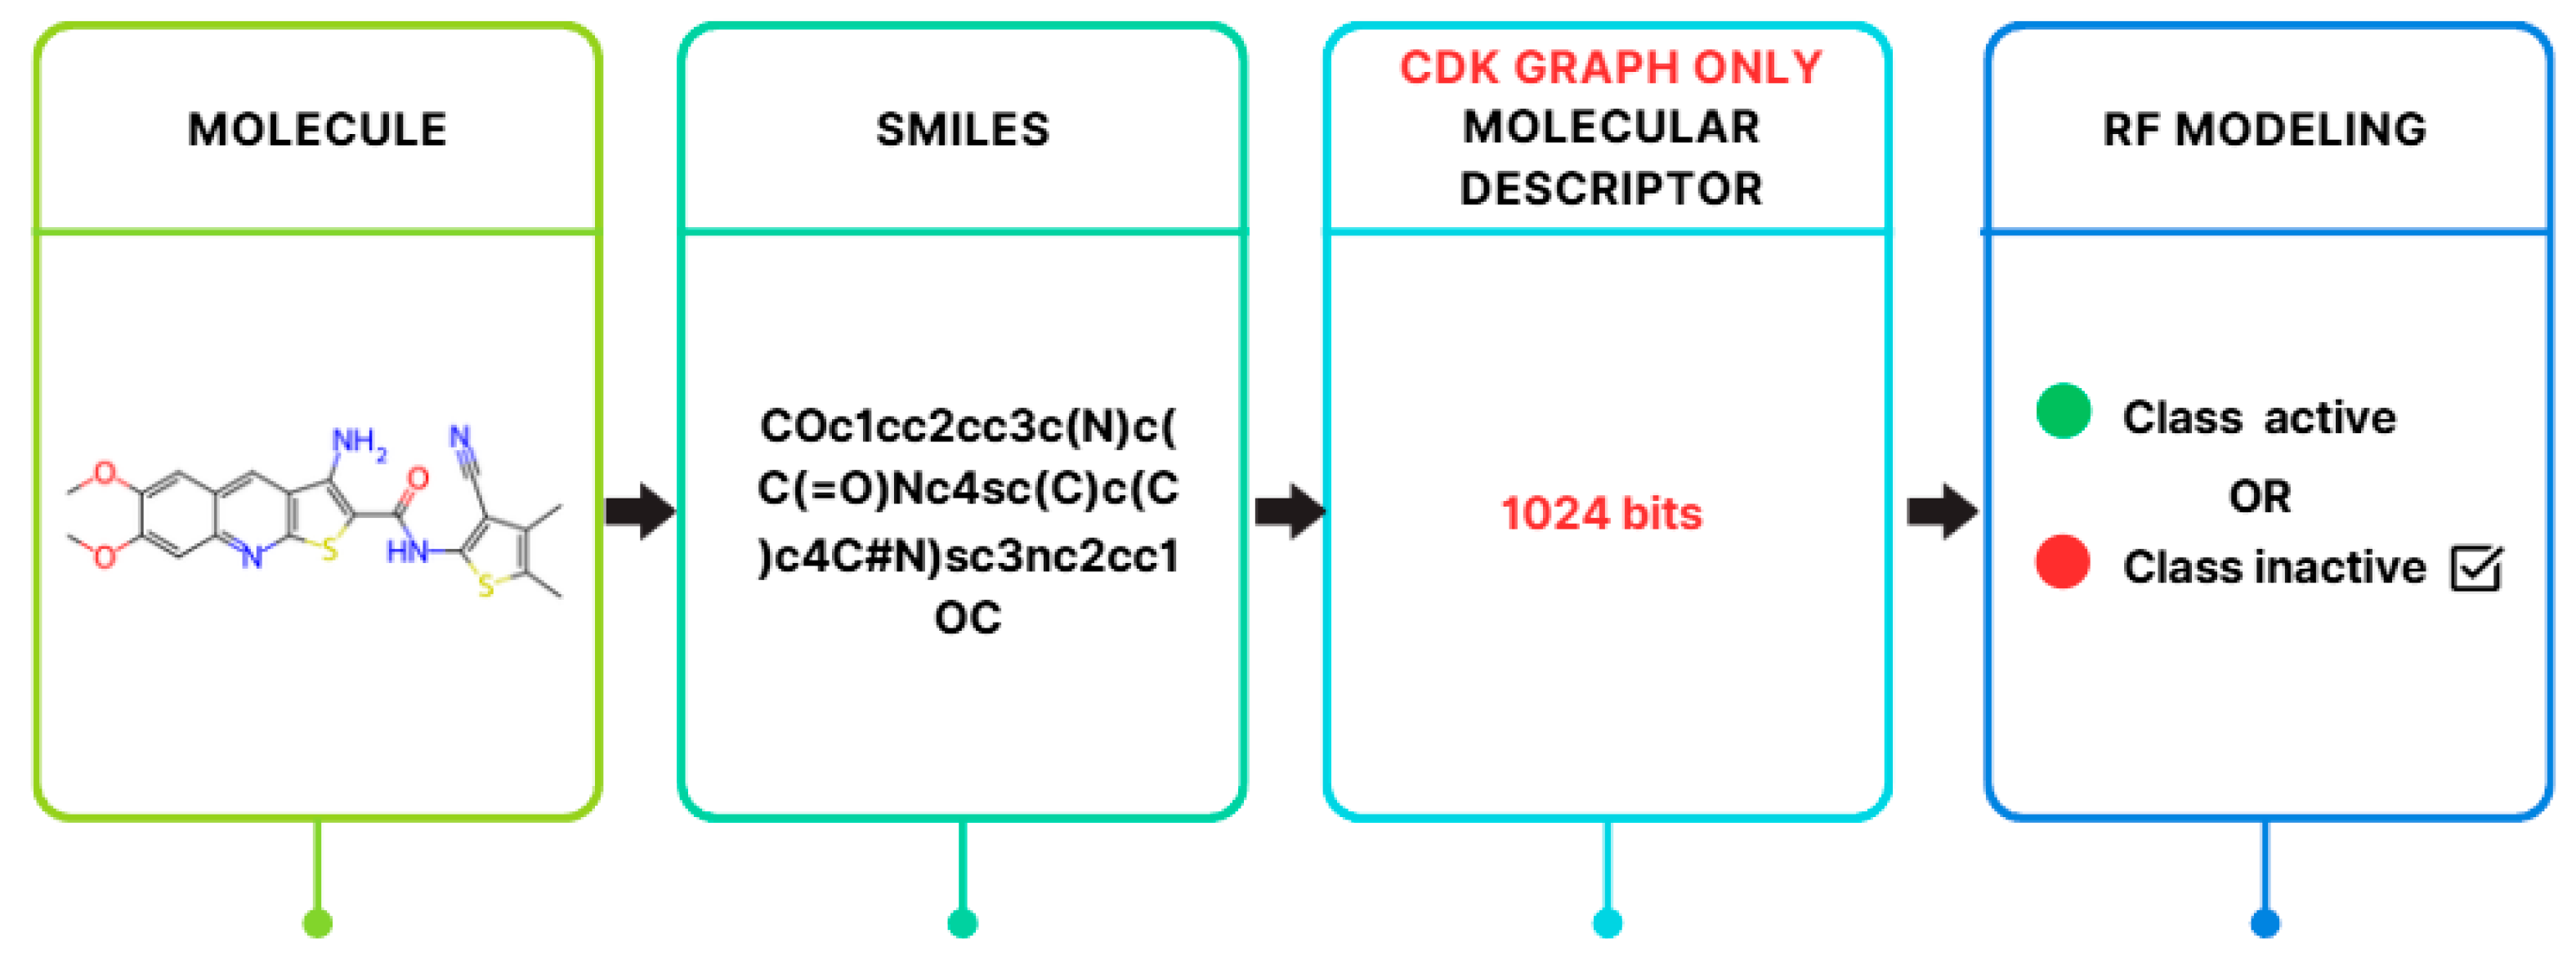
Various molecular descriptors capture different aspects of molecules and are classified according to their size: 1D descriptors for bulk properties and physicochemical parameters, 2D descriptors for structural fragments, and 3D descriptors for molecular shape [32]. Molecular fingerprints, typically depicted as a string of numbers 1 and 0 with a fixed length, define the characteristics of a molecule through a binary string of structural information. In this representation, the number 1 signifies the presence of a substructure, while the number 0 indicates its absence [33].
Molecular descriptors capture various structural and physicochemical properties of compounds. They are classified as [32]:
One-dimensional descriptors: Bulk properties and physicochemical parameters.
Two-dimensional descriptors: Structural fragments.
Three-dimensional descriptors: Molecular shape.
Molecular fingerprints, represented as binary strings, encode molecular structure where 1 indicates the presence of a substructure, and 0 indicates its absence [33].
In this study, we used 12 distinct fingerprints, computed using PaDEL-Descriptor 2.21 software [29], as follows:
CDK fingerprint (1024 bits);
CDK extended fingerprint (1024 bits);
Estate fingerprint (79 bits);
CDK graph-only fingerprint (1024 bits);
Molecular access system (MACCS) (166 bits);
PubChem fingerprint (881 bits)l
Substructure fingerprint (307 bits);
Substructure count fingerprint (307 patterns);
Klekota–Roth fingerprint (4860 bits);
Klekota–Roth count (4860 Roth count);
Two-dimensional atom pairs fingerprint (780 bits);
Two-dimensional atom pairs count (780 2D atom pairs count)
A summary of all the fingerprints and their feature counts is provided in Table 2 [27].
To remove redundant descriptors, WEKA’s ‘RemoveUseless’ filter was applied, eliminating descriptors that did not vary across instances. The processed dataset, along with the computed attributes, is available as Supplemental Files S1–S12.

3.4. QSAR Modeling

Quantitative structure–activity relationship (QSAR) modeling was performed using WEKA 3.8.6, applying 10-fold cross validation on data split into an 80/20 ratio for training and testing.
The model performance was evaluated using four key metrics:
Accuracy,
Mean absolute error (MAE),
Root mean square error (RMSE),
Matthews correlation coefficient (MCC).
Different molecular fingerprint descriptors were tested to determine their predictive power for bioactivity classification.

3.5. Exploratory Data Analysis (EDA)

The study presents a schematic summary of the EDA modeling workflow, as depicted in Figure 5. Additionally, Figure 1a illustrates the frequency graph representing the active and inactive classes, while Figure 1b displays a scatterplot comparing the molecular weight (MW) with LogP.
Data analysis and ML have become essential components of contemporary scientific methodology, providing automated methods for predicting additional information based on observations. One prevalent technique for classification and regression is the RF method [34,35]. In the RF approach, the classification process initiates at the root node, where the dataset splits, based on chosen descriptors, to ensure that distinct activities are primarily assigned to different branches. The final classification is determined by aggregating the outcomes of all trees through a majority vote [4].
RF models are chosen as baseline models due to their widespread use and effectiveness in predicting biological activity in various studies [36], often outperforming other ML methods according to recent benchmarking studies [37].
In this study, the RF model is focused on due to its widespread use and strong performance in drug discovery applications. According to Atasever’s study [5], RF is identified as the most used ML method in this domain. It appears in 53% of the studies examined (63 studies). This widespread adoption is considered evidence of its reliability and effectiveness in predicting molecular properties and biological activities. RF is particularly well-suited for cheminformatics. It is found to outperform other ML models in handling complex, noisy, and high-dimensional datasets [38]. One of RF’s key strengths is its robustness to overfitting, as it maintains a balance between bias and variance. This balance allows the model to generalize better to unseen data. RF also offers feature importance analysis, helping researchers identify the most relevant molecular descriptors. As a result, RF is regarded as both a powerful predictive tool and an interpretable one. Its successful application in past drug discovery studies makes it a reliable and widely accepted model in the field. Given RF’s dominance in literature and its superior performance in this study (as shown in Table 3), it was prioritized for deeper analysis. Therefore, in this study, the RF classifier was applied using the WEKA tool. An overview of the modeling method used in this study is presented in Figure 6.

3.6. Assessment of Model Performance

The assessment of the model performance was carried out using four metrics, namely accuracy, MAE, RMSE, and MCC.
The evaluation of each model’s quality considered parameters such as true positives (TP), false positives (FP), true negatives (TN), and false negatives (FN). The model’s performance was assessed using various statistical metrics, including comprehensive classification accuracy (Acc), MAE, RMSE, and MCC, to determine its proficiency [4].
Acc = T P T N ( T P + T N + F P + F N ) 100
The MAE quantifies the average degree of errors in a set of projections, representing the average difference between the predicted and actual data with equal weight assigned to each individual variance. The formula for calculating MAE is as follows [10]:
MAE = 1 n j = 1 n y i y ^ i .
The MAE compares the actual output (yᵢ) with the model’s prediction (ŷᵢ) and represents the average square error of the estimates. By calculating the squared difference between the estimates and the target, and then averaging those values, MAE provides insights into the model’s performance. A higher MAE value indicates poorer model performance, as it signifies larger errors. The MAE value must be greater than zero, as the process involves squaring the individual prediction-wise errors before summing them. Ideally, a perfect model would have an MAE value close to zero [39].
The RMSE is a mathematical rule used to assess the average magnitude of an error, representing the square root of the average square difference between the predictions and actual observations [35,39].
RMSE = 1 n j = 1 n ( y i y ^ i ) 2
The MAE and RMSE are metrics used to quantify the average errors of a model in the units of the variables. Both metrics can range from 0 to ∞ and do not consider the direction of the error. In cases where negative outputs indicate better performance, lower values are desirable. The RMSE, obtained by taking the square root of the mean square error, holds significance due to its handling of larger errors. By squaring the errors before averaging, the RMSE assigns greater importance to significant errors. Therefore, the RMSE proves more informative when large errors have more unfavorable consequences [4,37].
MCC = T P T N F P F N T P + F P T P + F N T N + F P T N + F N
The symbols TP, TN, FP, and FN correspond to true positives, true negatives, false positives, and false negatives, respectively, representing different instances within the context.

4. Conclusions

Innovative anti-HCV drugs are needed to combat the rising worldwide prevalence of HCV infections, and molecular descriptors are crucial to model performance. In this research, a total of 965 compounds were compiled. Using the RF method and different molecular fingerprints, 12 models were created to classify 290 bioactivity data points. The RF model with CDK graph-only fingerprints demonstrated the best classification ability, achieving accuracy, MAE, RMSE, and MCC of 89.6552%, 0.2114, 0.3304, and 0.7950 on the test set, respectively. The comparison of several classifiers such as RF, IBk, LR, AdaBoost, and OneR highlights the adaptability of using different molecular fingerprint descriptors in WEKA for this study. The best RF model presented in this study can be used as a general guide for the data-driven design of potentially active HCV NS3 protease inhibitors in virtual screening.

Supplementary Materials

The following data can be downloaded at https://www.mdpi.com/article/10.3390/ijms26062680/s1.

Funding

This research received no external funding.

Institutional Review Board Statement

Not applicable.

Informed Consent Statement

Not applicable.

Data Availability Statement

The data used in this study are available in the Supplementary section.

Conflicts of Interest

The author declares no conflicts of interest.

References

  1. World Health Organization. Hepatitis C. Available online: https://www.who.int/news-room/fact-sheets/detail/hepatitis-c (accessed on 20 December 2024).
  2. Salam, K.A.; Akimitsu, N. Hepatitis C Virus NS3 Inhibitors: Current and Future Perspectives. Biomed. Res. Int. 2013, 2013, 467869. [Google Scholar] [CrossRef]
  3. Bunally, S.B.; Luscombe, C.N.; Young, R.J. Using Physicochemical Measurements to Influence Better Compound Design. SLAS Discov. Adv. Life Sci. R&D 2019, 24, 791–801. [Google Scholar]
  4. Malik, A.A.; Phanus-umporn, C.; Schaduangrat, N.; Shoombuatong, W.; Isarankura-Na-Ayudhya, C.; Nantasenamat, C. HCVpred: A Web Server for Predicting the Bioactivity of Hepatitis C Virus NS5B Inhibitors. J. Comput. Chem. 2020, 41, 1820–1834. [Google Scholar] [CrossRef] [PubMed]
  5. Atasever, S. In Silico Drug Discovery: A Machine Learning-Driven Systematic Review. Med. Chem. Res. 2024, 33, 1465–1490. [Google Scholar] [CrossRef]
  6. Bajorath, J. Computer-Aided Drug Discovery. F1000Research 2015, 4, 630. [Google Scholar] [CrossRef]
  7. Verma, J.; Khedkar, V.M.; Coutinho, E.C. 3D-QSAR in Drug Design—A Review. Curr. Top. Med. Chem. 2010, 10, 95–115. [Google Scholar] [CrossRef]
  8. Ponzoni, I.; Sebastián-Pérez, V.; Martínez, M.J.; Roca, C.; la Cruz Pérez, C.; Cravero, F.; Vazquez, G.E.; Páez, J.A.; Díaz, M.F.; Campillo, N.E. QSAR Classification Models for Predicting the Activity of Inhibitors of Beta-Secretase (BACE1) Associated with Alzheimer’s Disease. Sci. Rep. 2019, 9, 9102. [Google Scholar] [CrossRef] [PubMed]
  9. Venkatraman, V.; Pérez-Nueno, V.I.; Mavridis, L.; Ritchie, D.W. Comprehensive Comparison of Ligand-Based Virtual Screening Tools against the DUD Data Set Reveals Limitations of Current 3D Methods. J. Chem. Inf. Model. 2010, 50, 2079–2093. [Google Scholar] [CrossRef]
  10. Hu, G.; Kuang, G.; Xiao, W.; Li, W.; Liu, G.; Tang, Y. Performance Evaluation of 2D Fingerprint and 3D Shape Similarity Methods in Virtual Screening. J. Chem. Inf. Model. 2012, 52, 1103–1113. [Google Scholar] [CrossRef]
  11. Jaganathan, K.; Tayara, H.; Chong, K.T. Prediction of Drug-Induced Liver Toxicity Using SVM and Optimal Descriptor Sets. Int. J. Mol. Sci. 2021, 22, 8073. [Google Scholar] [CrossRef]
  12. Musmuca, I.; Caroli, A.; Mai, A.; Kaushik-Basu, N.; Arora, P.; Ragno, R. Combining 3-D Quantitative Structure- Activity Relationship with Ligand Based and Structure Based Alignment Procedures for in Silico Screening of New Hepatitis C Virus NS5B Polymerase Inhibitors. J. Chem. Inf. Model. 2010, 50, 662–676. [Google Scholar] [CrossRef]
  13. Wang, M.; Xuan, S.; Yan, A.; Yu, C. Classification Models of HCV NS3 Protease Inhibitors Based on Support Vector Machine (SVM). Comb. Chem. High Throughput Screen. 2015, 18, 24–32. [Google Scholar] [CrossRef] [PubMed]
  14. Meewan, I.; Zhang, X.; Roy, S.; Ballatore, C.; O’Donoghue, A.J.; Schooley, R.T.; Abagyan, R. Discovery of New Inhibitors of Hepatitis C Virus NS3/4A Protease and Its D168A Mutant. ACS Omega 2019, 4, 16999–17008. [Google Scholar] [CrossRef] [PubMed]
  15. Zhou, Y.; Zhao, Y.; Gao, Y.; Hu, W.; Qu, Y.; Lou, N.; Zhu, Y.; Zhang, X.; Yang, H. Hepatitis C Virus NS3 Protein Enhances Hepatocellular Carcinoma Cell Invasion by Promoting PPM1A Ubiquitination and Degradation. J. Exp. Clin. Cancer Res. 2017, 36, 42. [Google Scholar] [CrossRef] [PubMed]
  16. Iwai, A.; Takegami, T.; Shiozaki, T.; Miyazaki, T. Hepatitis C Virus NS3 Protein Can Activate the Notch-Signaling Pathway through Binding to a Transcription Factor, SRCAP. PLoS ONE 2011, 6, e20718. [Google Scholar] [CrossRef]
  17. Kamboj, S.; Rajput, A.; Rastogi, A.; Thakur, A.; Kumar, M. Targeting Non-Structural Proteins of Hepatitis C Virus for Predicting Repurposed Drugs Using QSAR and Machine Learning Approaches. Comput. Struct. Biotechnol. J. 2022, 20, 3422–3438. [Google Scholar] [CrossRef]
  18. Hentabli, H.; Saeed, F.; Abdo, A.; Salim, N. A New Graph-Based Molecular Descriptor Using the Canonical Representation of the Molecule. Sci. World J. 2014, 2014, 286974. [Google Scholar] [CrossRef]
  19. Gong, Y.; Teng, D.; Wang, Y.; Gu, Y.; Wu, Z.; Li, W.; Tang, Y.; Liu, G. In Silico Prediction of Potential Drug-Induced Nephrotoxicity with Machine Learning Methods. J. Appl. Toxicol. 2022, 42, 1639–1650. [Google Scholar] [CrossRef]
  20. Steinbeck, C.; Han, Y.; Kuhn, S.; Horlacher, O.; Luttmann, E.; Willighagen, E. The Chemistry Development Kit (CDK): An Open-Source Java Library for Chemo-and Bioinformatics. J. Chem. Inf. Comput. Sci. 2003, 43, 493–500. [Google Scholar] [CrossRef]
  21. Hall, L.H.; Kier, L.B. Electrotopological State Indices for Atom Types: A Novel Combination of Electronic, Topological, and Valence State Information. J. Chem. Inf. Comput. Sci. 1995, 35, 1039–1045. [Google Scholar] [CrossRef]
  22. Durant, J.L.; Leland, B.A.; Henry, D.R.; Nourse, J.G. Reoptimization of MDL Keys for Use in Drug Discovery. J. Chem. Inf. Comput. Sci. 2002, 42, 1273–1280. [Google Scholar] [CrossRef]
  23. PubChem Substructure Fingerprint Description. Available online: https://ftp.ncbi.nlm.nih.gov/pubchem/specifications/pubchem_fingerprints.txt (accessed on 25 July 2024).
  24. Laggner, C. SMARTS Patterns for Functional Group Classification; Inte: Ligand Software-Entwicklungs und Consulting GmbH: Wien, Austria, 2005. [Google Scholar]
  25. Klekota, J.; Roth, F.P. Chemical Substructures That Enrich for Biological Activity. Bioinformatics 2008, 24, 2518–2525. [Google Scholar] [CrossRef]
  26. Carhart, R.E.; Smith, D.H.; Venkataraghavan, R. Atom Pairs as Molecular Features in Structure-Activity Studies: Definition and Applications. J. Chem. Inf. Comput. Sci. 1985, 25, 64–73. [Google Scholar] [CrossRef]
  27. Phanus-Umporn, C.; Shoombuatong, W.; Prachayasittikul, V.; Anuwongcharoen, N.; Nantasenamat, C. Privileged Substructures for Anti-Sickling Activity via Cheminformatic Analysis. RSC Adv. 2018, 8, 5920–5935. [Google Scholar] [CrossRef] [PubMed]
  28. Mendez, D.; Gaulton, A.; Bento, A.P.; Chambers, J.; De Veij, M.; Félix, E.; Magariños, M.P.; Mosquera, J.F.; Mutowo, P.; Nowotka, M.; et al. ChEMBL: Towards Direct Deposition of Bioassay Data. Nucleic Acids Res. 2019, 47, D930–D940. [Google Scholar] [CrossRef]
  29. Yap, C.W. PaDEL-Descriptor: An Open Source Software to Calculate Molecular Descriptors and Fingerprints. J. Comput. Chem. 2011, 32, 1466–1474. [Google Scholar] [CrossRef]
  30. Aqeel, I.; Bilal, M.; Majid, A.; Majid, T. Hybrid Approach to Identifying Druglikeness Leading Compounds Against COVID-19 3CL Protease. Pharmaceuticals 2022, 15, 1333. [Google Scholar] [CrossRef] [PubMed]
  31. Malik, A.A.; Chotpatiwetchkul, W.; Phanus-Umporn, C.; Nantasenamat, C.; Charoenkwan, P.; Shoombuatong, W. StackHCV: A Web-Based Integrative Machine-Learning Framework for Large-Scale Identification of Hepatitis C Virus NS5B Inhibitors. J. Comput. Aided Mol. Des. 2021, 35, 1037–1053. [Google Scholar] [CrossRef]
  32. Molecular Descriptors. Available online: https://chem.libretexts.org/Courses/Intercollegiate_Courses/Cheminformatics/06%3A_Molecular_Similarity/6.01%3A_Molecular_Descriptors (accessed on 25 July 2024).
  33. Liu, Y.; Bi, M.; Zhang, X.; Zhang, N.; Sun, G.; Zhou, Y.; Zhao, L.; Zhong, R. Machine Learning Models for the Classification of CK2 Natural Products Inhibitors with Molecular Fingerprint Descriptors. Processes 2021, 9, 2074. [Google Scholar] [CrossRef]
  34. Amrehn, M.; Mualla, F.; Angelopoulou, E.; Steidl, S.; Maier, A. The Random Forest Classifier in WEKA: Discussion and New Developments for Imbalanced Data. arXiv 2018, arXiv:1812.08102. [Google Scholar]
  35. Osmanli, S.; Akansu, S.O.; Azginoglu, N.; Akansu, Y.E.; Develi, I. Investigation of S1046 Profile Bladed Vertical Axis Wind Turbine and Artificial Intelligence-Based Performance Evaluation. Energy Sources Part A Recovery Util. Environ. Eff. 2023, 45, 8771–8790. [Google Scholar] [CrossRef]
  36. Voršilák, M.; Kolář, M.; Čmelo, I.; Svozil, D. SYBA: Bayesian Estimation of Synthetic Accessibility of Organic Compounds. J. Cheminform. 2020, 12, 35. [Google Scholar] [CrossRef] [PubMed]
  37. Siramshetty, V.; Williams, J.; Nguyễn, Ð.-T.; Neyra, J.; Southall, N.; Mathé, E.; Xu, X.; Shah, P. Validating ADME QSAR Models Using Marketed Drugs. SLAS Discov. Sci. Drug Discov. 2021, 26, 1326–1336. [Google Scholar] [CrossRef] [PubMed]
  38. Carracedo-Reboredo, P.; Liñares-Blanco, J.; Rodríguez-Fernández, N.; Cedrón, F.; Novoa, F.J.; Carballal, A.; Maojo, V.; Pazos, A.; Fernandez-Lozano, C. A Review on Machine Learning Approaches and Trends in Drug Discovery. Comput. Struct. Biotechnol. J. 2021, 19, 4538–4558. [Google Scholar] [CrossRef] [PubMed]
  39. Prihandoko, P.; Bertalya, B.; Setyowati, L. City Health Prediction Model Using Random Forest Classification Method. In Proceedings of the 2020 Fifth International Conference on Informatics and Computing (ICIC), Gorontalo, Indonesia, 3–4 November 2020; pp. 1–5. [Google Scholar]
Figure 1. (a) Frequency plot of bioactivity classes. (b) Scatter plot of MW vs. LogP. Active and inactive compounds are shown in blue and orange colors, respectively.
Ijms 26 02680 g001
Figure 2. (ae): A box plot illustrating the comparison of bioactivity classes between active and inactive compounds.
Ijms 26 02680 g002aIjms 26 02680 g002b
Figure 3. A schematic overview of the workflow for QSAR modeling.
Ijms 26 02680 g003
Figure 4. (a,b): Distribution of IC50 and pIC50 values.
Ijms 26 02680 g004
Figure 5. Main steps of EDA.
Ijms 26 02680 g005
Figure 6. Overview of the RF method.
Ijms 26 02680 g006
Table 1. The results of the Mann–Whitney U test pertaining to the bioactivity classes of the investigated bioactive molecules.
DescriptorStatisticspAlphaInterpretation
LogP13,400.50.0000530.05Different distribution (reject H0)
MW17,897.54.550260 × 10−250.05Different distribution (reject H0)
NumHAcceptors14,950.53.587758 × 10−100.05Different distribution (reject H0)
NumHDonors13,257.00.0001110.05Different distribution (reject H0)
pIC5021,025.04.634027 × 10−490.05Different distribution (reject H0)
Table 2. Molecular descriptors list.
Fingerprint#FeaturesDescriptionReferences
CDK1024Fingerprint of length 1024 and search depth of 8[20]
CDK extended1024Extends the fingerprint with additional bits describing ring features[20]
CDK graph only1024A special version that considers only the connectivity and not bond order[20]
E-state79Electrotopological state atom types[21]
MACCS166Binary representation of chemical features defined by MACCS keys[22]
PubChem881Binary representation of substructures defined by PubChem[23]
Substructure307Presence of SMARTS patterns for functional groups[24]
Substructure count307Count of SMARTS patterns for functional groups[24]
Klekota–Roth4860Presence of chemical substructures[25]
Klekota–Roth count4860Count of chemical substructures[25]
2D atom pairs780Presence of atom pairs at various topological distances[26]
2D atom pairs count780Count of atom pairs at various topological distances[26]
Table 3. Comparative performance of different ML models on various molecular descriptor classes.
Training SetTen-Fold CV SetTest Set
Descriptor ClassMethodA *AccTrain (%)MAERMSEMCCAccCv (%)MAERMSEMCCAccTest (%)MAERMSEMCC
CDKRF102297.93100.08700.14690.979088.27590.22010.32320.766086.20690.22630.34900.7320
CDKIBk102297.93100.02540.10590.959086.20690.14610.37110.724086.20690.14660.37260.7320
CDKLR102297.93100.02240.10590.959074.48280.25580.49830.493079.31030.20940.44600.6130
CDKAdaBoost102288.62070.18050.29500.775082.41380.21700.35840.651086.20690.19740.34510.7320
CDKOneR102278.27590.21720.46610.572074.48280.25520.50510.495070.68970.29310.54140.4410
CDK extendedRF100797.93100.08450.14400.959087.58620.21720.32380.752086.20690.21700.34560.7260
CDK extendedIBk100797.9310.02540.10590.959086.55170.14270.36650.731086.20690.14660.37260.7320
CDK extendedLR100797.93100.02240.10590.959075.17240.25060.49350.506077.58620.23300.47000.5560
CDK extendedOneR100775.86210.24140.49130.526073.10340.26900.51860.466063.79310.36210.60170.2890
CDK extendedAdaBoost100788.27590.18570.28960.766080.00000.24020.37560.602075.86210.27060.40540.5730
EstateRF3494.82760.10950.20040.898087.93100.19960.32230.760082.75860.23660.37810.6630
EstateIBk3494.82760.06970.18420.899087.24140.15550.33450.748082.75860.21270.41280.6720
EstateLR3488.62070.16200.28560.773080.34480.22930.40170.611075.86210.25150.43640.5420
EstateAdaBoost3481.03450.32660.38270.632078.62070.32530.39260.579079.31030.33090.39970.6280
EstateOneR3469.65520.30340.55090.411067.24140.32760.57240.350063.79310.36210.60170.4140
CDK graph onlyRF97997.58620.08640.15820.952088.96550.19940.31810.779089.65520.21140.33040.7950
CDK graph onlyIBk97997.58620.03460.12640.952086.20690.15410.36940.724084.48280.16610.36590.7020
CDK graph onlyLR97997.58620.03200.12640.952073.79310.26900.50400.479074.13790.23830.46950.4830
CDK graph onlyAdaBoost97989.31030.20380.29590.788083.79310.25400.35580.676086.20690.19550.30940.7260
CDK graph onlyOneR97972.75860.27240.52190.461066.55170.33450.57830.335067.24140.32760.57240.3800
MACCSRF14598.27590.07690.13930.966087.24140.19460.30920.745087.93100.19900.31040.7630
MACCSIBk14598.27590.02290.10030.966086.89660.13830.35850.739086.20690.13730.35480.7260
MACCSLR14597.24140.03290.12860.945074.13790.26190.50260.483082.75860.18800.42180.6630
MACCSAdaBoost14583.79310.22410.33370.681082.75860.24560.36000.657084.48280.23560.35680.7020
MACCSOneR14575.17240.24830.49830.506075.17240.24830.49830.506070.68970.29310.54140.4130
PubChemRF56198.27590.08060.14290.966087.24140.19270.31010.745087.93100.21180.34670.7710
PubChemIBk56198.27590.02290.10030.966084.82760.15270.37380.698087.93100.16030.36950.7710
PubChemLR56198.27590.02010.10030.966071.72410.28490.52730.438084.48280.15680.38110.7020
PubChemAdaBoost56185.86210.18380.31090.718086.20690.19320.33080.724086.20690.18630.34360.7420
PubChemOneR56185.86210.14140.37600.718085.86210.14140.37600.718084.48280.15520.39390.7130
SubstructureRF10194.13790.11020.20390.885086.89660.19710.31880.738082.75860.22000.33830.6570
SubstructureIBk10194.13790.07440.19010.885086.20690.15900.34340.726081.03450.20630.41090.6320
SubstructureLR10194.13790.07350.19160.884078.27590.21270.42420.566081.03450.19380.41690.6210
SubstructureAdaBoost10184.13790.27820.34890.694079.31030.29740.37930.597067.24140.32100.41550.4130
SubstructureOneR10170.68970.29310.54140.499068.27590.31720.56320.414072.41380.27590.52520.5030
Substructure countRF10598.27590.06990.13550.966089.31030.17910.30720.787087.93100.18480.31120.7710
Substructure countIBk10598.27590.02190.09740.966085.17240.15920.38850.703082.75860.17210.40010.6630
Substructure countLR10597.58620.03070.12370.952078.27590.22500.46550.567082.75860.17990.41770.6550
Substructure countAdaBoost10583.44830.21480.32750.671081.72410.22240.35590.635082.75860.22700.36290.6720
Substructure countOneR10583.44830.16550.40680.669081.03450.18970.43550.622081.03450.18970.43550.6420
Klekota–RothRF109498.62070.07630.13410.973087.24140.19660.31800.745086.20690.17820.30260.7420
Klekota–RothIBk109498.62070.01860.08810.973086.89660.14020.36000.738084.48280.14860.35510.7020
Klekota–RothLR109498.62070.01550.08810.972071.72410.28030.52050.437079.31030.20980.44380.6130
Klekota–RothAdaBoost109486.20690.19460.30820.733086.55170.20170.31860.731087.93100.18940.32740.7710
Klekota–RothOneR109478.27590.21720.46610.573074.82760.25170.50170.503077.58620.22410.47340.5510
Klekota–Roth countRF109798.62070.07300.13300.973087.24140.18740.31680.745084.48280.18680.31440.7020
Klekota–Roth countIBk109798.62070.01860.08810.973081.37930.19070.42680.630084.48280.16350.39470.7130
Klekota–Roth countLR109798.62070.01550.08810.972078.27590.22130.46320.568081.03450.18910.41240.6420
Klekota–Roth countAdaBoost109786.89660.18720.30720.739084.13790.21880.35570.684084.48280.21000.34300.7020
Klekota–Roth countOneR109783.10340.16900.41110.667076.55170.23450.48420.531072.41380.27590.52520.4480
2D atom pairsRF29895.86210.10530.19200.917087.93100.20530.31740.759086.20690.22780.32900.7240
2D atom pairsIBk29895.86210.06030.17070.918087.58620.15330.34050.752087.93100.18210.35840.7590
2D atom pairsLR29894.82760.06700.18370.897076.20690.25790.47810.526079.31030.25330.45650.5860
2D atom pairsAdaBoost29884.13790.24340.33220.696082.75860.26360.36090.666082.75860.31570.39900.6630
2D atom pairsOneR29874.13790.25860.50850.505074.13790.25860.50850.505077.58620.22410.47340.5530
2D atom pairs countRF30198.62070.07090.13180.973087.24140.17200.30250.745087.93100.18420.32650.7710
2D atom pairs countIBk30198.62070.01860.08810.973084.82760.15480.38360.697084.48280.16360.39470.6900
2D atom pairs countLR30198.62070.01550.08810.973073.44830.26340.50720.470084.48280.15670.38610.6890
2D atom pairs countAdaBoost30186.55170.17290.29770.732084.82760.19780.34200.698081.03450.20260.37520.6320
2D atom pairs countOneR30186.55170.13450.36670.733081.03450.18970.43550.621082.75860.17240.41520.6720
A *: denotes the number of attributes remaining after applying WEKA’s ‘RemoveUseless’ filter.
Disclaimer/Publisher’s Note: The statements, opinions and data contained in all publications are solely those of the individual author(s) and contributor(s) and not of MDPI and/or the editor(s). MDPI and/or the editor(s) disclaim responsibility for any injury to people or property resulting from any ideas, methods, instructions or products referred to in the content.

