
Near-Edge X-Ray Absorption Fine-Structure Spectra and Specific Dissociation of Phe-Gly and Gly-Phe

 ,
, 
Abstract
1. Introduction
2. Results and Discussion
2.1. Experimental and Theoretical NEXAFS Spectra
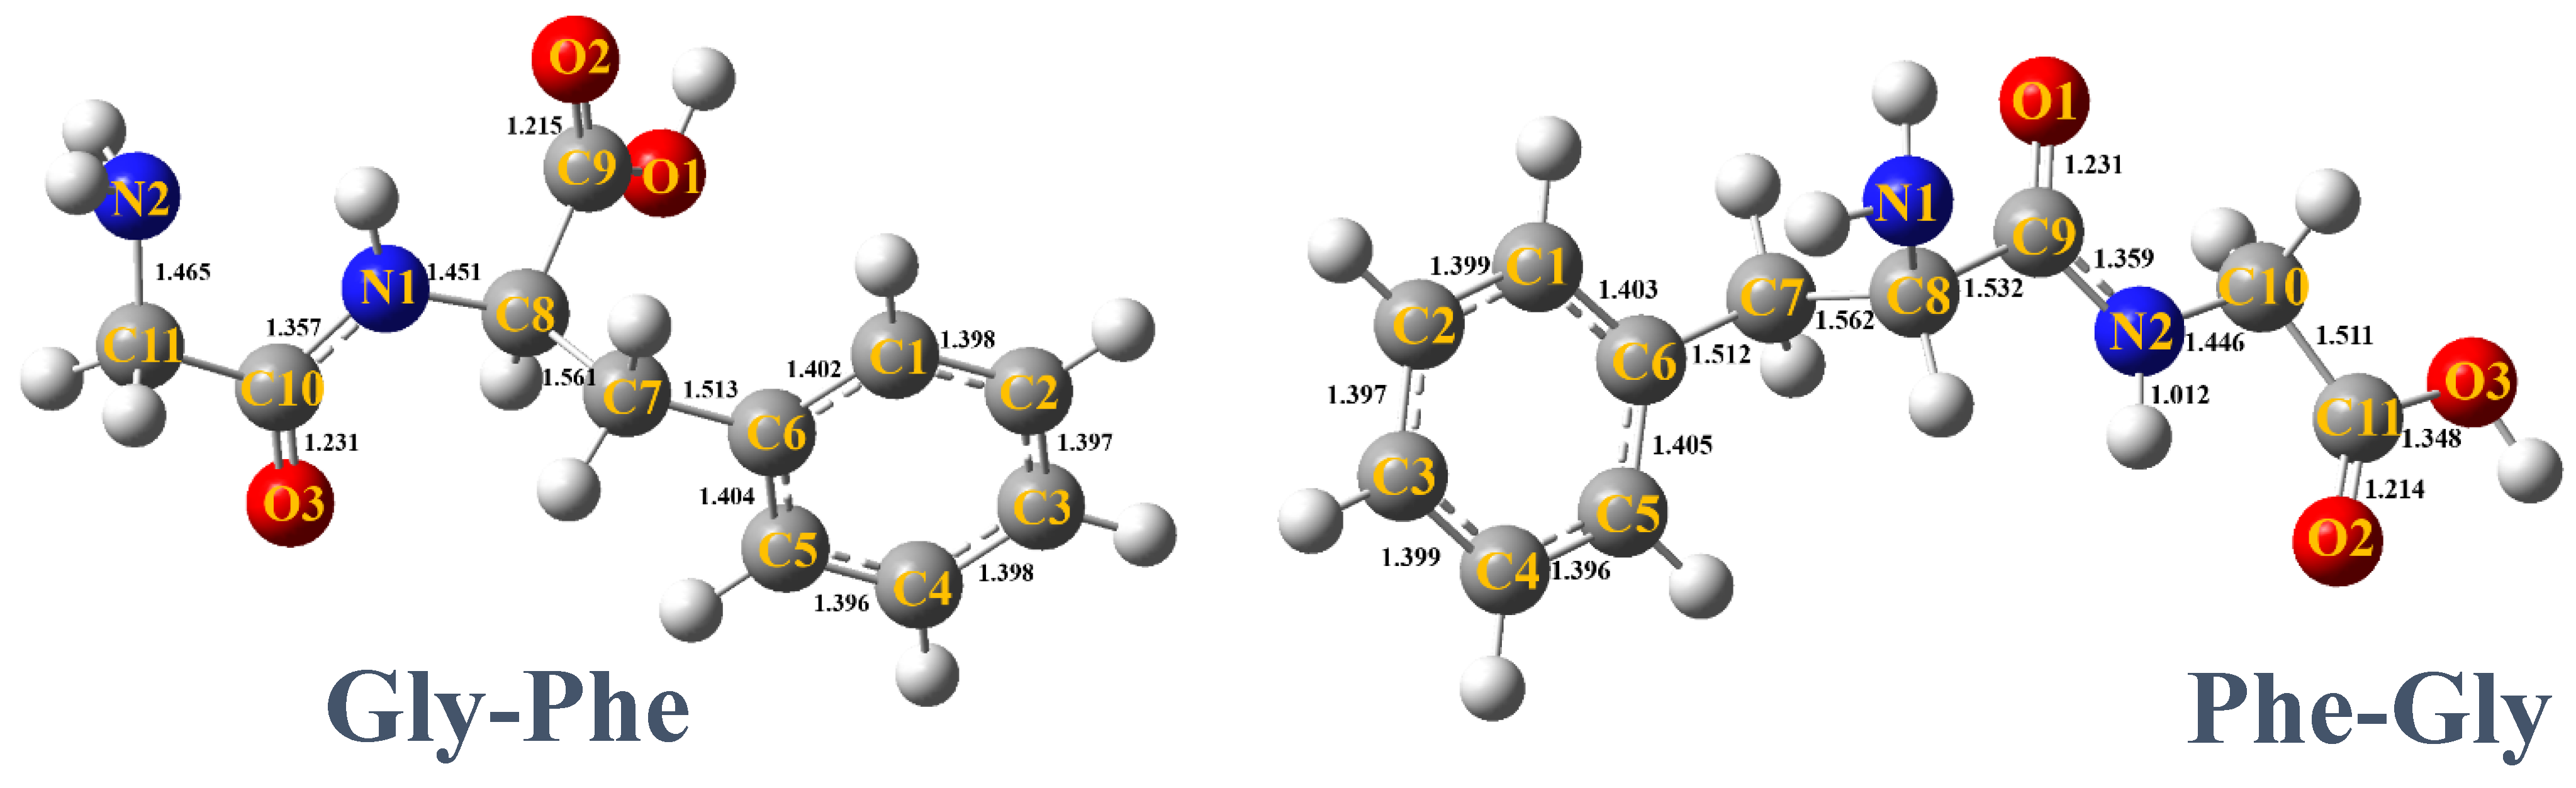
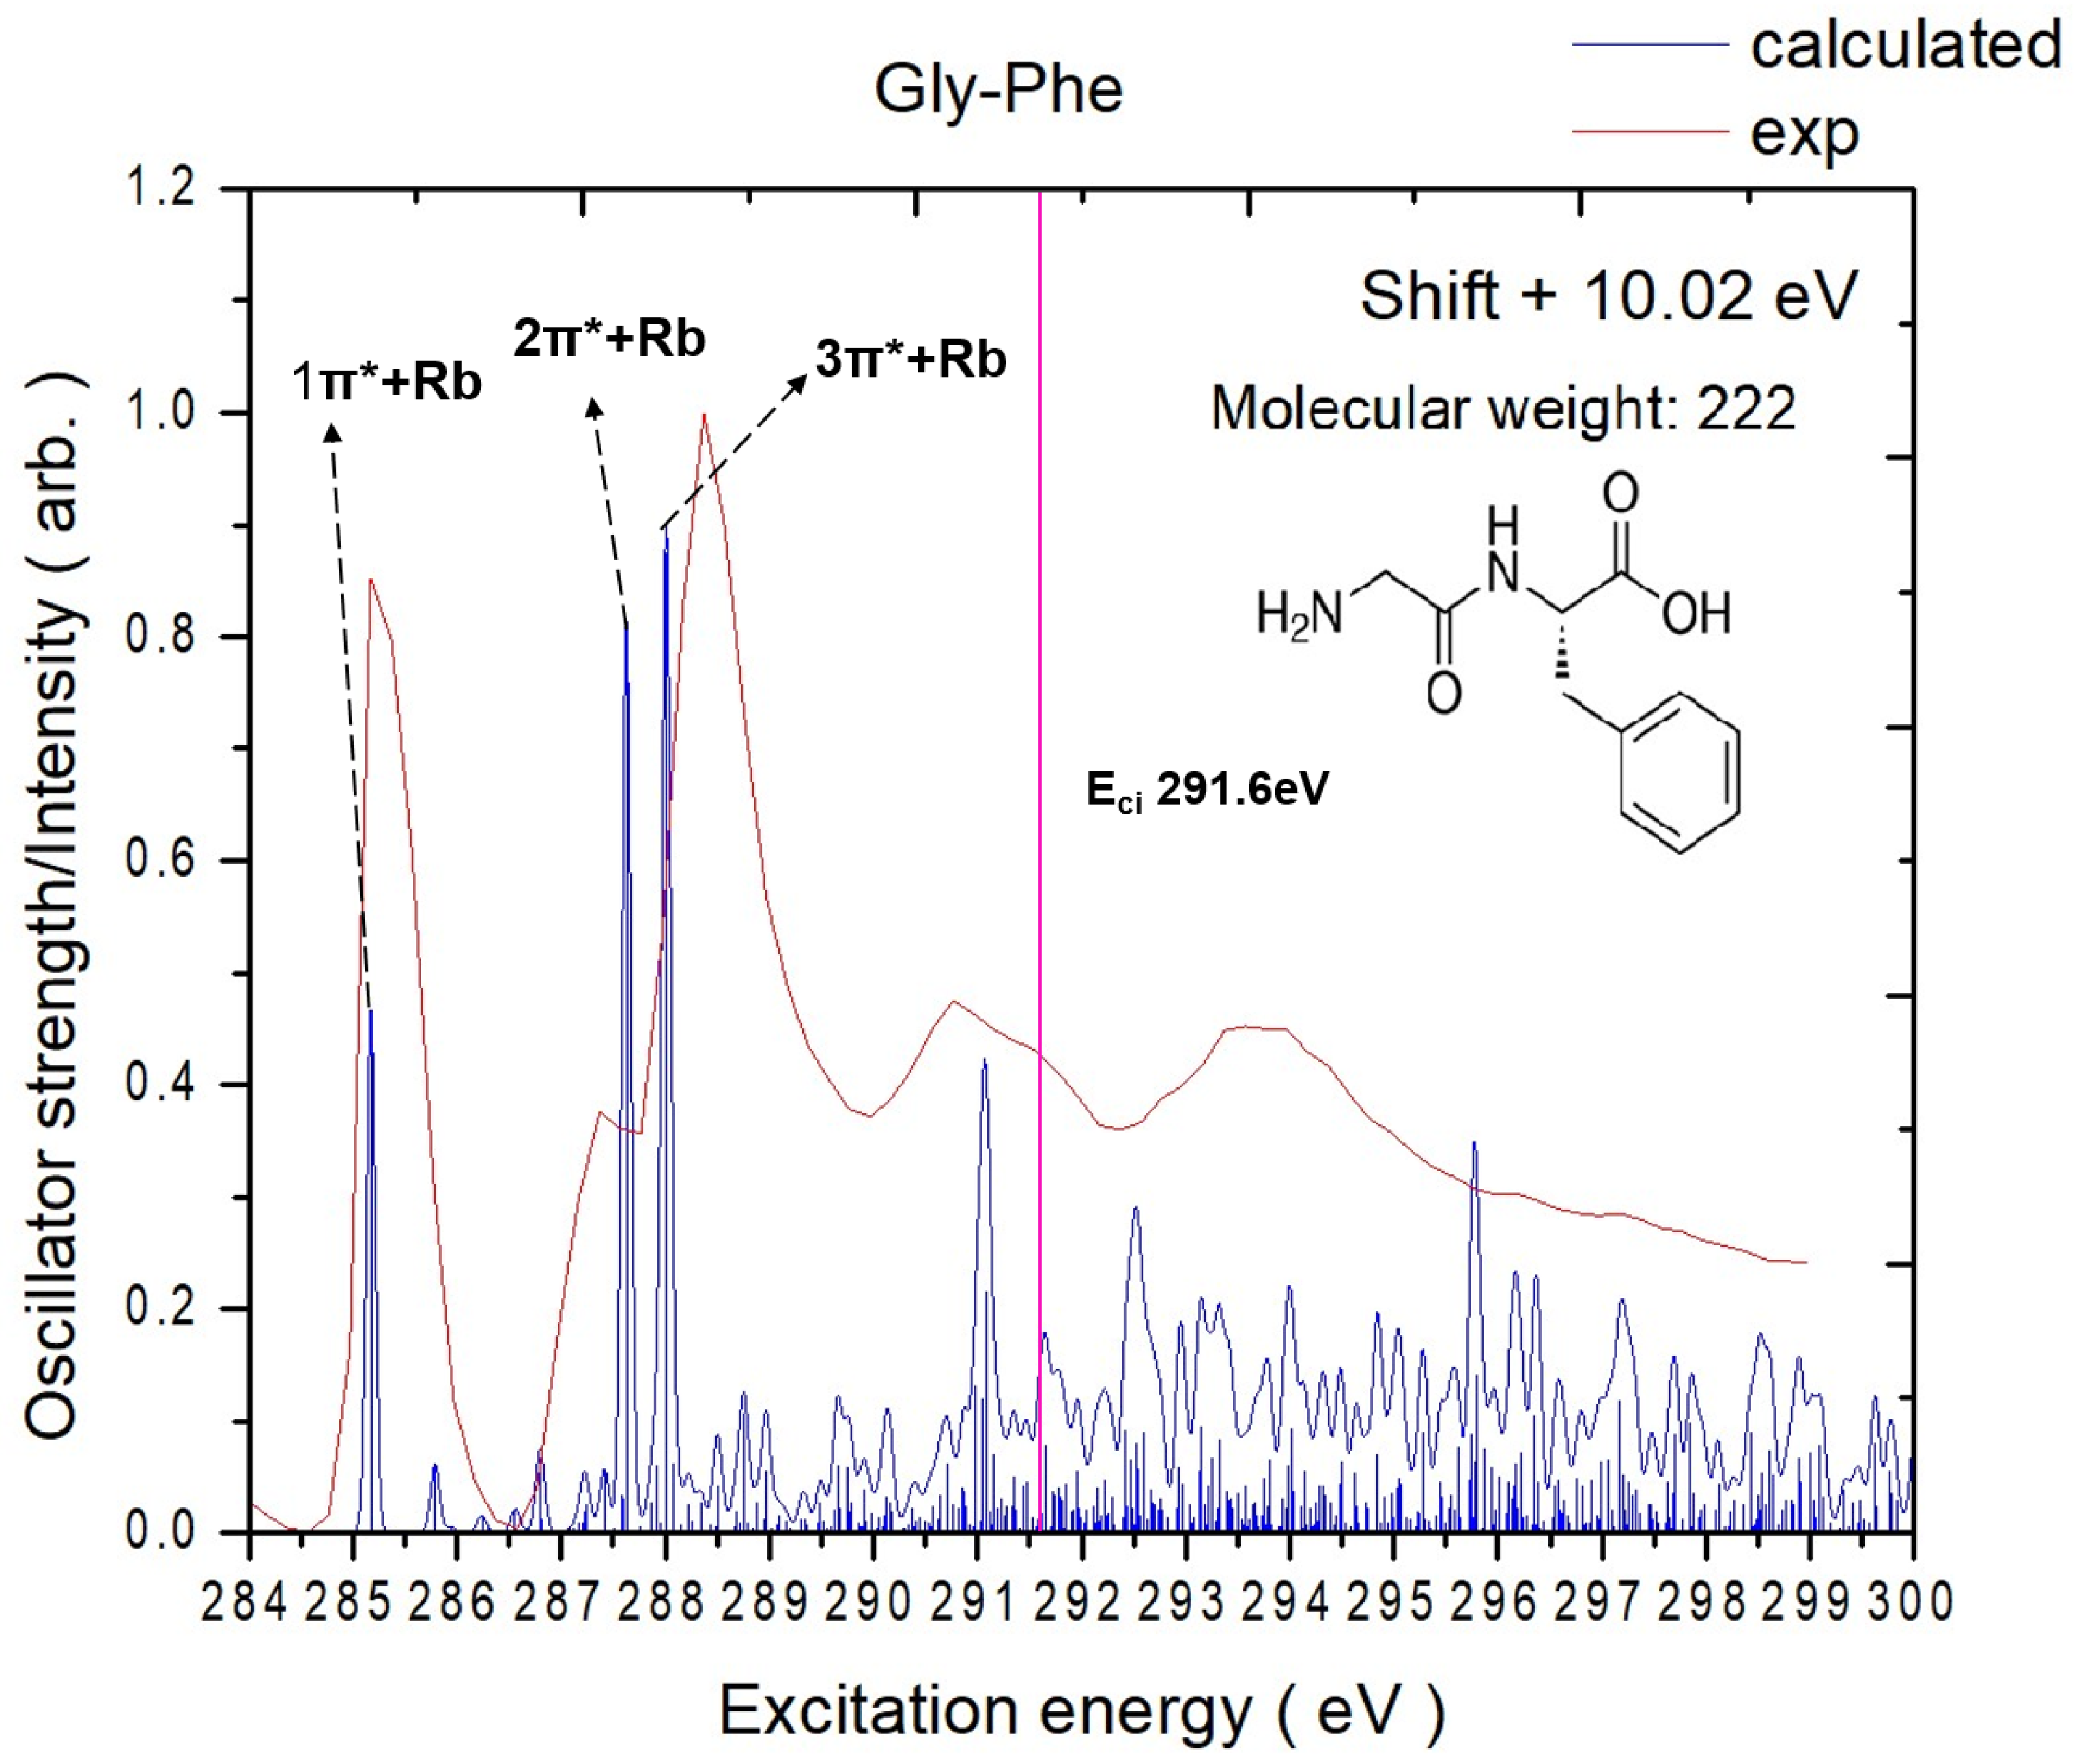
2.1.1. Gly-Phe
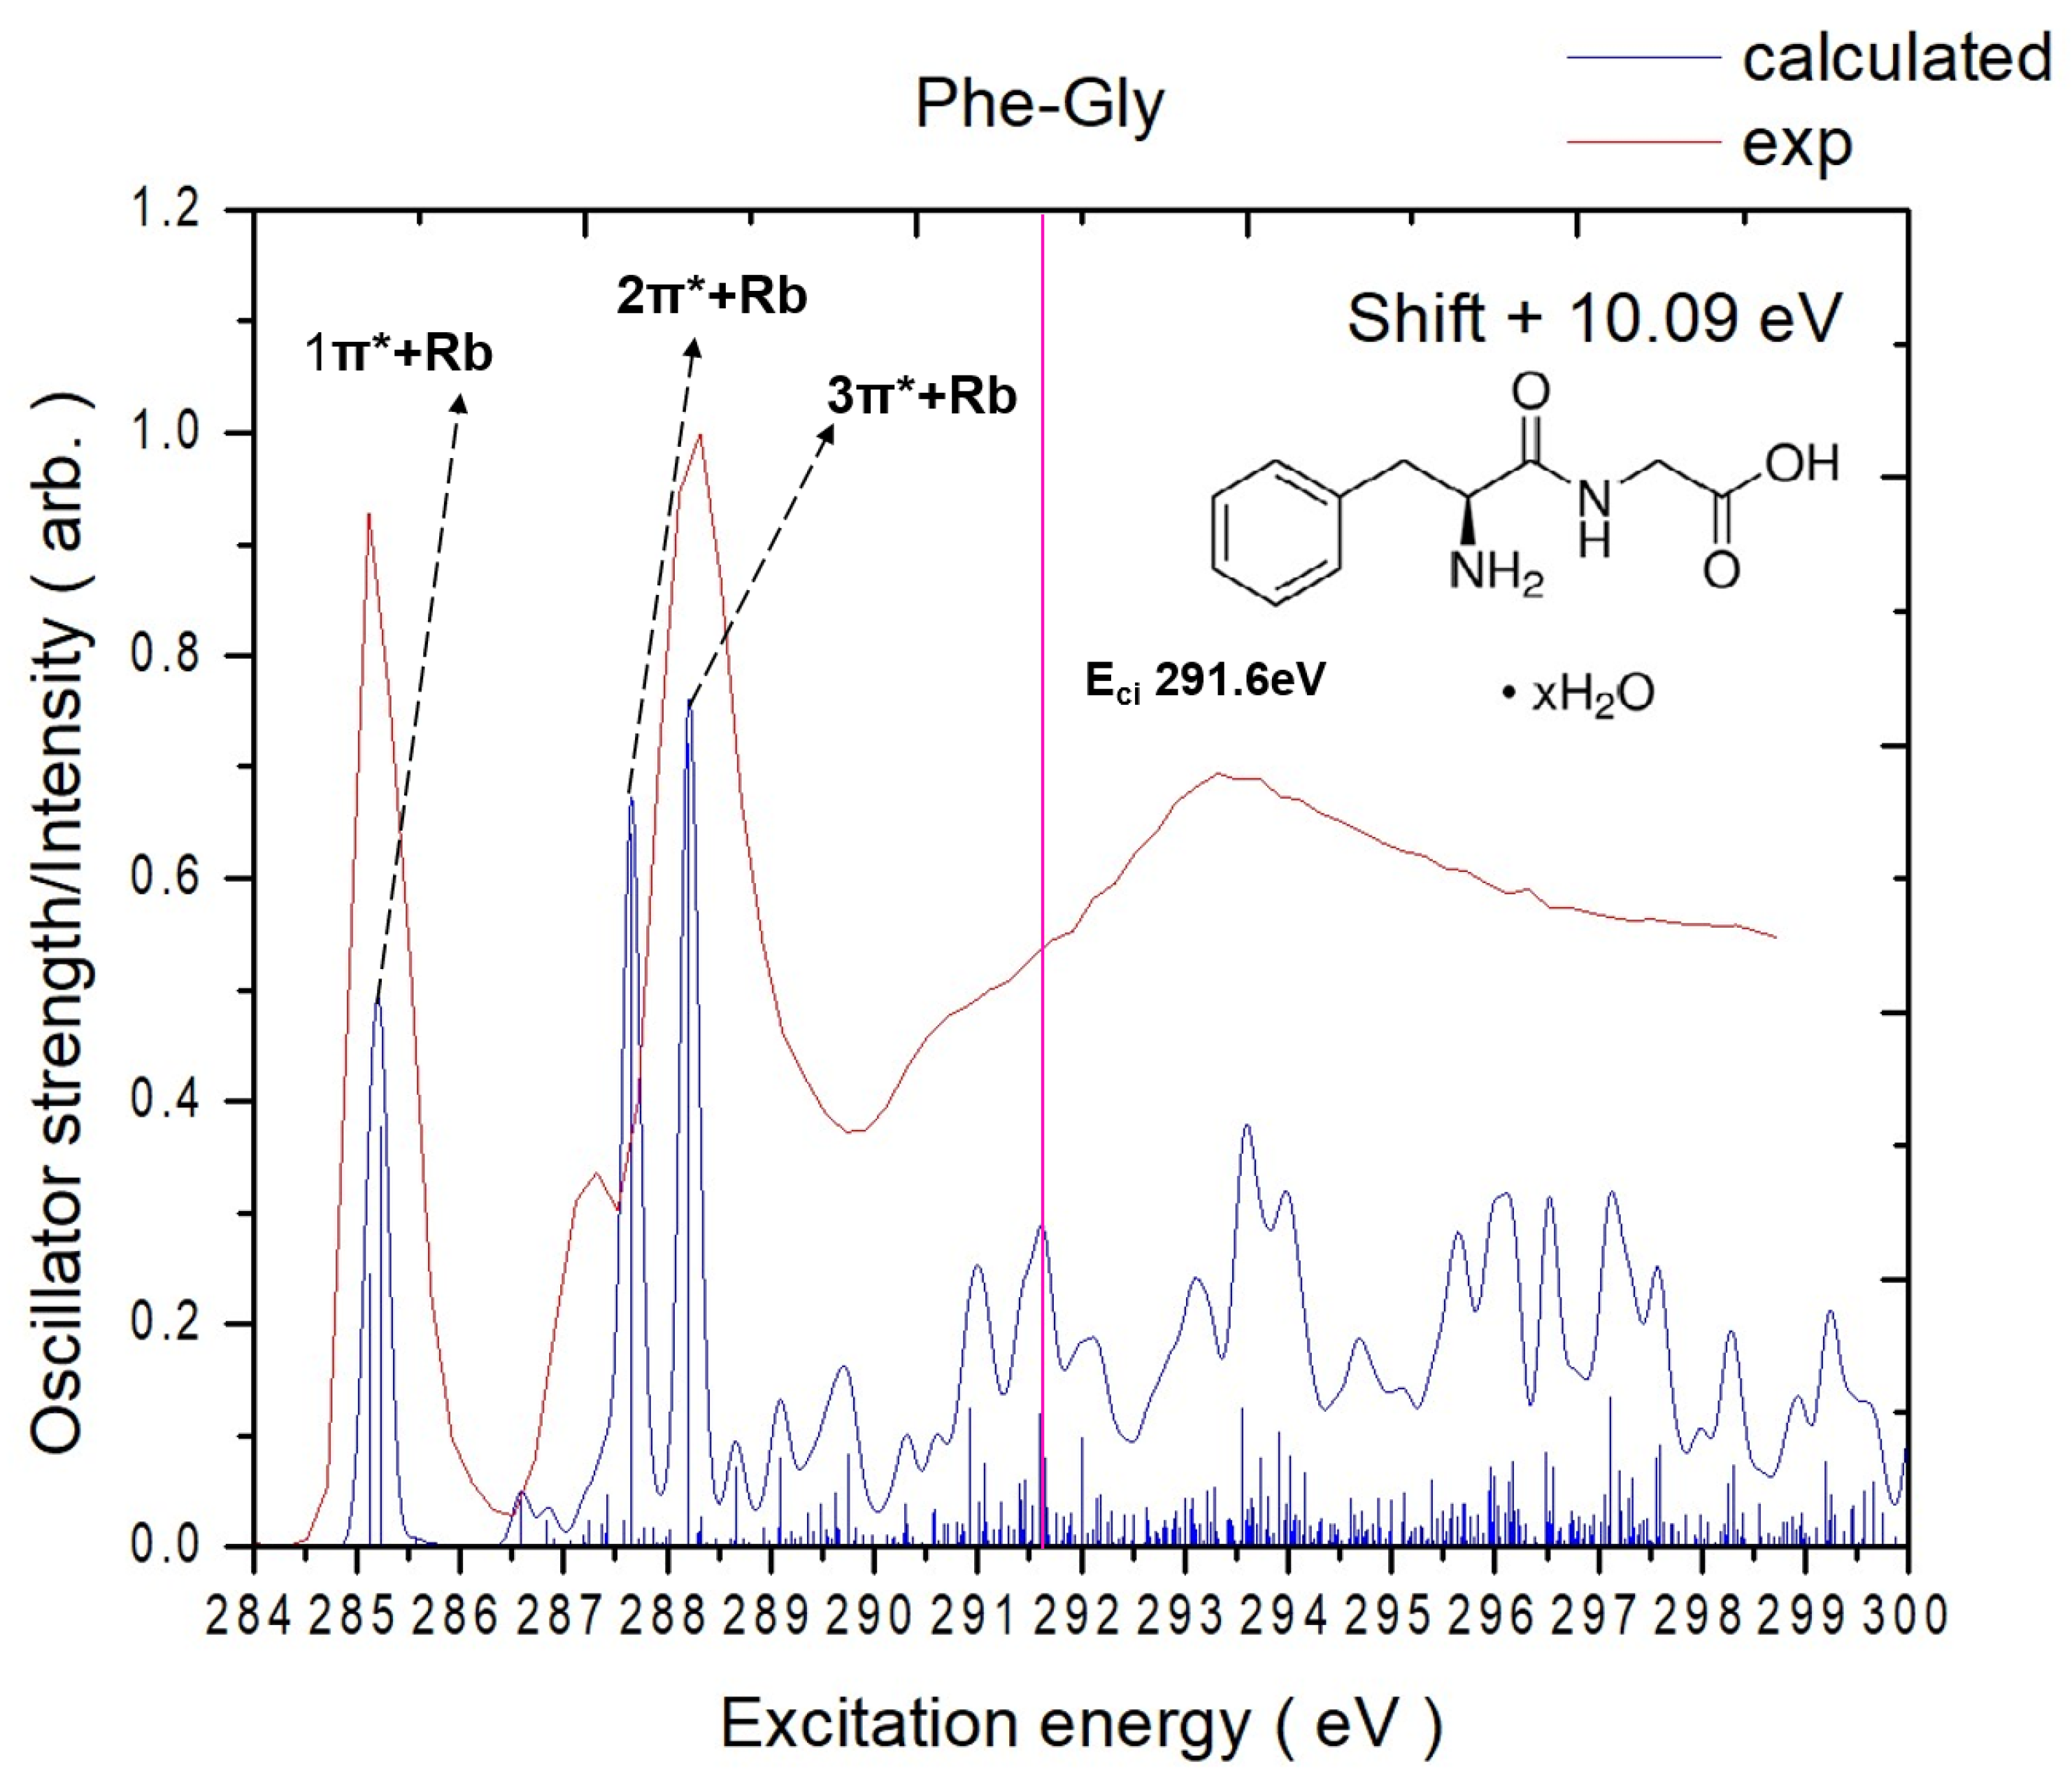
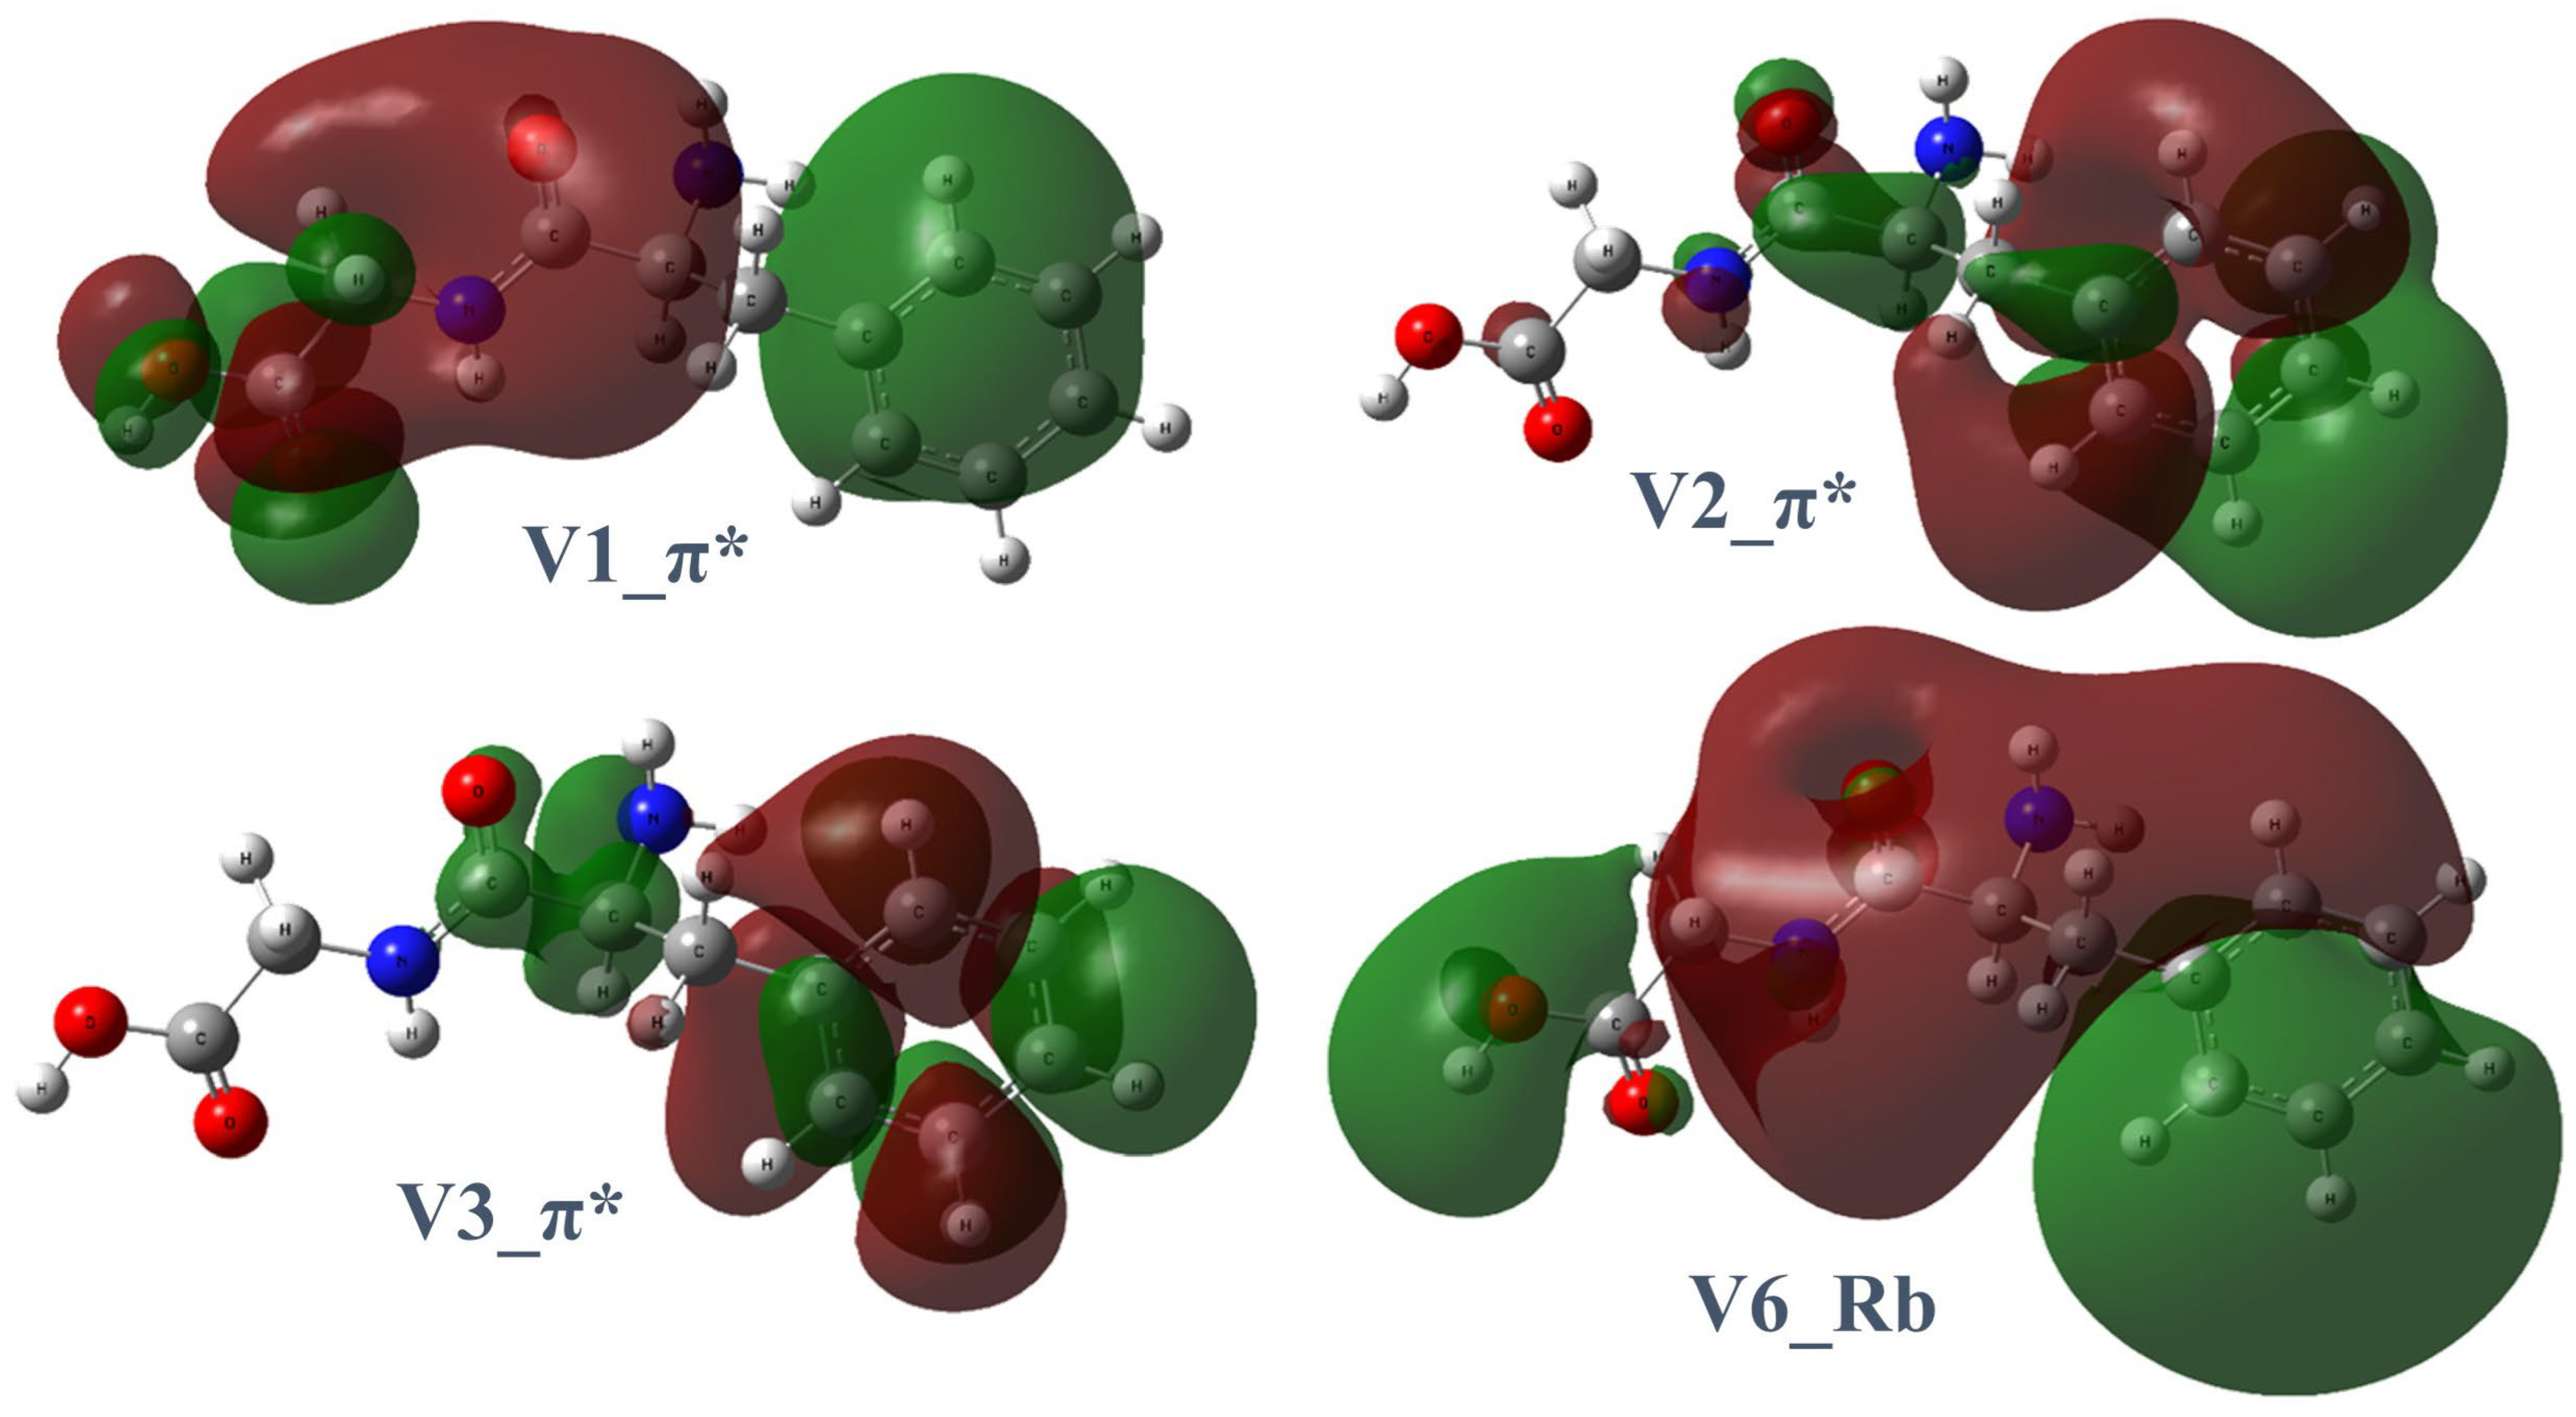
2.1.2. Phe-Gly
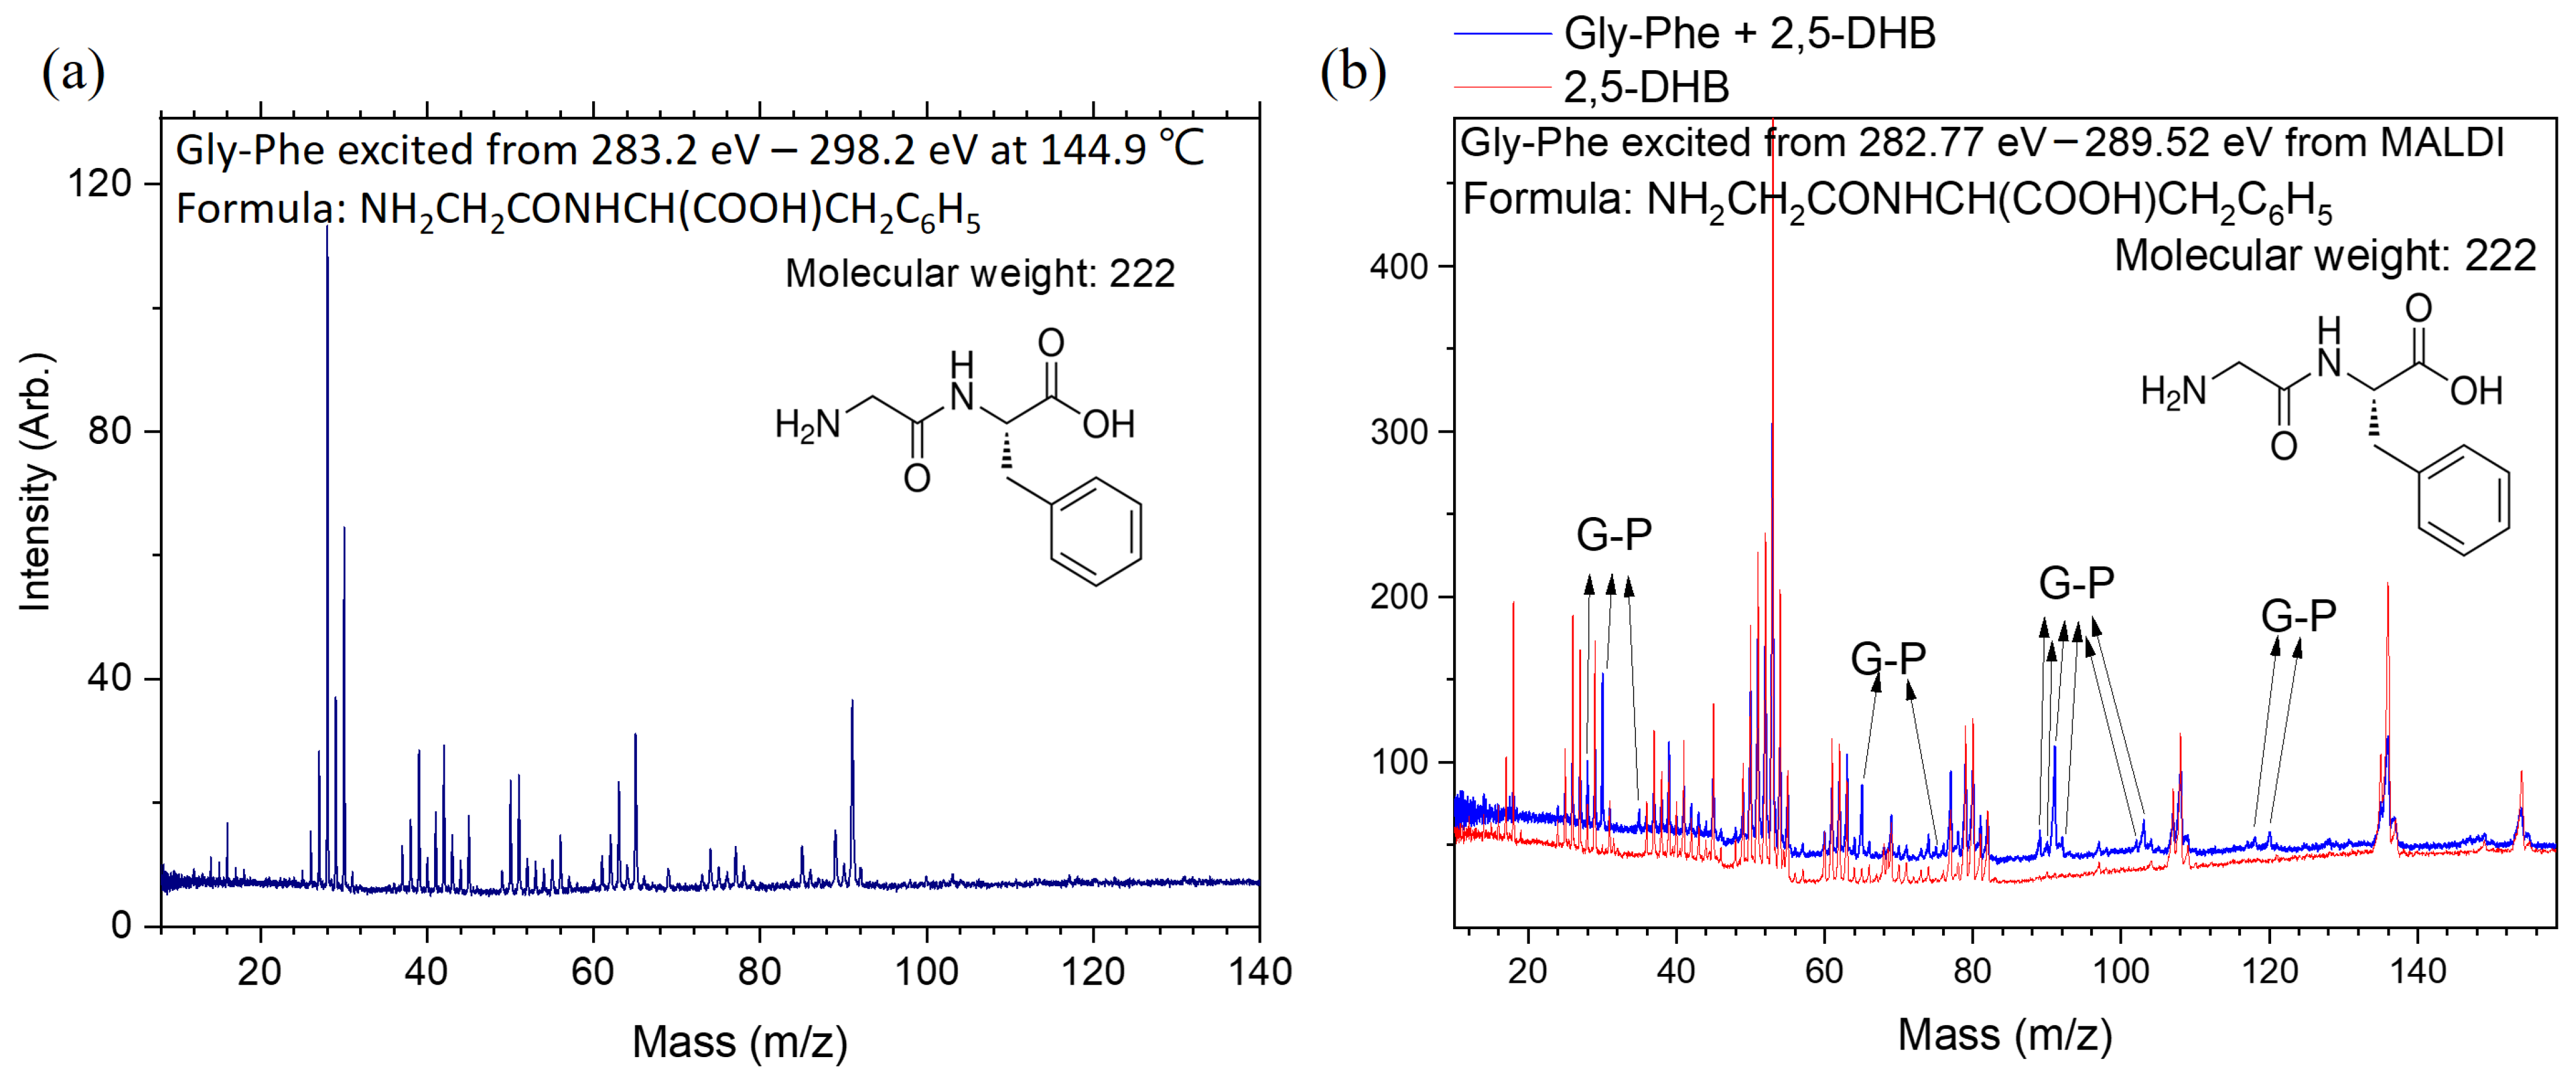
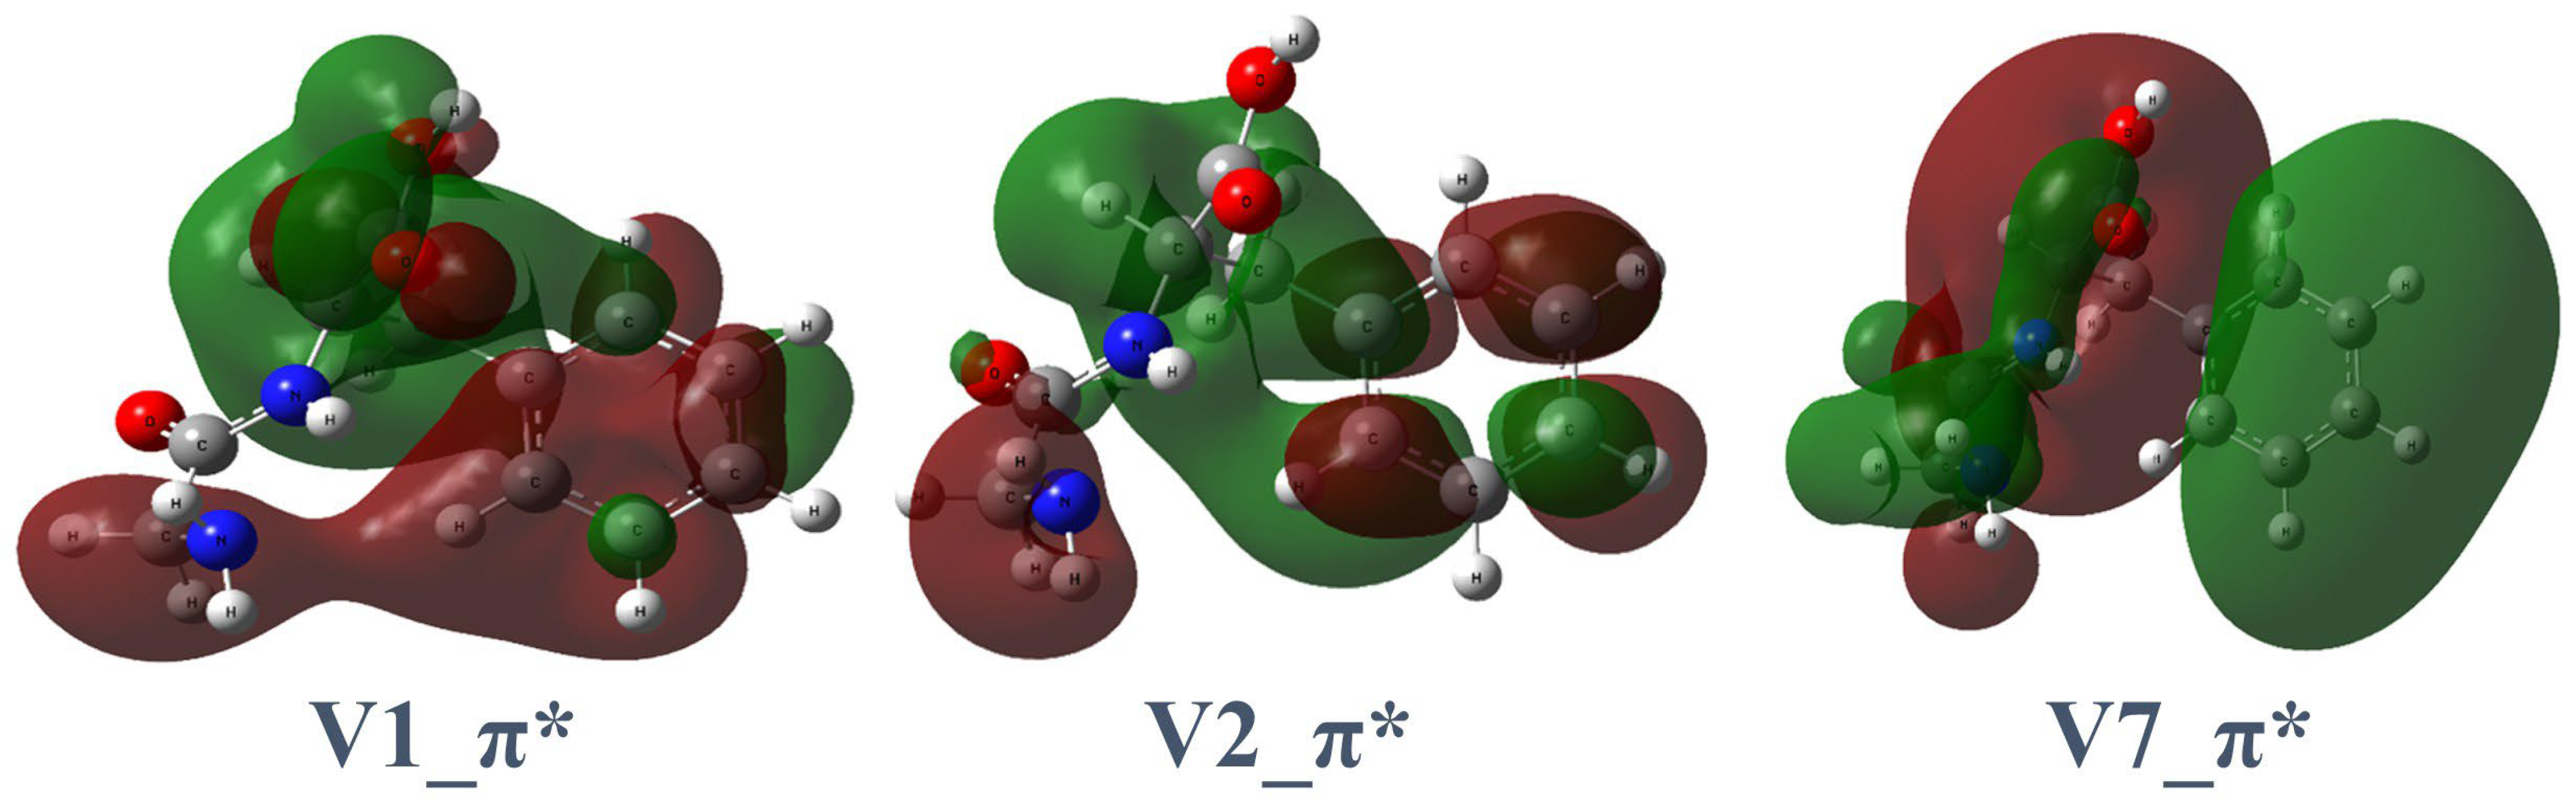
2.2. Dissociation Pathways and Specific Dissociations of Gly-Phe
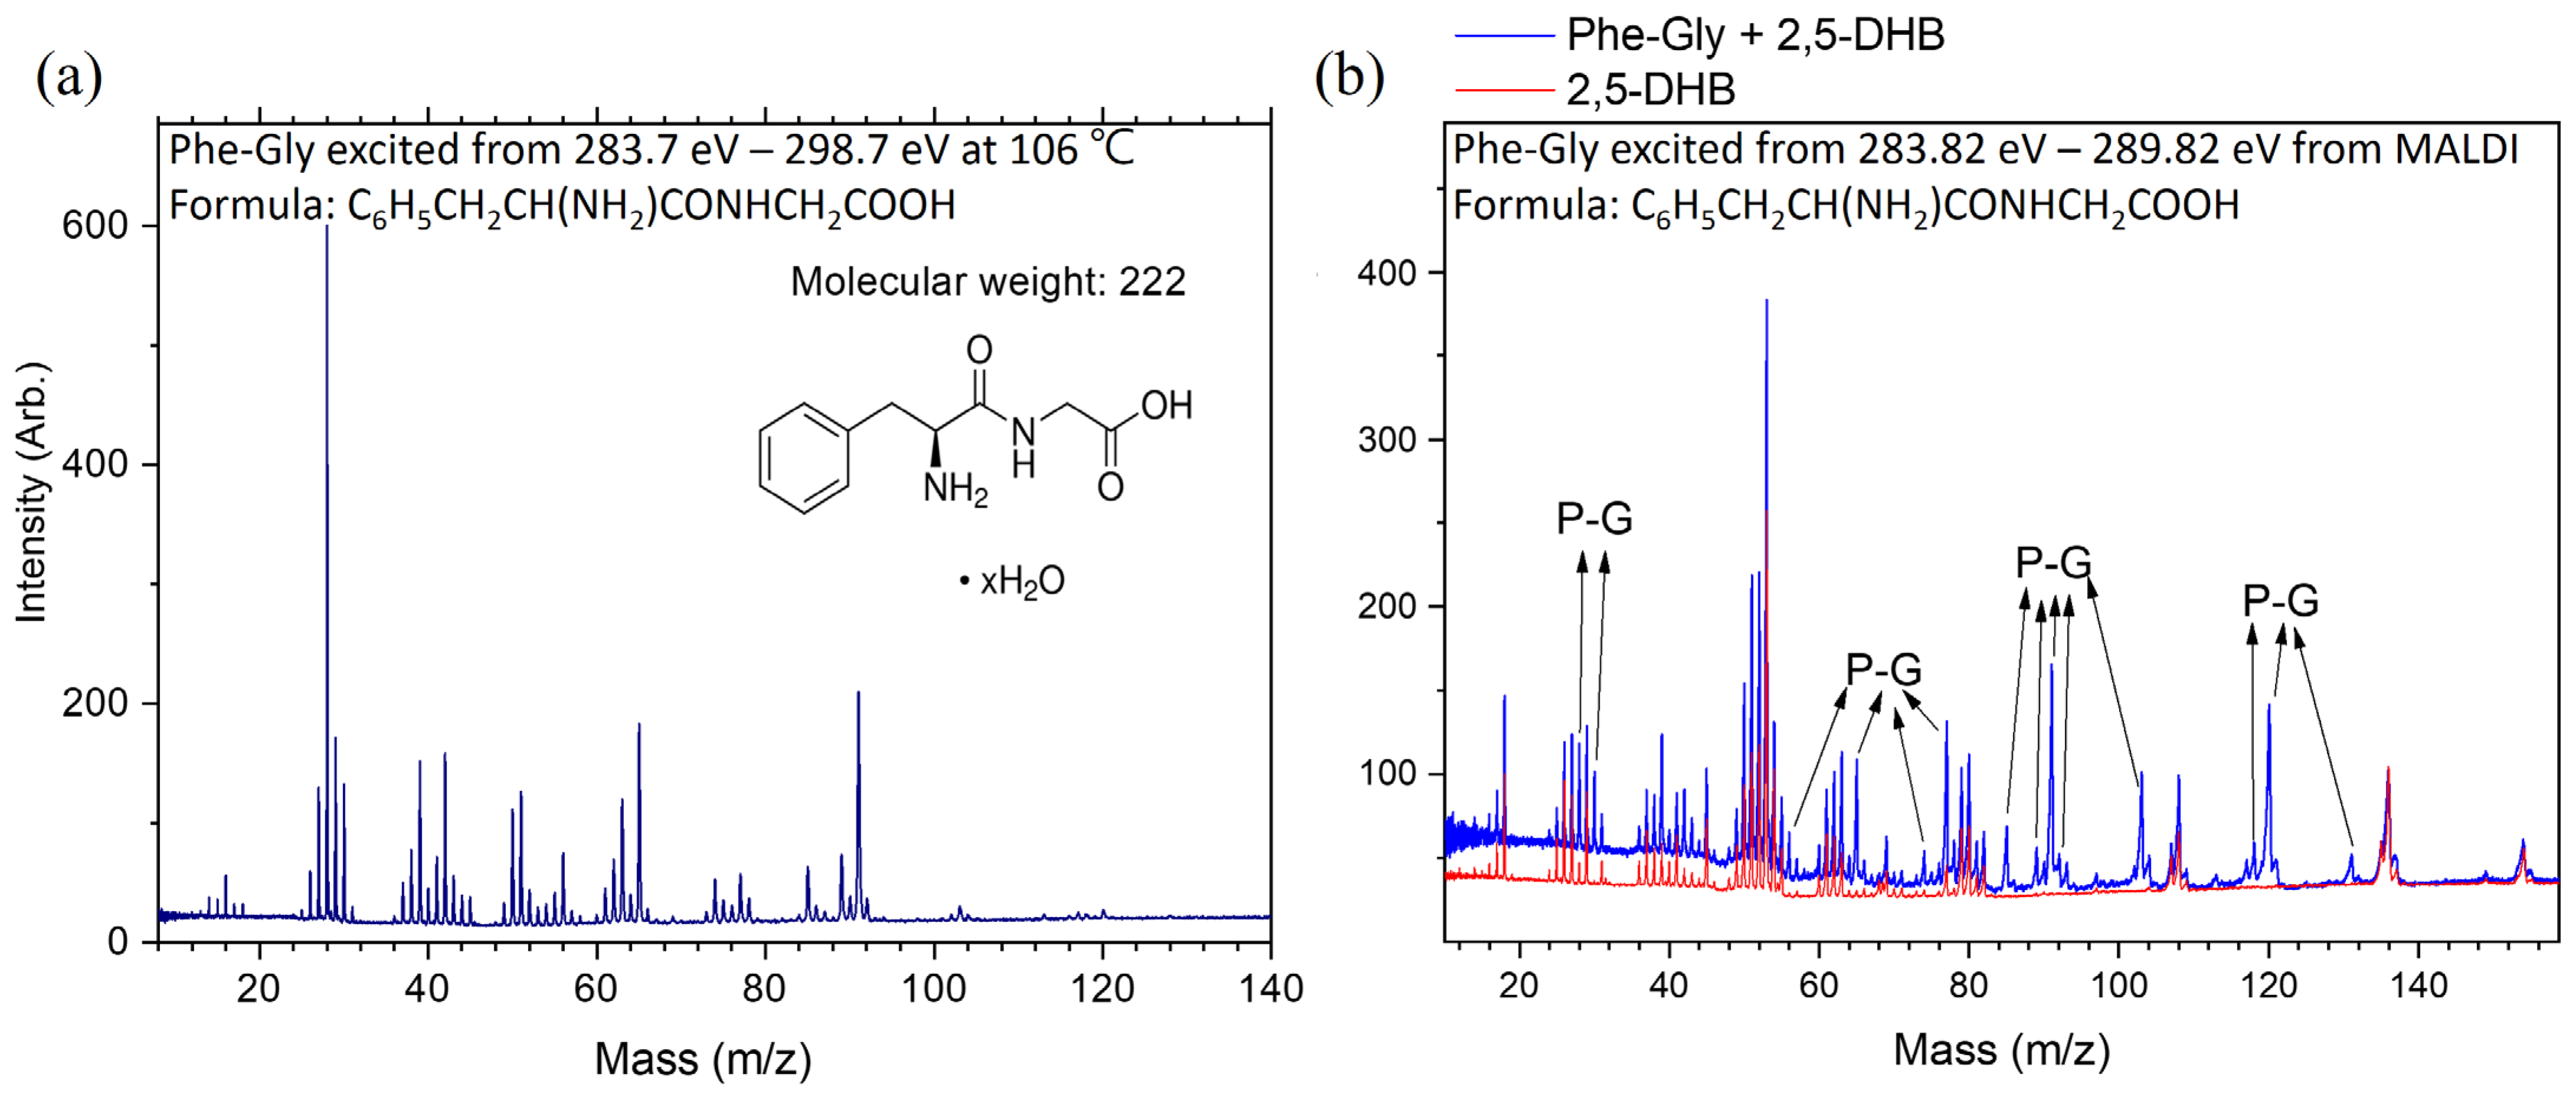
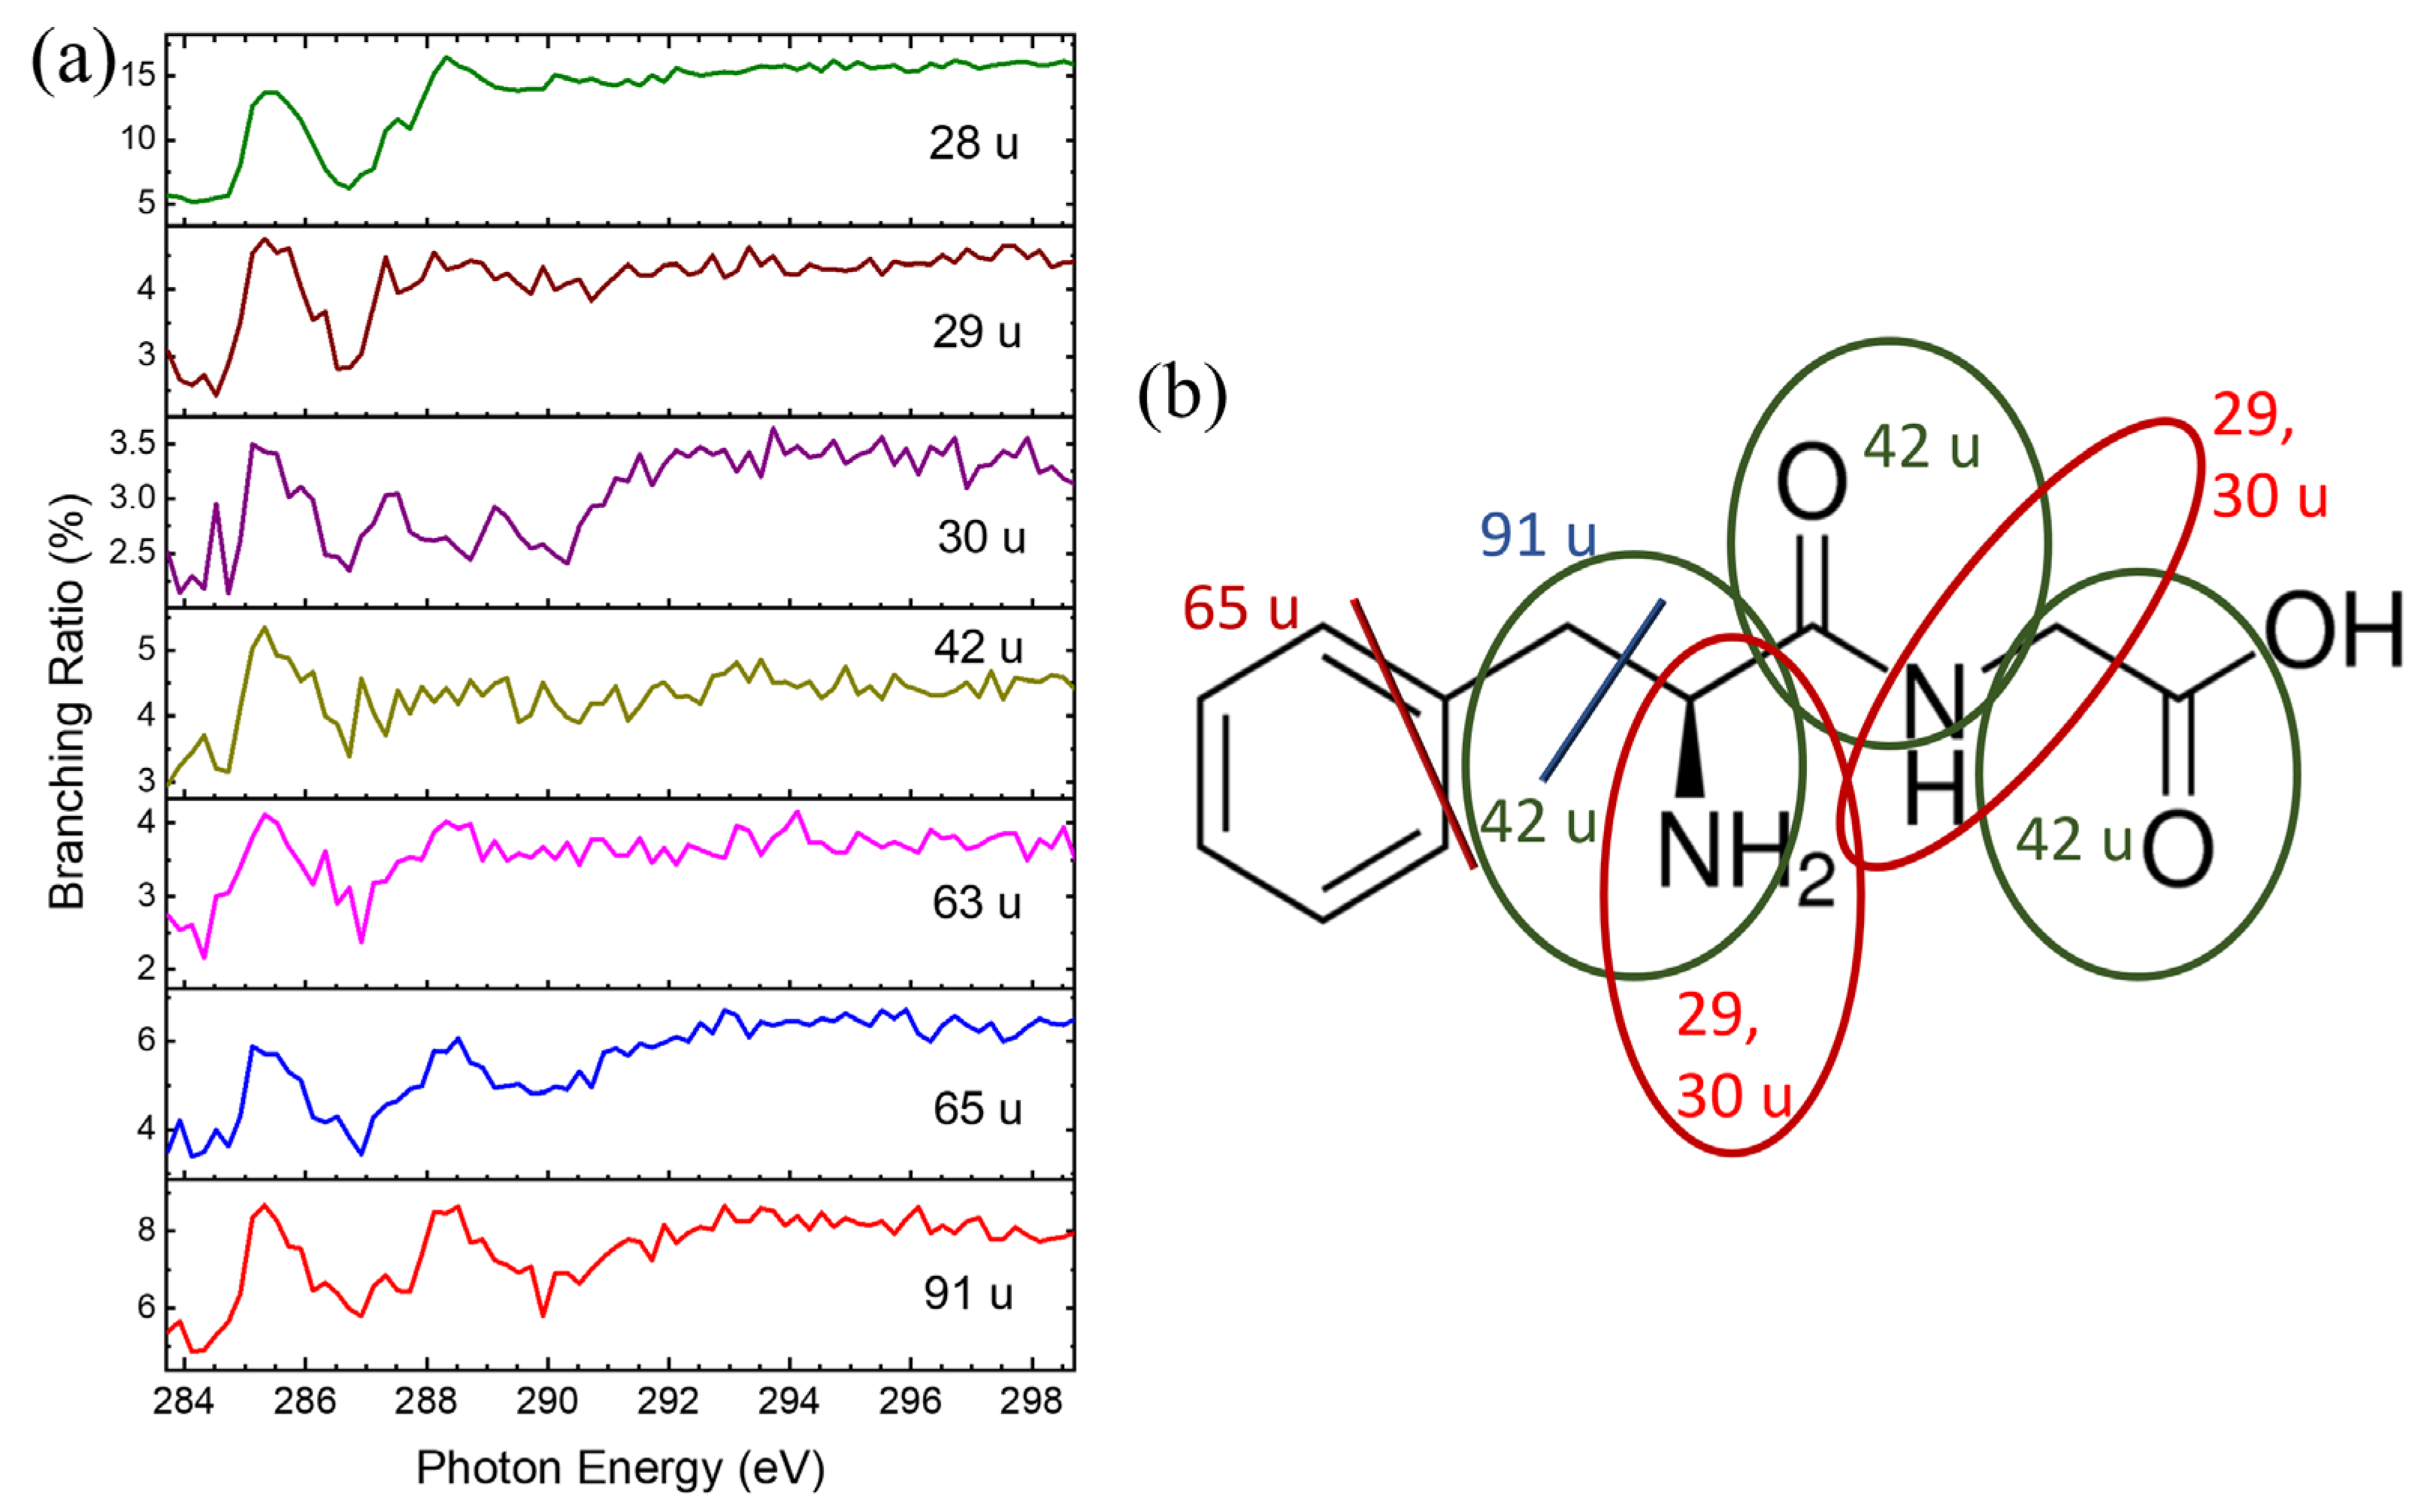
2.3. Dissociation Pathways and Specific Dissociations of Phe-Gly
2.4. Specific Dissociations of Peptides and Predictions
3. Materials and Methods
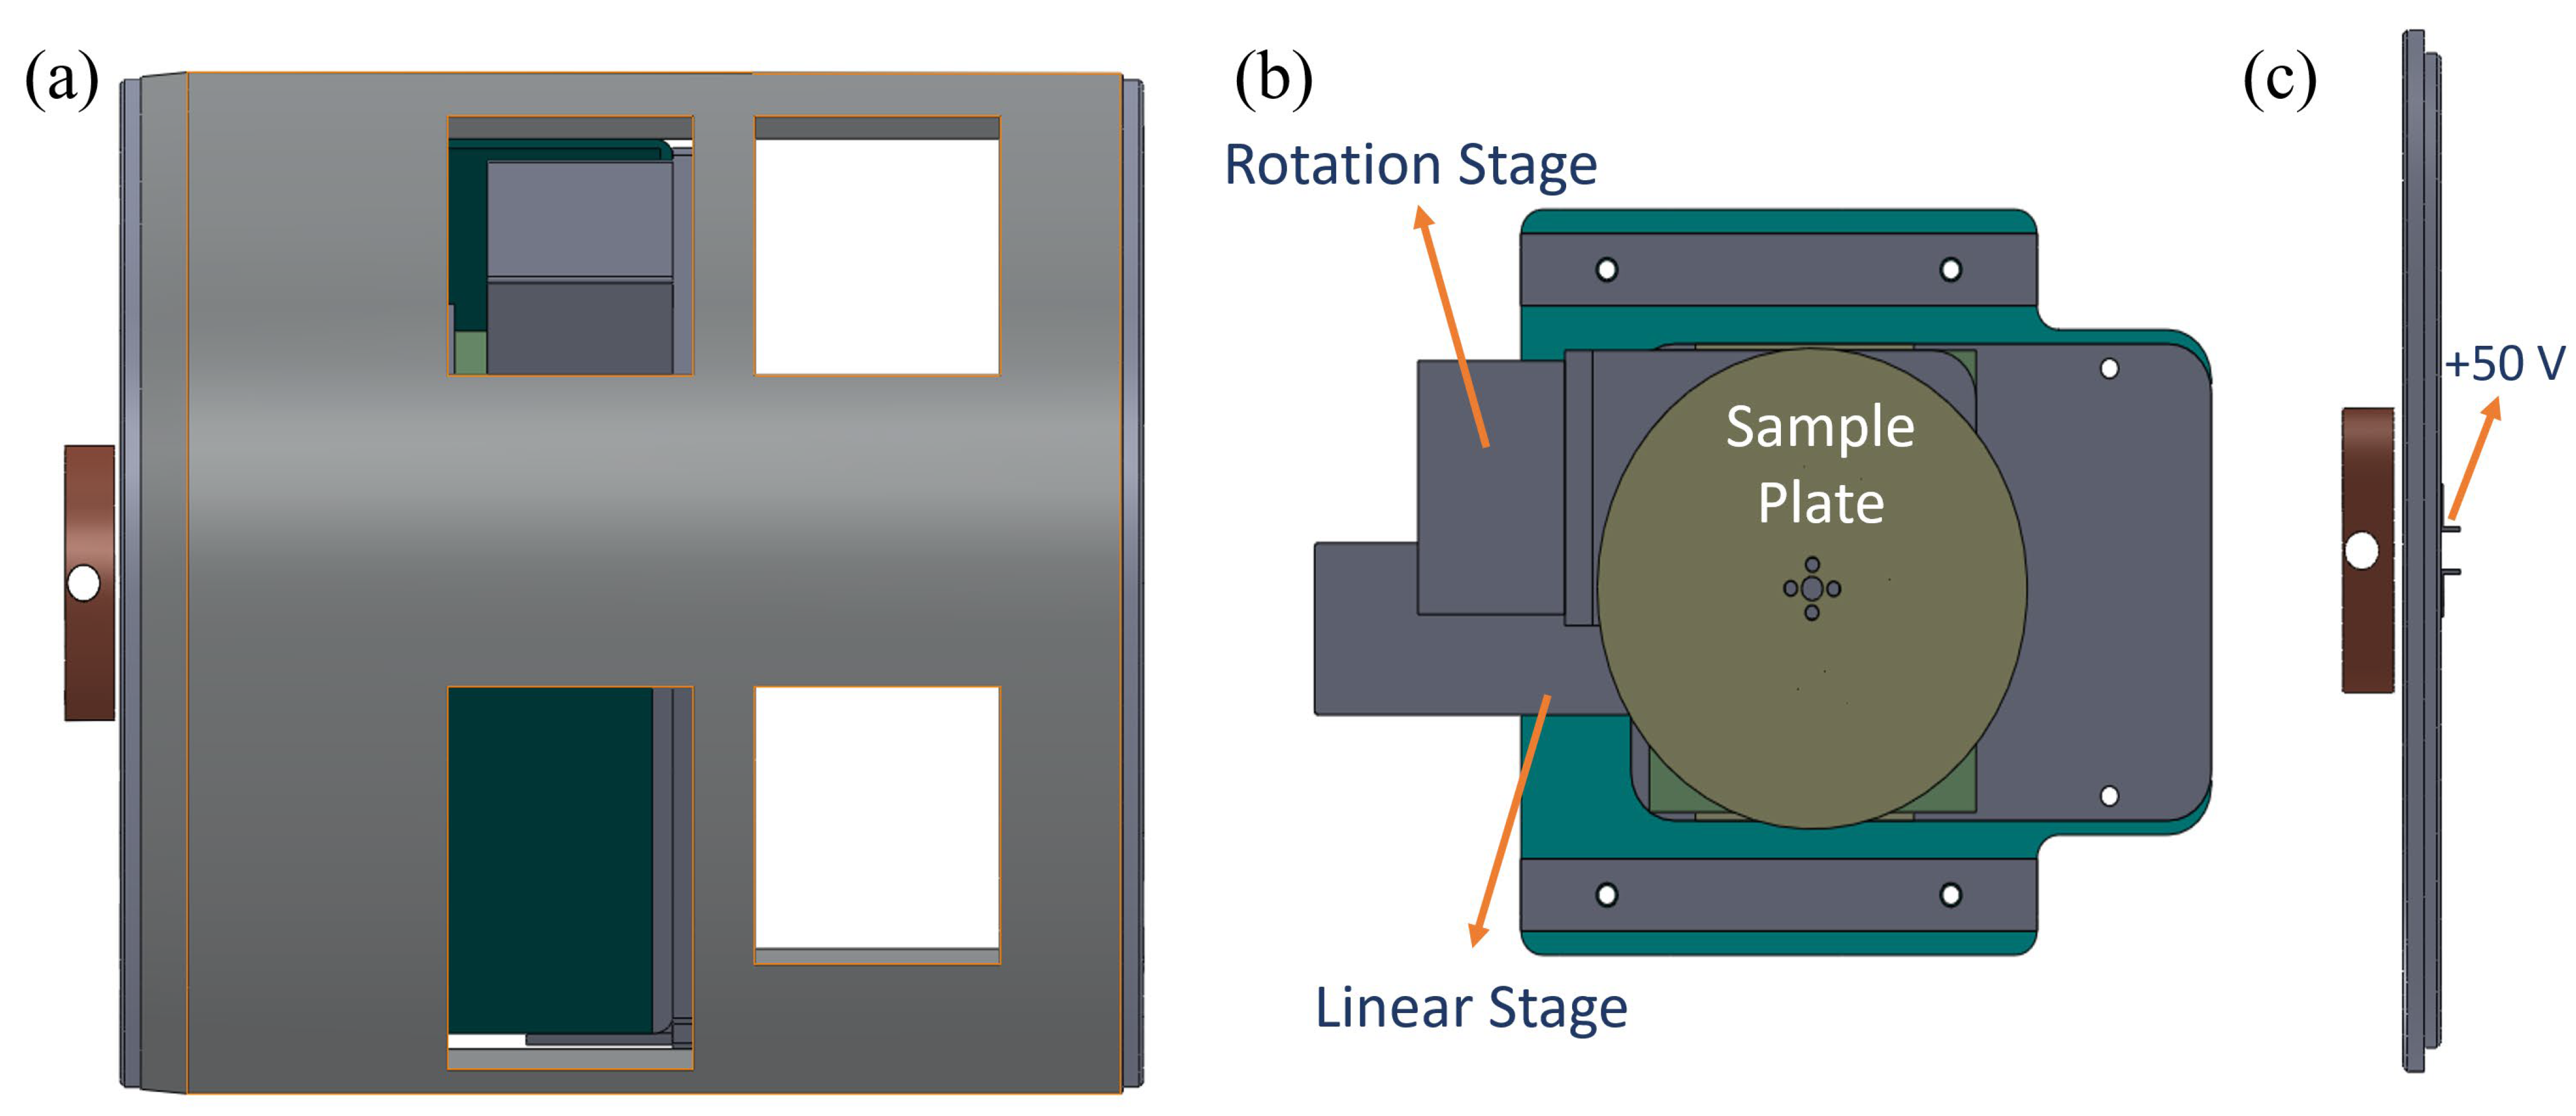
3.1. Experimental Section
3.2. Theoretical Method
4. Conclusions
Supplementary Materials
Author Contributions
Funding
Data Availability Statement
Acknowledgments
Conflicts of Interest
References
- Siegbahn, M. Spektroskopie der Röntgenstrahlen; Springer: Berlin/Heidelberg, Germany, 1931. [Google Scholar]
- Cho, E.; Brown, A.; Kuech, T.F. Chemical Characterization of DNA-Immobilized InAs Surfaces Using X-Ray Photoelectron Spectroscopy and Near-Edge X-Ray Absorption Fine Structure. Langmuir 2012, 28, 11890–11898. [Google Scholar] [CrossRef] [PubMed]
- Feyer, V.; Plekan, O.; Richter, R.; Coreno, M.; De Simone, M.; Prince, K.C.; Trofimov, A.B.; Zaytseva, I.L.; Schirmer, J. Tautomerism in Cytosine and Uracil: A Theoretical and Experimental X-ray Absorption and Resonant Auger Study. J. Phys. Chem. A 2010, 114, 10270–10276. [Google Scholar] [CrossRef] [PubMed]
- Stewart-Ornstein, J.; Hitchcock, A.P.; Hernández Cruz, D.; Henklein, P.; Overhage, J.; Hilpert, K.; Hale, J.D.; Hancock, R.E. Using Intrinsic X-ray Absorption Spectral Differences To Identify and Map Peptides and Proteins. J. Phys. Chem. B 2007, 111, 7691–7699. [Google Scholar] [CrossRef]
- Cooney, R.R.; Urquhart, S.G. Chemical Trends in the Near-Edge X-ray Absorption Fine Structure of Monosubstituted and Para-Bisubstituted Benzenes. J. Phys. Chem. B 2004, 108, 18185–18191. [Google Scholar] [CrossRef]
- Eberhardt, W.; Sham, T.K.; Carr, R.; Krummacher, S.; Strongin, M.; Weng, S.L.; Wesner, D. Site-Specific Fragmentation of Small Molecules Following Soft-X-Ray Excitation. Phys. Rev. Lett. 1983, 50, 1038. [Google Scholar] [CrossRef]
- Baba, Y. Element-specific and site-specific ion desorption from adsorbed molecules by deep core-level photoexcitation at the K-edges. Low Temp. Phys. 2003, 29, 228–242. [Google Scholar] [CrossRef]
- Wada, S.I.; Sumii, R.; Isari, K.; Waki, S.; Sako, E.O.; Sekiguchi, T.; Sekitani, T.; Tanaka, K. Active control of chemical bond scission by site-specific core excitation. Surf. Sci. 2003, 528, 242–248. [Google Scholar] [CrossRef]
- Chen, J.M.; Lu, K.T.; Lee, J.M.; Ma, C.I.; Lee, Y.Y. State Selective Enhanced Production of Excited Fragments and Ionic Fragments of Gaseous Si(CH3)2Cl2 and Solid-State Analogs following Core-Level Excitation. Phys. Rev. Lett. 2004, 92, 243002. [Google Scholar] [CrossRef]
- Wada S-i Kizaki, H.; Matsumoto, Y.; Sumii, R.; Tanaka, K. Selective chemical bond breaking characteristically induced by resonant core excitation of ester compounds on a surface. J. Phys.-Condens. Matter 2006, 18, S1629–S1653. [Google Scholar] [CrossRef]
- Lee, C.Y.; Harbers, G.M.; Grainger, D.W.; Gamble, L.J.; Castner, D.G. Fluorescence, XPS, and TOF-SIMS Surface Chemical State Image Analysis of DNA Microarrays. J. Am. Chem. Soc. 2007, 129, 9429–9438. [Google Scholar] [CrossRef]
- May, C.J.; Canavan, H.E.; Castner, D.G. Quantitative X-ray Photoelectron Spectroscopy and Time-of-Flight Secondary Ion Mass Spectrometry Characterization of the Components in DNA. Anal. Chem. 2004, 76, 1114–1122. [Google Scholar] [CrossRef] [PubMed]
- González-Magaña, O.; Reitsma, G.; Tiemens, M.; Boschman, L.; Hoekstra, R.; Schlathölter, T. Near-Edge X-ray Absorption Mass Spectrometry of a Gas-Phase Peptide. J. Phys. Chem. A 2012, 116, 10745–10751. [Google Scholar] [CrossRef] [PubMed]
- Lin, Y.S.; Tsai, C.C.; Lin, H.R.; Hsieh, T.L.; Chen, J.L.; Hu, W.P.; Ni, C.K.; Liu, C.L. Highly Selective Dissociation of a Peptide Bond Following Excitation of Core Electrons. J. Phys. Chem. A 2015, 119, 6195–6202. [Google Scholar] [CrossRef] [PubMed]
- Salén, P.; Kamińska, M.; Squibb, R.J.; Richter, R.; Alagia, M.; Stranges, S.; van der Meulen, P.; Eland, J.H.; Feifel, R.; Zhaunerchyk, V. Selectivity in fragmentation of N-methylacetamide after resonant K-shell excitation. Phys. Chem. Chem. Phys. 2014, 16, 15231–15240. [Google Scholar] [CrossRef]
- Chiang, Y.-J.; Lin, Y.-S.; Lin, H.-R.; Liu, C.-L. Specific dissociation of core-excited pyrimidine nucleobases. Chem. Phys. Lett. 2018, 706, 215–222. [Google Scholar] [CrossRef]
- Wang, Y.-T.; Chiang, Y.-J.; Liu, C.-L. Resolved specific dissociation channel of a core-excited peptide model molecule. Chem. Phys. Lett. 2020, 759, 137967. [Google Scholar] [CrossRef]
- Lin, Y.S.; Lin, S.Y.; Lee, Y.T.; Tseng, C.M.; Ni, C.K.; Liu, C.L.; Tsai, C.C.; Chen, J.L.; Hu, W.P. Core Excitation, Specific Dissociation, and the Effect of the Size of Aromatic Molecules Connected to Oxygen: Phenyl Ether and 1,3-Diphenoxybenzene. J. Phys. Chem. A 2014, 118, 7803–7815. [Google Scholar] [CrossRef]
- Lin, Y.S.; Lin, H.R.; Liu, W.L.; Lee, Y.T.; Tseng, C.M.; Ni, C.K.; Liu, C.L.; Tsai, C.C.; Chen, J.L.; Hu, W.P. Measurement and prediction of the NEXAFS spectra of pyrimidine and purine and the dissociation following the core excitation. Chem. Phys. Lett. 2015, 636, 146–153. [Google Scholar] [CrossRef]
- Lin, Y.S.; Lu, K.T.; Lee, Y.T.; Tseng, C.M.; Ni, C.K.; Liu, C.L. Near-Edge X-ray Absorption Fine Structure Spectra and Site-Selective Dissociation of Phenol. J. Phys. Chem. A 2014, 118, 1601–1609. [Google Scholar] [CrossRef]
- Tsai, C.C.; Chen, J.L.; Hu, W.P.; Lin, Y.S.; Lin, H.R.; Lee, T.Y.; Lee, Y.T.; Ni, C.K.; Liu, C.L. Selectivity of peptide bond dissociation on excitation of a core electron: Effects of a phenyl group. Chem. Phys. Lett. 2016, 660, 60–68. [Google Scholar] [CrossRef]
- Chiang, Y.J.; Huang, W.C.; Ni, C.K.; Liu, C.L.; Tsai, C.C.; Hu, W.P. NEXAFS spectra and specific dissociation of oligo-peptide model molecules. AIP Adv. 2019, 9, 085023. [Google Scholar] [CrossRef]
- Chiang, Y.J.; Huang, W.C.; Han, C.H.; Liu, C.L.; Tsai, C.C.; Hu, W.P. Near-edge x-ray absorption fine structure spectra and specific dissociation of small peptoid molecules. The J. Chem. Phys. 2024, 160, 074305. [Google Scholar] [CrossRef]
- Guilhaus, M.; Selby, D.; Mlynski, V. Orthogonal acceleration time-of-flight mass spectrometry. Mass Spectrom. Rev. 2000, 19, 65. [Google Scholar] [CrossRef]
- Coles, J.; Guilhaus, M. Orthogonal acceleration—A new direction for time-of-flight mass spectrometry: Fast, sensitive mass analysis for continuous ion sources. TrAC Trends Anal. Chem. 1993, 12, 203–213. [Google Scholar] [CrossRef]
- Dawson, J.H.J.; Guilhaus, M. Orthogonal-acceleration time-of-flight mass spectrometer. Rapid Commun. Mass Spectrom. 1989, 3, 155–159. [Google Scholar] [CrossRef]
- Selby, D.S.; Mlynski, V.; Guilhaus, M. A 20 kV orthogonal acceleration time-of-flight mass spectrometer for matrix-assisted laser desorption/ionization. Int. J. Mass Spectrom. 2001, 210–211, 89–100. [Google Scholar] [CrossRef]
- Chung, S.C.; Chen, J.; Huang, L.R.; Wu, R.T.; Chen, C.C.; Cheng, N.F.; Chuang, J.M.; Tseng, P.C.; Huang, D.J.; Chang, C.F.; et al. Performance of an elliptically polarized undulator beamline. In Nuclear Instruments and Methods in Physics Research Section A: Accelerators, Spectrometers, Detectors and Associated Equipment; Elsevier: Amsterdam, The Netherlands, 2001; Volume 467. [Google Scholar] [CrossRef]
- Tronc, M.; King, G.C.; Read, F.H. Carbon K-shell excitation in small molecules by high-resolution electron impact. J. Phys. B At. Mol. Phys. 1979, 12, 137. [Google Scholar] [CrossRef]
- Becke, A.D. Density-functional thermochemistry. III. The role of exact exchange. J. Chem. Phys. 1993, 98, 5648–5652. [Google Scholar] [CrossRef]
- Frisch, M.J.; Trucks, G.W.; Schlegel, H.B.; Scuseria, G.E.; Robb, M.A.; Cheeseman, J.R.; Scalmani, G.; Barone, V.; Petersson, G.A.; Nakatsuji, H.; et al. Gaussian 16, Revision C.01; Gaussian, Inc.: Wallingford, CT, USA, 2016. [Google Scholar]
- Shao, Y.; Gan, Z.; Epifanovsky, E.; Gilbert, A.T.; Wormit, M.; Kussmann, J.; Lange, A.W.; Behn, A.; Deng, J.; Feng, X.; et al. Advances in molecular quantum chemistry contained in the Q-Chem 4 program package. Mol. Phys. 2015, 113, 184–215. [Google Scholar] [CrossRef]


| Assignments of the NEXAFS K-Edge Spectrum of Gly-Phe | ||||
|---|---|---|---|---|
| Peak | Calculated Core-Excitation Energy (eV) a | Corresponding Expt. Peak (eV) b | Transition Orbitals | Normalized Oscillator Strength |
| Carbon K-edge | ||||
| 1π*+Rb | 285.2 | 285.2 | C6 → π* (V2) | 0.0352 |
| 285.8 | C7 → π* (V1) | 0.0046 | ||
| 286.8 | C11→ π* (V3) | 0.0046 | ||
| 287.4 | C7 → Rb (V8) | 0.0042 | ||
| 2π*+Rb | 287.6 | 287.4 | C10 → π* (V7) | 0.0577 |
| 287.9 | C8 → π* (V4) | 0.0020 | ||
| 287.9 | C11 → Rb (V6) | 0.0045 | ||
| 3π*+Rb | 288.0 | 288.4 | C9 → π* (V1) | 0.0658 |
| 288.1 | C7 → Rb (V12) | 0.0046 | ||
| 288.3 | C11 → π* (V10) | 0.0020 | ||
| 288.5 | C11 → π* (V9) | 0.0032 | ||
| 4π*+Rb | 291.1 | 290.8 | C8 → π* (V25) | 0.0162 |
| Assignments of the0 NEXAFS K-Edge Spectrum of Phe-Gly | ||||
|---|---|---|---|---|
| Peak | Calculated Core-Excitation Energy (eV) a | Corresponding Expt. Peak (eV) b | Transition Orbitals | Normalized Oscillator Strength |
| Carbon K-edge | ||||
| 1π*+Rb | 285.1 | 285.1 | C4 → π* (V3) | 0.0228 |
| 285.2 | C6 → π* (V2) | 0.0352 | ||
| 286.6 | C4 → Rb (V5) | 0.0046 | ||
| 287.2 | C4 → Rb (V7) | 0.0022 | ||
| 287.4 | C8 → π* (V4) | 0.0044 | ||
| 2π*+Rb | 287.7 | 287.3 | C9 → Rb (V6) | 0.0597 |
| 287.9 | C10 → π* (V4) | 0.0017 | ||
| 288.0 | C8 → Rb (V8) | 0.0014 | ||
| 3π*+Rb | 288.2 | 288.3 | C11 → π* (V1) | 0.0673 |
| 288.7 | C10 → Rb (V8) | 0.0066 | ||
| 289.1 | C10 → π* (V10) | 0.0075 | ||
Disclaimer/Publisher’s Note: The statements, opinions and data contained in all publications are solely those of the individual author(s) and contributor(s) and not of MDPI and/or the editor(s). MDPI and/or the editor(s) disclaim responsibility for any injury to people or property resulting from any ideas, methods, instructions or products referred to in the content. |
© 2025 by the authors. Licensee MDPI, Basel, Switzerland. This article is an open access article distributed under the terms and conditions of the Creative Commons Attribution (CC BY) license (https://creativecommons.org/licenses/by/4.0/).
Share and Cite
Shen, T.-F.; Chiang, Y.-J.; Lin, Y.-S.; Liu, C.-L.; Wang, Y.-C.; Chou, K.-Y.; Tsai, C.-C.; Hu, W.-P. Near-Edge X-Ray Absorption Fine-Structure Spectra and Specific Dissociation of Phe-Gly and Gly-Phe. Int. J. Mol. Sci. 2025, 26, 2515. https://doi.org/10.3390/ijms26062515
Shen T-F, Chiang Y-J, Lin Y-S, Liu C-L, Wang Y-C, Chou K-Y, Tsai C-C, Hu W-P. Near-Edge X-Ray Absorption Fine-Structure Spectra and Specific Dissociation of Phe-Gly and Gly-Phe. International Journal of Molecular Sciences. 2025; 26(6):2515. https://doi.org/10.3390/ijms26062515
Chicago/Turabian StyleShen, Tse-Fu, Yu-Ju Chiang, Yi-Shiue Lin, Chen-Lin Liu, Yu-Chiao Wang, Kuan-Yi Chou, Cheng-Cheng Tsai, and Wei-Ping Hu. 2025. "Near-Edge X-Ray Absorption Fine-Structure Spectra and Specific Dissociation of Phe-Gly and Gly-Phe" International Journal of Molecular Sciences 26, no. 6: 2515. https://doi.org/10.3390/ijms26062515
APA StyleShen, T.-F., Chiang, Y.-J., Lin, Y.-S., Liu, C.-L., Wang, Y.-C., Chou, K.-Y., Tsai, C.-C., & Hu, W.-P. (2025). Near-Edge X-Ray Absorption Fine-Structure Spectra and Specific Dissociation of Phe-Gly and Gly-Phe. International Journal of Molecular Sciences, 26(6), 2515. https://doi.org/10.3390/ijms26062515