Article

Does Platelet Transcriptome Dysregulation Across the Lewy Body Continuum Mirror Neuronal Dysfunction?

1
Department of Neuroscience, Research Institute Germans Trias i Pujol, 08916 Badalona, Spain
2
Departament de Bioquímica i de Biologia Molecular, Facultat de Biociències, Universitat Autònoma de Barcelona, 08193 Barcelona, Spain
3
Facultat de Medicina, Institut de Neurociències, Universitat Autònoma de Barcelona, 08193 Barcelona, Spain
4
Unit of Neurodegenerative Diseases, Department of Neurology, University Hospital Germans Trias i Pujol Badalona, 08916 Barcelona, Spain
5
Sleep Unit, Department of Neurology, Hospital Clínic de Barcelona, Institut d’Investigacions Biomèdiques August Pi i Sunyer (IDIBAPS), Biomedical Research Networking Center on Neurodegenerative Diseases (CIBERNED), 08036 Barcelona, Spain
6
Centre for Age-Related Medicine (SESAM), Stavanger University Hospital, 4068 Stavanger, Norway
7
Department of Psychological Medicine, Institute of Psychiatry, Psychology and Neuroscience, King’s College London, London SE5 8AB, UK
*
Authors to whom correspondence should be addressed.
These authors contributed equally to this work.
Int. J. Mol. Sci. 2025, 26(22), 11169; https://doi.org/10.3390/ijms262211169
Submission received: 23 October 2025 / Revised: 11 November 2025 / Accepted: 13 November 2025 / Published: 19 November 2025
(This article belongs to the Section Molecular Neurobiology)

Abstract

Platelets are increasingly recognized as multifunctional cells with roles extending beyond hemostasis to immune regulation, inflammation, and neurodegeneration. Here, we performed RNA-Seq profiling of platelets from patients with idiopathic REM sleep behavior disorder (IRBD), dementia with Lewy bodies (DLB), Parkinson disease (PD), Alzheimer disease (AD), and healthy controls (CTRLs) to explore disease-specific transcriptomic signatures. Across all groups, the RNA class distribution was similar, dominated by mRNAs (78–80%) and long non-coding RNAs (lncRNAs; 15–16%). DLB platelets displayed a reduced proportion of lncRNAs, suggesting an impaired RNA regulation, whereas IRBD concentrated the highest number of disease-specific lncRNAs, half of which were Y-linked, consistent with the male predominance observed in alpha-synucleinopathies. Differential expression analysis (DEA) revealed extensive transcriptomic remodeling in IRBD and DLB, particularly affecting RNA processing, cytoskeletal organization, and platelet activation pathways, while PD and AD showed minimal changes. These findings suggest a progressive impairment of platelet activation and signaling across the DLB continuum, potentially mirroring neuronal dysfunction. The limited transcriptional deregulation in PD may reflect its pronounced biological heterogeneity, consistent with recent multidimensional disease models. Overall, our study highlights platelets as accessible indicators of early and disease-stage-specific molecular alterations in α-synucleinopathies.

1. Introduction

Neurodegenerative diseases are a major and growing public health concern, with global cases projected to increase from 54.7 million in 2019 to 152.8 million by 2050, primarily due to aging populations [1]. Alzheimer’s disease (AD) is the most prevalent form, characterized by progressive cognitive decline and neuropathological hallmarks such as β-amyloid (Aβ) plaque accumulation and tau-related neurofibrillary tangles [2]. Dementia with Lewy bodies (DLB), the second-most common degenerative dementia, frequently overlaps with AD both clinically and pathologically, complicating early and accurate diagnosis [3,4]. Misdiagnosis of DLB remains high—up to 80% of cases are initially diagnosed as AD—often leading to suboptimal treatment. While cerebrospinal fluid (CSF) biomarkers, including reduced Aβ42 and elevated tau and neurofilament levels, are well established in AD, their specificity in distinguishing DLB remains controversial [5].
DLB and Parkinson’s disease (PD) are classified as Lewy body disorders (LBD), sharing a common pathophysiology involving the aggregation of α-synuclein [6]. Their underlying mechanisms include mitochondrial and lysosomal dysfunction, iron dysregulation, and neuroinflammation [7]. Importantly, idiopathic REM sleep behavior disorder (IRBD) has emerged as a prodromal phase of LBDs, since up to 91% of patients develop DLB or PD within 14 years [8,9]. Neuropathological and imaging findings in IRBD patients—such as reduced dopamine transporter (DAT) binding and aggregated α-synuclein species in CSF—support the assumption that IRBD is indeed an early synucleinopathy [10,11].
In recent years, blood and its different fractions have been explored as a peripheral biomarker source to support the differential diagnosis of neurodegenerative dementias. Platelets (PLTs), in addition to their crucial function in hemostasis [12], could be bridging blood and brain [13]. PLTs are a primary peripheral source of amyloid precursor protein (APP) in AD, contain α-synuclein, and express various neuronal receptors and enzymes. Additionally, they share biochemical pathways with dopaminergic neurons, including the capacity to store and release neurotransmitters [14]. Despite being anucleate, PLTs also contain diverse classes of RNAs, including mRNAs and miRNAs, along with the corresponding pathways that assure their functionality [15]. Therefore, miRNAs actively regulate mRNA levels [16] and might be responsible for changes in PLT activation capacity. These features highlight their potential role as systemic sensors linking environmental cues to internal physiological states. However, there still exists a significant research gap regarding how platelet transcriptomic alterations reflect central nervous system pathology and whether these molecular changes can reliably distinguish between neurodegenerative disorders. Given recent evidence supporting the role of platelets in neurodegenerative processes, analyzing their transcriptome rather than that of whole blood or PBMCs provides a more targeted and reliable approach, minimizing cellular heterogeneity while capturing biologically meaningful alterations linked to disease mechanisms.
In a recent study we profiled the platelet miRNome in DLB patients compared with controls and identified a DLB-specific biomarker signature [17]. This signature comprises seven miRNAs with decreased expression in DLB compared with controls and AD, discriminating efficiently between the two diseases. In an independent study, we evaluated the same miRNAs in IRBD and found that two of them were already downregulated at this prodromal stage [18].
Taking into account that miRNAs maintain their functionality in PLTs, we hypothesize that the observed reduction of miRNAs in DLB PLTs may lead to the overexpression of several mRNAs in these anucleate cells. Despite evidence supporting the role of platelets as peripheral models of LBD pathophysiology, and our previous findings on the platelet miRNome, the full platelet transcriptome remains unexplored in neurodegenerative diseases. The functional impact of miRNA dysregulation on platelet mRNA expression also remains unknown. Notably, while previous peripheral blood transcriptomic studies have focused on whole blood or PBMCs, this study is the first to apply Next-Generation Sequencing (NGS) to comprehensively profile the platelet transcriptome across these pathologies.
Therefore, the aim of our study was to analyze the PLT transcriptome in patients with DLB, AD, PD, IRBD and cognitively unaffected subjects in order to identify disease-specific expression changes and their associated pathways, providing molecular information required for the discovery of robust diagnostic and prognostic mRNA biomarkers in accessible peripheral blood cells. Additionally, we sought to compare our findings with previous NGS-based transcriptomic studies of PLTs and to explore potential age-related expression patterns.

2. Results

2.1. Demographic and Clinical Data

Demographic and clinical data of patients are summarized in Table 1. Mean age was similar between DLB patients, IRBD patients and cognitively healthy controls (CTRLs). AD patients were mainly of early-onset, and PD patients were significantly younger. Due to the characteristics of the disease, the male-female ratio was higher in PD and IRBD than in AD and CTRLs. None of the PD patients had developed dementia at the time of sample collection and did not carry any LRRK2 or GBA variant.

2.2. Comparison of Gene Expression Profiles Across RNA-Seq Studies

In order to compare our RNA-Seq results with those from previous studies, we searched for RNA-seq studies in PLTs carried out between 2021 and 2025. In their review article, Thibord and Johnson provided a list of 60 RNA-Seq studies conducted between 2011 and 2023 [19]. Over the past two years, some additional PLT RNA-seq studies have been carried out. We retrieved the results from studies involving at least 25 control subjects aged 45 years or older, and three fulfilled the search criteria. Additionally, a study comparing the PLT transcriptome between 20 PD patients and 20 CTRL individuals was also included (Table 2).

2.2.1. CTRLs

Figure 1 shows the distribution of commonly expressed, overlapping and specific genes identified across the datasets. A total of 10,097 genes were shared among all five studies, corresponding to 78.9% of all genes detected in Study 1a, 65.6% in Study 2, 81.4% in Study 3, 63.1% in Study 4, and 54.3% in CTRLs of our study. In contrast, fewer than 1% of genes were uniquely detected in Studies 1a and 3, whereas 8.7%, 17.9%, and 22.9% of genes were specifically identified in Study 4, our study (Study 5a), and Study 2, respectively. The approximately 3500 genes uniquely expressed in Study 2 were primarily associated with ion channel processes, whereas the 3329 unique genes from our study (Study 5a) were predominantly involved in potassium channel functions.

2.2.2. PD

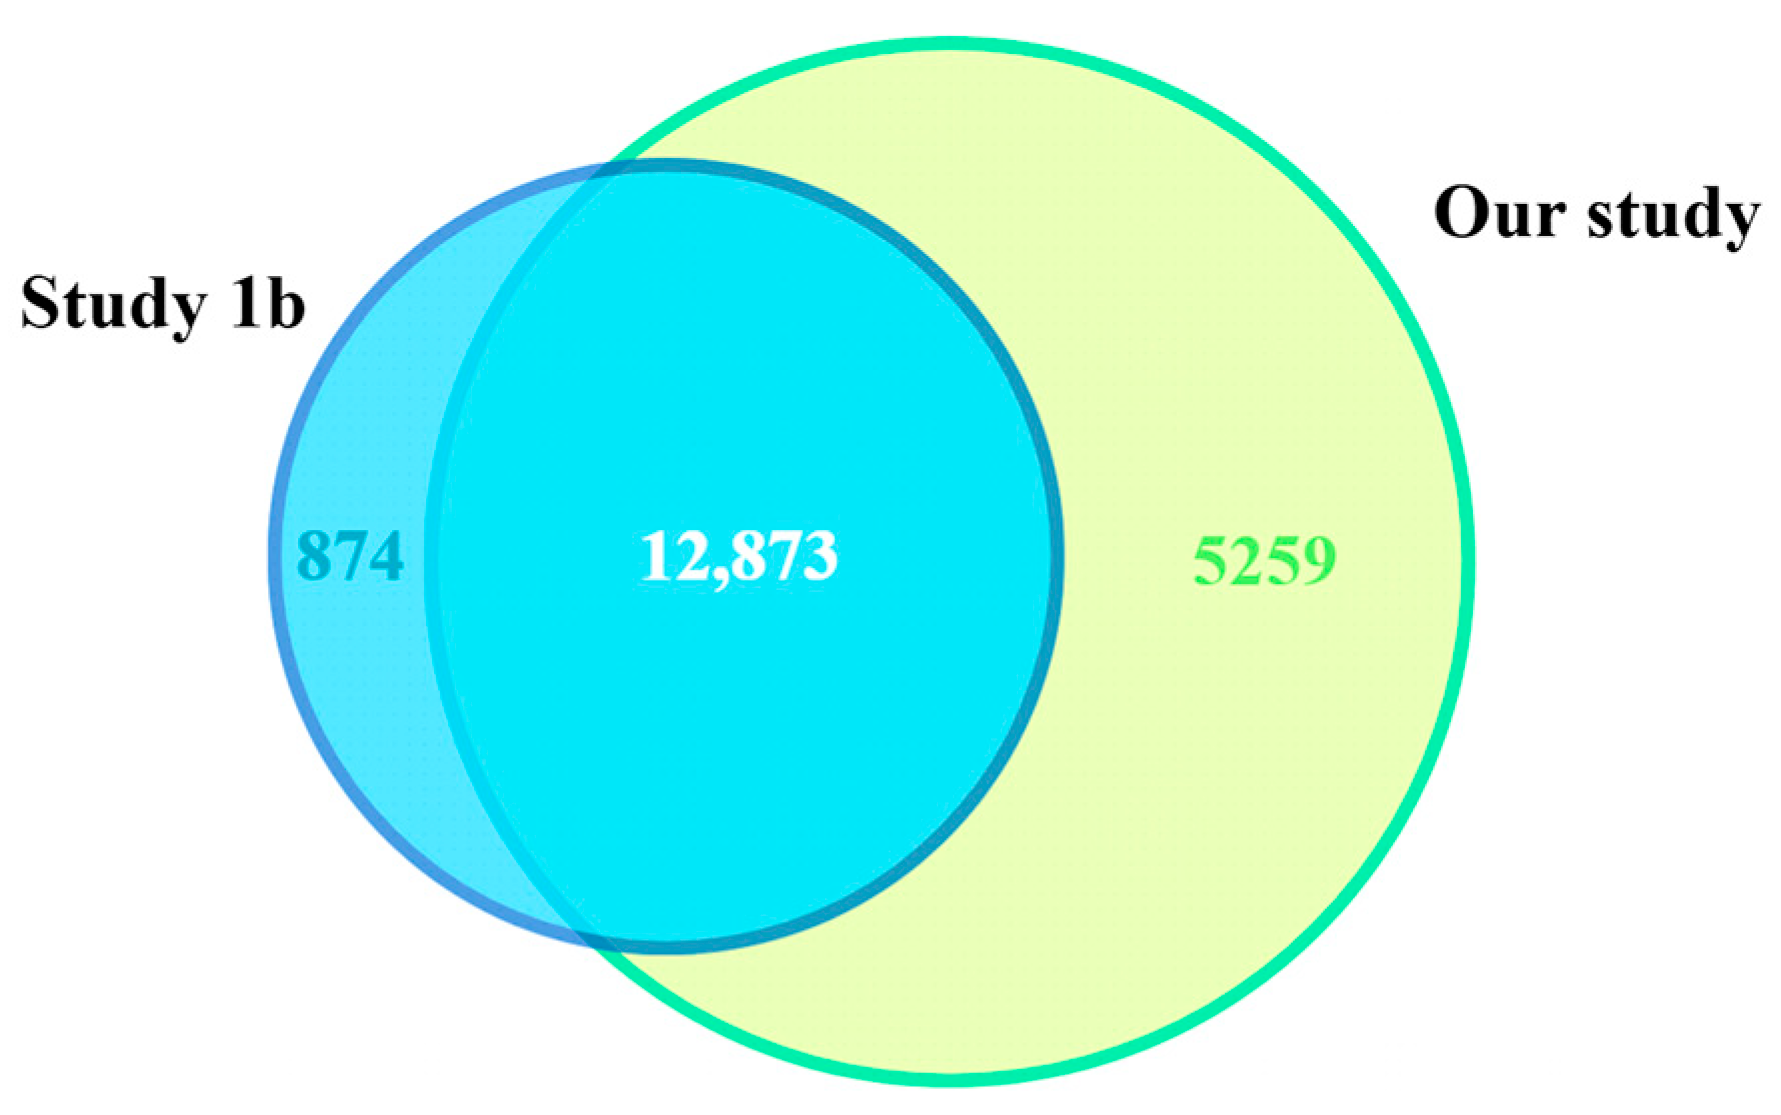
The overlap of expressed genes between the two studies that included PD patients (Studies 1b and 5b) is presented in Figure 2. A total of 12,873 genes were commonly expressed across both datasets, corresponding to 93.6% of all genes identified in the PD group of Study 1 and 79% in the PD group of our study (5b). The 5259 genes uniquely expressed in our PD patients were mainly related to ion channel and cytoskeletal motor activity.

2.3. Classification of Transcripts Expressed in PLTs

The distribution of five major RNA classes identified for each group is shown in Figure 3. Whereas 78–80% were protein-expressing genes, 15–16% were long non-coding RNAs (lncRNAs), 4% were pseudogenes and 1–2% were unknown transcripts. The group of minor RNAs, composed of small Cajal body-specific RNAs (scaRNAs), small nucleolar RNAs (snoRNAs), small nuclear RNAs (snRNAs), ribozymes and mitochondrial RNAs (mtRNAs), represented less than 1% of all RNAs.

2.3.1. Long-Non-Coding RNA (lncRNA)

The distribution of lncRNA differed among the five groups (p = 0.0064), and the relative amount of lncRNAs was smaller in DLB compared with CTRLs, AD and PD (p = 0.0063, 0.0023 and 0.0001, respectively). The relative amount of lncRNA was slightly, but not significantly lower in IRBD compared with CTRLs, AD and PD. However, the number of group-specific lncRNAs was similar in all groups, 13 in DLB, 20 in IRBD, 14 in PD, 12 in AD and 14 in CTRLs (Figure 4). Among those, whereas in DLB the majority (92.3%) were uncharacterized, only 50% were uncharacterized in IRBD. Group-specific lncRNA genes were distributed across all chromosomes, except for IRBD, where 50% of lncRNA genes were located on chromosome Y (Appendix A.1).

2.3.2. Minor RNAs

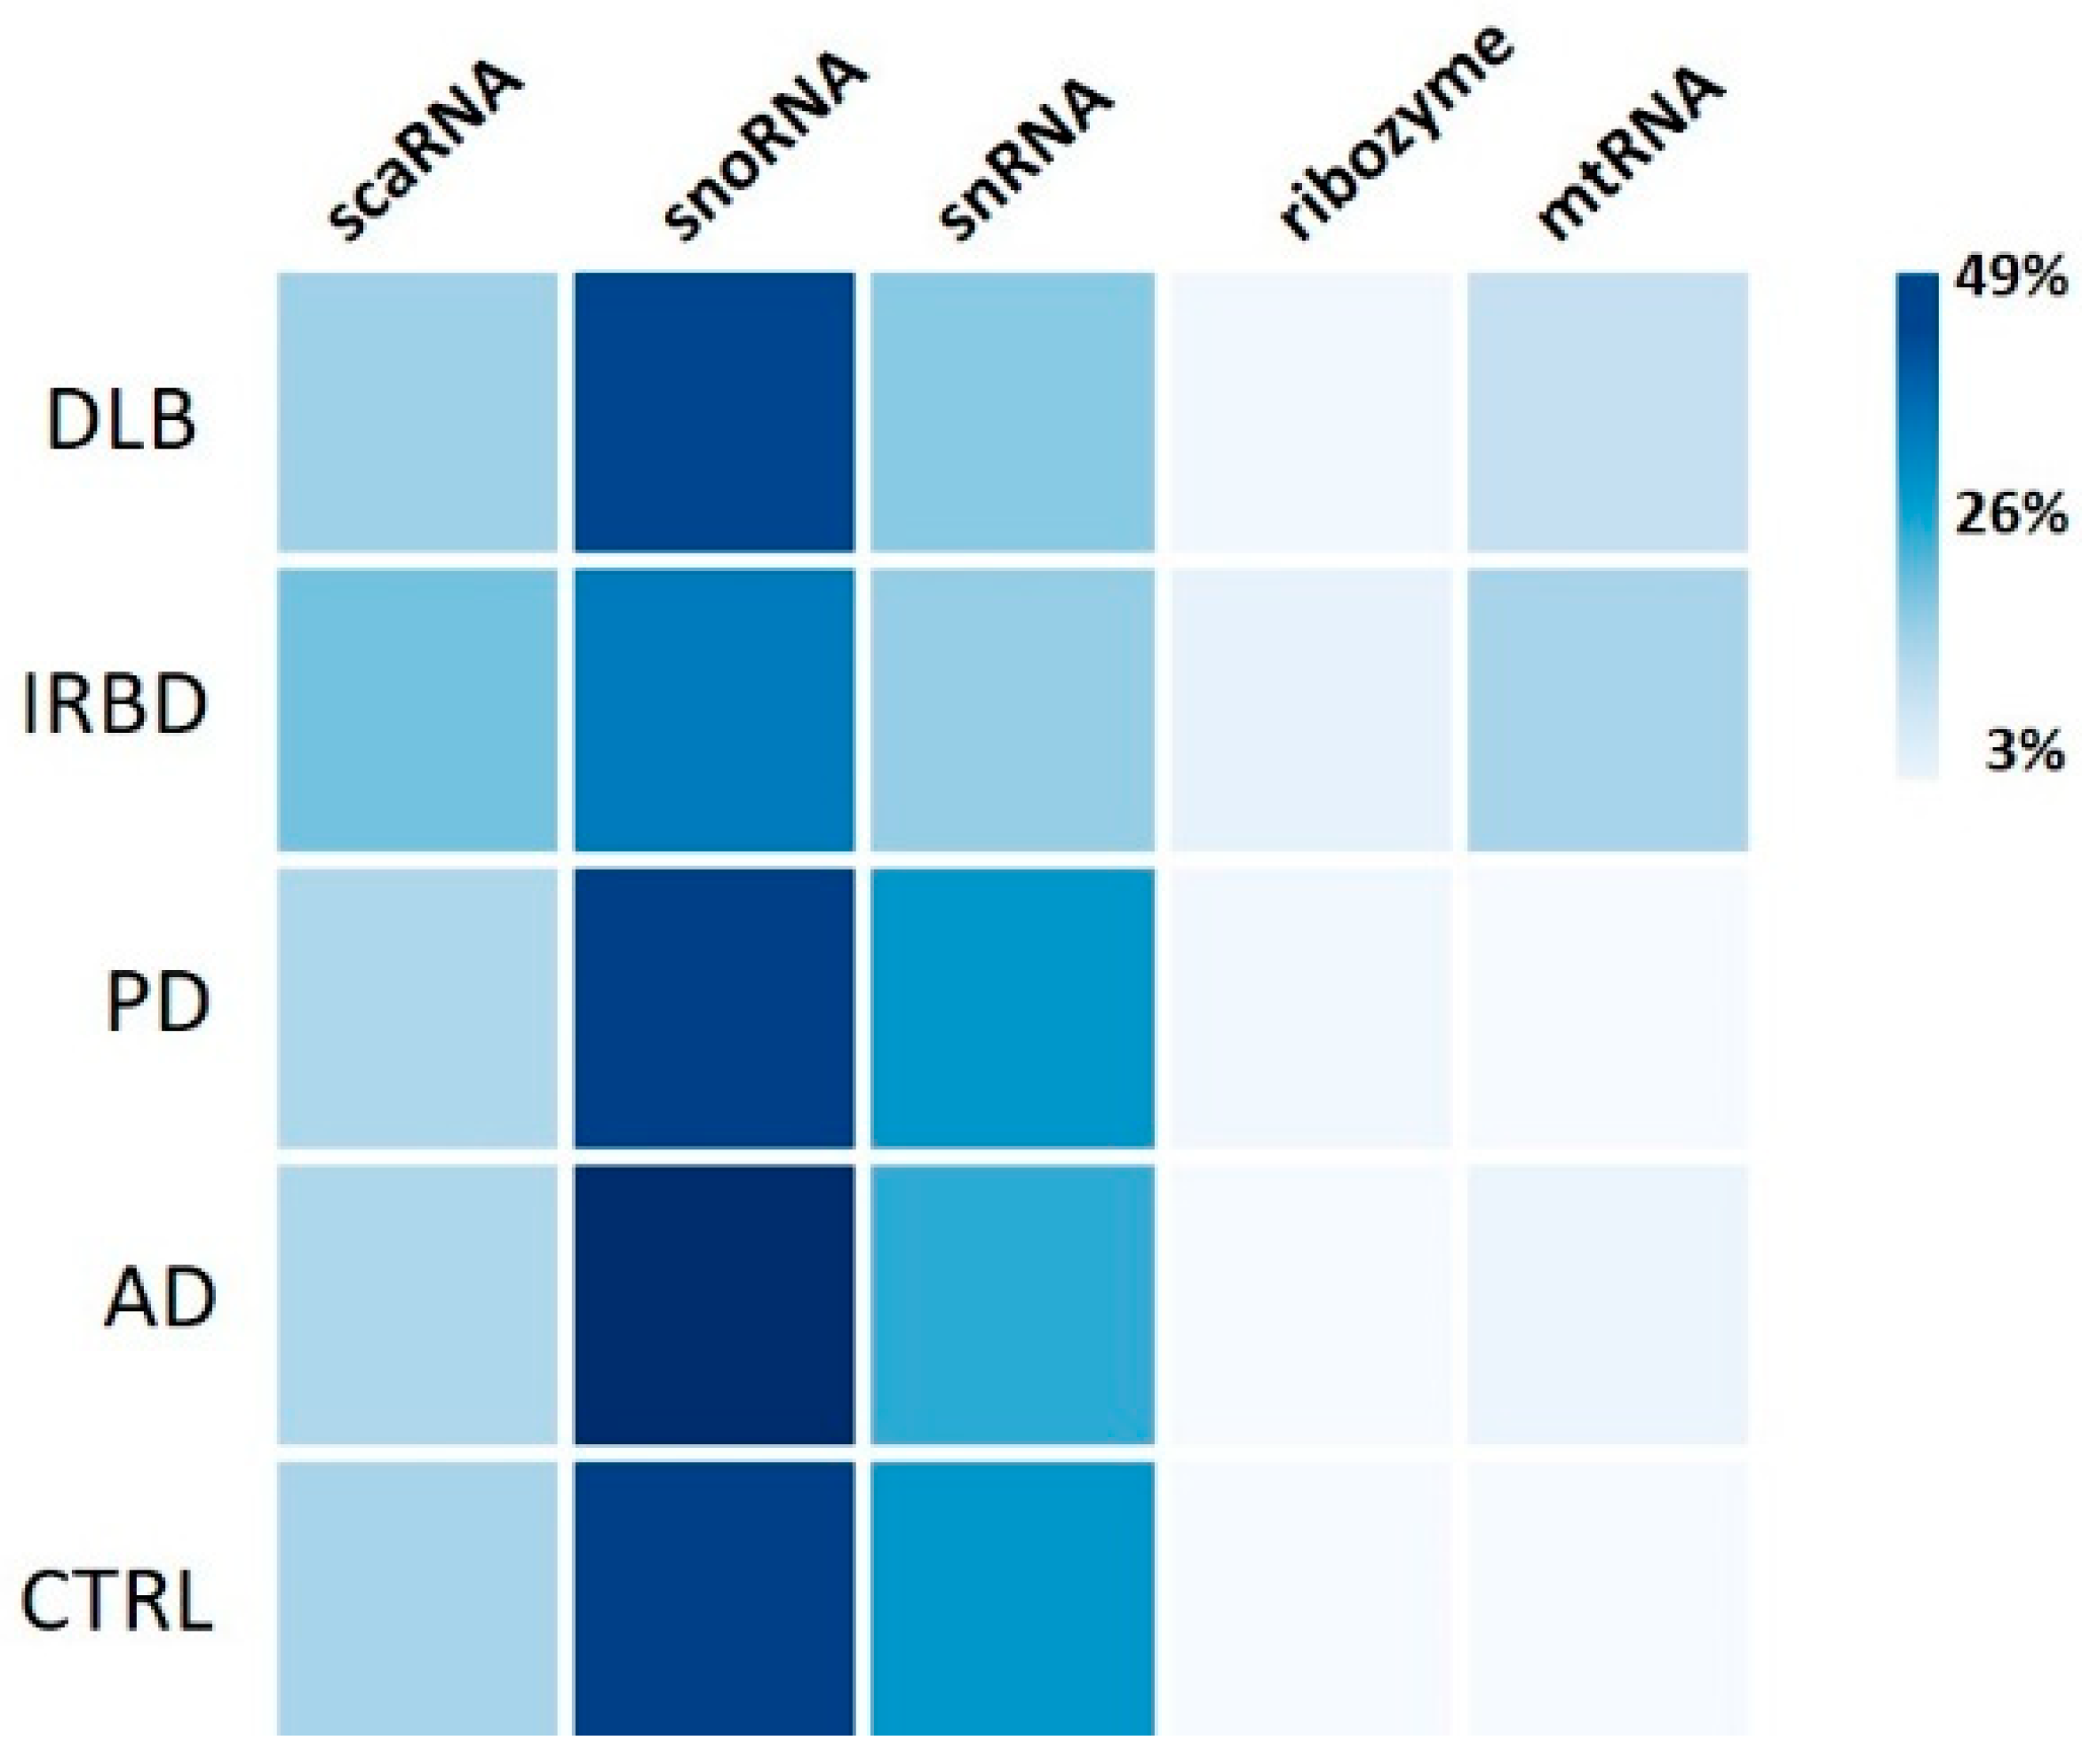
The analysis of minor RNAs revealed that most of them were snoRNAs (36–49%), followed by snRNA (19–31%) and scaRNAs (16–22%; Figure 1). Two ribozymes, RMRP and RPPH1, were present in all groups, representing between 3% and 5% of minor RNAs, and mtRNAs represented between 13% and 17% in DLB and IRBD, respectively, but only between 3% and 5% in PD, AD and CTRLs (Figure 5, Appendix A.2).
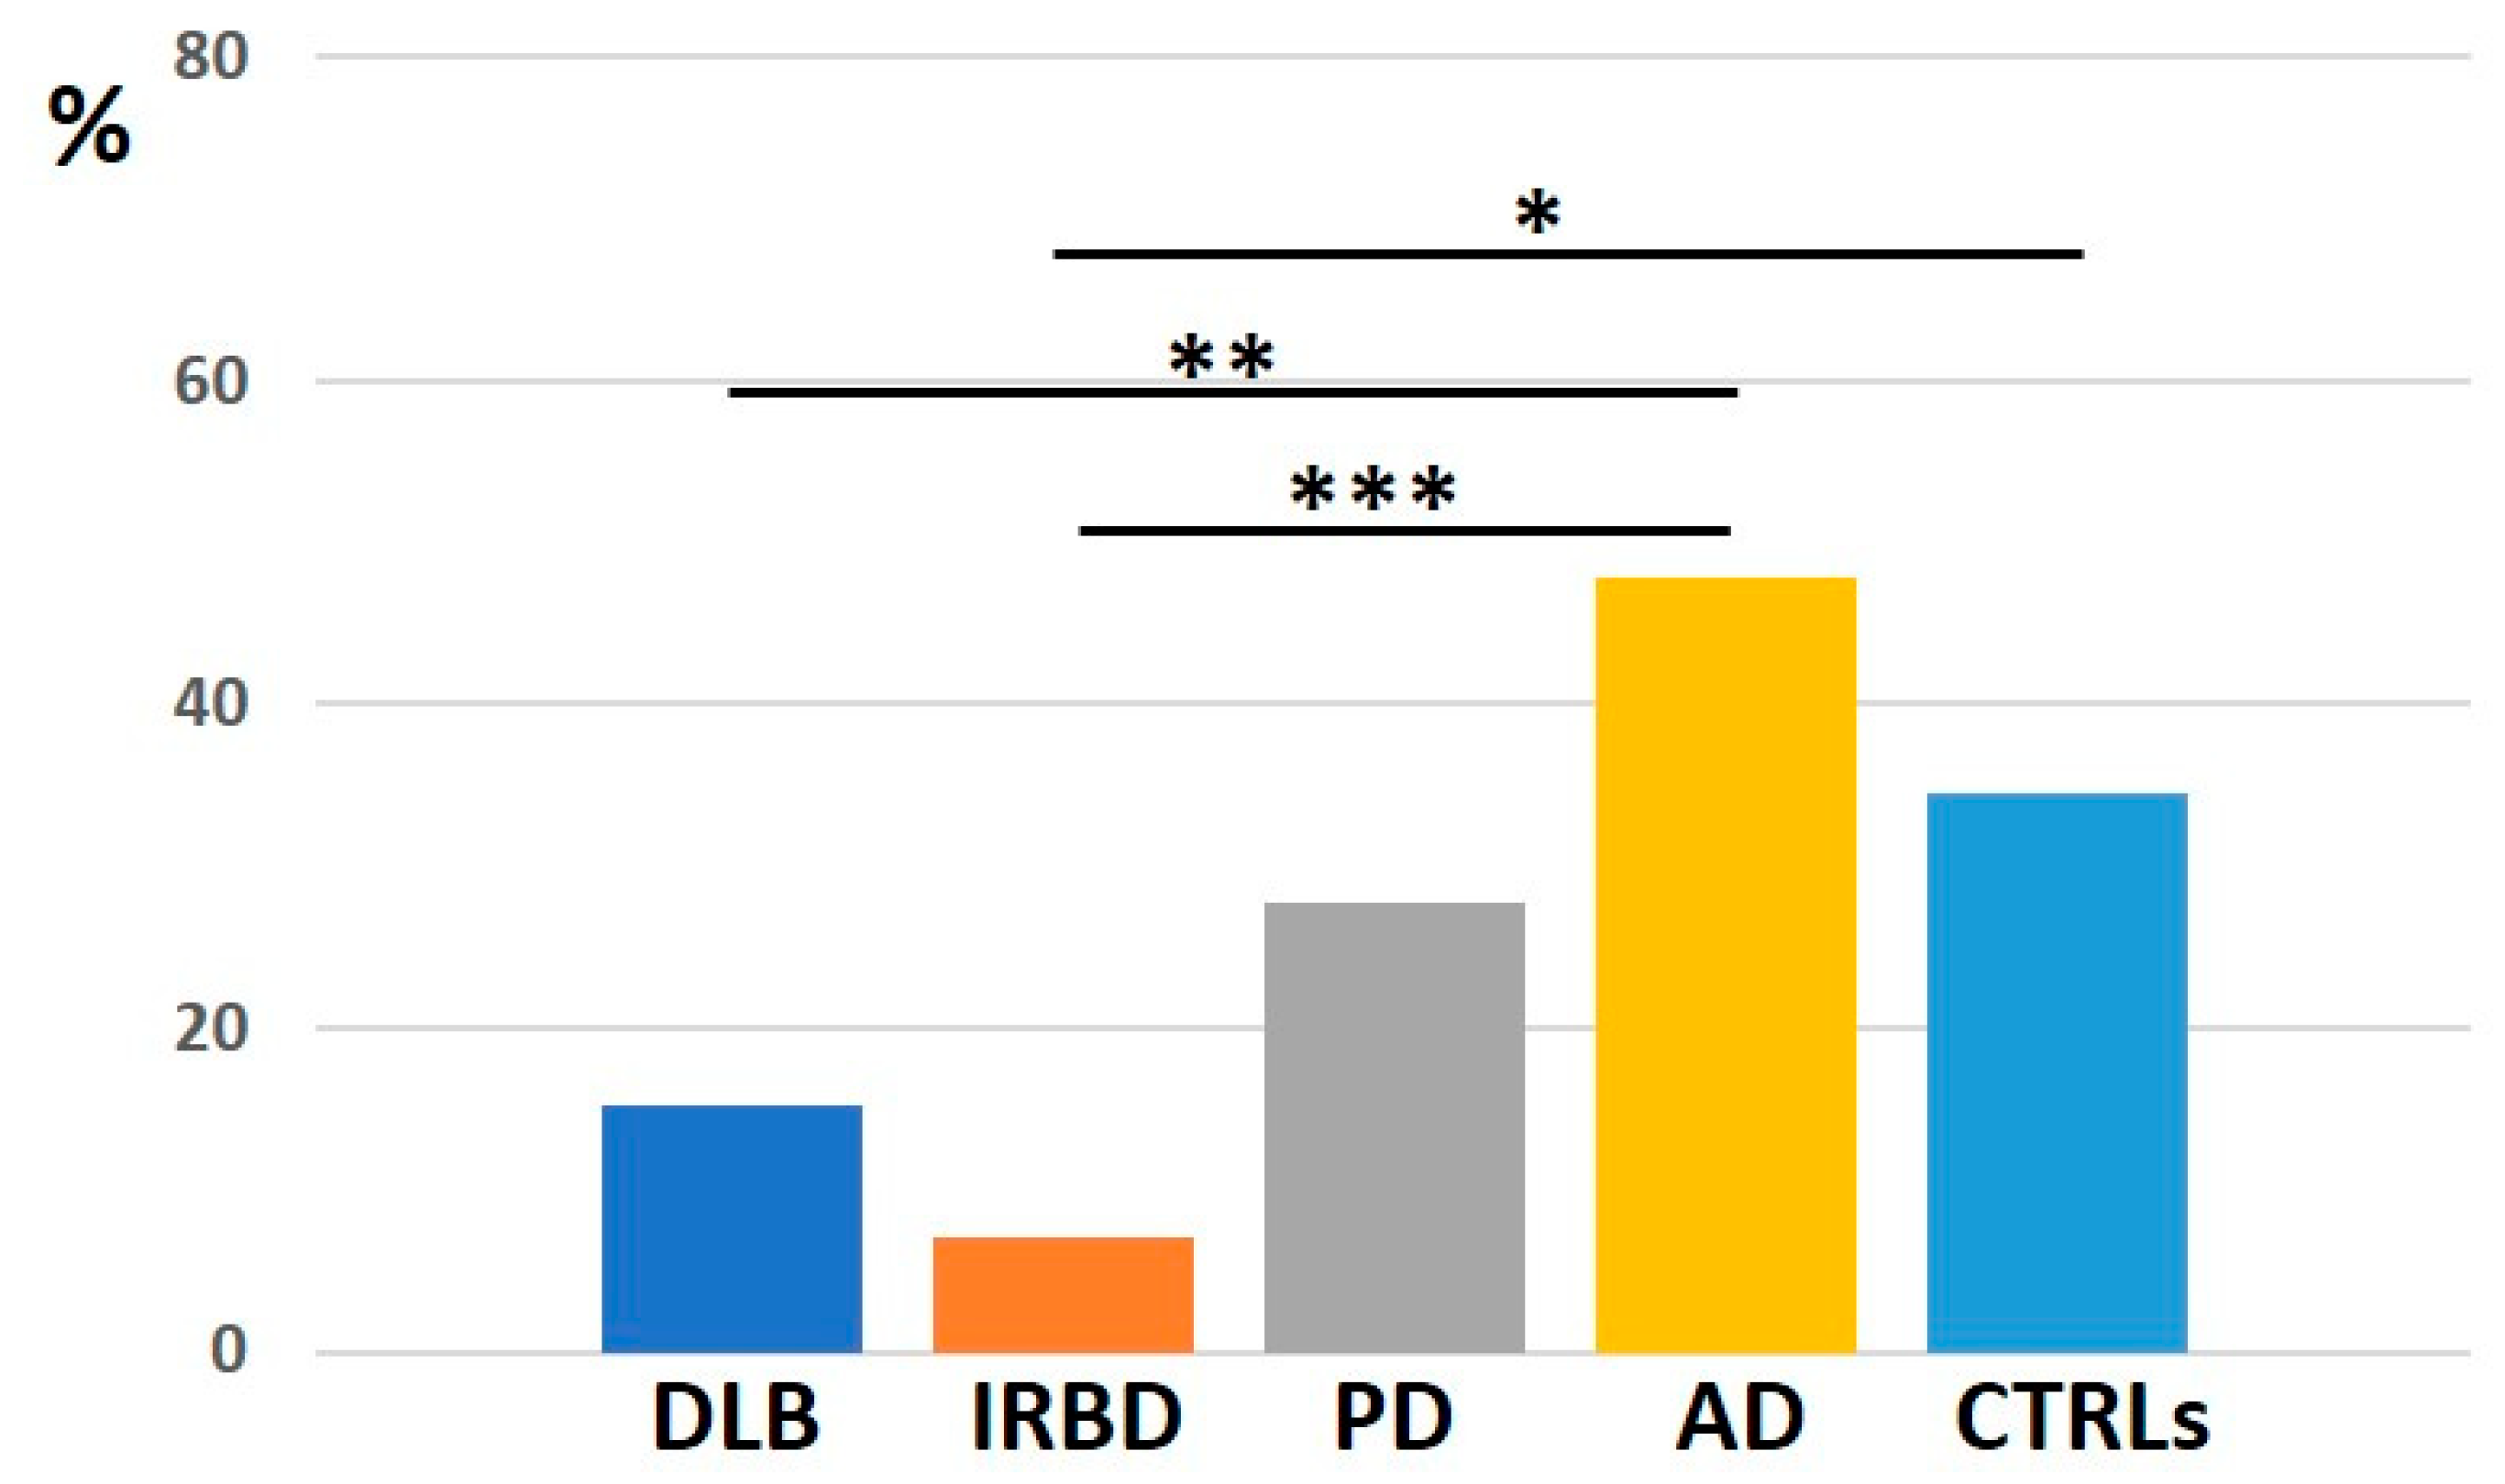
Whereas 61.5% of scaRNAs were found in all groups, only 24.5% of snoRNAs, 20% of snRNAs and 28.6% of mtRNAs were commonly expressed (Appendix A.3). When dividing the minor RNA groups into nuclear and mtRNAs, we found that IRBD expressed less specific nuclear RNAs compared with CTRLs and AD (p = 0.042 and p = 0.0038, respectively), and DLB compared with AD (p = 0.0071; Figure 6). On the contrary, both IRBD and DLB contained more specific mtRNA (66.8 and 71.4%, respectively) compared especially to PD and CTRLs, which expressed only common mtRNAs (Appendix A.3).

2.4. Differential Gene Expression, Gene Ontology (GO) Enrichment and KEGG Pathway Analysis

First, a post hoc power sensitivity analysis was conducted to determine the power of the study to detect a biologically relevant effect. The calculated statistical power was 96.8% and 97.8%, respectively.
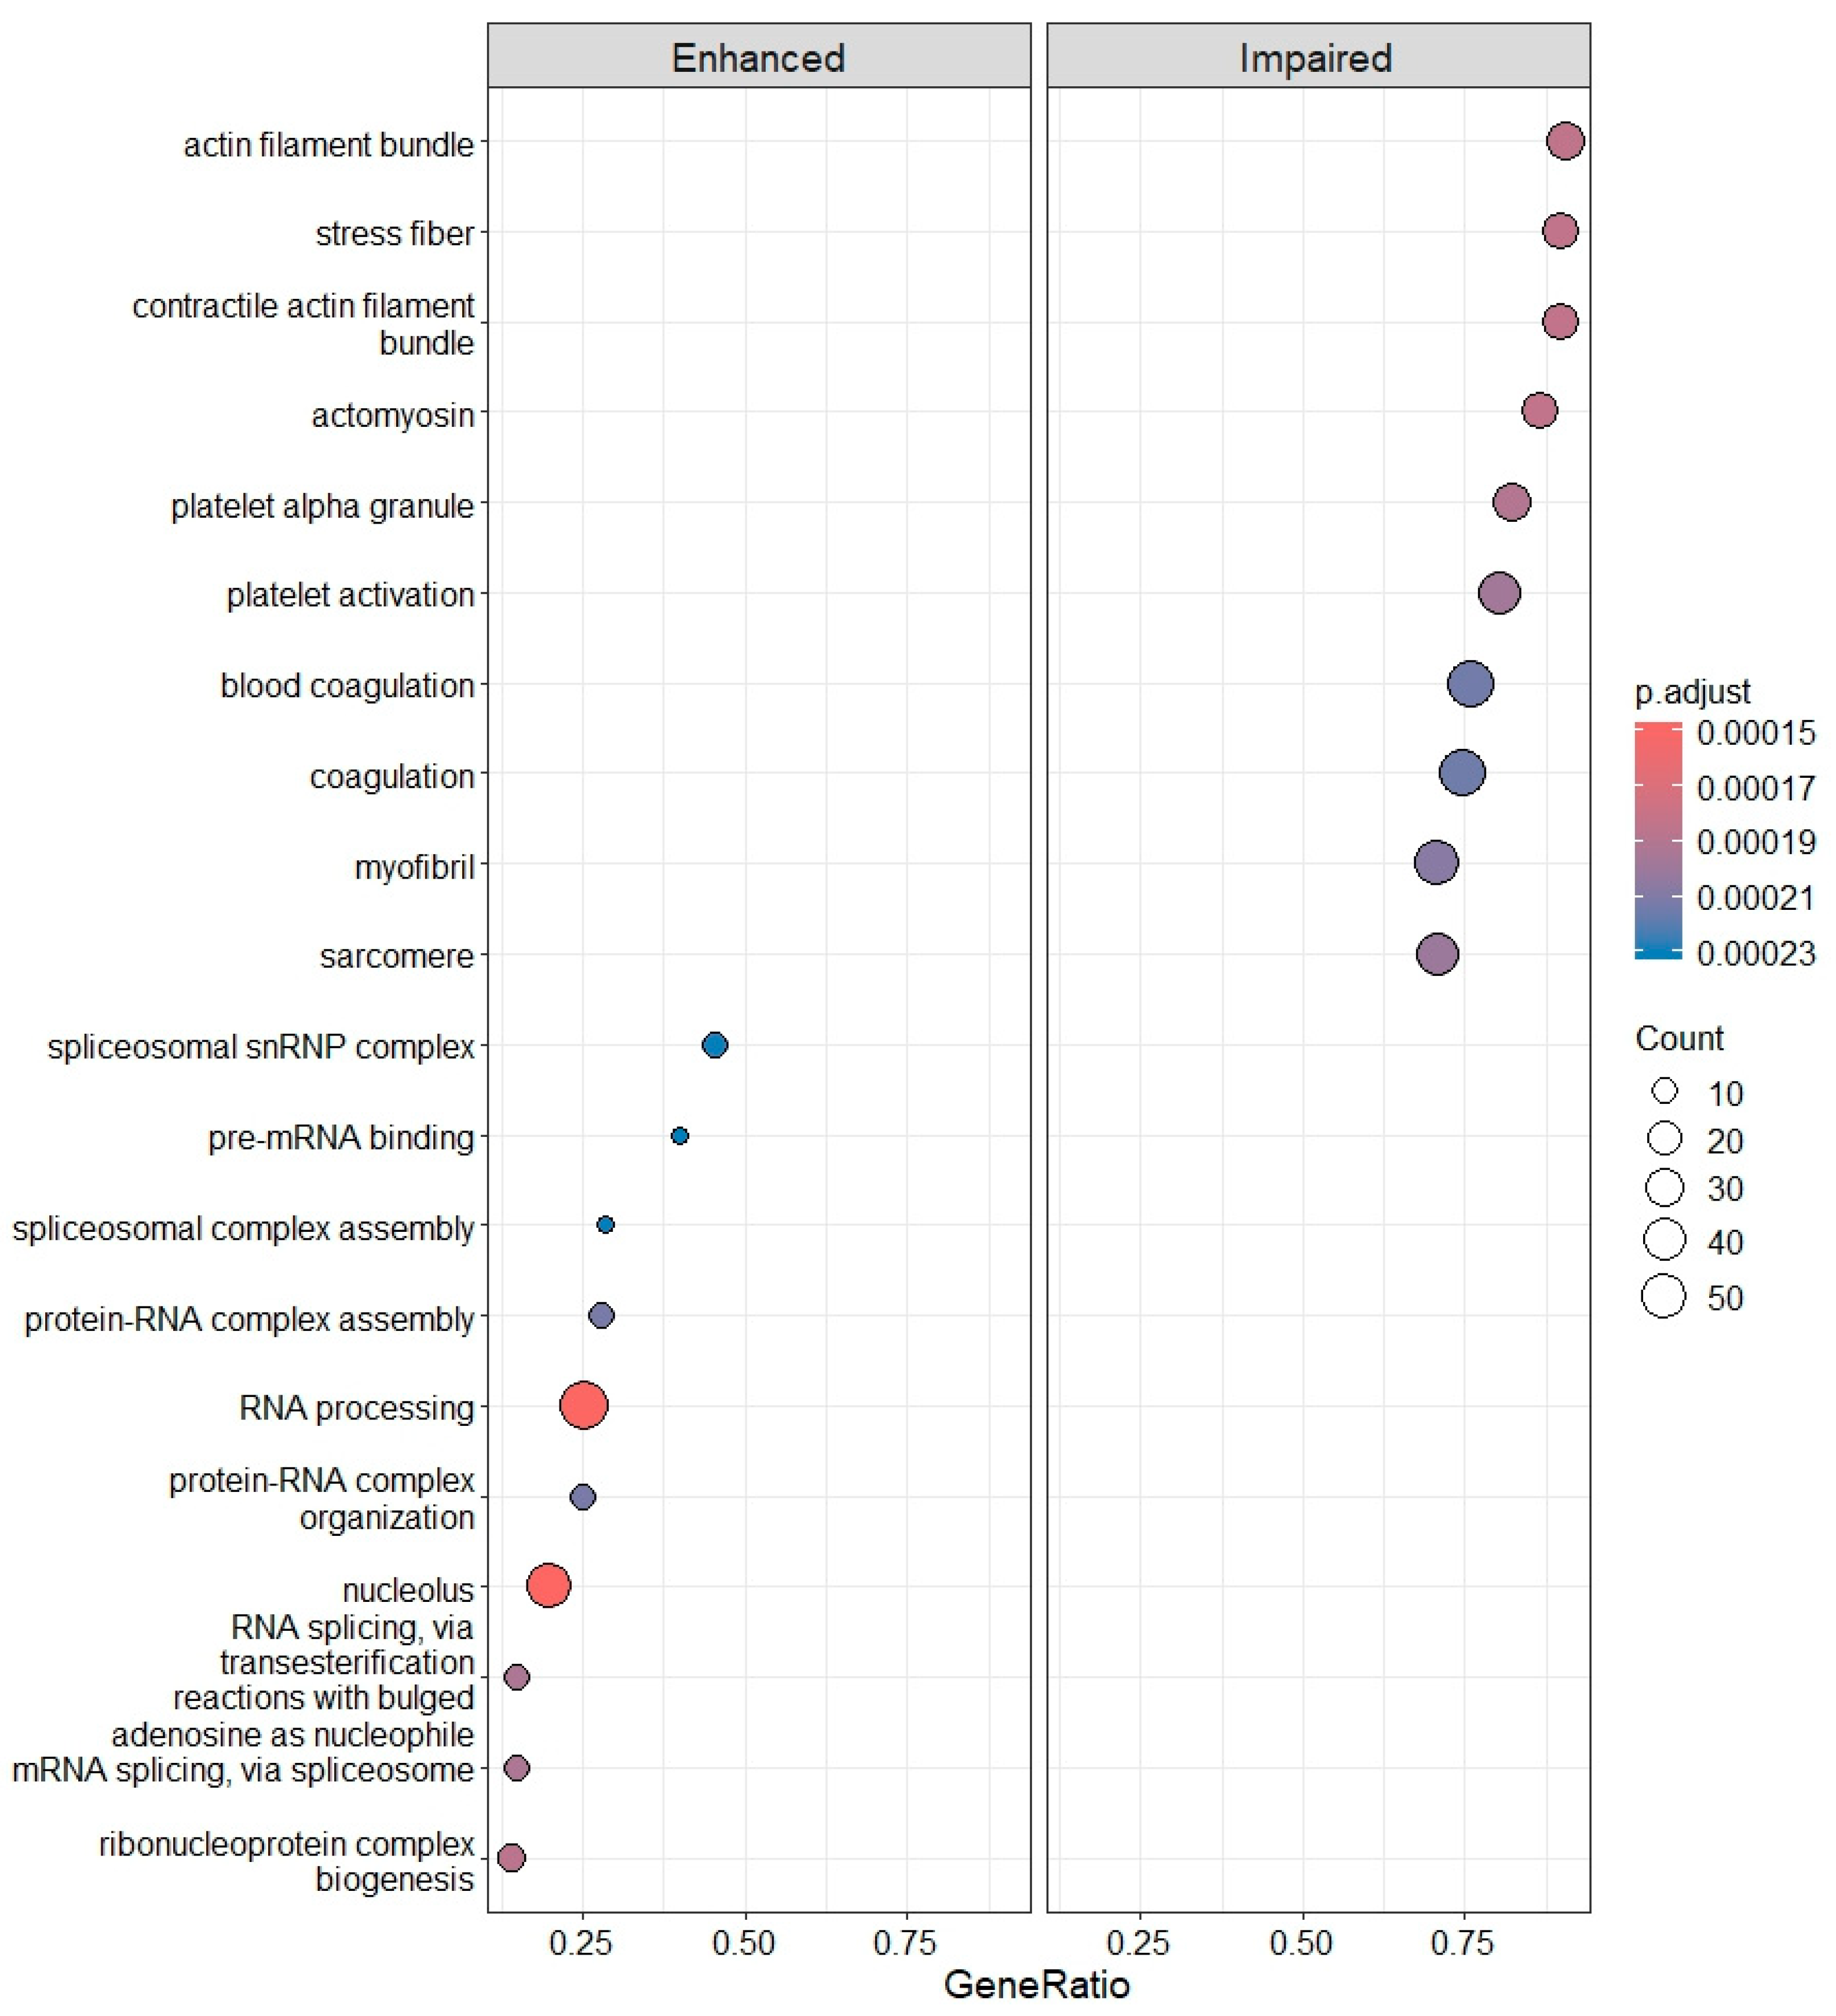
In IRBD, 4690 differentially expressed genes (DEGs) were identified compared with CTRLs. Of these, 2568 (54.7%) showed increased and 1493 (45.3%) decreased expression. To determine which biological processes were positively or negatively affected, DEGs were subjected to Gene Ontology (GO) enrichment analysis. As a result, we observed an increase in the spliceosome and several mechanisms involved in RNA processing, and a decrease in processes related to PLT activation function. These specifically included the impairment of the actin cytoskeleton and PLT alpha-granules (Figure 7).
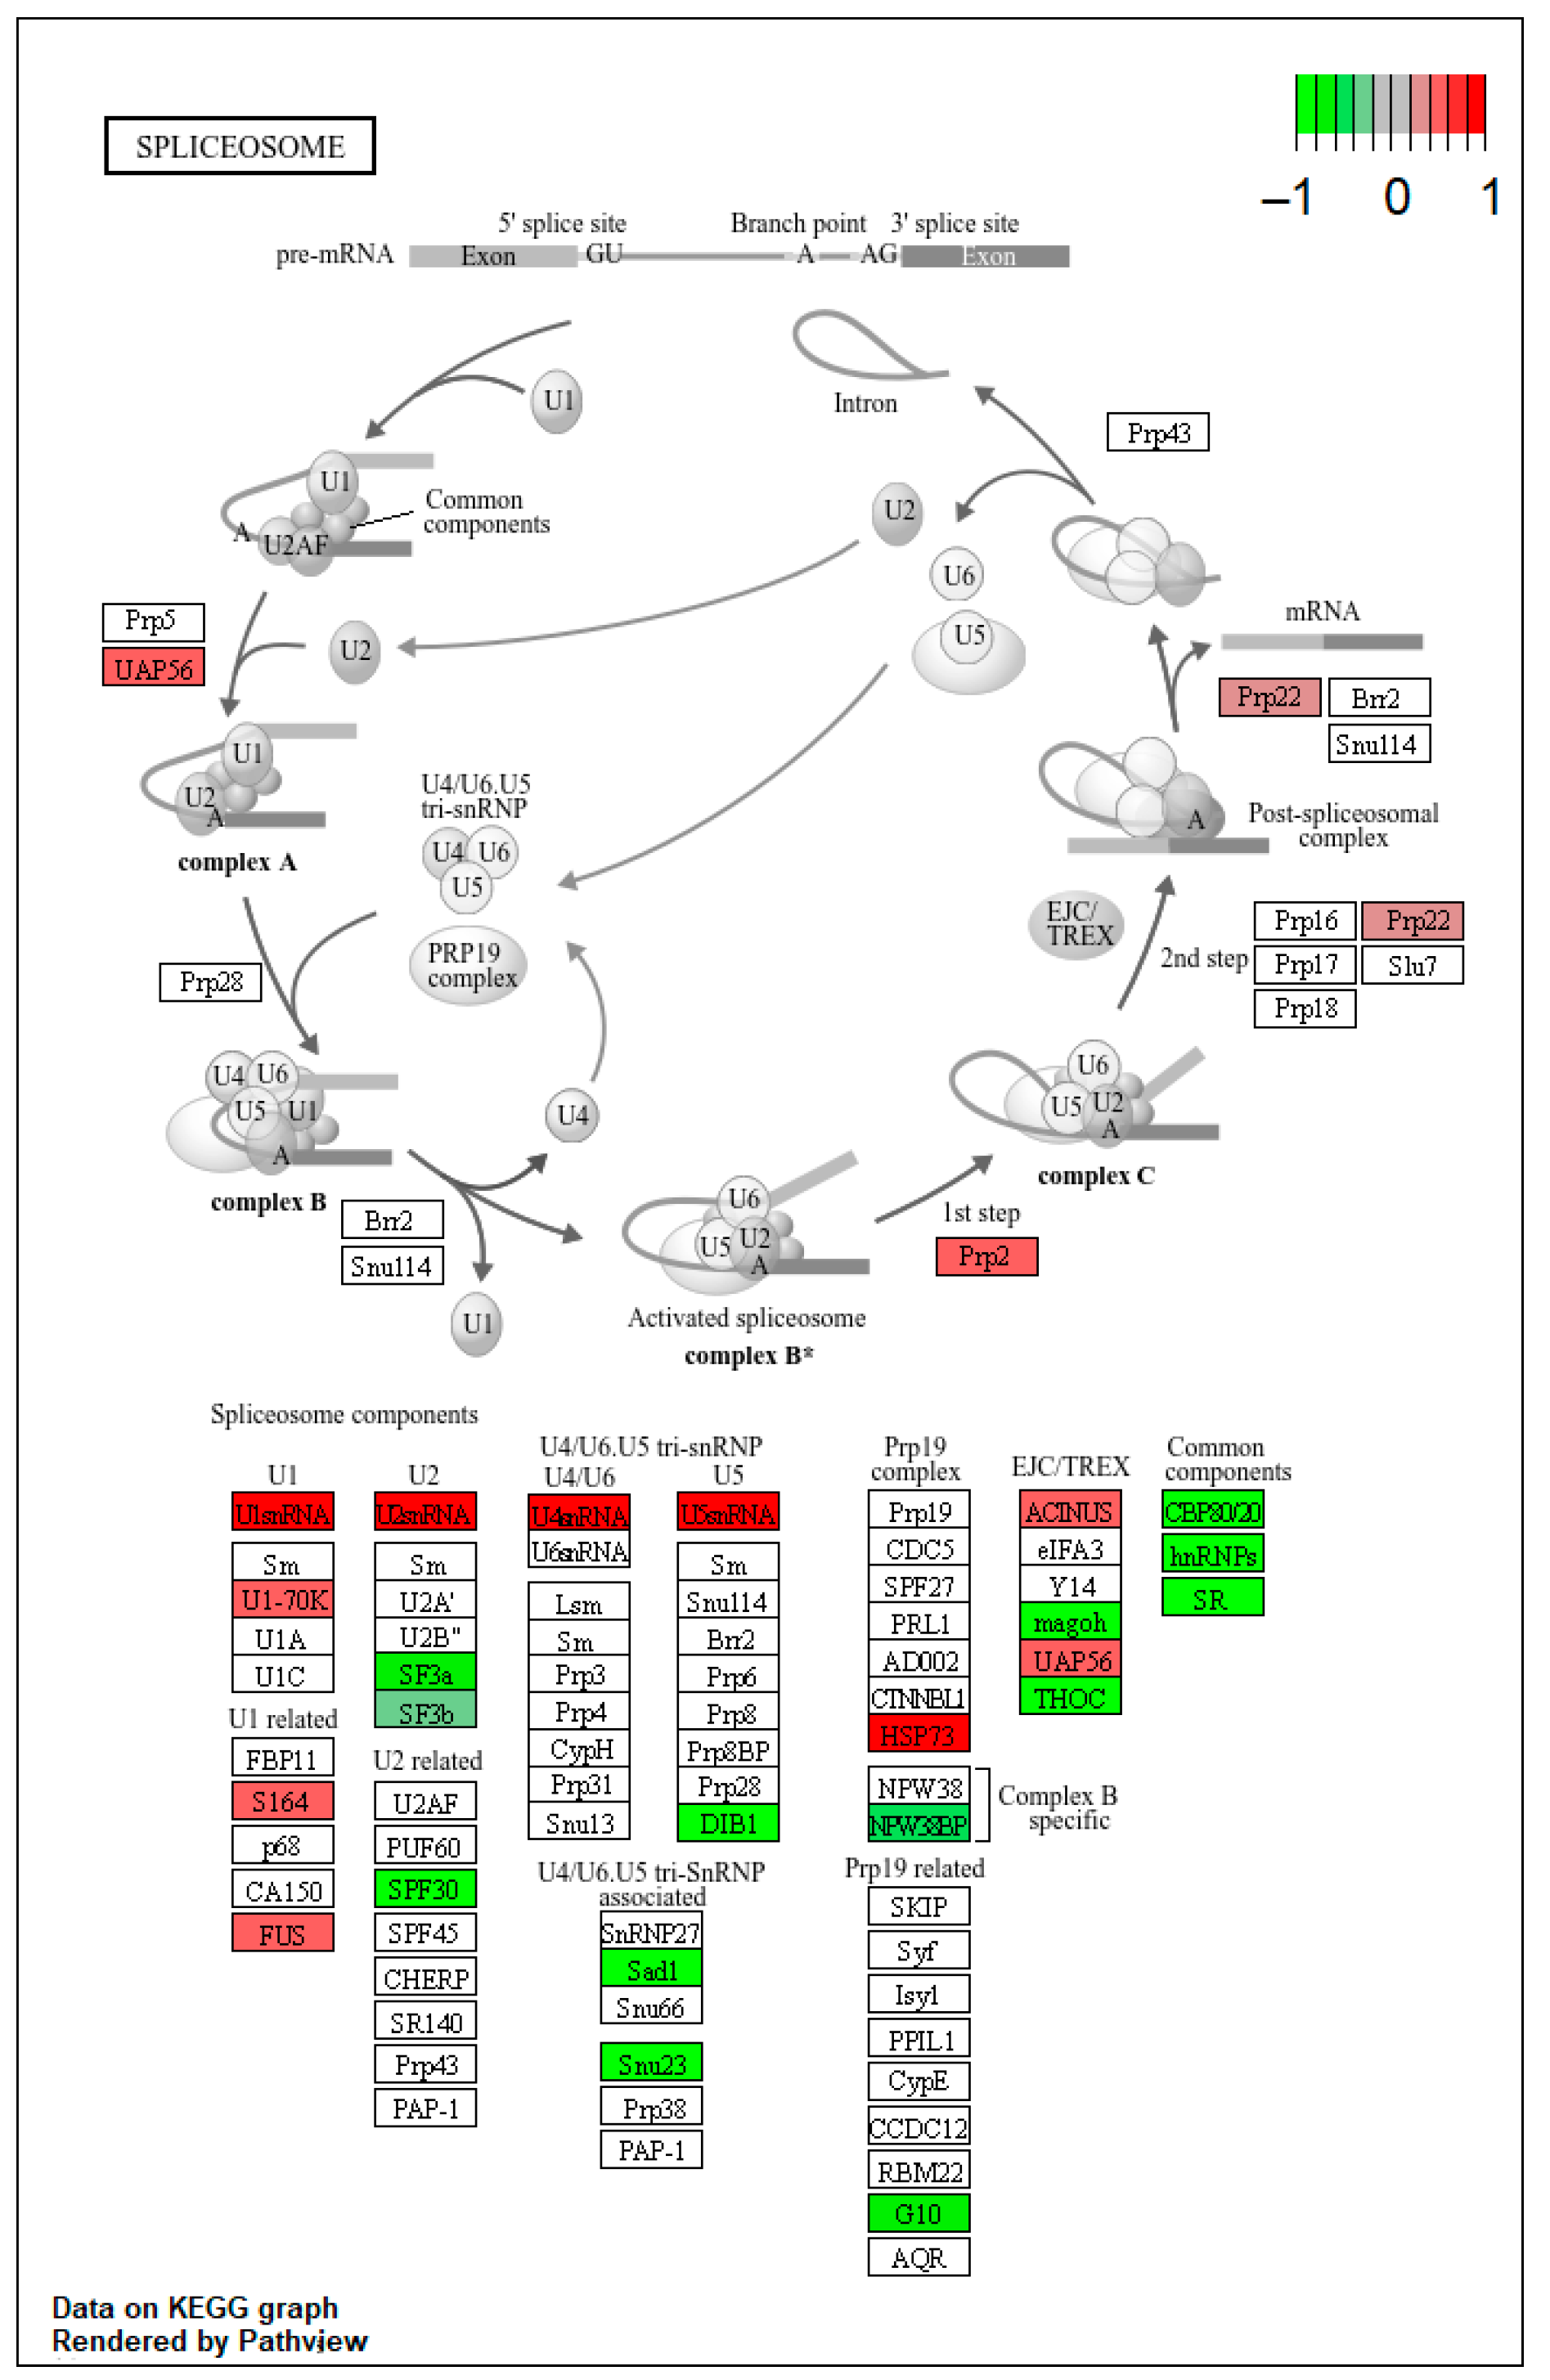
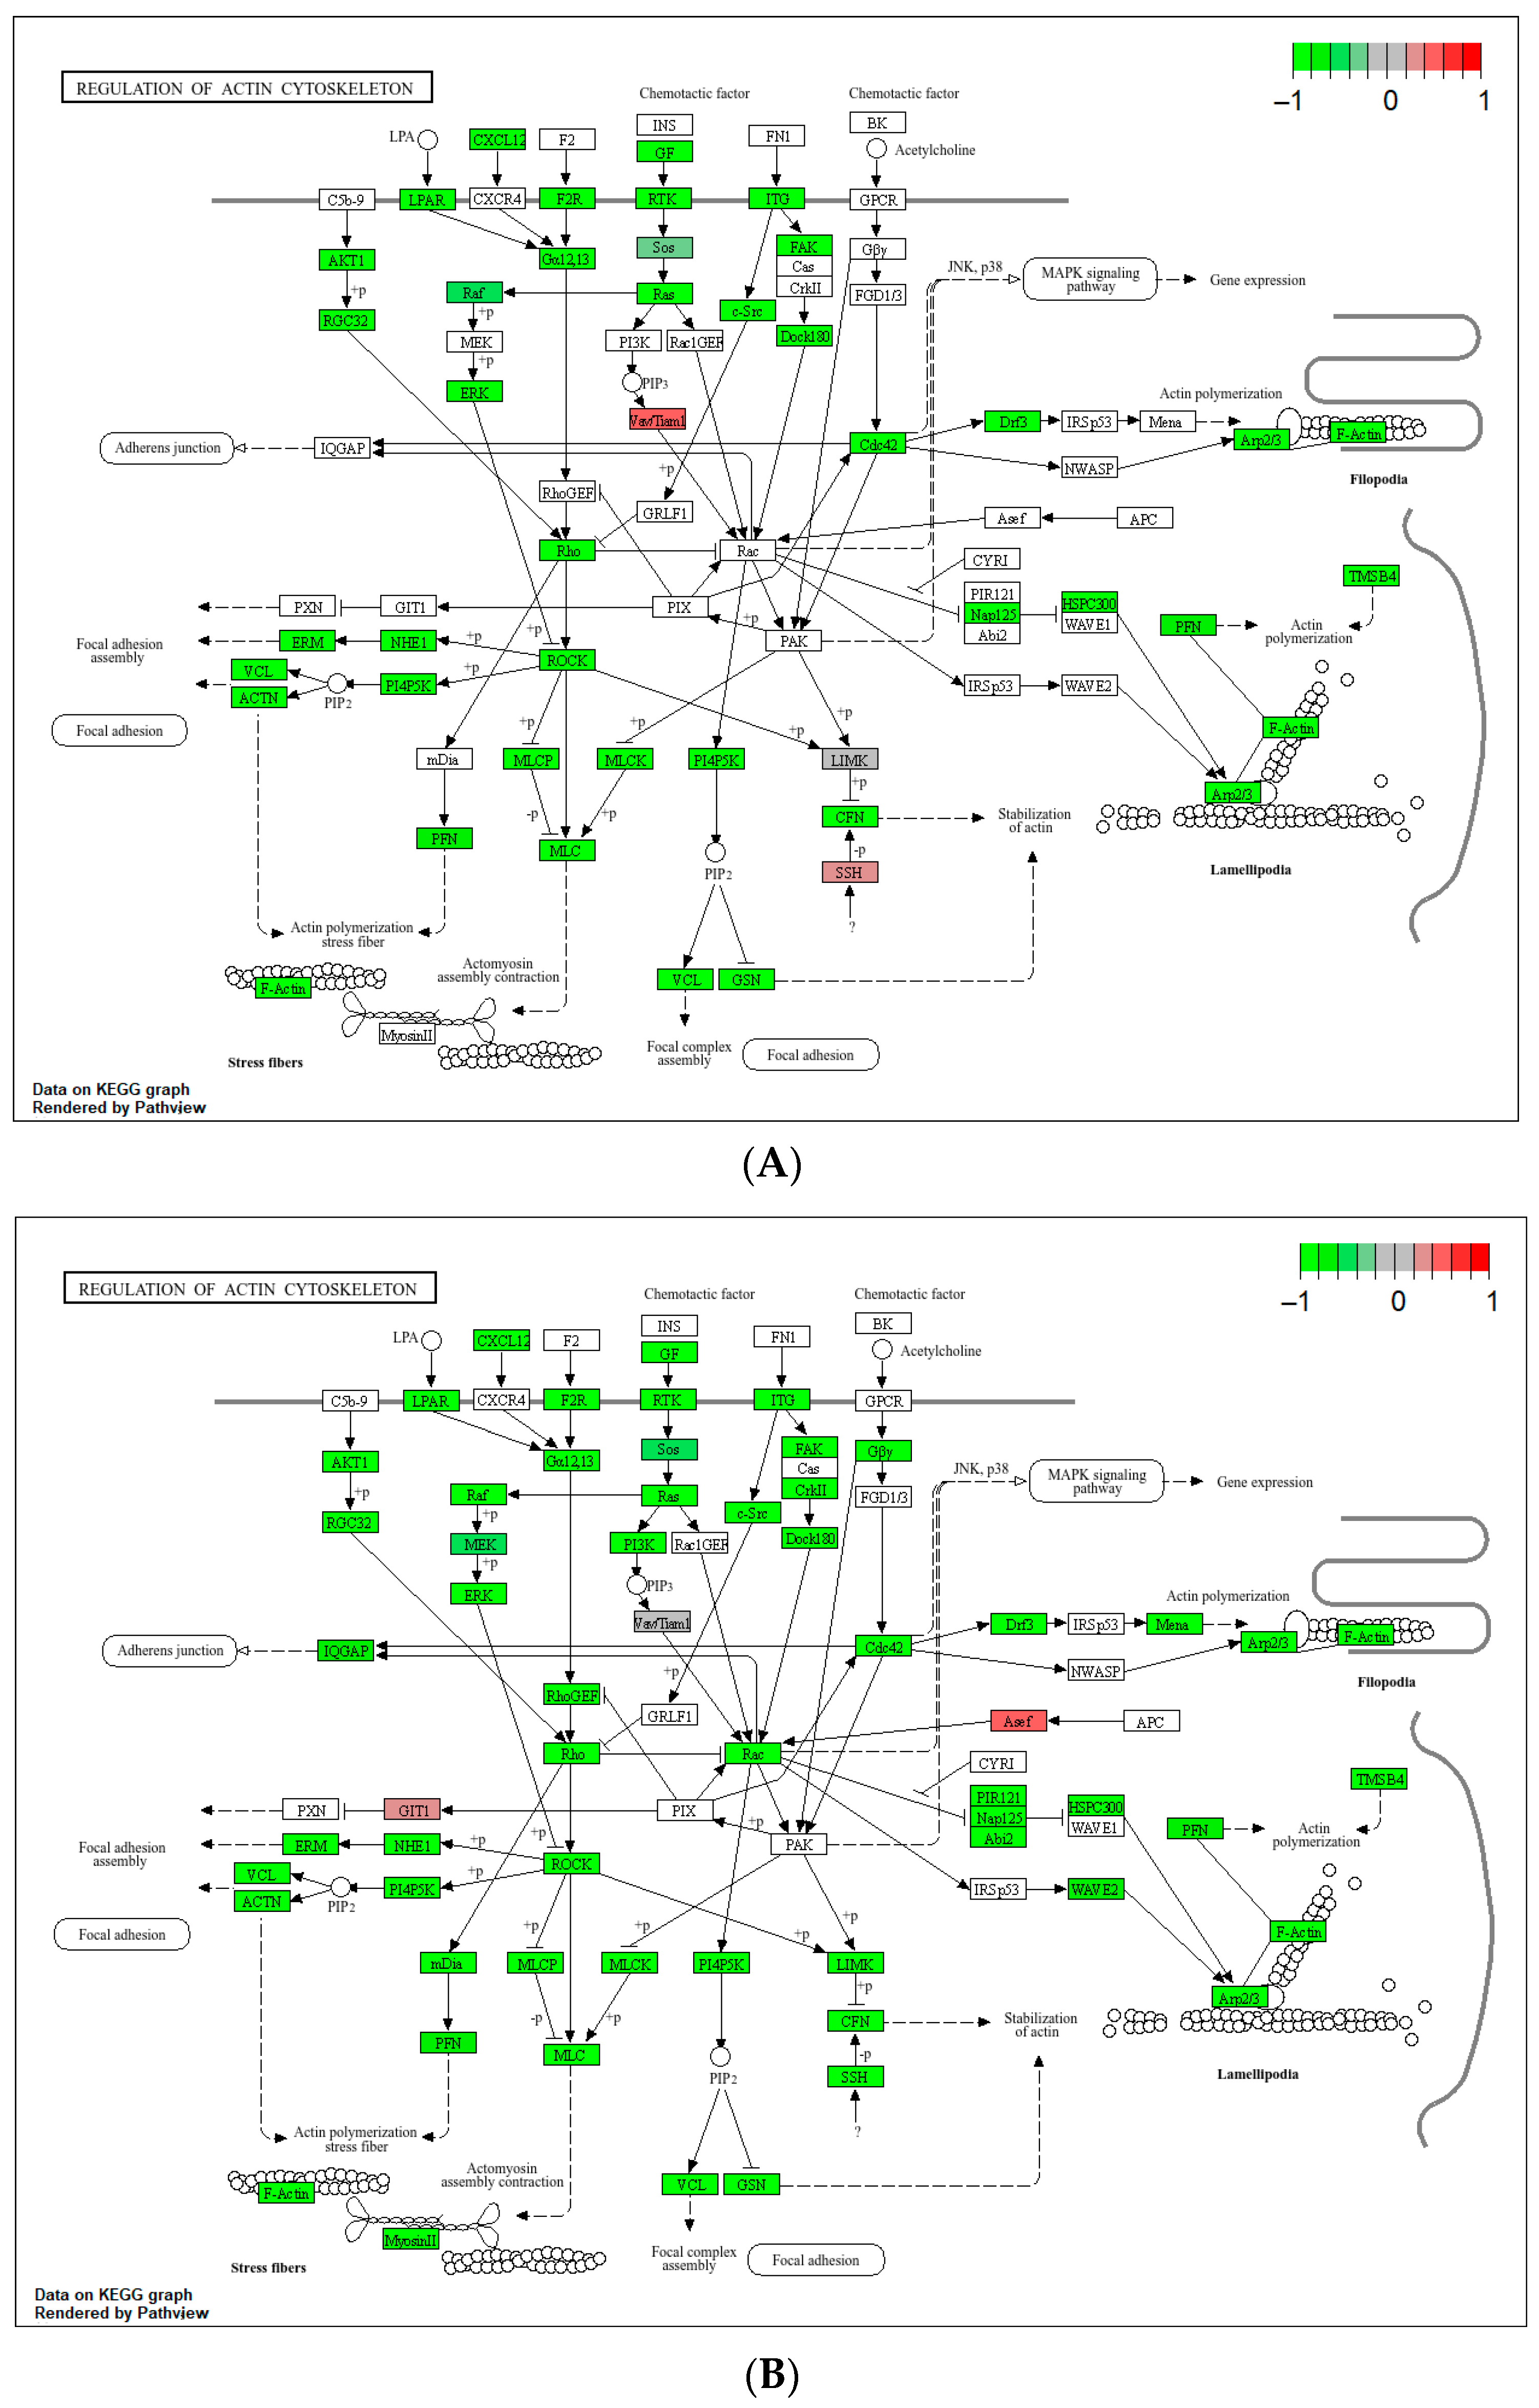
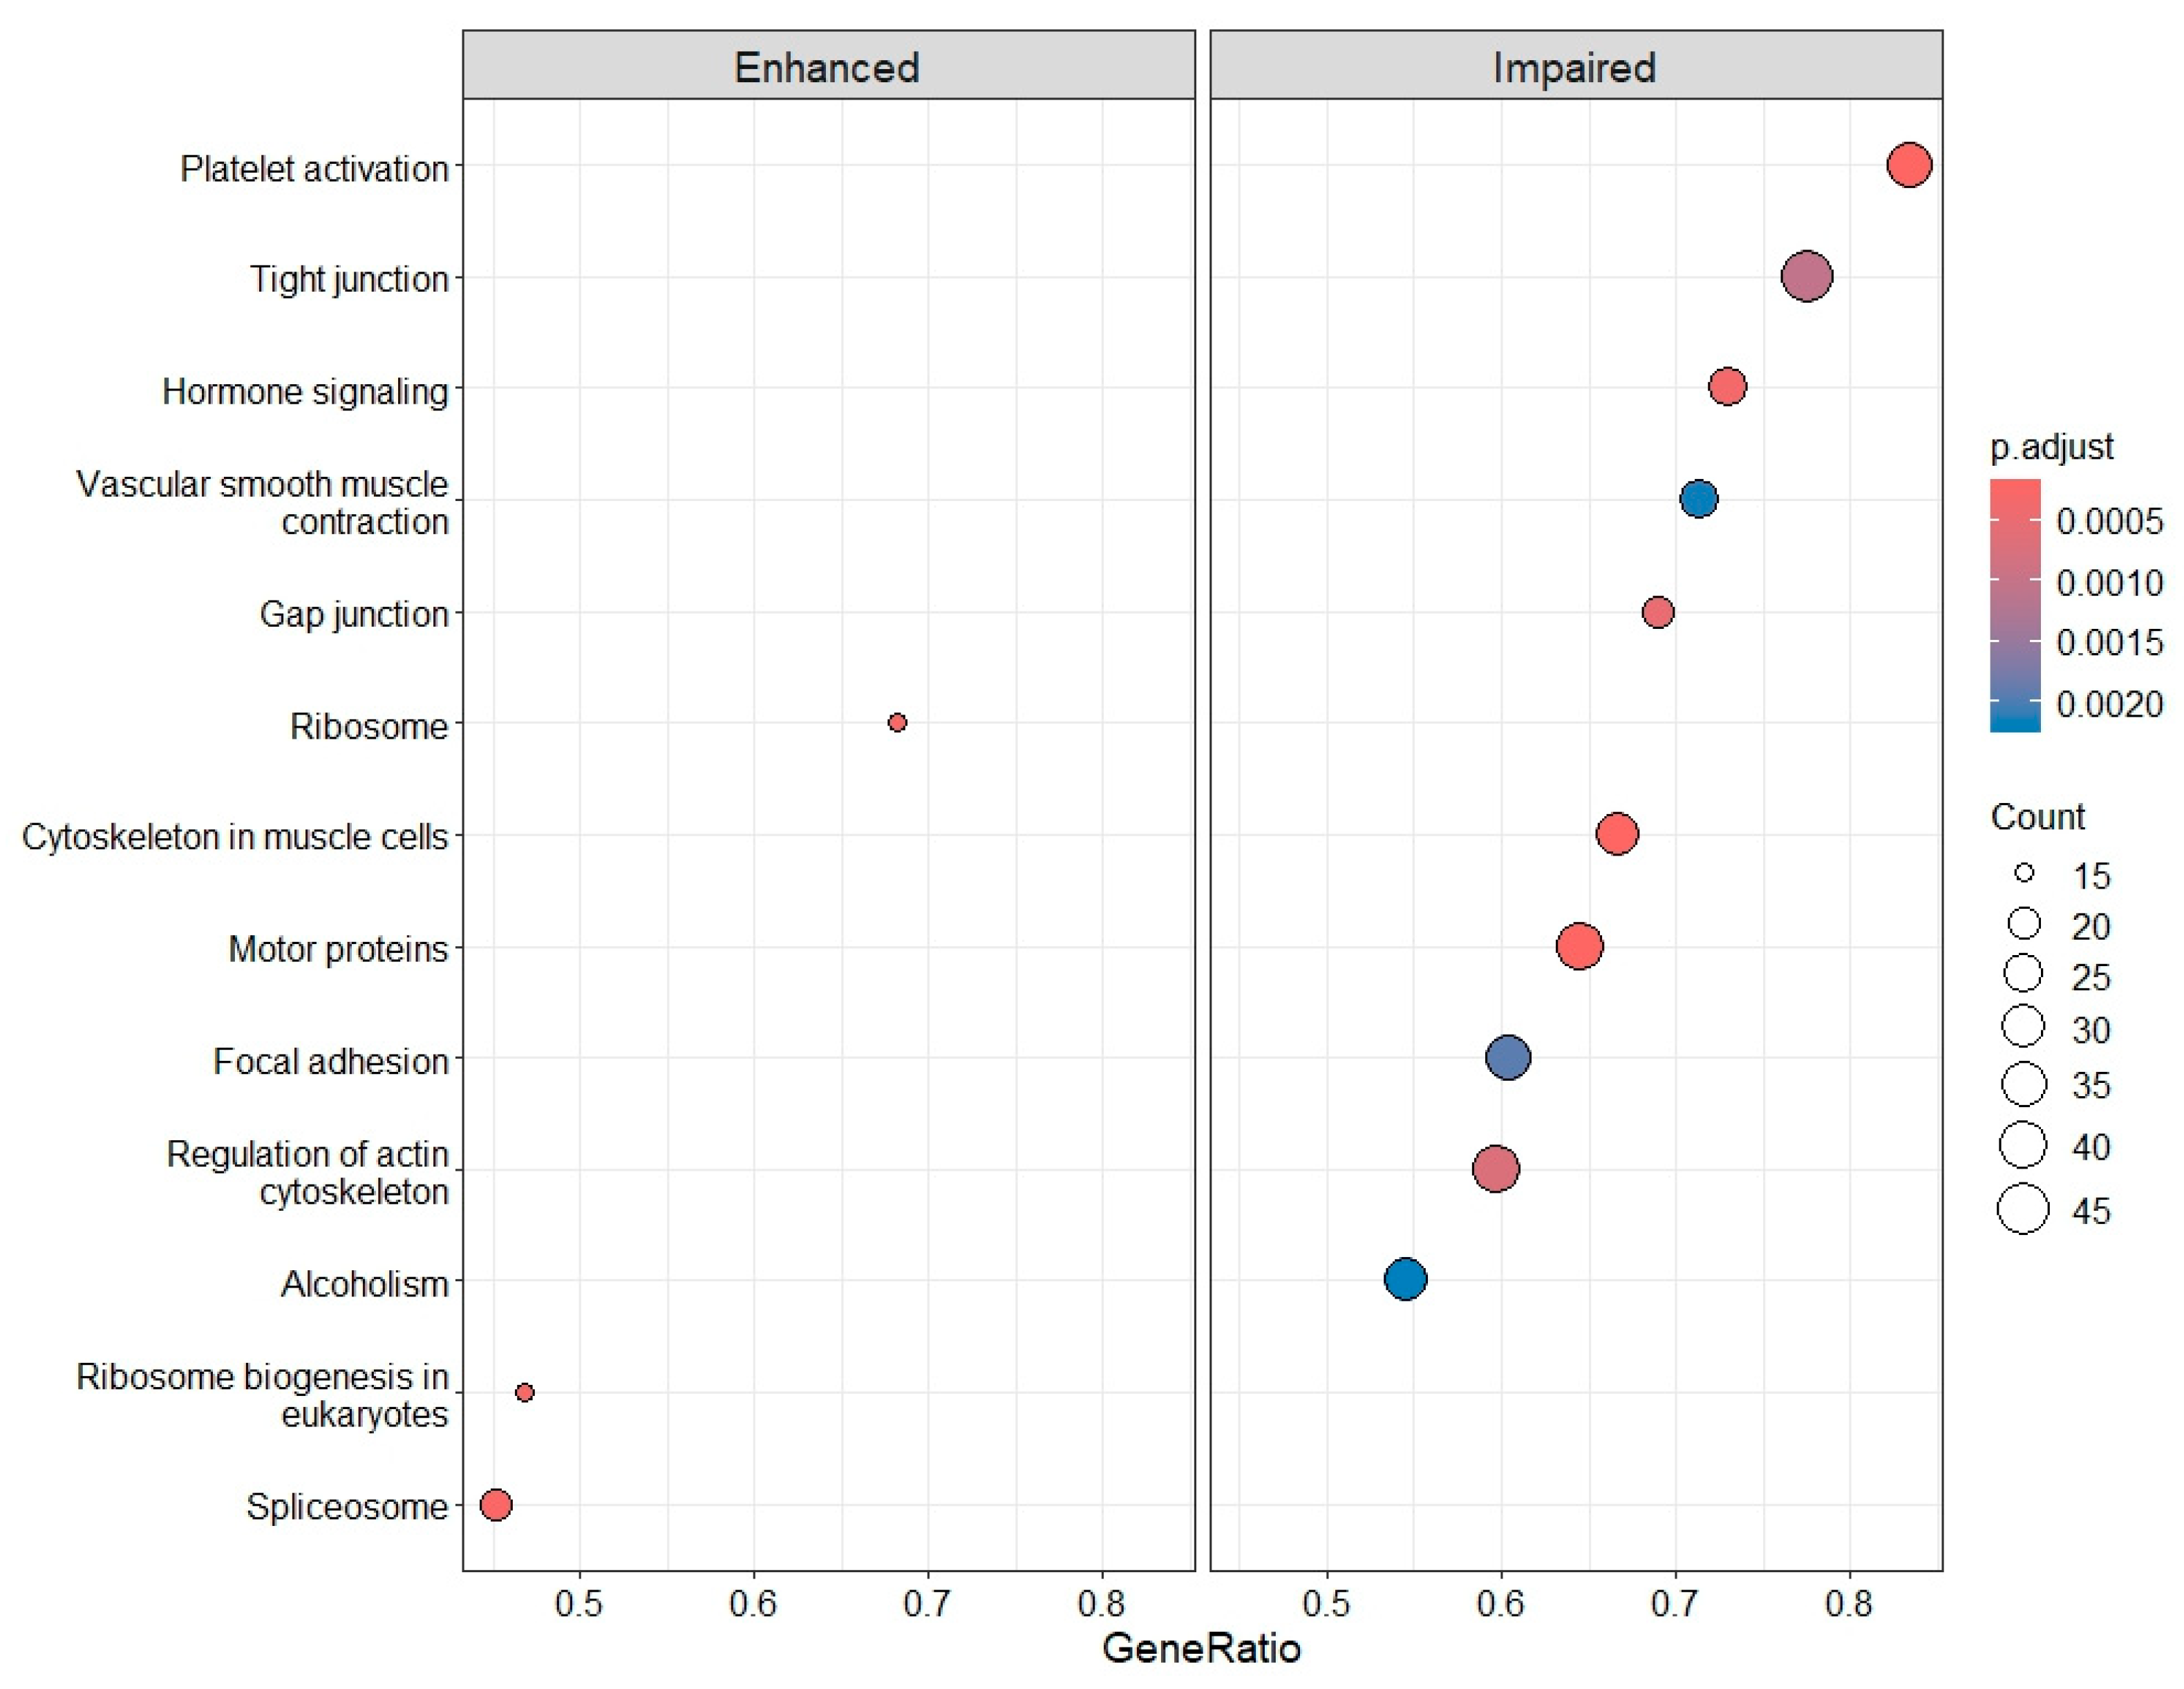
To further understand the functional consequences of gene overexpression or diminution, both gene lists were studied by Kyoto Encyclopedia of Genes and Genomes (KEGG) pathway analysis. Whereas the spliceosome was upregulated (Appendix B.1), an overall moderate downregulation of PLT activation-related processes was observed again (Appendix B.2). The latter included the diminution of junction proteins and impaired actin cytoskeleton regulation (Figure 8 and Appendix B.3).
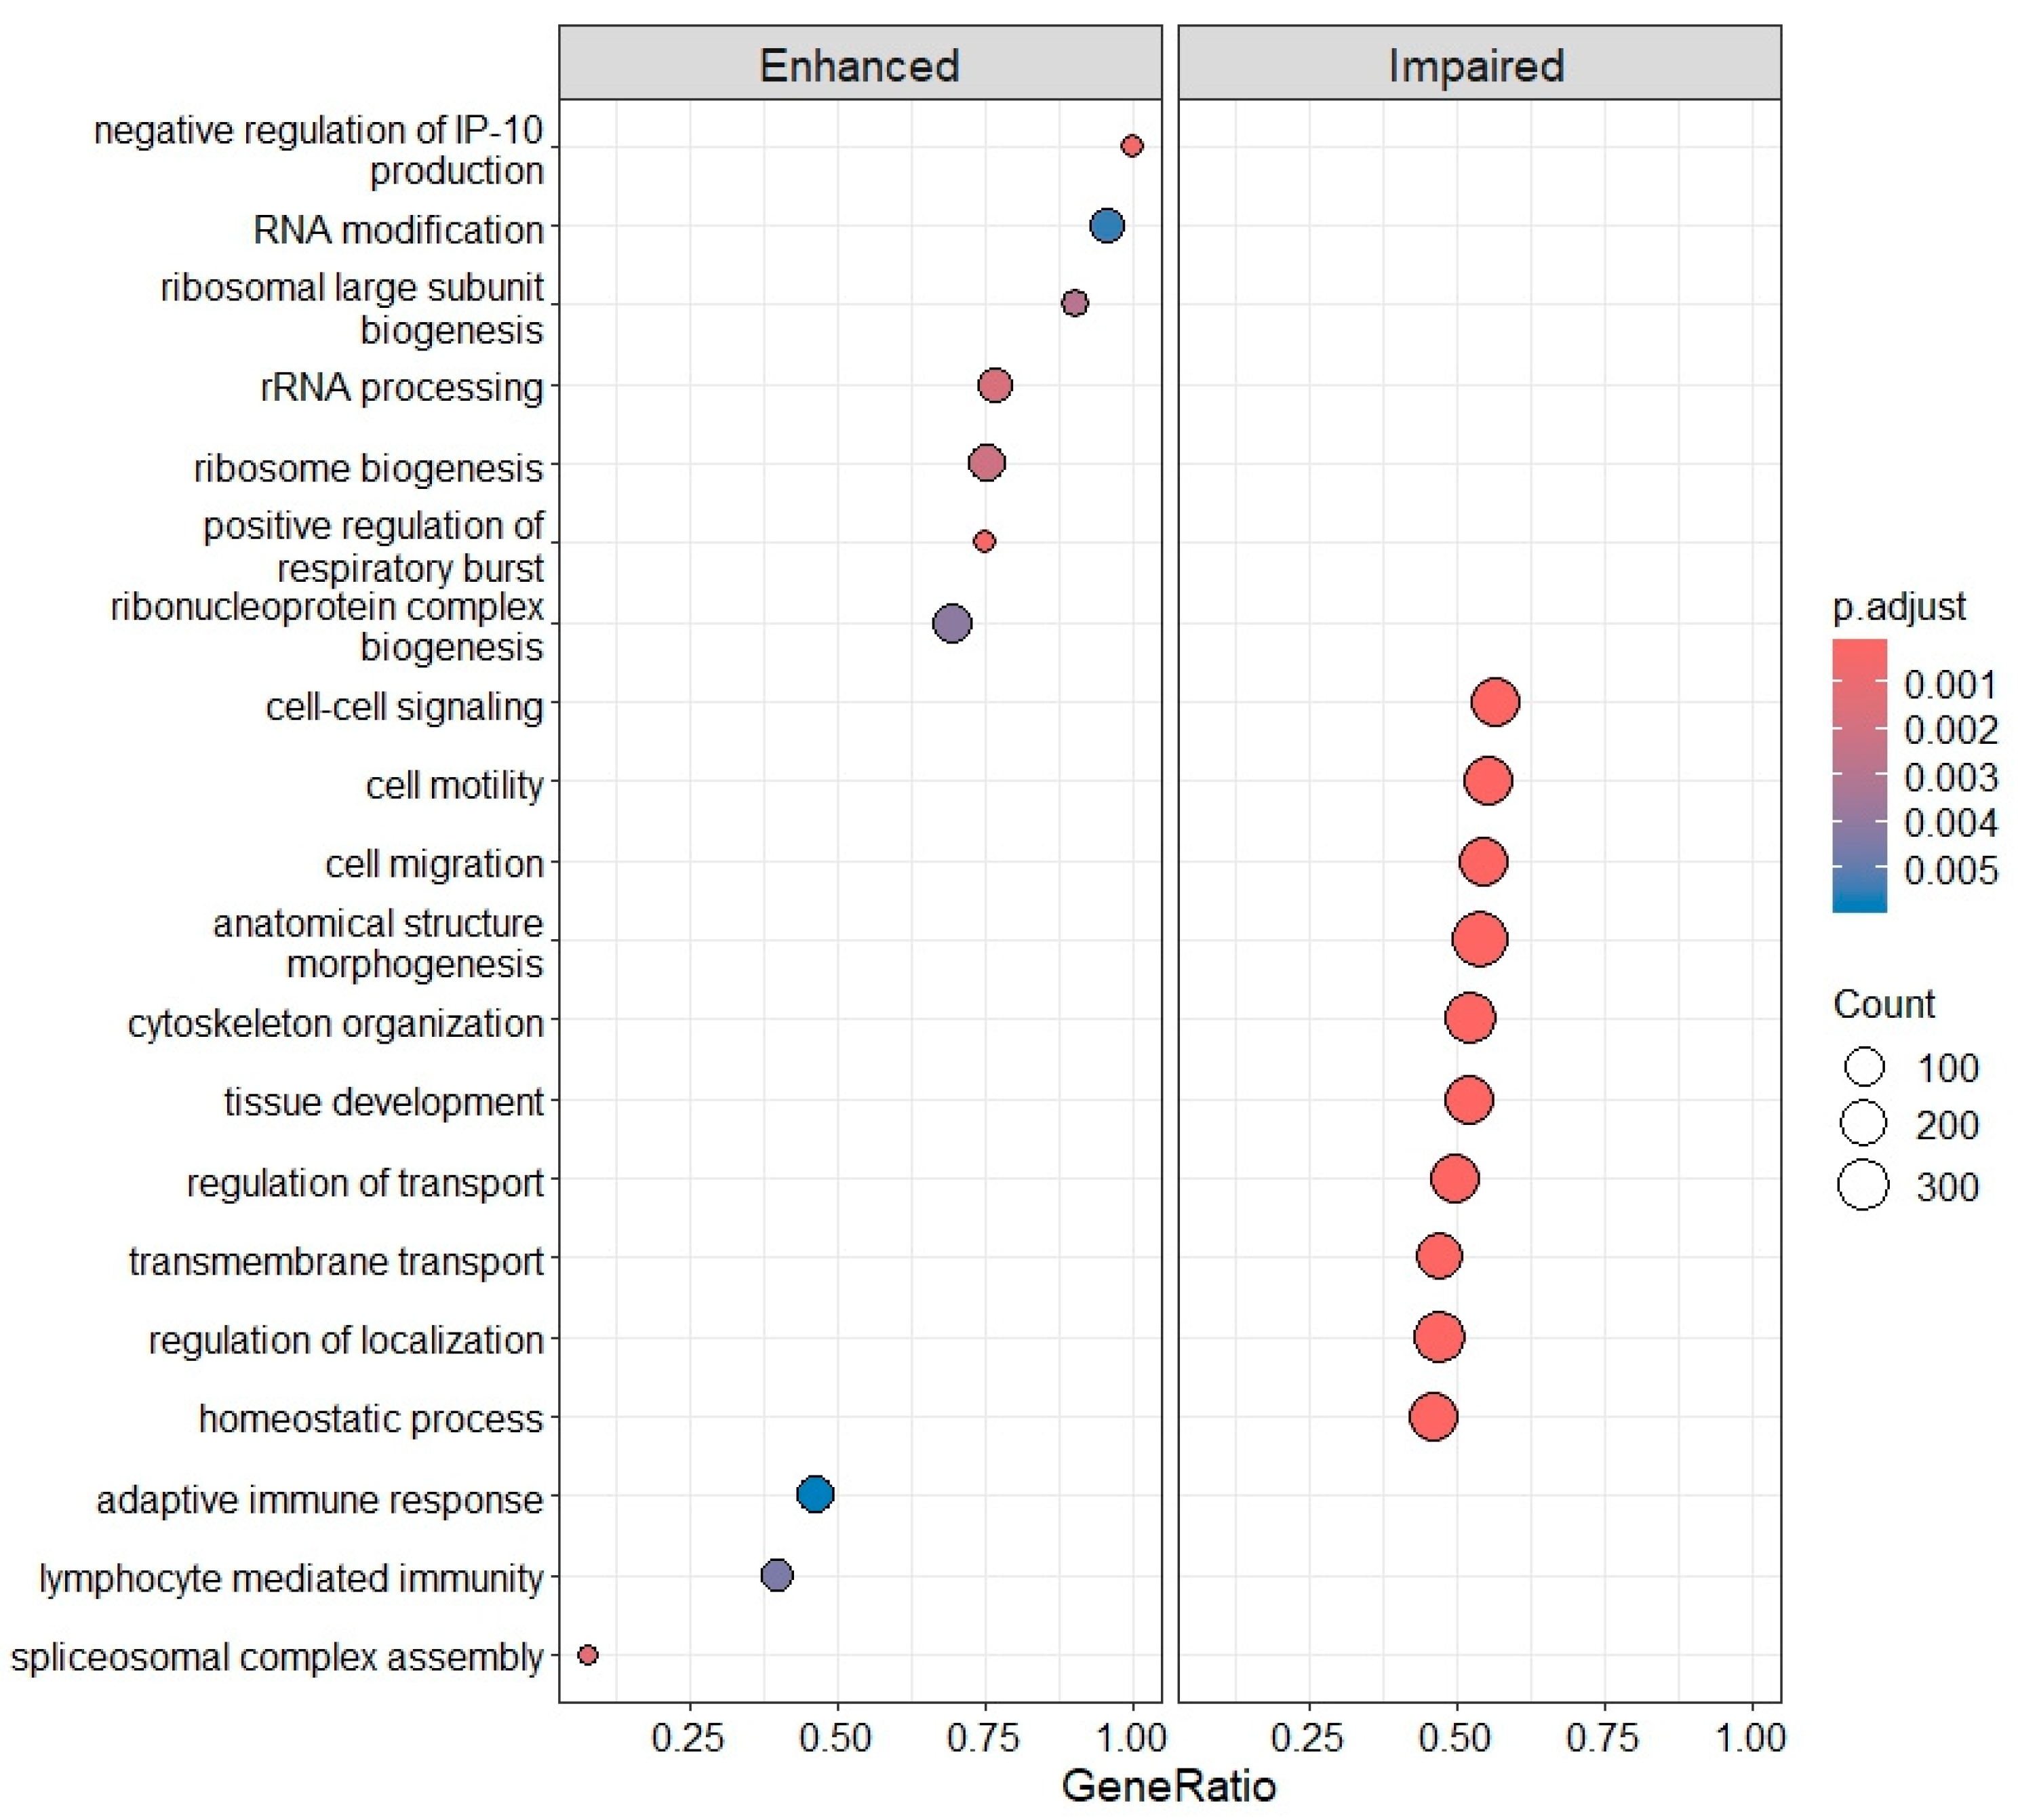
In DLB, 6475 DEGs were found, of which 4036 were increased (73.5%) and 1778 decreased (26.5%). These DEGs were involved in 114 different biological processes identified by GO enrichment, with the most significantly enhanced processes related to ribosomal biogenesis, RNA modification, and the immune response, specifically involving adaptive immune response and lymphocyte-mediated immunity. In contrast, PLT activation (cytoskeleton organization, cell-to-cell signaling), adhesion (cell motility, regulation of localization) and aggregation (anatomical structure morphogenesis, tissue development) were markedly impaired, involving between 200 and 300 genes each (Figure 9).
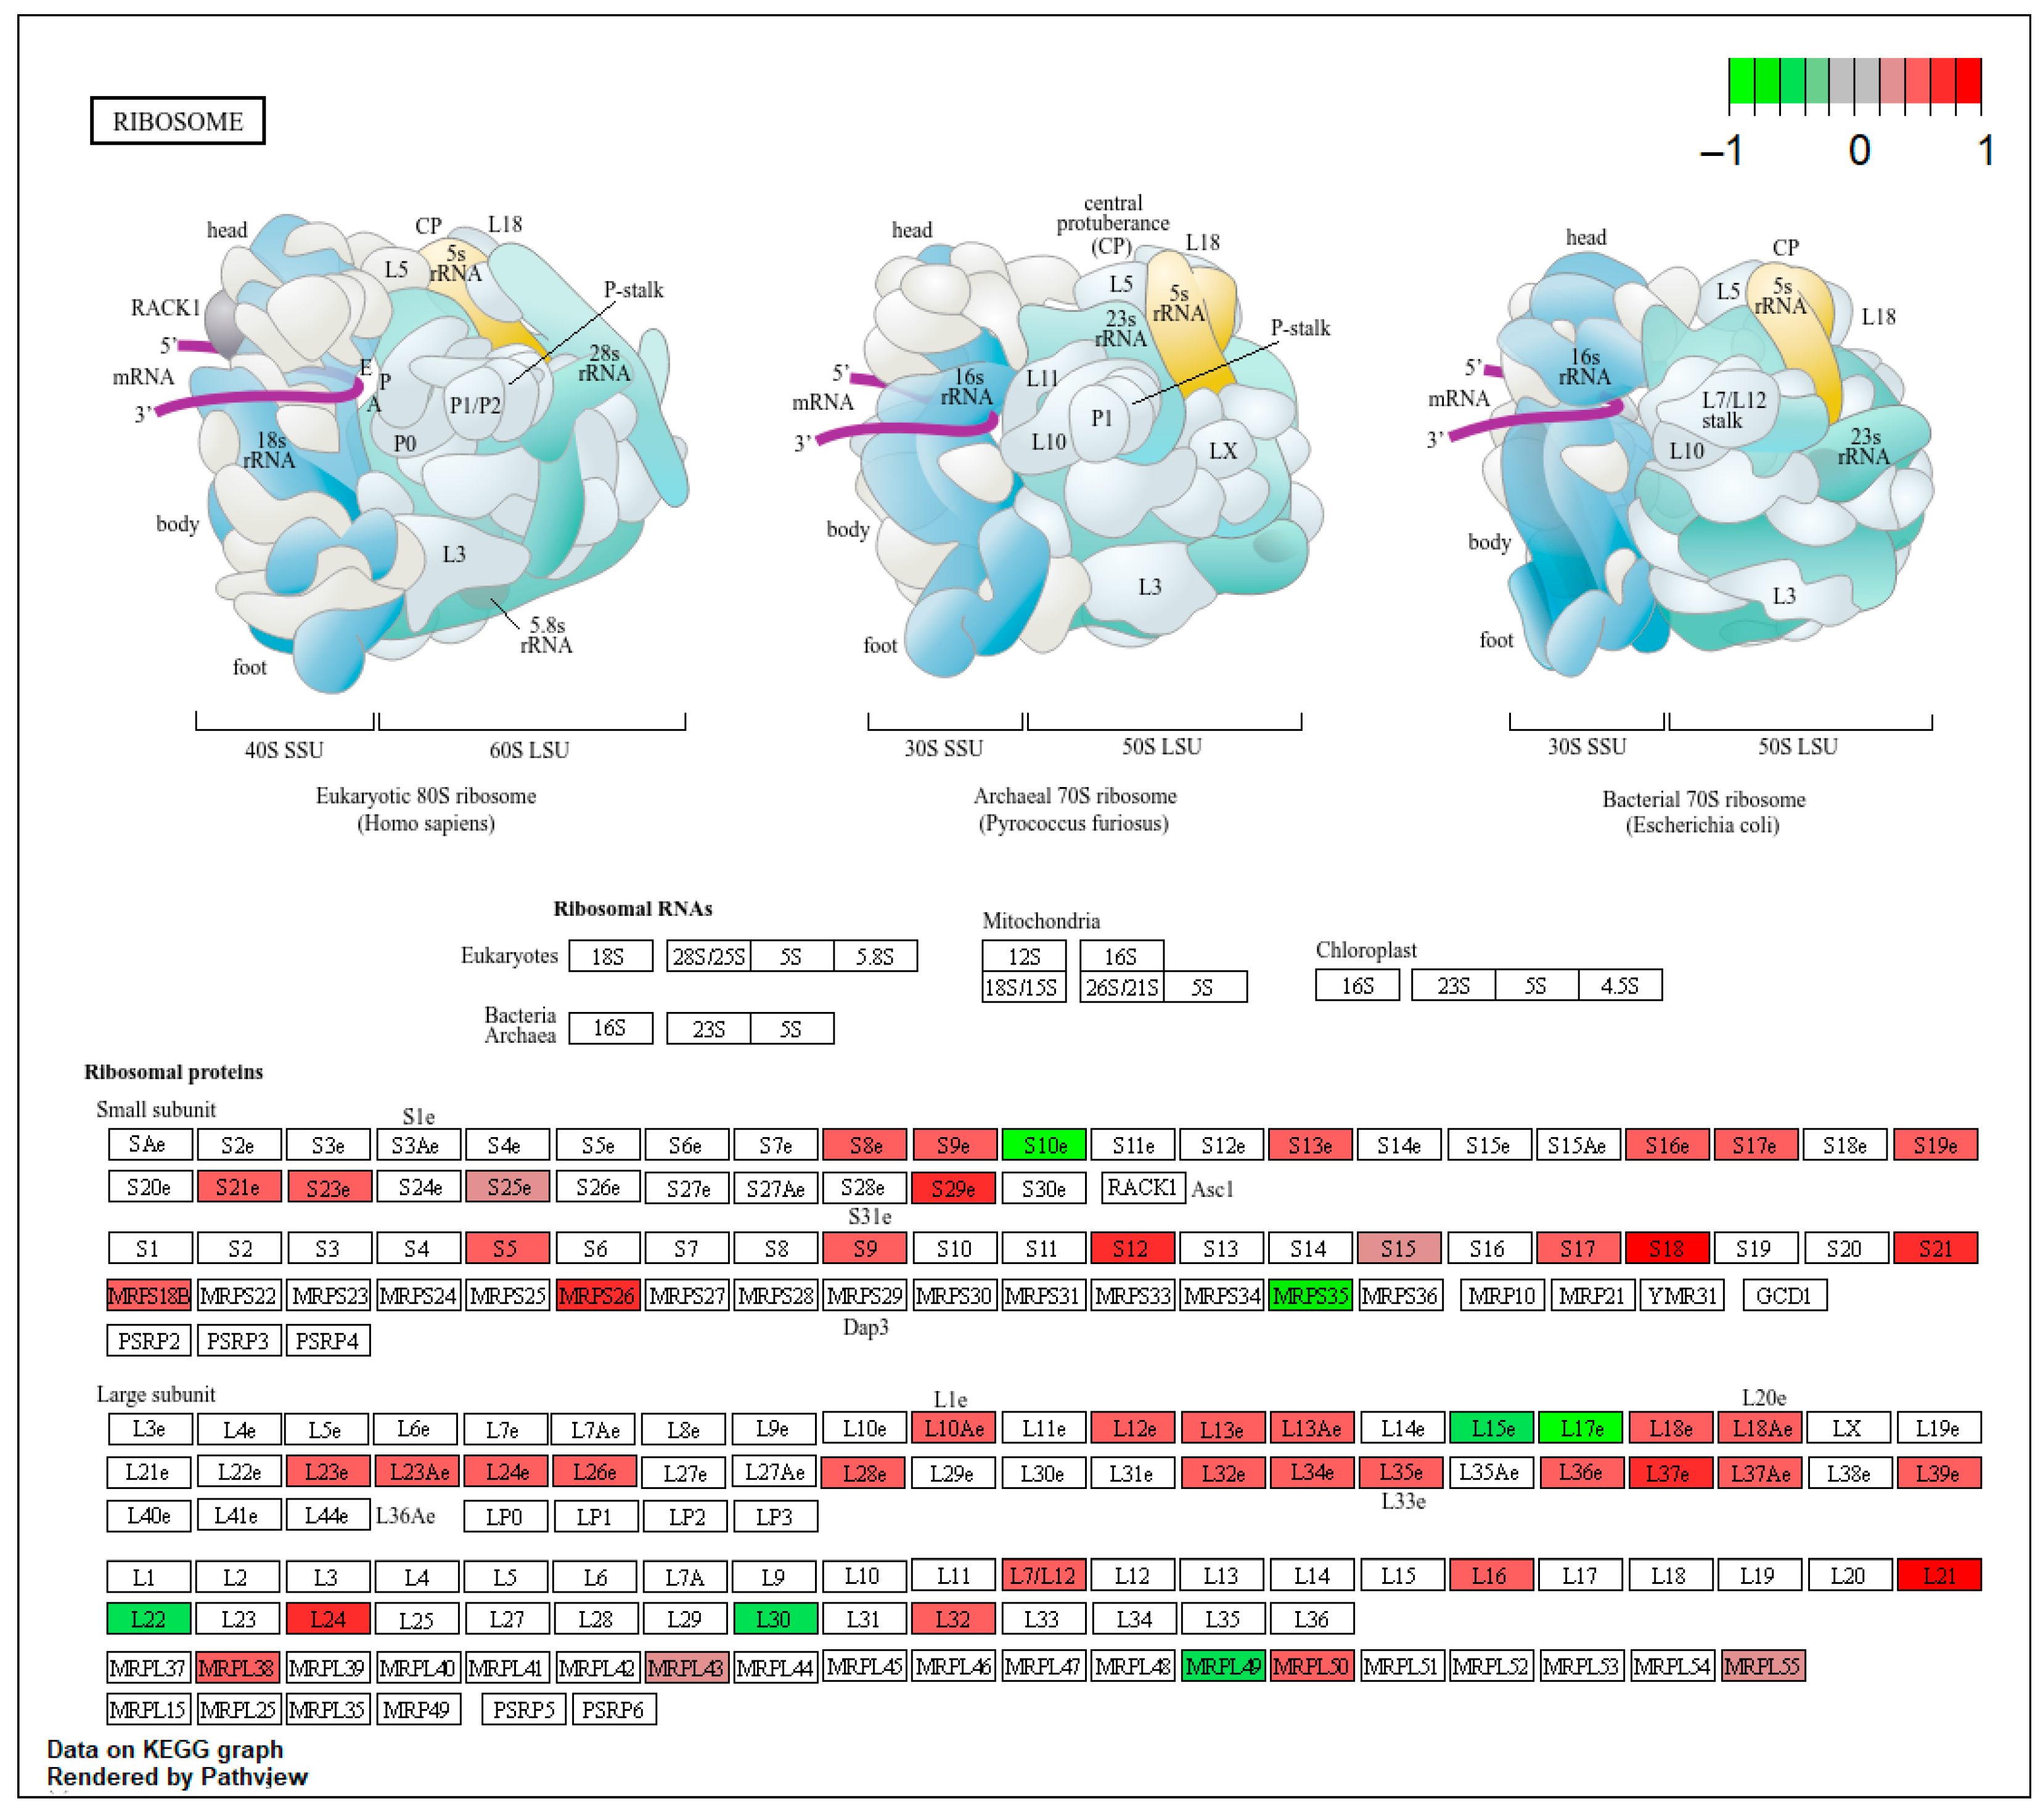
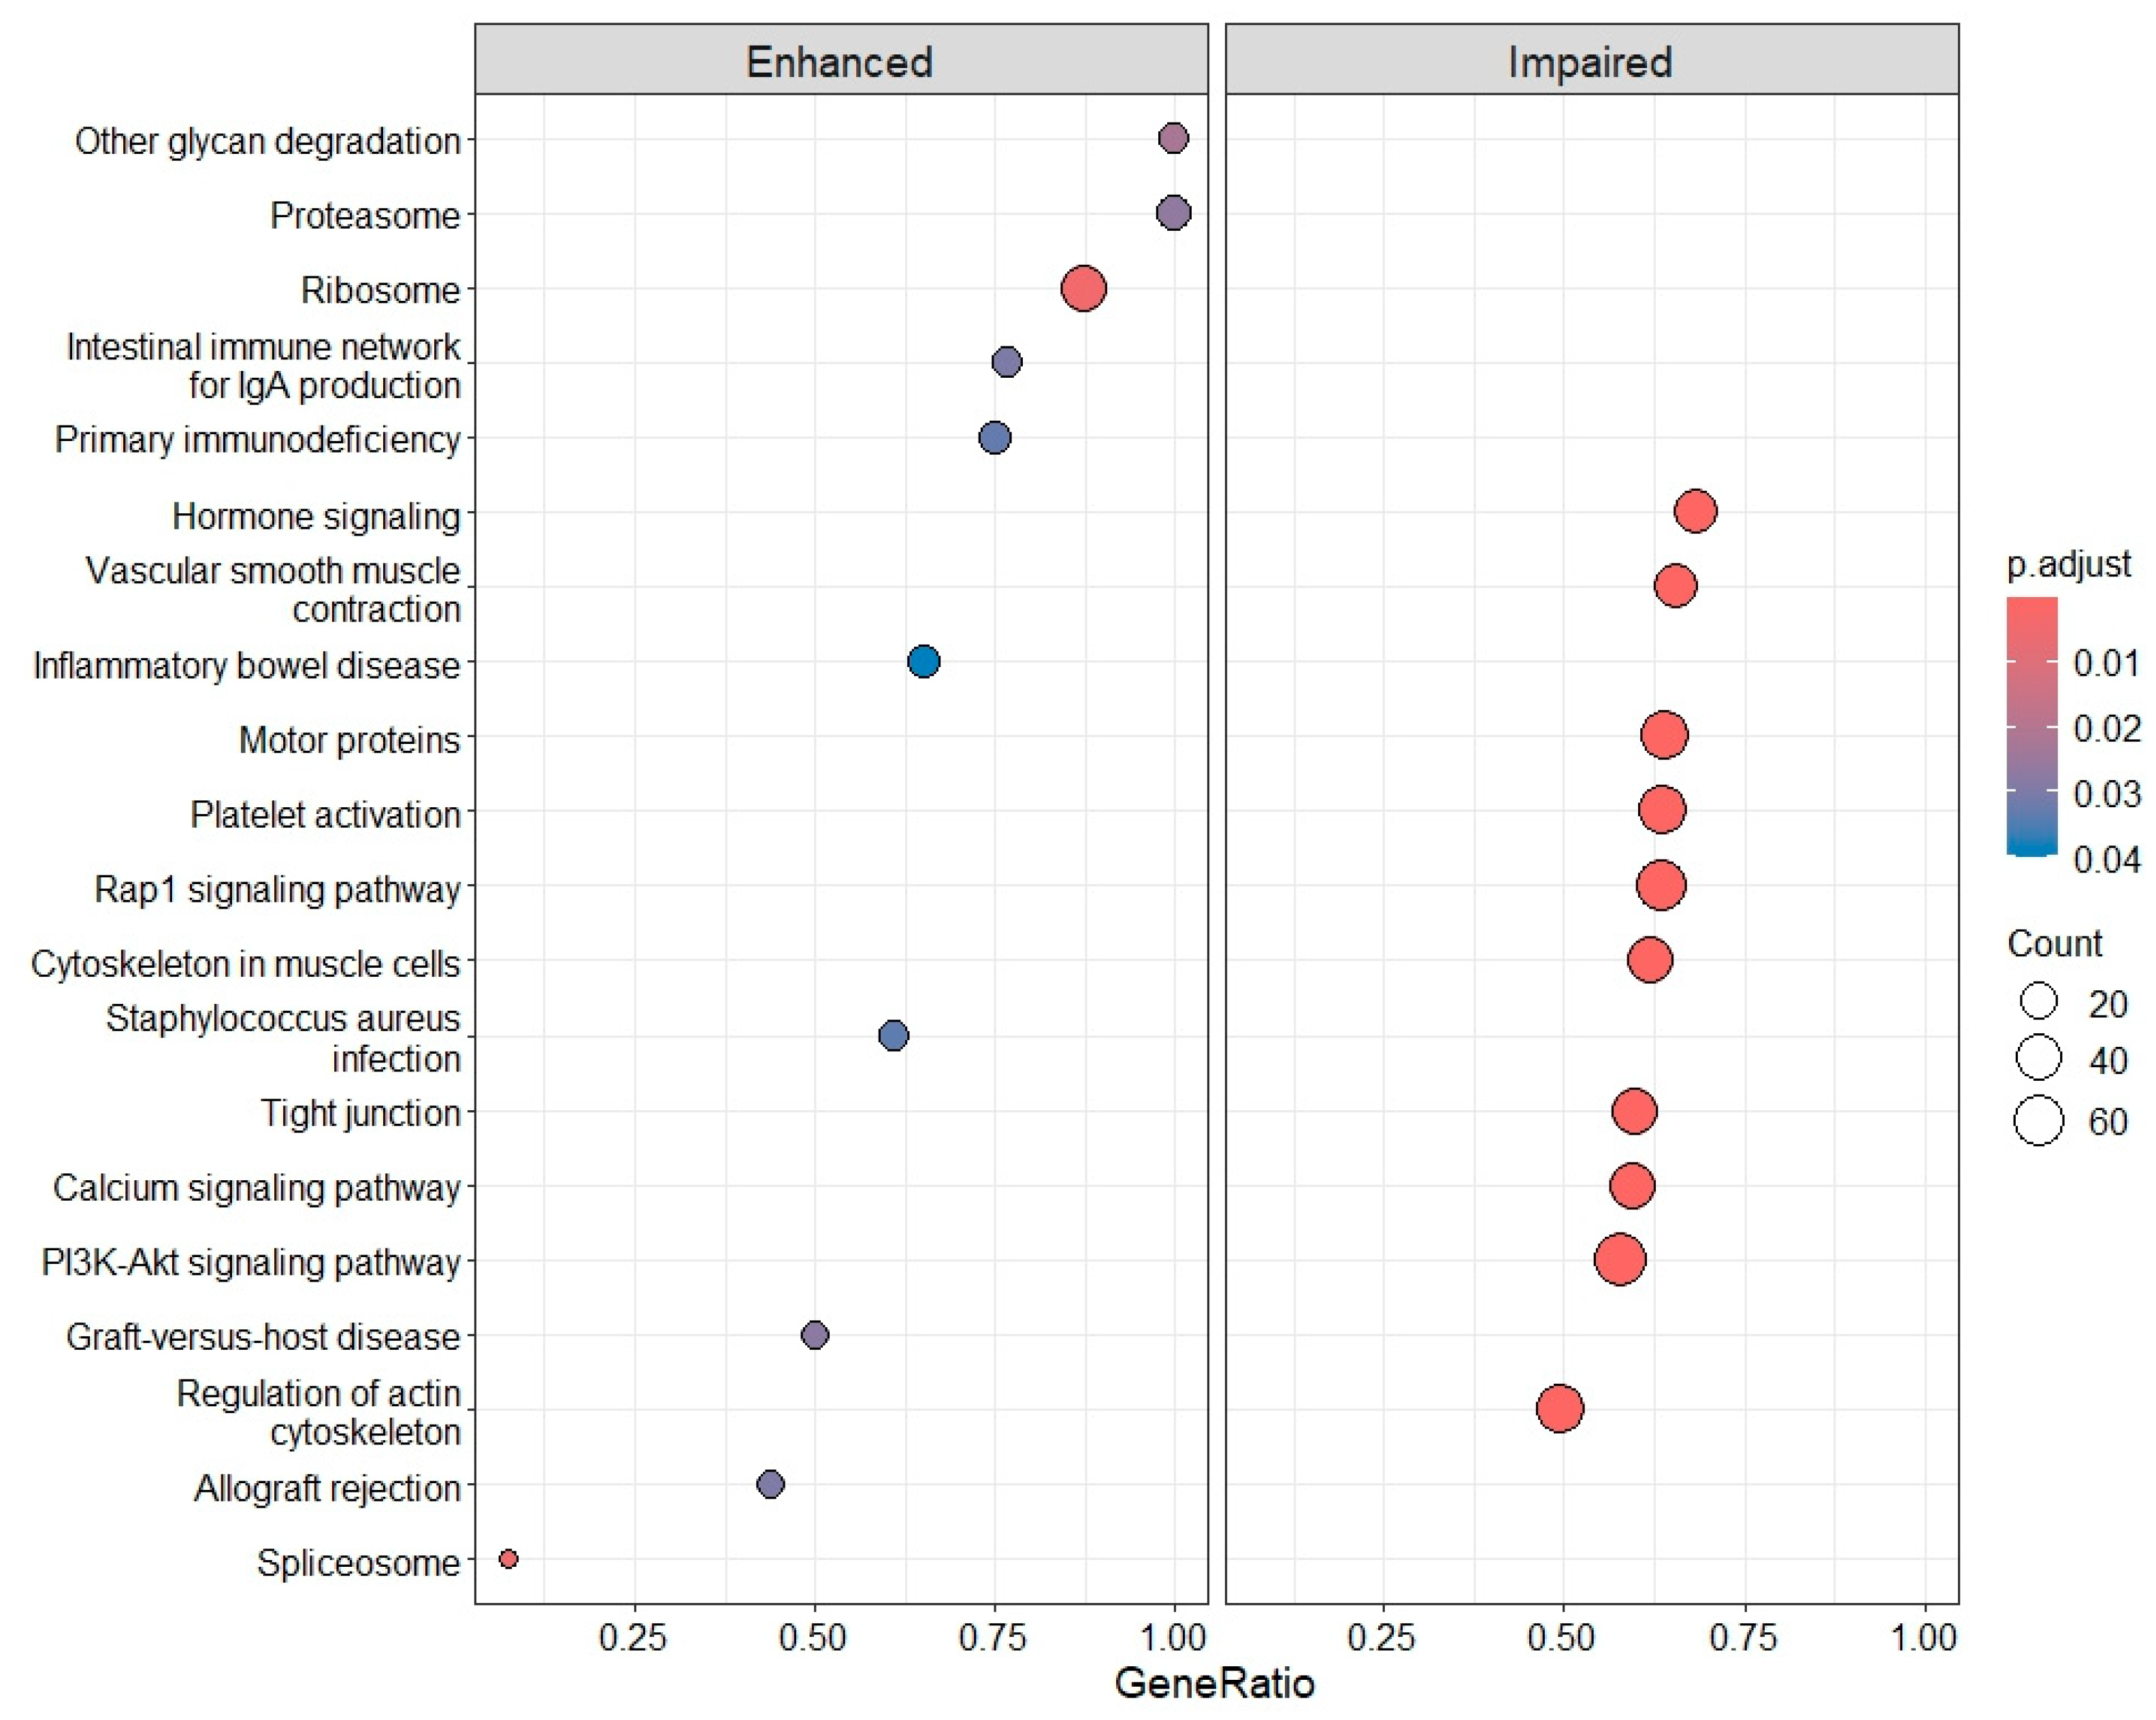
KEGG pathway analysis revealed an enhancement of pathways related to the ribosome, and the impairment of pathways related to PLT activation, including Ca2+- and Rap-signaling pathways and the regulation of the actin cytoskeleton, involving approximately 40 to 50 genes per process (Figure 10, and Appendix B.2, Appendix B.3 and Appendix B.4, respectively).
In PD patients, only 23 genes were deregulated (1 gene (GPC6) increased and 22 decreased) and enriched GOs were related to peroxidase and oxygen activity, and enhanced pathways related to ribosomes. Finally, in AD patients, only 12 genes were deregulated (7 increased and 5 decreased). Most of these genes were enriched for GO terms related to microtubule minus-end binding and enoyl-CoA hydratase activity.

3. Discussion

In this study, we analyzed the PLT transcriptome in synucleinopathies including DLB, PD and one of their prodromal forms, IRBD, as well as in AD, and compared these groups with CTRLs. An increasing number of studies have begun to address PLT physiology, including their transcriptome, as PLTs are growingly recognized as multifunctional cells that extend far beyond their traditional role in hemostasis. They actively participate in inflammation, immune regulation, angiogenesis, and vascular integrity [24,25]. In recent years, this multifunctionality has linked PLTs to a wide spectrum of systemic and neurological diseases, since they contain abundant α-synuclein, APP and β-amyloid, and share key molecular and signaling machinery with neurons [26]. These shared features suggest that PLT function may mirror or even influence neuronal processes underlying neurodegeneration [27]. Thus, we sought to characterize the composition of the PLT transcriptome comprising five major RNA classes. Additionally, we wanted to identify altered molecular pathways in PLTs that could reflect disease-specific mechanisms of α-synucleinopathies and potentially serve as peripheral indicators of early or ongoing neurodegenerative changes.

3.1. Comparison of PLT RNA-Seq Studies

When comparing our RNA-Seq data with the other four studies, our dataset showed the highest number of expressed genes, particularly relative to Studies 1 and 3. This difference likely reflects greater sequencing depth in our study, as more reads per sample increase the detection of low-abundance transcripts. Our libraries were sequenced to ~50 million reads per sample, whereas this information was not reported for Studies 1–4. Correspondingly, genes uniquely detected in our PD samples but absent in Study 1b were predominantly low-expression genes.
Read length, sequencing strategy, and library preparation may also contribute to the detection of more genes. We used 150 bp paired-end reads, which improve alignment accuracy in repetitive regions such as pseudogenes and gene families. In contrast, three of the other studies used 100 bp single-end reads (except Study 4, which used paired-end reads), likely leading to more ambiguous alignments and fewer detected genes.
Additionally, we used the Illumina Stranded Total RNA Prep with Ribo-Zero Plus kit, which includes rRNA depletion and enhanced detection of low-abundance transcripts. The SMARTer Ultra Low RNA Kit used in Studies 2–4 lacks this depletion step, thus rRNA dominates the library, reducing sensitivity for other RNA species. Although the kit for library preparation was not reported for Study 1, the use of fragmented mRNA during library preparation could also explain the lower number of expressed genes compared to the other studies.

3.2. The Composition of the PLT Transcriptome

Across all five groups, IRBD, DLB, PD, AD and CTRLs the overall distribution of RNA classes was comparable, with mRNAs accounting for 78–80% of transcripts, lncRNAs for 15–16%, pseudogenes for approximately 4%, and 1–2% classified as unknown transcripts. This composition indicates that, in PLTs, protein-coding transcripts dominate the RNA landscape, while lncRNAs constitute a smaller but potentially functionally relevant subset. Additionally, it reflects the limited transcriptional activity of these anucleate cells and their reliance on mRNAs and regulatory RNAs inherited from megakaryocytes.
Interestingly, we observed a lower proportion of lncRNAs in DLB compared with the other groups. This reduction may indicate disease-specific alterations in the regulatory RNA repertoire of PLTs, potentially reflecting broader dysregulation in RNA processing, stability, or megakaryocyte-derived transcript packaging in DLB. Although lncRNAs are less abundant in PLTs than in nucleated cells, previous studies have shown that they exert key regulatory roles in formation, activation, and intercellular communication [28,29]. Large-scale transcriptomic analyses across human tissues have reported that lncRNAs can outnumber protein-coding genes and display high tissue specificity, whereas in PLTs an inverse trend is observed, with approximately fivefold more protein-coding genes than lncRNAs [30,31]. The reduced lncRNA fraction in DLB, therefore, may represent a loss of specific regulatory RNAs or an altered balance between coding and non-coding components of the PLT transcriptome, potentially mirroring disease-related changes in cellular homeostasis and RNA metabolism. Further studies integrating lncRNA expression with functional PLT phenotypes and disease severity could help to clarify whether these transcriptomic shifts have diagnostic or mechanistic significance in DLB and related synucleinopathies.
Among all groups, IRBD exhibited the highest number of disease-specific lncRNAs, with half (10 of 20) located on the Y chromosome. This striking enrichment may reflect sex-linked transcriptional regulation, consistent with the strong male predominance of IRBD and related synucleinopathies [32]. The presence of Y-linked lncRNAs in PLTs could therefore indicate early, sex-specific molecular alterations associated with prodromal stages of α-synuclein-related neurodegeneration.

3.3. Deregulation of Gene Expression in PLTs

When analyzing DEGs across the four disease groups compared with CTRLs, DLB exhibited the highest number of DEGs (>6400), followed by IRBD (4690). In contrast, both PD and AD showed fewer than 25 DEGs each. This distribution reveals two distinct transcriptomic response patterns: (1) a high-extent deregulation in IRBD and DLB, and (2) a low-extent response in PD and AD. These findings suggest two underlying biological behaviors—first, a progressive molecular impairment and shared pathway dysregulation within the LBD spectrum (IRBD–DLB continuum); and second, greater group heterogeneity in PD and AD, making it difficult to define disease-specific molecular signatures.

3.3.1. IRBD and DLB: Progressive Molecular Impairment and Shared Pathway Dysregulation

The extensive transcriptomic remodeling observed in IRBD, which is even more pronounced in DLB, suggests that IRBD may capture a prodromal phase marked by active molecular adaptation (4690 DEGs), whereas DLB reflects progression toward sustained inflammatory and translational activation (>6400 DEGs), consistent with advanced synucleinopathy. In IRBD, DEGs were strongly enriched in upregulated RNA processing pathways, particularly spliceosome-mediated pre-mRNA splicing, suggesting increased post-transcriptional activity in PLTs. This may reflect an adaptive response or early dysregulation of RNA maturation processes. Notably, specific nuclear RNAs were reduced compared with CTRLs and AD, indicating a possible imbalance between spliceosome assembly and RNA substrate availability. Such alterations could mirror compensatory or stress-induced changes in RNA metabolism, consistent with early molecular disturbances preceding over neurodegeneration.
Aberrant RNA processing has been increasingly linked to synucleinopathies, where α-synuclein interacts with RNA-binding proteins such as TDP-43, FUS, and hnRNPs, disrupting splicing, RNA stability, and translation [33,34]. The activation of spliceosomal pathways and concurrent nuclear RNA reduction in IRBD PLTs may therefore represent systemic manifestations of these neuronal processes, highlighting altered RNA metabolism as an early hallmark of disease [35].
Additionally, pathway analysis in IRBD revealed the impairment of PLT activation affecting the actin cytoskeleton, junction proteins and alpha-granule release, indicating early functional alterations that may compromise PLT responsiveness. Strikingly, in DLB, PLT activation mechanisms showed an overall impairment extending from the first activation steps to mechanisms related to adhesion and aggregation. At the same time, key intracellular signaling routes, including Ca2+- and Rap-dependent pathways, were also downregulated, indicating impaired signal transduction essential for PLT activation and integrin-mediated responses [36,37]. Taken together, these data point to a progressive loss of PLT activation capacity from IRBD to DLB, suggesting that cytoskeletal and signaling dysfunction in PLTs may mirror comparable alterations in neuronal and synaptic physiology characteristic of advancing synucleinopathy. However, whether these changes mirror impaired synaptic function needs to be further studied.
This progressive impairment of PLT activation and cytoskeletal regulation observed from IRBD to DLB could be linked to the physiological and pathological roles of α-synuclein. Under normal conditions, α-synuclein participates in vesicle trafficking, membrane curvature sensing, and actin cytoskeleton dynamics—processes essential for both neurotransmitter release in neurons and granule secretion in PLTs [38,39,40]. But, additional research should be carried out to determine whether the reduced activation, adhesion, and aggregation capacity, as found in our transcriptomic study, are secondary to α-synuclein dysregulation or aggregation.
Additionally, in our study, platelets from DLB patients showed a marked upregulation of immune-related pathways, particularly those linked to adaptive and lymphocyte-mediated responses. Similarly to findings in inflammatory disorders such as COVID-19, sepsis, and systemic lupus erythematosus, this suggests that platelets actively modulate immune processes through cytokine release and interactions with lymphocytes and endothelial cells [41]. The presence of comparable immune activation signatures in DLB indicates that platelet–immune crosstalk may contribute to neurodegenerative mechanisms, potentially mediated by platelet-derived α-synuclein or inflammatory signaling. Overall, these results indicate that platelets could represent dynamic immunomodulatory cells connecting peripheral immune alterations with central pathology in LBD, a hypothesis that needs further corroboration.

3.3.2. PD and AD: Disease Heterogeneity

In our PLT RNA-Seq data, the striking contrast between a lack of transcriptional signal in PD and AD versus the large signal in IRBD and DLB highlights the heterogeneity within neurodegenerative diseases and underscores the potential for masked subtype-specific signatures. Particularly, this limited transcriptional response in PD may reflect the substantial biological heterogeneity of the disease. As shown by the recently proposed SynNeurGe framework, PD encompasses multiple interacting dimensions—α-synuclein pathology (S), neurodegeneration (N), and genetic predisposition (G)—which combine to produce diverse clinical phenotypes (C) [42]. This multidimensional model underscores that individuals clinically diagnosed with PD may represent distinct molecular subtypes with variable synuclein burden, neurodegenerative progression, and genetic background. Consequently, pooled transcriptomic analyses may obscure subtype-specific signatures, masking expression changes that are more evident in biologically homogeneous groups such as IRBD or DLB.
Comparable heterogeneity has been demonstrated in AD. In a recent large-scale study, five molecular AD subtypes based on CSF proteomic profiles have been identified. These were defined, respectively, by hyperplasticity, innate immune activation, RNA dysregulation, choroid plexus dysfunction, and blood–brain barrier impairment [43]. These subtypes differ in genetic risk factors, cortical atrophy patterns, and clinical trajectories. Similarly, a meta-analysis integrating neuropathological and neuroimaging data delineated four biological subtypes—typical, limbic-predominant, hippocampal-sparing, and minimal atrophy AD—each with distinct regional tau distribution, demographic associations, and disease progression patterns [44]. All together, these findings reinforce that both PD and AD encompass multiple mechanistic trajectories rather than a single linear disease continuum.
Within this framework, the absence of major transcriptomic deregulation in AD PLTs may indicate that PLTs do not capture all biological pathways involved across AD subtypes. Given our limited sample size, subtype-specific alterations may have been masked in the current analysis. Correspondingly, it could be expected that PLTs of patients with the AD subtype characterized by blood–brain barrier impairment would indeed show important transcriptomic changes [45,46].

3.4. Future Biomarker Development

Our findings—demonstrating altered gene expression profiles in platelets, an easily accessible biofluid—in DLB and IRBD provide strong evidence for their potential translation into clinically useful biomarkers. To advance this translational pathway, we are currently finalizing differential expression analyses among disease groups, including both synucleinopathies (DLB and PD), IRBD, and DLB versus AD, to delineate pathology-specific transcriptional signatures. Building on the RNA-seq data, which revealed extensive dysregulation in pathways such as the spliceosome, ribosome, platelet activation, and immune response, we are now focusing on defining a core, clinically actionable gene signature. This will involve prioritizing top-ranking DEGs with the highest effect sizes and lowest variability, particularly those belonging to the most discriminative pathways, followed by orthogonal validation using qPCR to ensure robustness and technical reproducibility.
To ensure clinical reliability and generalizability, we plan to validate this core signature in an independent, large, and clinically well-characterized cohort. The validated qPCR data will then be used to develop predictive models—such as logistic regression or machine learning approaches—optimized for diagnostic and prognostic applications. Specifically, these models aim to distinguish DLB from AD and to predict phenoconversion in IRBD patients who progress to DLB or PD. Translating the platelet RNA signature into a routine clinical assay will also require addressing key optimization procedures and establishment of clinically relevant cut-off values based on model sensitivity and specificity. Together, these efforts are expected to facilitate the development of a robust and clinically implementable diagnostic and prognostic assay for synucleinopathies.

4. Materials and Methods

4.1. Source of PLT Samples

In total, 64 individuals were prospectively recruited at the Neurodegenerative Disease Unit of the Neurology Department from the Hospital Universitari Germans Trias i Pujol (HUGTP; Badalona, Barcelona, Spain) and Sleep Unit of the Neurology department from the Hospital Clinic de Barcelona (Barcelona, Spain). The cohort included individuals divided into five groups. The four patient groups were: 12 DLB patients who fulfilled criteria for probable DLB [3], 12 PD patients diagnosed according to the UK PD Society Brain Bank criteria [47], 12 IRBD patients who fulfilled diagnostic criteria in subjects reporting nightmares and dream-enacting behaviors in whom nocturnal video-polysomnography showed increased electromyographic activity in REM sleep [48], and 14 AD patients fulfilling criteria for probable AD (National Institute on Aging–Alzheimer’s Association criteria) [49]. Group five was composed of 14 cognitively unaffected controls (CTRLs), mainly non-blood relatives of the patients without a family history of neurological disorders, suggestive symptoms of IRBD or any symptoms or signs indicating parkinsonism or cognitive impairment.
The study was approved by the HUGTP Ethical Committee for Clinical Investigation (PI-22-024). All participants or their legal guardians signed written informed consent according to the Declaration of Helsinki [50].

4.2. PLT Obtaining and RNA Purification

Na-citrate Vacutainer tubes (BD, Plymouth, UK) were used to collect blood samples. They were processed by two consecutive centrifugation steps within the first four hours after blood extraction to avoid expression changes due to PLT activation. First centrifugation was performed at 200× g for 15 min to obtain PLT-rich plasma, and the following centrifugation was carried out at 2500× g for 15 min to obtain PLT-rich pellets (PRP). PRP was stored at −80 °C until RNA purification and thawed on ice before processing. Total RNA isolation was performed using the mirVanaTM miRNA Isolation Kit (ThermoFisher, Waltham, MA, USA), and isolated RNA samples were stored at −80 °C until expression analysis.

4.3. Total RNA Discovery by Next-Generation Sequencing (NGS)

The concentration of total RNA samples was measured by Qubit and 15 ng from each sample were adjusted to a final volume of 6.5 µL. Samples were pooled in pairs. Pooling was done for samples with similar concentrations, to assure similar RNA proportions and avoid confounding enrichment. Quality control and size distribution of the pools was assessed with the 4200 TapeStation System (Agilent Technologies, Santa Clara, CA, USA) using High Sensitivity RNA ScreenTape (Agilent, Santa Clara, CA, USA). Of the pooled sample pairs, only 5 had RIN values between 5.5 and 6.5; the rest of them presented RIN values higher than 6.5.
From each pool, 11 µL was used for library preparation by Illumina Stranded Total RNA Prep, Ligation with Ribo-Zero Plus for Illumina (Illumina, San Diego, CA, USA) following the manufacturer’s instructions. Amplification cycles were adjusted according to the estimated RNA concentration. Individual libraries were subjected to quality analysis and quantification using a D1000 ScreenTape (Agilent Technologies, Santa Clara, CA, USA). If the library profile was not acceptable, a repurification step was performed. All libraries were adjusted to 8 nM in a final volume of 5 µL and were all pooled together. The library pool was finally assessed by High Sensitivity D1000 ScreenTape (Agilent Technologies, Santa Clara, CA, USA).
Clustering and sequencing were performed in an Illumina Sequencer (NovaSeq6000, Illumina, San Diego, CA, USA). Samples were sequenced to ~50 million (M) 2 × 150 bp paired-end. Sample quality was checked using FastQC and MultiQC tools (version 0.12.0 and 1.14, respectively) [51,52]. The obtained FastQ raw data was analyzed as follows: (1) the TrimGalore tool (version 0.6.10) was used to remove the adapter sequences from the reads and the base pairs with a Phred score under 20 [53]; (2) paired RNAseq reads were aligned to the Gencode GRCh38.p109 human reference genome using STAR (version 2.7.10b) [54]; (3) the Salmon tool (version 1.4.0) was used for quantifying the expression of each transcript [55]; (4) the matrix count was generated with tximport (version 1.30.0) [56]; (5) the total count of reads was normalized using the median of ratios method from DESeq2 package (version 1.45.1) [57]. Steps 1 to 3 were performed from the Ubuntu terminal (Linux), while steps 4, 5, and the following analysis were conducted using R software (version 4.3.2).

4.4. Sequencing Data Analysis

For NGS expression analysis, transcripts with a minimum of 10 reads per sample were considered expressed. Gene biotype classification (mRNA, pseudogene, lncRNA, scaRNA, snRNA, snoRNA, rRNA, and mitochondrial RNA) of the genes that were expressed in the different groups (AD, IRBD, DLB, PD, and CTRLs) was obtained using the getBM function from the biomaRt package (version 2.58.2).
Differential expression analysis (DEA) was performed using the Wald test, and p-values were corrected by the Benjamini–Hochberg method with DESeq2, establishing significance as an adjusted p-value lower than 0.05. A post hoc power sensitivity analysis was performed assuming a Fold-Change of 2 and using the RNASeqPower package (version 1.42.0).

4.5. Comparison of RNA Expression Between RNA-Seq Studies

RNA-seq data from four different studies analyzing the whole PLT transcriptome was retrieved from the NCBI Gene Expression Omnibus (GEO) and NCBI Sequence Read Archive (SRA) databases: PRJNA732990, PRJNA732803, GSE183635, PRJNA668820 and PRJNA737596, (defined in results as studies 1a, 1b, 2, 3 and 4, respectively). For the GSE183635 study, raw data counts were obtained directly from its repository. For PRJNA732990, PRJNA732803, PRJNA668820 and PRJNA737596 studies, FastQ files were acquired. As these studies used paired-end sequencing, FastQ files of all samples were processed similarly to those in our study, using the Salmon tool for quantifying the expression of each transcript and the tximport function for generating the matrix count. Only the expression of control individuals from each study was considered in the comparative analysis, except for Study 1 where PD samples were also obtained. In all samples, only transcripts with at least 10 reads were kept. A Venn diagram (VennDiagram package, version 1.7.3) was obtained to visualize the expression of overlapping genes among studies.

4.6. LncRNA and Minor RNA Distribution Analysis

The distribution of RNA biotypes and four groups of minor RNAs (scaRNAs, snoRNAs, snRNAs and mtRNAs) was analyzed by comparing all five groups. Pairwise comparison between groups was carried out using chi-square and Fisher’s exact test. The results were corrected for multiple testing by the Bonferroni method. Significance was set at 0.05.

4.7. Gene Ontology (GO) Enrichment and KEGG Pathway Analysis

Gene Set Enrichment Analysis (GSEA) of transcripts differentially expressed between the four diseases (IRBD, AD, DLB and PD) and CTRLs was performed using the enrichGO and gseDO function from clusterProfiler (verison 4.10.1) and DOSE packages (version 3.28.2), respectively; and KEGG pathway analysis using gseKEGG function from DOSE package. Dotplot function from DOSE package was used to generate dotplots. A p-value below 0.05 was considered a significant enrichment.
GO enrichment was also analyzed for the genes specifically expressed in CTRL individuals from each of the five different RNAseq studies and in PD patients from Study 1b and our study.

5. Conclusions

In summary, our study provides the first comprehensive comparison of PLT transcriptomes across major neurodegenerative disorders, revealing disease- and stage-specific molecular alterations. PLTs from IRBD and DLB patients displayed extensive transcriptomic remodeling, encompassing dysregulation of RNA processing, cytoskeletal organization, and activation pathways. These findings suggest that systemic RNA metabolism and PLT signaling mechanisms may mirror early and progressive stages of α-synucleinopathy. In contrast, the limited number of DEGs in PD supports the growing view that PD represents a highly heterogeneous disorder, in which diverse molecular subtypes may obscure shared transcriptomic signatures at the group level.
The absence of significant deregulation in AD PLTs further underscores that not all central pathological processes are reflected peripherally, particularly given the molecular heterogeneity of AD subtypes. Nonetheless, our results highlight the potential of PLT transcriptomics to reveal peripheral molecular correlates of neurodegeneration and identify early systemic changes in prodromal synucleinopathies such as IRBD. Future studies integrating multi-omic PLT profiling with clinical, imaging, and genetic data will be essential to validate these findings and to determine whether specific PLT transcriptomic signatures could serve as accessible biomarkers of disease onset, subtype, or progression across neurodegenerative disorders.

Author Contributions

Conceptualization, K.B., P.P.; methodology, L.A., J.M., D.A. (David Adamuz); formal analysis, L.A.; resources, K.B., P.P.; writing—original draft preparation, L.A., K.B.; recruitment of participants, A.M., M.S., D.S., C.G., L.I., D.V., A.I.; writing—review and editing, K.B., D.A. (Dag Aarsland), P.P.; project administration, K.B.; funding acquisition, K.B., P.P. All authors have read and agreed to the published version of the manuscript.

Funding

This research was funded by Spain’s Ministry of Science and Innovation, grant number PI21/00833, PI21/00886, PMP22/00100 and PI24/00214, integrated in the National R + D + I and funded by the ISCIII and the European Regional Development Fund.

Institutional Review Board Statement

The study was conducted in accordance with the Declaration of Helsinki, and approved by the Institutional Ethics Committee of Clinical Investigation of the University Hospital Germans Trias i Pujol (Date 25 February 2022/No PI-22-024).

Informed Consent Statement

Informed consent, authorized by the Ethics Committee of the University Hospital Germans Trias i Pujol, was obtained from all subjects involved in the study.

Data Availability Statement

The data supporting the findings of this study will be deposited in a public repository upon completion of the full analysis of differences between disease groups. The datasets analyzed during the current study are available from the corresponding author on reasonable request.

Acknowledgments

The authors express their gratitude to the volunteers for their cooperation and contributions. Laura Arnaldo is a PhD student attached to the Biochemistry, Molecular Biology and Biomedicine PhD Program at the Universitat Autònoma de Barcelona (UAB).

Conflicts of Interest

The authors declare no conflicts of interest. The funders had no role in the design of the study; in the collection, analyses, or interpretation of data; in the writing of the manuscript, or in the decision to publish the results.

Abbreviations

The following abbreviations are used in this manuscript:
ADAlzheimer’s disease
APPamyloid precursor protein
β-amyloid
CSFcerebrospinal fluid
CTRLscognitively unaffected controls
DATdopamine transporter
DEAdifferential expression analysis
DEGsdifferentially expressed genes
DLBDementia with Lewy bodies
GDSGlobal Deterioration Scale
GSEAGene Set Enrichment Analysis
GEOGene Expression Omnibus
GOGene Ontology
IRBDidiopathic REM sleep behavior disorder
KEGGKyoto Encyclopedia of Genes and Genomes
LBDLewy body disorders
lncRNAslong non-coding RNAs
MMSEMini-Mental State Examination
mtRNAsmitochondrial RNAs
NGSNext-Generation Sequencing
PDParkinson’s disease
PLTPlatelets
scaRNAssmall Cajal body-specific RNAs
snoRNAssmall nucleolar RNAs
snRNASsmall nuclear RNAs
SRASequence Read Archive
UPDRS-IIIUnified Parkinson’s Disease Rating Scale Part III

Appendix A

Appendix A.1

Table A1. LncRNAs specifically identified in DLB, AD, IRBD, PD and CTRLs.
nEnsembl Gene IDExternal Gene NameChromosomeStart
Position
End
Position
Strand
DLB1ENSG00000237188 chr11471727011472957341
2ENSG00000289019 chr47085361370903213–1
3ENSG00000226281 chr666927376801186–1
4ENSG00000287584 chr73962125339623201–1
5ENSG00000272293 chr8450714451343–1
6ENSG00000284116 chr93993161440106680–1
7ENSG00000290769 chr91330799001330873551
8ENSG00000228886 chr1345350323453513501
9ENSG00000258803 chr1456514331565513091
10ENSG00000231439WASIR2chr1622845251911
11ENSG00000272884 chr17743950674459661
12ENSG00000280800 chr2182103848211306–1
13ENSG00000284391 chrX7042734670435378–1
AD1ENSG00000289474 chr2148881726148881841–1
2ENSG00000242516LINC00960chr375672232757420891
3ENSG00000290602 chr71438103731438186991
4ENSG00000289031 chr993566714935680751
5ENSG00000288542 chr134046995540611127–1
6ENSG00000288855 chr145073630050737517–1
7ENSG00000259692LINC01418chr158161082882013579–1
8ENSG00000290383 chr161839497218401925–1
9ENSG00000185168LINC00482chr178130377181311237–1
10ENSG00000288235FAM106Cchr1716788879167905011
11ENSG00000289172 chr2045179818451914911
12ENSG00000281181 chr2184376298438551–1
CTRLs1ENSG00000254154CRYZL2P-SEC16Bchr1177928788178038007–1
2ENSG00000273382TMEM167B-DTchr1109087971109090858–1
3ENSG00000274769 chr261115787611648251
4ENSG00000290614PRSS40Achr21305708291305841611
5ENSG00000289929 chr31956350621956522951
6ENSG00000288473 chr630908242309264591
7ENSG00000290972 chr964369394644126911
8ENSG00000289381 chr133179636831814730–1
9ENSG00000289049 chr14101760727101761485–1
10ENSG00000291023 chr153240617832434992–1
11ENSG00000248101 chr193600863836014235–1
12ENSG00000268744 chr191237918912401274–1
13ENSG00000289298 chr194153021641531859–1
14ENSG00000288861 chr222275721722759496–1
IRBD1ENSG00000289062 chr1152897765152913138–1
2ENSG00000289367 chr12479371422479378641
3ENSG00000291157 chr14130291141306148–1
4ENSG00000228363CHMP3-AS1chr286562070866187661
5ENSG00000235070 chr2226086623226185651–1
6ENSG00000226519LINC00390chr134409482244161490–1
7ENSG00000258694LINC02319chr145210163152129852–1
8ENSG00000290387SORD2Pchr154482574444884694–1
9ENSG00000290674 chr162190155221953031–1
10ENSG00000261033SPECC1-DTchr172000805120009234–1
11ENSG00000176728TTTY14chrY1877270619077555–1
12ENSG00000212856TTTY2BchrY64060596462091–1
13ENSG00000229308 chrY403633541006191
14ENSG00000231535LINC00278chrY300288732005091
15ENSG00000260197 chrY1969194119694606–1
16ENSG00000288049 chrY19744756197599781
17ENSG00000289707 chrY21138633212578321
18ENSG00000290853 chrY13703902139162441
19ENSG00000291031BCORP1chrY1945543119567280–1
20ENSG00000291033TXLNGYchrY19567313196062741
PD1ENSG00000225964NRIRchr268194636840464–1
2ENSG00000189229 chr3649046067367501
3ENSG00000251230MIR3945HGchr4184843296184855751–1
4ENSG00000286274 chr51291506771293941141
5ENSG00000285492 chr6159051674159121510–1
6ENSG00000173862 chr733725820337292171
7ENSG00000289725 chr964411638644692601
8ENSG00000290717ZNF658Bchr93944358939552802–1
9ENSG00000286715 chr1075592644756281201
10ENSG00000290690 chr158439831684422500–1
11ENSG00000260280SLX1B-SULT1A4chr1629455105294649631
12ENSG00000290692 chr163020431630209071–1
13ENSG00000286288 chr2016940821896406–1
14ENSG00000291052ABCC13chr2114236206143380171

Appendix A.2

Table A2. Distribution of minor RNAs in the five groups included in the study.
nscaRNAsnoRNAsnRNArRNAmtRNA
DLB5510 (18%)25 (45%)11 (20%)2 (4%)7 (13%)
IRBD368 (22%)13 (36%)7 (19%)2 (6%)6 (17%)
PD589 (16%)27 (46%)18 (31%)2 (4%)2 (3%)
AD7512 (16%)37 (49%)20 (27%)2 (3%)4 (5%)
CTRLs6511 (17%)30 (46%)20 (31%)2 (3%)2 (3%)

Appendix A.3

Table A3. List of minor RNAs found in PLTs in DLB, IRBD, PD, AD and CTRLs.
DLBIRBDPDADCTRLs
mtRNAn76242
1MT-TL1MT-TL1
2MT-TVMT-TV MT-TV
3MT-RNR2MT-RNR2MT-RNR2MT-RNR2MT-RNR2
4MT-TMMT-TM
5MT-TH MT-TH
6MT-TEMT-TE
7MT-RNR1MT-RNR1MT-RNR1MT-RNR1MT-RNR1
Ribozymen22222
1RMRPRMRPRMRPRMRPRMRP
2RPPH1RPPH1RPPH1RPPH1RPPH1
scaRNAn10891211
1SCARNA7SCARNA7SCARNA7SCARNA7SCARNA7
2 SCARNA8
3SCARNA6SCARNA6SCARNA6SCARNA6SCARNA6
4SCARNA5SCARNA5SCARNA5SCARNA5SCARNA5
5SCARNA10SCARNA10SCARNA10SCARNA10SCARNA10
6SCARNA12SCARNA12SCARNA12SCARNA12SCARNA12
7SCARNA13SCARNA13SCARNA13SCARNA13SCARNA13
8 SCARNA21SCARNA21SCARNA21
9 SCARNA3
10SCARNA1 SCARNA1SCARNA1
11SCARNA16SCARNA16SCARNA16SCARNA16SCARNA16
12SCARNA2SCARNA2SCARNA2SCARNA2SCARNA2
13SCARNA4 SCARNA4
snoRNAn2513273730
1 SNORA10
2 SNORA11SNORA11
3SNORA12 SNORA12SNORA12SNORA12
4SNORA20 SNORA20
5 SNORA23SNORA23
6SNORA2C SNORA2CSNORA2CSNORA2C
7 SNORA33
8 SNORA37SNORA37SNORA37
9 SNORA38B
10 SNORA48SNORA48
11SNORA53SNORA53SNORA53SNORA53SNORA53
12SNORA54 SNORA54SNORA54SNORA54
13 SNORA57
14 SNORA59BSNORA59BSNORA59BSNORA59B
15SNORA5C SNORA5C
16 SNORA62
17SNORA63SNORA63SNORA63SNORA63SNORA63
18 SNORA66
19SNORA73ASNORA73ASNORA73ASNORA73ASNORA73A
20SNORA73BSNORA73BSNORA73BSNORA73BSNORA73B
21SNORA74A SNORA74ASNORA74ASNORA74A
22SNORA74B SNORA74BSNORA74BSNORA74B
23SNORA79B
24 SNORA7ASNORA7A
25SNORA7B SNORA7BSNORA7BSNORA7B
26 SNORA8SNORA8
27SNORA81SNORA81SNORA81SNORA81SNORA81
28SNORD10 SNORD10SNORD10SNORD10
29SNORD13 SNORD13SNORD13SNORD13
30SNORD15BSNORD15BSNORD15BSNORD15BSNORD15B
31SNORD17SNORD17SNORD17SNORD17SNORD17
32SNORD22 SNORD22SNORD22
33 SNORD33
34SNORD3ASNORD3ASNORD3ASNORD3ASNORD3A
35SNORD3B-1SNORD3B-1SNORD3B-1SNORD3B-1SNORD3B-1
36 SNORD3B-2SNORD3B-2SNORD3B-2SNORD3B-2
37SNORD3C SNORD3CSNORD3CSNORD3C
38SNORD89SNORD89SNORD89SNORD89SNORD89
39SNORD94 SNORD94 SNORD94
40SNORD97 SNORD97SNORD97SNORD97
41 U3 U3U3
snRNA n117182020
1RNU5A-1RNU5A-1RNU5A-1RNU5A-1RNU5A-1
2RNU5B-1 RNU5B-1RNU5B-1
3RNU4-1RNU4-1RNU4-1RNU4-1RNU4-1
4RNU4-2RNU4-2RNU4-2RNU4-2RNU4-2
5 RNVU1-7
6 RNU1-28PRNU1-28PRNU1-28P
7 RNU1-27PRNU1-27PRNU1-27P
8 RNU1-1RNU1-1RNU1-1RNU1-1
9 RNVU1-18RNVU1-18RNVU1-18
10 RNU1-2RNU1-2RNU1-2
11 RNU1-4RNU1-4RNU1-4
12 RNVU1-14
13 RNU1-3RNU1-3RNU1-3
14 RNU6ATAC
15 RNU2-2PRNU2-2PRNU2-2PRNU2-2P
16RNU6ATAC
17 RNVU1-2RNVU1-2
18RNU2-2P
19RNVU1-31 RNVU1-31RNVU1-31RNVU1-31
20 RNVU1-29RNVU1-29RNVU1-29
21RNVU1-27RNVU1-27RNVU1-27RNVU1-27RNVU1-27
22RNU12 RNU12RNU12RNU12
23RNVU1-28 RNVU1-28RNVU1-28RNVU1-28
24RN7SKRN7SKRN7SKRN7SKRN7SK

Appendix B

Appendix B.1

Figure A1. Spliceosome components with highlighted DEGs comparing IRBD vs. CTRLs, where all snRNAs (except U6) involved in the spliceosome pathway showed an increased expression in IRBD and thus, an enhancement of the pathway is expected. Decreased genes are marked in green and increased genes in red.
Ijms 26 11169 g0a1

Appendix B.2

Figure A2. Platelet activation pathway (including calcium and Rap1 signaling pathways) with highlighted DEGs comparing (A) IRBD vs. CTRLs where an elevated number of DEGs was downregulated, and (B) DLB vs. CTRLs, where most of DEGs involved in this pathway were decreased in DLB. This massive downregulation of functional genes strongly suggests a major impairment of platelet activation, especially in DLB. Decreased genes are marked in green and increased genes in red. Solid arrows represent direct interactions between proteins; dashed arrows represent indirect or non-specified interactions between proteins.
Ijms 26 11169 g0a2

Appendix B.3

Figure A3. Regulation of actin cytoskeleton pathway with highlighted DEG comparing (A) IRBD vs. CTRLs with an elevated number of downregulated DEGs, and (B) DLB vs. CTRLs, where most of the genes involved in this pathway showed a decreased expression, suggesting a major impairment of actin cytoskeleton regulation starting in IRBD and being even more pronounced in DLB. Decreased genes are marked in green and increased genes in red. Solid arrows represent direct interactions between proteins; dashed arrows represent indirect or non-specified interactions between proteins.
Ijms 26 11169 g0a3

Appendix B.4

Figure A4. Ribosome components with highlighted DEGs comparing DLB vs. CTRLs, where most of the genes involved in the formation of ribosome showed an increased expression in the pathology group and where an enhancement of the pathway is expected. Decreased genes are marked in green and increased genes in red. In the ribosome representations, 5s rRNA is marked in yellow, 18s rRNA in blue, 28s rRNA in green and ribosomal proteins in grey.
Ijms 26 11169 g0a4

References

  1. Nichols, E.; Steinmetz, J.D.; Vollset, S.E.; Fukutaki, K.; Chalek, J.; Abd-Allah, F.; Abdoli, A.; Abualhasan, A.; Abu-Gharbieh, E.; Akram, T.T.; et al. GBD 2019 Dementia Forecasting Collaborators. Estimation of the global prevalence of dementia in 2019 and forecasted prevalence in 2050: An analysis for the Global Burden of Disease Study 2019. Lancet Public Health 2022, 7, e105–e125. [Google Scholar] [CrossRef]
  2. DeTure, M.A.; Dickson, D.W. The neuropathological diagnosis of Alzheimer’s disease. Mol. Neurodegener. 2019, 14, 32. [Google Scholar] [CrossRef]
  3. McKeith, I.G.; Boeve, B.F.; Dickson, D.W.; Halliday, G.; Taylor, J.P.; Weintraub, D.; Aarsland, D.; Galvin, J.; Attems, J.; Ballard, C.G.; et al. Diagnosis and management of dementia with Lewy bodies: Fourth consensus report of the DLB Consortium. Neurology 2017, 89, 88–100. [Google Scholar] [CrossRef]
  4. Jellinger, K.A. Dementia with Lewy bodies and Parkinson’s disease-dementia: Current concepts and controversies. J. Neural. Transm. 2018, 125, 615–650. [Google Scholar] [CrossRef] [PubMed]
  5. Outeiro, T.F.; Koss, D.J.; Erskine, D.; Walker, L.; Kurzawa-Akanbi, M.; Burn, D.; Donaghy, P.; Morris, C.; Taylor, J.-P.; Thomas, A. Dementia with Lewy bodies: An update and outlook. Mol. Neurodegener. 2019, 14, 5. [Google Scholar] [CrossRef] [PubMed]
  6. Spillantini, M.G.; Crowther, R.A.; Jakes, R.; Hasegawa, M.; Godert, M. alpha-Synuclein in filamentous inclusions of Lewy bodies from Parkinson’s disease and dementia with lewy bodies. Proc. Natl. Acad. Sci. USA 1998, 95, 6469–6473. [Google Scholar] [CrossRef] [PubMed]
  7. Erskine, D.; Koss, D.; Korolchuk, V.I.; Outeiro, T.F.; Attems, J.; McKeith, I. Lipids, lysosomes and mitochondria: Insights into Lewy body formation from rare monogenic disorders. Acta Neuropathol. 2021, 141, 511–526. [Google Scholar] [CrossRef]
  8. Postuma, R.B.; Gagnon, J.F.; Vendette, M.; Fantini, M.L.; Massicotte-Marquez, J.; Montplaisir, J. Quantifying the risk of neurodegenerative disease in idiopathic REM sleep behavior disorder. Neurology 2009, 72, 1296–1300. [Google Scholar] [CrossRef]
  9. Iranzo, A.; Fernández-Arcos, A.; Tolosa, E.; Serradell, M.; Molinuevo, J.L.; Valldeoriola, F.; Gelpi, E.; Vilaseca, I.; Sánchez-Valle, R.; Lladó, A.; et al. Neurodegenerative disorder risk in idiopathic REM sleep behavior disorder: Study in 174 patients. PLoS ONE 2014, 9, e89741. [Google Scholar] [CrossRef]
  10. Iranzo, A.; Tolosa, E.; Gelpi, E.; Molinuevo, J.L.; Valldeoriola, F.; Serradell, M.; Sanchez-Valle, R.; Vilaseca, I.; Lomeña, F.; Vilas, D.; et al. Neurodegenerative disease status and post-mortem pathology in idiopathic rapid-eye-movement sleep behaviour disorder: An observational cohort study. Lancet Neurol. 2013, 12, 443–453. [Google Scholar] [CrossRef]
  11. Iranzo, A.; Fairfoul, G.; Ayudhaya, A.C.N.; Serradell, M.; Gelpi, E.; Vilaseca, I.; Sanchez-Valle, R.; Gaig, C.; Santamaria, J.; Tolosa, E.; et al. Detection of α-synuclein in CSF by RT-QuIC in patients with isolated rapid-eye-movement sleep behaviour disorder: A longitudinal observational study. Lancet Neurol. 2021, 20, 203–212. [Google Scholar] [CrossRef]
  12. Nording, H.; Langer, H.F. Complement links platelets to innate immunity. Semin. Immunol. 2018, 37, 43–52. [Google Scholar] [CrossRef]
  13. Leiter, O.; Walker, T.L. Platelets: The missing link between the blood and brain? Prog. Neurobiol. 2019, 183, 101695. [Google Scholar] [CrossRef]
  14. Gowert, N.S.; Donner, L.; Chatterjee, M.; Eisele, Y.S.; Towhid, S.T.; Münzer, P.; Walker, B.; Ogorek, I.; Borst, O.; Grandoch, M.; et al. Blood platelets in the progression of Alzheimer’s disease. PLoS ONE 2014, 9, e90523. [Google Scholar] [CrossRef] [PubMed]
  15. McRedmond, J.P.; Park, S.D.; Reilly, D.F.; Coppinger, J.A.; Maguire, P.B.; Shields, D.C.; Fitzgerald, D.J. Integration of proteomics and genomics in platelets: A profile of platelet proteins and platelet-specific genes. Mol. Cell. Proteomics 2004, 3, 133–144. [Google Scholar] [CrossRef] [PubMed]
  16. Landry, P.; Plante, I.; Ouellet, D.L.; Perron, M.P.; Rousseau, G.; Provost, P. Existence of a microRNA pathway in anucleate platelets. Nat. Struct. Mol. Biol. 2009, 16, 961–966. [Google Scholar] [CrossRef] [PubMed]
  17. Gámez-Valero, A.; Campdelacreu, J.; Vilas, D.; Ispierto, L.; Gascón-Bayarri, J.; Reñé, R.; Álvarez, R.; Armengol, M.P.; Borràs, F.E.; Beyer, K. Platelet miRNA Biosignature Discriminates between Dementia with Lewy Bodies and Alzheimer’s Disease. Biomedicines 2021, 9, 1272. [Google Scholar] [CrossRef]
  18. Arnaldo, L.; Mena, J.; Serradell, M.; Gaig, C.; Adamuz, D.; Vilas, D.; Samaniego, D.; Ispierto, L.; Montini, A.; Mayà, G.; et al. Platelet miRNAs as early biomarkers for progression of idiopathic REM sleep behavior disorder to a synucleinopathy. Sci. Rep. 2025, 15, 12136. [Google Scholar] [CrossRef]
  19. Thibord, F.; Johnson, A.D. Sources of variability in the human platelet transcriptome. Thromb. Res. 2023, 231, 255–263. [Google Scholar] [CrossRef]
  20. Zhang, L.; Shao, Y.; Tang, C.; Liu, Z.; Tang, D.; Hu, C.; Liang, X. Identification of Novel Biomarkers in Platelets for Diagnosing Parkinson’s Disease. Eur. Neurol. 2022, 85, 122–131. [Google Scholar] [CrossRef]
  21. In ‘t Veld, S.G.J.G.; Arkani, M.; Post, E.; Antunes-Ferreira, M.; D’Ambrosi, S.; Vessies, D.C.L.; Vermunt, L.; Vancura, A.; Muller, M.; Niemeijer, A.-L.N.; et al. Detection and localization of early- and late-stage cancers using platelet RNA. Cancer Cell 2022, 40, 999–1009.e6. [Google Scholar] [CrossRef] [PubMed]
  22. Xu, C.; Zhang, R.; Duan, M.; Zhou, Y.; Bao, J.; Lu, H.; Wang, J.; Hu, M.; Hu, Z.; Zhou, F.; et al. A polygenic stacking classifier revealed the complicated platelet transcriptomic landscape of adult immune thrombocytopenia. Mol. Ther. Nucleic Acids 2022, 28, 477–487. [Google Scholar] [CrossRef]
  23. Xu, L.; Li, X.; Li, X.; Wang, X.; Ma, Q.; She, D.; Lu, X.; Zhang, J.; Yang, Q.; Lei, S.; et al. RNA profiling of blood platelets noninvasively differentiates colorectal cancer from healthy donors and noncancerous intestinal diseases: A retrospective cohort study. Genome Med. 2022, 14, 26. [Google Scholar] [CrossRef]
  24. Koupenova, M.; Clancy, L.; Corkrey, H.A.; Freedman, J.E. Circulating Platelets as Mediators of Immunity, Inflammation, and Thrombosis. Circ. Res. 2018, 122, 337–351. [Google Scholar] [CrossRef]
  25. Bo, Y.; Lu, Q.; Li, B.; Sha, R.; Yu, H.; Miao, C. The role of platelets in central hubs of inflammation: A literature review. Medicine 2024, 103, e38115. [Google Scholar] [CrossRef]
  26. Michelson, A.D.; Frelinger, A.L., III; Haynes, R.L.; Kinney, H.C.; Gremmel, T. Platelet Pathophysiology: Unexpected New Research Directions. Semin. Thromb. Hemost. 2024, 50, 1187–1190. [Google Scholar] [CrossRef] [PubMed]
  27. Ercan, H.; Reumiller, C.M.; Mühlberger, J.; Hsu, F.; Schmidt, G.J.; Umlauf, E.; Miller, I.; Rappold, E.; Attems, J.; Oehler, R.; et al. Platelets mirror changes in the frontal lobe antioxidant system in Alzheimer’s disease. Alzheimers Dement. 2025, 21, e70117. [Google Scholar] [CrossRef]
  28. Cimmino, G.; Conte, S.; Palumbo, D.; Sperlongano, S.; Torella, M.; Della Corte, A.; Golino, P. The Novel Role of Noncoding RNAs in Modulating Platelet Function: Implications in Activation and Aggregation. Int. J. Mol. Sci. 2023, 24, 7650. [Google Scholar] [CrossRef] [PubMed]
  29. Sun, Y.; Wang, T.; Lv, Y.; Li, J.; Jiang, X.; Jiang, J.; Zhang, D.; Bian, W.; Zhang, C. MALAT1 promotes platelet activity and thrombus formation through PI3k/Akt/GSK-3β signalling pathway. Stroke Vasc. Neurol. 2023, 8, 181–192. [Google Scholar] [CrossRef]
  30. Iyer, M.K.; Niknafs, Y.S.; Malik, R.; Singhal, U.; Sahu, A.; Hosono, Y.; Barrette, T.R.; Prensner, J.R.; Evans, J.R.; Zhao, S.; et al. The landscape of long noncoding RNAs in the human transcriptome. Nat. Genet. 2015, 47, 199–208. [Google Scholar] [CrossRef]
  31. Palma, A.; Buonaiuto, G.; Ballarino, M.; Laneve, P. Genome biology of long non-coding RNAs in humans: A virtual karyotype. Comput. Struct. Biotechnol. J. 2025, 27, 575–584. [Google Scholar] [CrossRef]
  32. Li, X.; Zong, Q.; Liu, L.; Liu, Y.; Shen, Y.; Tang, X.; Wing, Y.K.; Li, S.X.; Zhou, J. Sex differences in rapid eye movement sleep behavior disorder: A systematic review and meta-analysis. Sleep Med. Rev. 2023, 71, 101810. [Google Scholar] [CrossRef] [PubMed]
  33. Li, D.; McIntosh, C.S.; Mastaglia, F.L.; Wilton, S.D.; Aung-Htut, M.T. Neurodegenerative diseases: A hotbed for splicing defects and the potential therapies. Transl. Neurodegener. 2021, 10, 16, Correction in Transl. Neurodegener. 2021, 10, 41. [Google Scholar] [CrossRef]
  34. Bray, P.F.; McKenzie, S.E.; Edelstein, L.C.; Nagalla, S.; Delgrosso, K.; Ertel, A.; Kupper, J.; Jing, Y.; Londin, E.; Loher, P.; et al. The complex transcriptional landscape of the anucleate human platelet. BMC Genom. 2013, 14, 1. [Google Scholar] [CrossRef]
  35. Belur, N.R.; Bustos, B.I.; Lubbe, S.J.; Mazzulli, J.R. Nuclear aggregates of NONO/SFPQ and A-to-I-edited RNA in Parkinson’s disease and dementia with Lewy bodies. Neuron 2024, 112, 2558–2580.e13. [Google Scholar] [CrossRef]
  36. Stefanini, L.; Bergmeier, W. RAP1-GTPase signaling and platelet function. J. Mol. Med. 2016, 94, 13–19. [Google Scholar] [CrossRef]
  37. Stefanini, L.; Bergmeier, W. RAP GTPases and platelet integrin signaling. Platelets 2019, 30, 41–47. [Google Scholar] [CrossRef]
  38. Murphy, D.D.; Rueter, S.M.; Trojanowski, J.Q.; Lee, V.M. Synucleins are developmentally expressed, and α-synuclein regulates the size of the presynaptic vesicular pool in primary hippocampal neurons. J. Neurosci. 2000, 20, 3214–3220. [Google Scholar] [CrossRef]
  39. Pranke, I.M.; Morello, V.; Bigay, J.; Gibson, K.; Verbavatz, J.M.; Antonny, B.; Jackson, C.L. α-Synuclein and ALPS motifs are membrane curvature sensors whose contrasting chemistry mediates selective vesicle binding. J. Cell. Biol. 2011, 194, 89–103. [Google Scholar] [CrossRef] [PubMed]
  40. Oliveira da Silva, M.I.; Liz, M.A. Linking Alpha-Synuclein to the Actin Cytoskeleton: Consequences to Neuronal Function. Front. Cell. Dev. Biol. 2020, 8, 787. [Google Scholar] [CrossRef] [PubMed]
  41. Qiu, X.; Nair, M.G.; Jaroszewski, L.; Godzik, A. Deciphering Abnormal Platelet Subpopulations in COVID-19, Sepsis and Systemic Lupus Erythematosus through Machine Learning and Single-Cell Transcriptomics. Int. J. Mol. Sci. 2024, 25, 5941. [Google Scholar] [CrossRef]
  42. Höglinger, G.U.; Adler, C.H.; Berg, D.; Klein, C.; Outeiro, T.F.; Poewe, W.; Postuma, R.; Stoessl, A.J.; Lang, A.E. A biological classification of Parkinson’s disease: The SynNeurGe research diagnostic criteria. Lancet Neurol. 2024, 23, 191–204, Erratum in Lancet Neurol. 2024, 23, e7. [Google Scholar] [CrossRef]
  43. Tijms, B.M.; Vromen, E.M.; Mjaavatten, O.; Holstege, H.; Reus, L.M.; van der Lee, S.; Wesenhagen, K.E.J.; Lorenzini, L.; Vermunt, L.; Venkatraghavan, V.; et al. Cerebrospinal fluid proteomics in patients with Alzheimer’s disease reveals five molecular subtypes with distinct genetic risk profiles. Nat. Aging 2024, 4, 33–47. [Google Scholar] [CrossRef] [PubMed]
  44. Ferreira, D.; Nordberg, A.; Westman, E. Biological subtypes of Alzheimer disease: A systematic review and meta-analysis. Neurology 2020, 94, 436–448. [Google Scholar] [CrossRef]
  45. Jones, L.D.; Jackson, J.W.; Maggirwar, S.B. Modeling HIV-1 Induced Neuroinflammation in Mice: Role of Platelets in Mediating Blood-Brain Barrier Dysfunction. PLoS ONE 2016, 11, e0151702. [Google Scholar] [CrossRef]
  46. Burnouf, T.; Walker, T.L. The multifaceted role of platelets in mediating brain function. Blood 2022, 140, 815–827. [Google Scholar] [CrossRef]
  47. Hughes, A.J.; Daniel, S.E.; Kilford, L.; Lees, A.J. Accuracy of clinical diagnosis of idiopathic Parkinson’s disease: A clinico-pathological study of 100 cases. J. Neurol. Neurosurg. Psychiatry 1992, 55, 181–184. [Google Scholar] [CrossRef] [PubMed]
  48. Sateia, M.J. International classification of sleep disorders-third edition: Highlights and modifications. Chest 2014, 146, 1387–1394. [Google Scholar] [CrossRef] [PubMed]
  49. McKhann, G.M.; Knopman, D.S.; Chertkow, H.; Hyman, B.T.; Jack, C.R., Jr.; Kawas, C.H.; Klunk, W.E.; Koroshetz, W.J.; Manly, J.J.; Mayeux, R.; et al. The diagnosis of dementia due to Alzheimer’s disease, recommendations from the National Institute on Aging-Alzheimer’s Association workgroups on diagnostic guidelines for Alzheimer’s disease. Alzheimers Dement. 2011, 7, 263–269. [Google Scholar] [CrossRef]
  50. Lynöe, N.; Sandlund, M.; Dahlqvist, G.; Jacobsson, L. Informed consent, study of quality of information given to participants in a clinical trial. BMJ 1991, 303, 610–613. [Google Scholar] [CrossRef] [PubMed]
  51. Andrews, S. FastQC: A Quality Control Tool for High Throughput Sequence Data. 2010. Available online: http://www.bioinformatics.babraham.ac.uk/projects/fastqc/ (accessed on 12 June 2023).
  52. Ewels, P.; Magnusson, M.; Lundin, S.; Käller, M. MultiQC: Summarize analysis results for multiple tools and samples in a single report. Bioinformatics 2016, 32, 3047–3048. [Google Scholar] [CrossRef] [PubMed]
  53. Krueger, F.; James, F.; Ewels, P.; Afyounian, E.; Weinstein, M.; Schuster-Boeckler, B.; Hulselmans, G.; Sclamons. FelixKrueger/TrimGalore: v0.6.10—Add Default Decompression Path (0.6.10). Zenodo 2023. [Google Scholar] [CrossRef]
  54. Dobin, A.; Davis, C.A.; Schlesinger, F.; Drenkow, J.; Zaleski, C.; Jha, S.; Batut, P.; Chaisson, M.; Gingeras, T.R. STAR: Ultrafast universal RNA-seq aligner. Bioinformatics 2013, 29, 15–21. [Google Scholar] [CrossRef] [PubMed]
  55. Patro, R.; Duggal, G.; Love, M.I.; Irizarry, R.A.; Kingsford, C. Salmon provides fast and bias-aware quantification of transcript expression. Nat. Methods 2017, 14, 417–419. [Google Scholar] [CrossRef]
  56. Soneson, C.; Love, M.I.; Robinson, M.D. Differential analyses for RNA-seq: Transcript-level estimates improve gene-level inferences. F1000 Res. 2015, 4, 1521. [Google Scholar] [CrossRef]
  57. Love, M.I.; Huber, W.; Anders, S. Moderated estimation of fold change and dispersion for RNA-seq data with DESeq2. Genome Biol. 2014, 15, 550. [Google Scholar] [CrossRef] [PubMed]
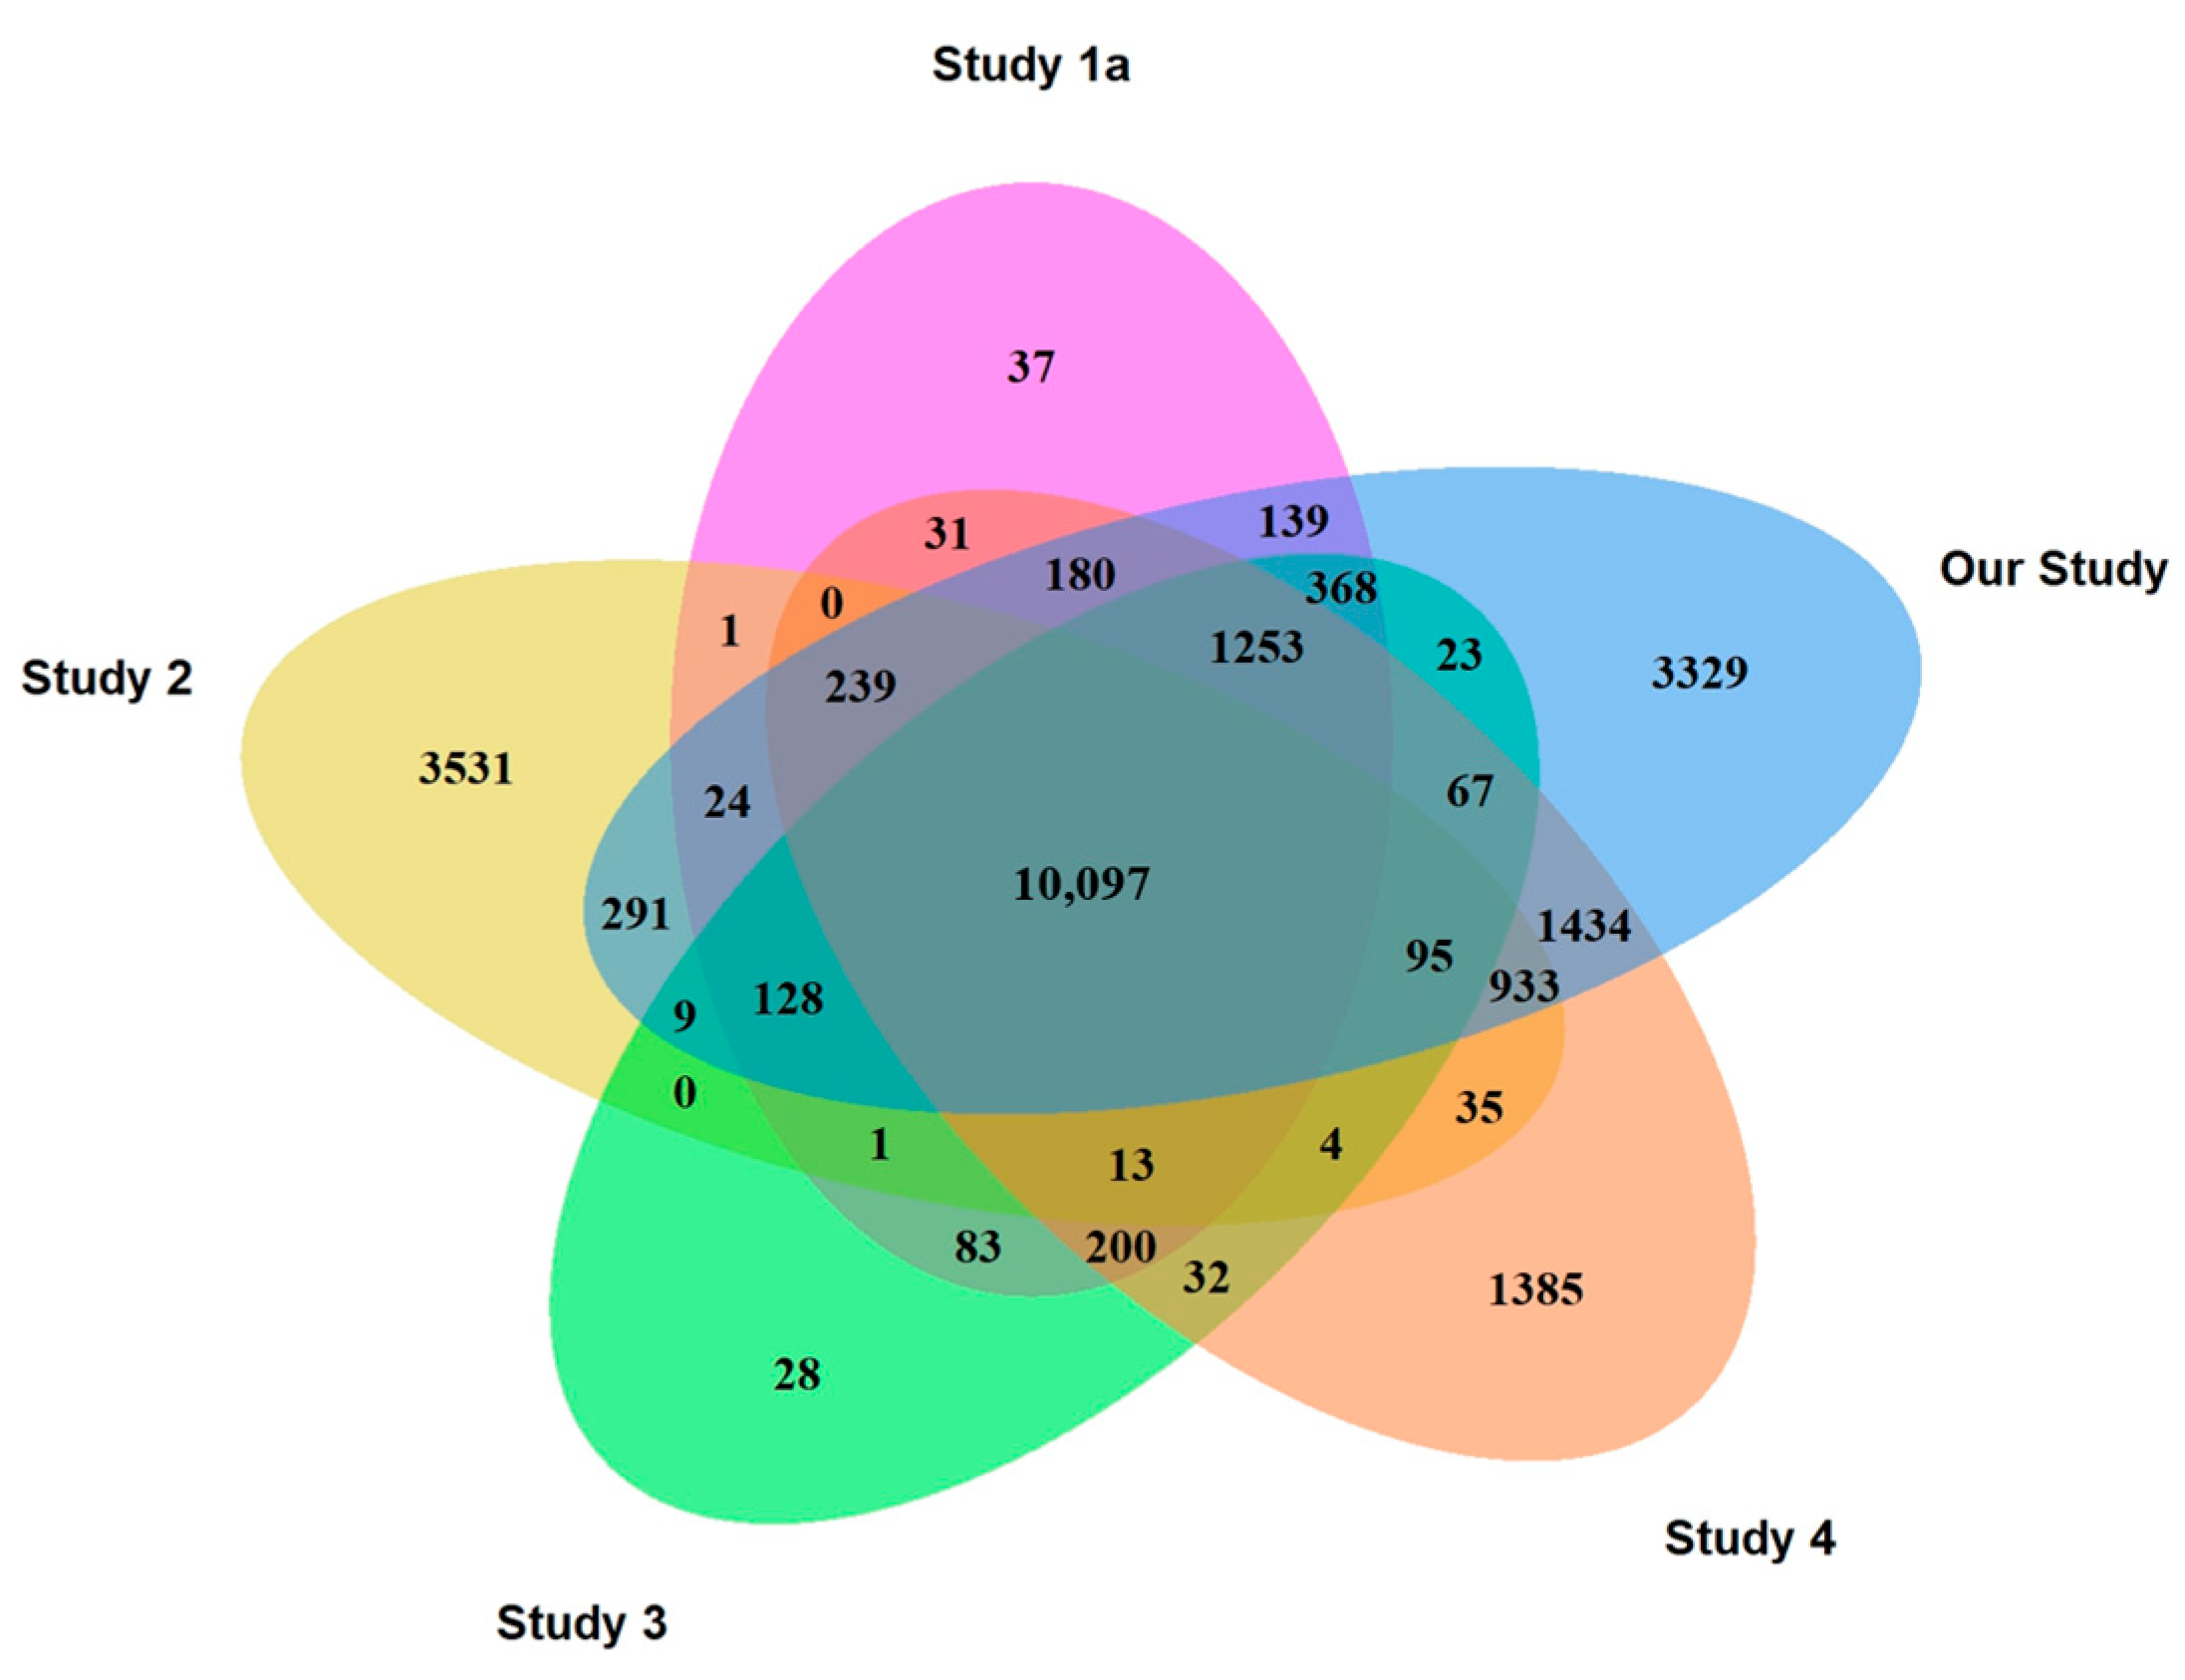
Figure 1. Distribution of the expressed genes in Studies 1a, 2–4 and 5a.
Ijms 26 11169 g001
Figure 2. Comparative distribution of expressed genes in Studies 1b and 5b.
Ijms 26 11169 g002
Figure 3. Distribution of mRNAs, lncRNAs, pseudogene RNAs, scaRNAs, snoRNAs, snRNAs, ribozymes and mtRNAs in the 5 groups included in this study.
Ijms 26 11169 g003
Figure 4. Distribution of lncRNA genes in the different groups.
Ijms 26 11169 g004
Figure 5. Percentage distribution of the five minor RNA groups in the diseases and controls.
Ijms 26 11169 g005
Figure 6. Distribution of nuclear RNAs (scaRNAs, snoRNAs and snRNAs) across the five datasets, illustrating group-specific transcripts. Group-specific RNAs are defined as those detected in one or more, but not all, of the analyzed groups. *, p < 0.05, **, p < 0.01, ***p < 0.001.
Ijms 26 11169 g006
Figure 7. Enhanced and impaired biological processes identified by gene ontology (GO) enrichment in IRBD compared with CTRLs.
Ijms 26 11169 g007
Figure 8. Enhanced and impaired KEGG pathways in IRBD compared with CTRLs.
Ijms 26 11169 g008
Figure 9. Enhanced and impaired biological processes identified by GO enrichment in DLB compared with CTRLs.
Ijms 26 11169 g009
Figure 10. Enhanced and impaired KEGG pathways in DLB compared with CTRLs.
Ijms 26 11169 g010
Table 1. Demographic and clinical data of the participants of the study.
DLB
(n = 12)
PD
(n = 12)
IRBD
(n = 12)
AD
(n = 14)
CTRL
(n = 14)
p1
Mean age, y 2
(age range, y)
74.1
(64–85)
66.9
(44–87)
74.5
(65–89)
68.8
(60–80)
71.3
(61–86)
0.017
Gender
(male/female ratio)
7/58/49/37/77/70.069
Duration 3, years (range)5.7 (2.1–10.6)15.2 (4.9–23.7)8.9 (2.5–18.2)5.2 (0.8–8.0)
MMSE 4, mean (range)15.3
(3–27)
n.a. 5 19.9
(5–28)
-0.189
UPDRS-III 6, mean (range)-20.9
(5–39)
---
GDS fast 7, mean (range)-- 4.1
(3–6)
--
Parkinsonism, n (%)10 (83.3%)--- -
Positive DAT imaging, n (%)11 (91.6%)--- -
1 p, p-value obtained by the Kruskal–Wallis test; 2 y, years old; 3 duration, disease duration from disease onset to sample obtaining; 4 MMSE, Mini-Mental State Examination; 5 n.a., not applicable, since patients had no signs of cognitive impairment, thus MMSE was not carried out; 6 UPDRS-III, Unified Parkinson’s Disease Rating Scale Part III; 7 GDS, Global Deterioration Scale.
Table 2. Platelet RNA-Seq studies between 2021 and 2025, with more than 25 control individuals.
StudyYearAccession NumberSamples (n)Age 1Expressed Genes 2
1a2021 [20]PRJNA73299020 CTRLs49.2 (21–75)12,794
1b2021 [20]PRJNA73280320 PD67.1 (50–86)13,747
22022 [21]GSE183635316 CTRLs55.4 (18–86)15,402
32022 [22]PRJNA66882056 CTRLs47.8 (n/a)12,401
42022 [23]PRJNA737596190 CTRLs54.6 (31–72)15,998
5a2025Our study14 CTRLs71.3 (61–86)18,609
5b2025Our study12 PD66.9 (44–87)18,132
1 Mean age (age range). n/a—not available. 2 Number of genes with more than 10 reads in all samples of each study.
Disclaimer/Publisher’s Note: The statements, opinions and data contained in all publications are solely those of the individual author(s) and contributor(s) and not of MDPI and/or the editor(s). MDPI and/or the editor(s) disclaim responsibility for any injury to people or property resulting from any ideas, methods, instructions or products referred to in the content.