Article

Identification of Novel Metabolic Signatures on Human Gut Microbiota: Ellagic Acid, Naringenin, and Phloroglucinol

by
Adriana C. S. Pais
1,2,
Tânia B. Ribeiro
2,
Ezequiel R. Coscueta
2,
Maria Manuela Pintado
2,
Armando J. D. Silvestre
1 and
Sónia A. O. Santos
1,*
1
CICECO-Aveiro Institute of Materials, Chemistry Department, University of Aveiro, Camous de Santiago, 3810-193 Aveiro, Portugal
2
CBQF—Centro de Biotecnologia e Química Fina-Laboratório Associado, Escola Superior de Biotecnologia, Universidade Católica Portuguesa, Rua Diogo Botelho 1327, 4169-005 Porto, Portugal
*
Author to whom correspondence should be addressed.
Int. J. Mol. Sci. 2025, 26(22), 11009; https://doi.org/10.3390/ijms262211009
Submission received: 9 September 2025 / Revised: 5 November 2025 / Accepted: 12 November 2025 / Published: 14 November 2025

Abstract

Phenolic compounds are widely known for their beneficial effects on human health. However, it is essential to understand which low molecular weight metabolites are produced by the gut microbiota, when non-absorbed compounds reach the colon, and whether these metabolites are more biologically active than their precursors. In this context, this study aims to explore the gut microbiota metabolites of relevant phenolic compounds commonly found in the human diet. Therefore, ellagic acid, naringenin, and phloroglucinol were incubated with human feces for 48 h, and the ensuing metabolites were analyzed by ultra-high-performance liquid chromatography with diode array detector coupled to ion trap mass spectrometry (UHPLC-DAD-MSn) and gas chromatography–mass spectrometry (GC-MS). Ellagic acid metabolism by the gut microbiota produced a diversity of urolithins, with 8-hydroxyurolithin being identified for the first time. Isomers of 4-hydroxybenzoic, 3,4-dihydroxybenozic, and p-coumaric acids were identified for the first time as naringenin metabolites, while phloroglucinic, 2-hydroxy-3-phenylpropanoic, 3-phenylpropanoic, and 2-phenylacetic acids are reported for the first time as phloroglucinol metabolites. These findings contribute to a more comprehensive understanding of the beneficial health effects of these metabolites through the evaluation of their biological activities in conjunction with their effects on the gut microbiota, thus providing the basis for the development of food supplements, novel probiotics or functional foods.

Graphical Abstract

1. Introduction

Currently, the concept “you are what you eat” has become considerably widespread [1]. In fact, there has been a growing awareness that human nutrition is more than just a vital process for the functioning of the human body [2], mainly due to the scientific community’s concerted efforts to elucidate the relationship between the gut microbiota and dietary components [1,3], and particularly bioactive secondary metabolites. The influence exerted by these compounds on the gut microbiota composition has been increasingly studied and reported, and as dietary compounds undergo metabolic transformation by the gut microbiota, a two-way relationship between the gut microbiota and bioactive compounds has been widely recognized by the scientific community [3,4,5,6,7,8,9,10,11,12,13,14].
Dietary phenolic compounds, which are a structurally diverse class of secondary metabolites found in a wide variety of fruits, vegetables, and other plant sources, have been broadly studied due to their vast range of biological activities (including, antioxidant, anti-inflammatory, anti-proliferative, antimicrobial activities, among others) [6,7,8,13,14]. However, ingested phenolic compounds are poorly absorbed in the small intestine (about 10–15%); thus, the remaining bioavailable phenolic compounds reach the colon, where they can be metabolized by the colon microbiota [6,7,14,15]. Therefore, the increasing knowledge about the resultant metabolites and their biological activities, which could be more or less bioactive than their dietary phenolic precursors, represents an important tool in the prevention or control of some diseases [6,13,14,15].
Human gut microbiota is as unique as a fingerprint [8,15,16], comprising about 1014 bacterial cells and more than 1000 microbial species [7,8,10,11,15,17] that colonize the human intestinal tract [3,6,8,13,17], and subsequently influence human health [13,14], playing an essential role in the immune system as well as in metabolic functions [3,16,18]. Therefore, the metabolites of phenolic compounds produced are not only dependent on the chemical structure of the precursor phenolic compound [19], but also on the gut microbiota composition [13]. When dietary phenolic compounds reach the colon, they might be enzymatically converted into lower-molecular-weight-phenolic metabolites, which are more bioavailable [11,14]. In fact, gut microbiota bacteria produce specific enzymes (hydrolases, reductases, hydrogenases, decarboxylases, dehydroxylases, among others) that are able to convert phenolic compounds with hydrolysis, cleavage (ring cleavage, demethylation or delactonization), and reduction as the most common phenolic compounds metabolic pathways [3,6,7,8].
The gut microbiota metabolism of some phenolic compounds, namely quercetin [20,21,22,23,24,25,26,27] and catechin [28,29,30,31,32,33,34,35,36,37] derivatives, has already been extensively studied; the bacteria involved and the ensuing metabolites were identified in detail. However, other classes of phenolic compounds have not yet been thoroughly studied. For example, naringenin has been mainly studied using isolated human intestinal bacteria or fermentation with rat gut microbiota bacteria [21,38,39,40,41]. Moreover, some of these studies were performed using complex food matrices as substrates, which could hinder the association between metabolites and respective phenolic compound precursors [42,43,44,45,46,47]. Investigating isolated phenolic compounds and their metabolites is crucial for better understanding the complex interactions occurring within the gut microbiota. When combined with further research on the bioactivities of these metabolites and on how variations in gut bacterial composition influence their metabolism, such studies can provide valuable insights for developing strategies aimed at maximizing the health benefits of phenolic compounds.
Hence, the present study aims to contribute to the identification of metabolites derived from phenolic compounds through human gut microbiota activity during fermentation. Taking into account the results obtained in our previous work on the bioaccessibility and intestinal absorption of some phenolic compounds representative of the most common classes [48], and in light of the findings in the literature regarding the metabolism of phenolic compounds by the gut microbiota as well as their antimicrobial activity or prebiotic effects, ellagic acid, naringenin, and phloroglucinol were submitted to an in vitro batch fermentation with human fecal inoculum, and fermentation samples were further analyzed by UHPLC-DAD-MSn and GC-MS.

2. Results and Discussion

2.1. Phenolic Compounds Selection

Taking into account the information available in the literature about the metabolism of phenolic compounds by the gut microbiota and our previous work on the bioacessibility and intestinal absorption of phenolic compounds [48], five phenolic compounds were selected for the present study: ellagic acid—a phenolic acid; quercetin—a flavonol; naringenin and naringin—flavanones; and phloroglucinol—a monomeric tannin compound. They ensure representativeness of the most common classes of phenolic compounds.
Gut microbiota is a complex environment with a high diversity of bacteria, and despite the majority belonging to Bifidobacterium, Eubacterium, Lactobacillus, and Bacteroides, some pathogens can also be found [49]. Therefore, it was already reported [50] that the antibacterial activity of phenolic compounds (mainly phenolic acids) against E. coli, as well as their ability to stimulate the growth of beneficial bacteria (particularly Lactobacillus and Bifidobacterium), highlights the role of phenolic compounds in human health through the modulation of gut microbiota composition [50]. Before studying how the gut microbiota metabolizes these compounds, their effect on bacterial growth was evaluated to determine whether they have antimicrobial activity or prebiotic effect on pathogenic and probiotic strains, respectively. In this way, the previously selected phenolic compounds were incubated with two probiotic strains (B. animalis subsp. Lactis BB12 and L. casei LC1) for 48 h and with two pathogenic strains (E. coli and S. enterica) for 24 h (Figures S1–S5, Supplementary Material).
Concerning the effect on probiotic strain growth, ellagic acid, naringenin, and phloroglucinol delayed the death phase of L. casei. At 48 h, compared with control, the different concentrations of ellagic acid between 12.5 and 200 µg mL−1 increased growth by 17.2–12.1%, with no dose-dependent effect, similarly to naringenin and phloroglucinol (50–400 µg mL−1), which increased growth by 17.2–15.0% and 16.7–13.4%, respectively. In contrast, both quercetin and naringin accelerated the death phase. Regarding the BB12 growth, the five phenolic compounds showed an inhibitory effect at all tested concentrations, with ellagic acid exhibiting the least pronounced effect (as illustrated in Figure S1a, Supplementary Material).
Overall, after 6 h of incubation, all phenolic compounds promoted an increase in E. coli growth compared to controls. However, from 18 to 48 h, all tested concentrations of ellagic acid and naringenin inhibited E. coli growth (Figures S1c and S3c, Supplementary Material, respectively).
After 24 h, S. enterica growth was inhibited by all the phenolic compounds. Both naringin and phloroglucinol seemed to anticipate the death phase of S. enterica, showing at 24 h an inhibition of 28–35% and 52–58% (25–400 µg mL−1), respectively.
Higher concentrations (800 and 1600 µg mL−1) were tested for all phenolic compounds, except ellagic acid, due to its lower solubility. Predominantly, these concentrations showed a higher inhibitory effect on the growth of all strains. This could be advantageous for pathogenic strains; nevertheless, it is not attractive to L. casei. From 18 h, at 800 µg mL−1 phloroglucinol and naringin enhanced the growth of L. casei when compared to the control.
In this vein, the selection of phenolic compounds and their respective concentrations was based on these results, prioritizing those with minimal negative impact on probiotic strains’ growth while maximizing inhibitory effects on pathogenic ones. Thus, ellagic acid (100 and 200 µg mL−1), naringenin (200 and 400 µg mL−1), and phloroglucinol (200 and 800 µg mL−1) were the ones with the most promising results. A common concentration of 200 µg mL−1 was chosen for comparative purposes.

2.2. Qualitative and Quantitative Analysis of Phenolic Compounds and Their Metabolites

As mentioned above, this study was carried out to identify the metabolites resulting from the activity of human gut microbiota on different phenolic compounds, particularly ellagic acid, naringenin, and phloroglucinol. There is still limited information regarding naringenin metabolites produced under the dynamics of the human gut microbiota ecosystem, with the literature only reporting the metabolites produced in the presence of isolated human intestinal bacteria or rat gut microbiota [21,38,39,40,41]. Similarly, the metabolites reported for phloroglucinol have so far been studied only using an isolated bacterium [51], making this the first study to identify naringenin and phloroglucinol metabolites under dynamic human gut microbiota. For comparative purposes, ellagic acid was also analyzed under the same conditions as a reference compound, although some of its gut microbiota metabolites have already been reported [52,53,54,55,56].
The phenolic compounds precursors and the resulting metabolites were analyzed by UHPLC-DAD-MSn, using the samples at the highest tested concentrations (200, 400, and 800 µg mL−1 for ellagic acid, naringenin, and phloroglucinol, respectively), to facilitate detection.
Table S2 (Supplementary Material) summarizes the phenolic compounds precursors and their respective metabolites, including retention time, deprotonated molecular ion [M-H], the corresponding MS2 product ions, as well as the fecal fermentation time in which they were detected. The identification of each compound was performed by comparing its retention time, deprotonated molecular ion [M-H] and corresponding MS2 product ions with those of standards and, when unavailable, with previously published data, as shown in Table S2 (Supplementary Material).
To detect possible low molecular weight metabolites, the in vitro fermentation samples of ellagic acid, naringenin, and phloroglucinol collected at 0 h, 24 h, and 48 h were derivatized and analyzed by GC-MS. In fact, Krumholz et al. [51] reported that phloroglucinol could be converted into lower molecular weight metabolites such as short-chain fatty acids (including butyrate and acetate) [27,51,57]. The analysis of ellagic acid and naringenin fermentation samples by GC-MS did not result in the identification of additional low molecular weight compounds beyond those identified by UHPLC-DAD-MSn. Conversely, the GC-MS analysis of phloroglucinol fermentation samples complemented the results obtained through UHPLC-DAD-MSn.
The subsequent sections present a detailed discussion of the detection and identification of the in vitro fermentation metabolites of each of the studied compounds obtained by GC-MS or UHPLC-DAD-MSn.

2.2.1. Ellagic Acid and Metabolites from In Vitro Batch Fecal Fermentation

Samples of ellagic acid subjected to in vitro fermentation with human fecal inoculum, and collected after 0, 6, 12, 24, and 48 h were analyzed by UHPLC-DAD-MS2, allowing the detection of six metabolites: E1, E2, E4, E5, and E6 (Figure 1 and Figure 2). Significant differences (p < 0.05, Summary Statistics Tables S3–S7) concerning the concentration of each compound throughout the fermentation period, as well as among the different phenolic compounds at each time point were evaluated by Kruskal–Wallis test, since these samples did not follow a normal distribution. An exception was observed in the comparison between E3 and E4 at 12 h of fermentation, which followed a normal distribution, however homogeneity of variances was not confirmed. Moreover, since at 12 h and 24 h of fermentation only 2 groups (E3 and E4) were considered, the non-parametric Mann–Whitney U test was applied.
Compound E1 presented a [M-H] ion at m/z 259 and product ions at m/z 241 ([M-H-H2O]), 223 ([M-H-2H2O]), 215 ([M-H-CO2]) and 197 ([M-H-CO2-H2O]), which are consistent with those of the standard compound urolithin D (Figure 1); however the retention time differed. Therefore, E1 was identified as an urolithin D isomer. According to the literature data, E1 could be tentatively identified as urolithin M6 or E [55,58,59,60].
González-Barrio et al. [61] reported that the UV spectra of urolithin derivatives have two characteristic peaks: one between 300 and 380 nm and another one between 240 and 280 nm. These bands may indicate the position of the hydroxy groups, particularly the presence or absence of a hydroxy group at position 9, allowing the identification of isomers based on their UV spectrum [61]. In particular, urolithin M6 (3,8,9,10-tetrahydroxyurolithin) has an absorption at 350 nm, whereas urolithin E (3,4,8,10-tetrahydroxyurolithin) absorbs at about 367 nm [61]. Since the UV spectrum of compound E1 showed absorption at 274 and 365 nm, this suggests that this tetrahydroxyurolithin lacks a hydroxy group at position 9 [55,61]. Therefore, compound E1 was tentatively identified as urolithin E, while final confirmation would require authentic standards and/or MS3 data.
Similarly, the fragmentation pathways observed for compound E2 were consistent with urolithin M5 (Figure 1), with its [M-H] ion at m/z 275 and its product ions matching the data reported in the literature for this compound [58].
Compound E3 was identified as ellagic acid, and its retention time, UV spectrum, and MS2 fragmentation were consistent with those of the reference standard (Figure 1). Compounds E4 and E6 were identified as urolithin C and a corresponding isomer, tentatively assigned as urolithin M7 (Figure 1), based on their [M-H] ions at m/z 243. Furthermore, the UV spectrum of compound E6 suggests that this urolithin lacks a hydroxyl group at position 9, as indicated by its absorptions at 279, 353, and 368 nm [59,61], which is consistent with urolithin M7 (3,8,10-trihydroxyurolithin).
Considering the reported data, compound E7 was identified as (iso)urolithin A (Figure 1) due to its [M-H] ion at m/z 227 and its corresponding MS2 product ions at m/z 209 ([M-H-H2O]) and 183 ([M-H-CO2]) [55,59]. The structural difference between urolithin A and isourolithin A lies in the position of one hydroxy group, located at positions 8 and 9, respectively. Thus, the UV spectrum of compound E7, showing peaks at 281, 302, and 358 nm, corresponds to that of urolithin A (3,8-dihydroxyurolithin) [55,59,61].
Finally, compound E5 showed a [M-H] ion at m/z 211 and MS2 product ions at m/z 183 ([M-H-CO]) and 167 ([M-H-CO2]), which agree with those of urolithin B, however the retention time did not coincide, and therefore compound E5 was identified as an urolithin B isomer (Figure 1). According to González-Barrio et al. [61], the UV spectrum of a 9-hydroxyurolithin shows peaks at 256 and 329 nm, which are similar to those of isourolithin A (3,9-dihydroxyurolithin), indicating that the hydroxy at 9-position has a strong influence on the UV spectrum in contrast to the 3-hydroxy group [61]. The UV spectrum of compound E5 did not match those of urolithin B (3-hydroxyurolithin) (confirmed with a standard reference compound) or isourolithin B (9-hydroxyurolithin). Thus, considering the previous precursor compound (with the closest molecular weight, urolithin A), this compound was tentatively identified as 8-hydroxyurolithin. To the best of our knowledge, this is the first study identifying 8-hydroxyurolithin as a metabolite of ellagic acid obtained by in vitro fecal fermentation, as most studies have reported that (iso)urolithin A or urolithin B are the final metabolites of ellagic acid transformation [52,53,54,55,56,62].
Based on the data above, our results confirm that ellagic acid transformation by gut microbiota occurs via a sequential pathway involving lactone ring cleavage and decarboxylation, followed by successive dehydroxylation steps, as illustrated in Figure 1, in agreement with previously published data [53,63]. According to our findings, and as shown in Figure 2, the first urolithin, E4 was detected after 12 h of fermentation, at which time most ellagic acid had already been metabolized, while further urolithin metabolites were only detected after 48 h of fermentation. This could be attributed either to the complete conversion of the E4 precursors (E1 and E2) or to their concentrations being below the limit of detection at earlier fermentation times. These results are not entirely consistent with those of Selma et al. [52,54], who studied ellagic acid metabolism by isolated bacteria and observed that the production of urolithins begins after 2–3 days of incubation.
However, Garcia-Villalba et al. [55] demonstrated that the production of urolithins is influenced by the solvent used to overcome ellagic acid solubility limitations; DMSO, one of the effective solvents in this context, provides significantly different results as it delays urolithin production [55]. Thus, our results (Figure 2) seem to be in accordance with those obtained in the presence of DMSO by García-Villalba et al. [55], in which urolithin A (corresponding to E7) was also found after 42 h of fermentation and the maximum concentration of urolithin M5 (corresponding to E2) was detected at 40 h of incubation. The main urolithin produced after 48 h was E1 (5.1 ± 0.7 µg mL−1), which results from the loss of a single hydroxyl group (with a [M-H] at m/z 259).
Hence, the metabolism of ellagic acid by the gut microbiota appears to occur through the activity of bacteria able to produce lactonases, decarboxylases, and dehydroxylases, which are responsible for lactone-ring cleavage, decarboxylation, and sequential dehydroxylation, respectively [53,63]. Although urolithin production occurs through sequential dehydroxylation, it seems to depend on gut microbiota composition since there is not always a complete conversion from pentahydroxyurolithin (urolithin M5, E2) to dihydroxyuroltihin (urolithin A or isourolithin A, E7) or even to hydroxyurolithin (urolithin B, isourolithin B or 8-hydroxyurolithin, E5). Three human metabotypes have already been defined for urolithins: metabotype A (urolithin A, E7 is the final metabolite), metabotype B (besides urolithin A, E7, urolithin B and/or isourolithin A, E7 are found), and metabotype 0 (there is no production of urolithins) [54,56].
As represented in Figure 1, the gut microbiota transformation pathway of ellagic acid may involve a four-step dehydroxylation sequence from urolithin M5, E2, (3,4,8,9,10-penta-hydroxyuroltihin) to 8-hydroxyurolithin, E5, which was the lowest molecular weight urolithin identified in this study. Gordonibacter urolithinfaciens (DSM 27213T) and G. pamelaeae (DSM 19378T) are two bacterial species isolated from human feces that have shown the ability to carry out the first two dehydroxylation steps of this pathway, from urolithin M5 (E2) to urolithin C (E4) through a tetrahydroxyurolithin intermediate [52,64].
Moreover, three possible tetrahydroxyurolithin metabolites were produced and identified through urolithin M5 (E2)—urolithin D (3,4,8,9-tetrahydroxyuroltihin), urolithin M6 (3,8,9,10-tetrahydroxyuroltihin), E1 and urolithin E (3,4,8,10-tetrahydroxyuroltihin), E1. Our results suggest that urolithin M5 (E2) was transformed into urolithin E, E1, consistent with other studies [53,55], where urolithin D was not detected, and urolithin E and M6 (E1) were the most common tetrahydroxyurolithins. This may indicate that the hydroxy group at position 10 is more resistant to dehydroxylases activity than those at positions 8 and 9. Indeed, it has been reported that isolated Gordonibacter species transform urolithin M5 (E2) into urolithin C (E4), through urolithin M6, E1 [52,64]. Additionally, and similarly to the pathway proposed here, Garcia-Villalba et al. [55] showed that urolithin M7, E6 was the trihydroxyurolithin resulting from the removal of hydroxy group from urolithin E, E1.
Furthermore, urolithin A (E7), is a dihydroxyuroltihin that can arise from the third dihydroxylation step, either from urolithin C (E4) or urolithin M7 (E6), in agreement with previously reported data by Gaya et al. [53] and Garcia-Villalba et al. [55]. Three bacterial species capable of performing these third and fourth steps of dehydroxylation, were already isolated, namely Ellagibacter isourolithinifaciens CEBA S4A4, from which the final ellagic acid metabolite is isourolithin A, E7 [54], Bifidobacterium pseudocatemulatun INIA P815, which is able to metabolize ellagic acid, E3, into urolithin (E7) and urolithin B [65], and Lactococcus garvieae FUA009, which transforms ellagic acid, E3, into a single final metabolite, urolithin A, E7 [56]. In our study, the lowest molecular weight metabolite detected was 8-hydroxyurolithin, E5, based on the UV spectrum of the synthesized reference compound reported by González-Barrio et al. [61]. However, to the best of our knowledge, this is the first study describing 8-hydroxyurolithin, E5, as a metabolite of ellagic acid biotransformation by the gut microbiota.
In conclusion, the metabolism of ellagic acid by the gut microbiota produced a diversity of urolithins, which are more readily absorbed in the small intestine than the precursor phenolic compound [55], and are associated with several beneficial effects on human health, as they are known for their anti-inflammatory, antioxidant, antimicrobial activities and their chemopreventive effects against colon cancer [52,63].

2.2.2. Naringenin and Metabolites from In Vitro Batch Fecal Fermentation

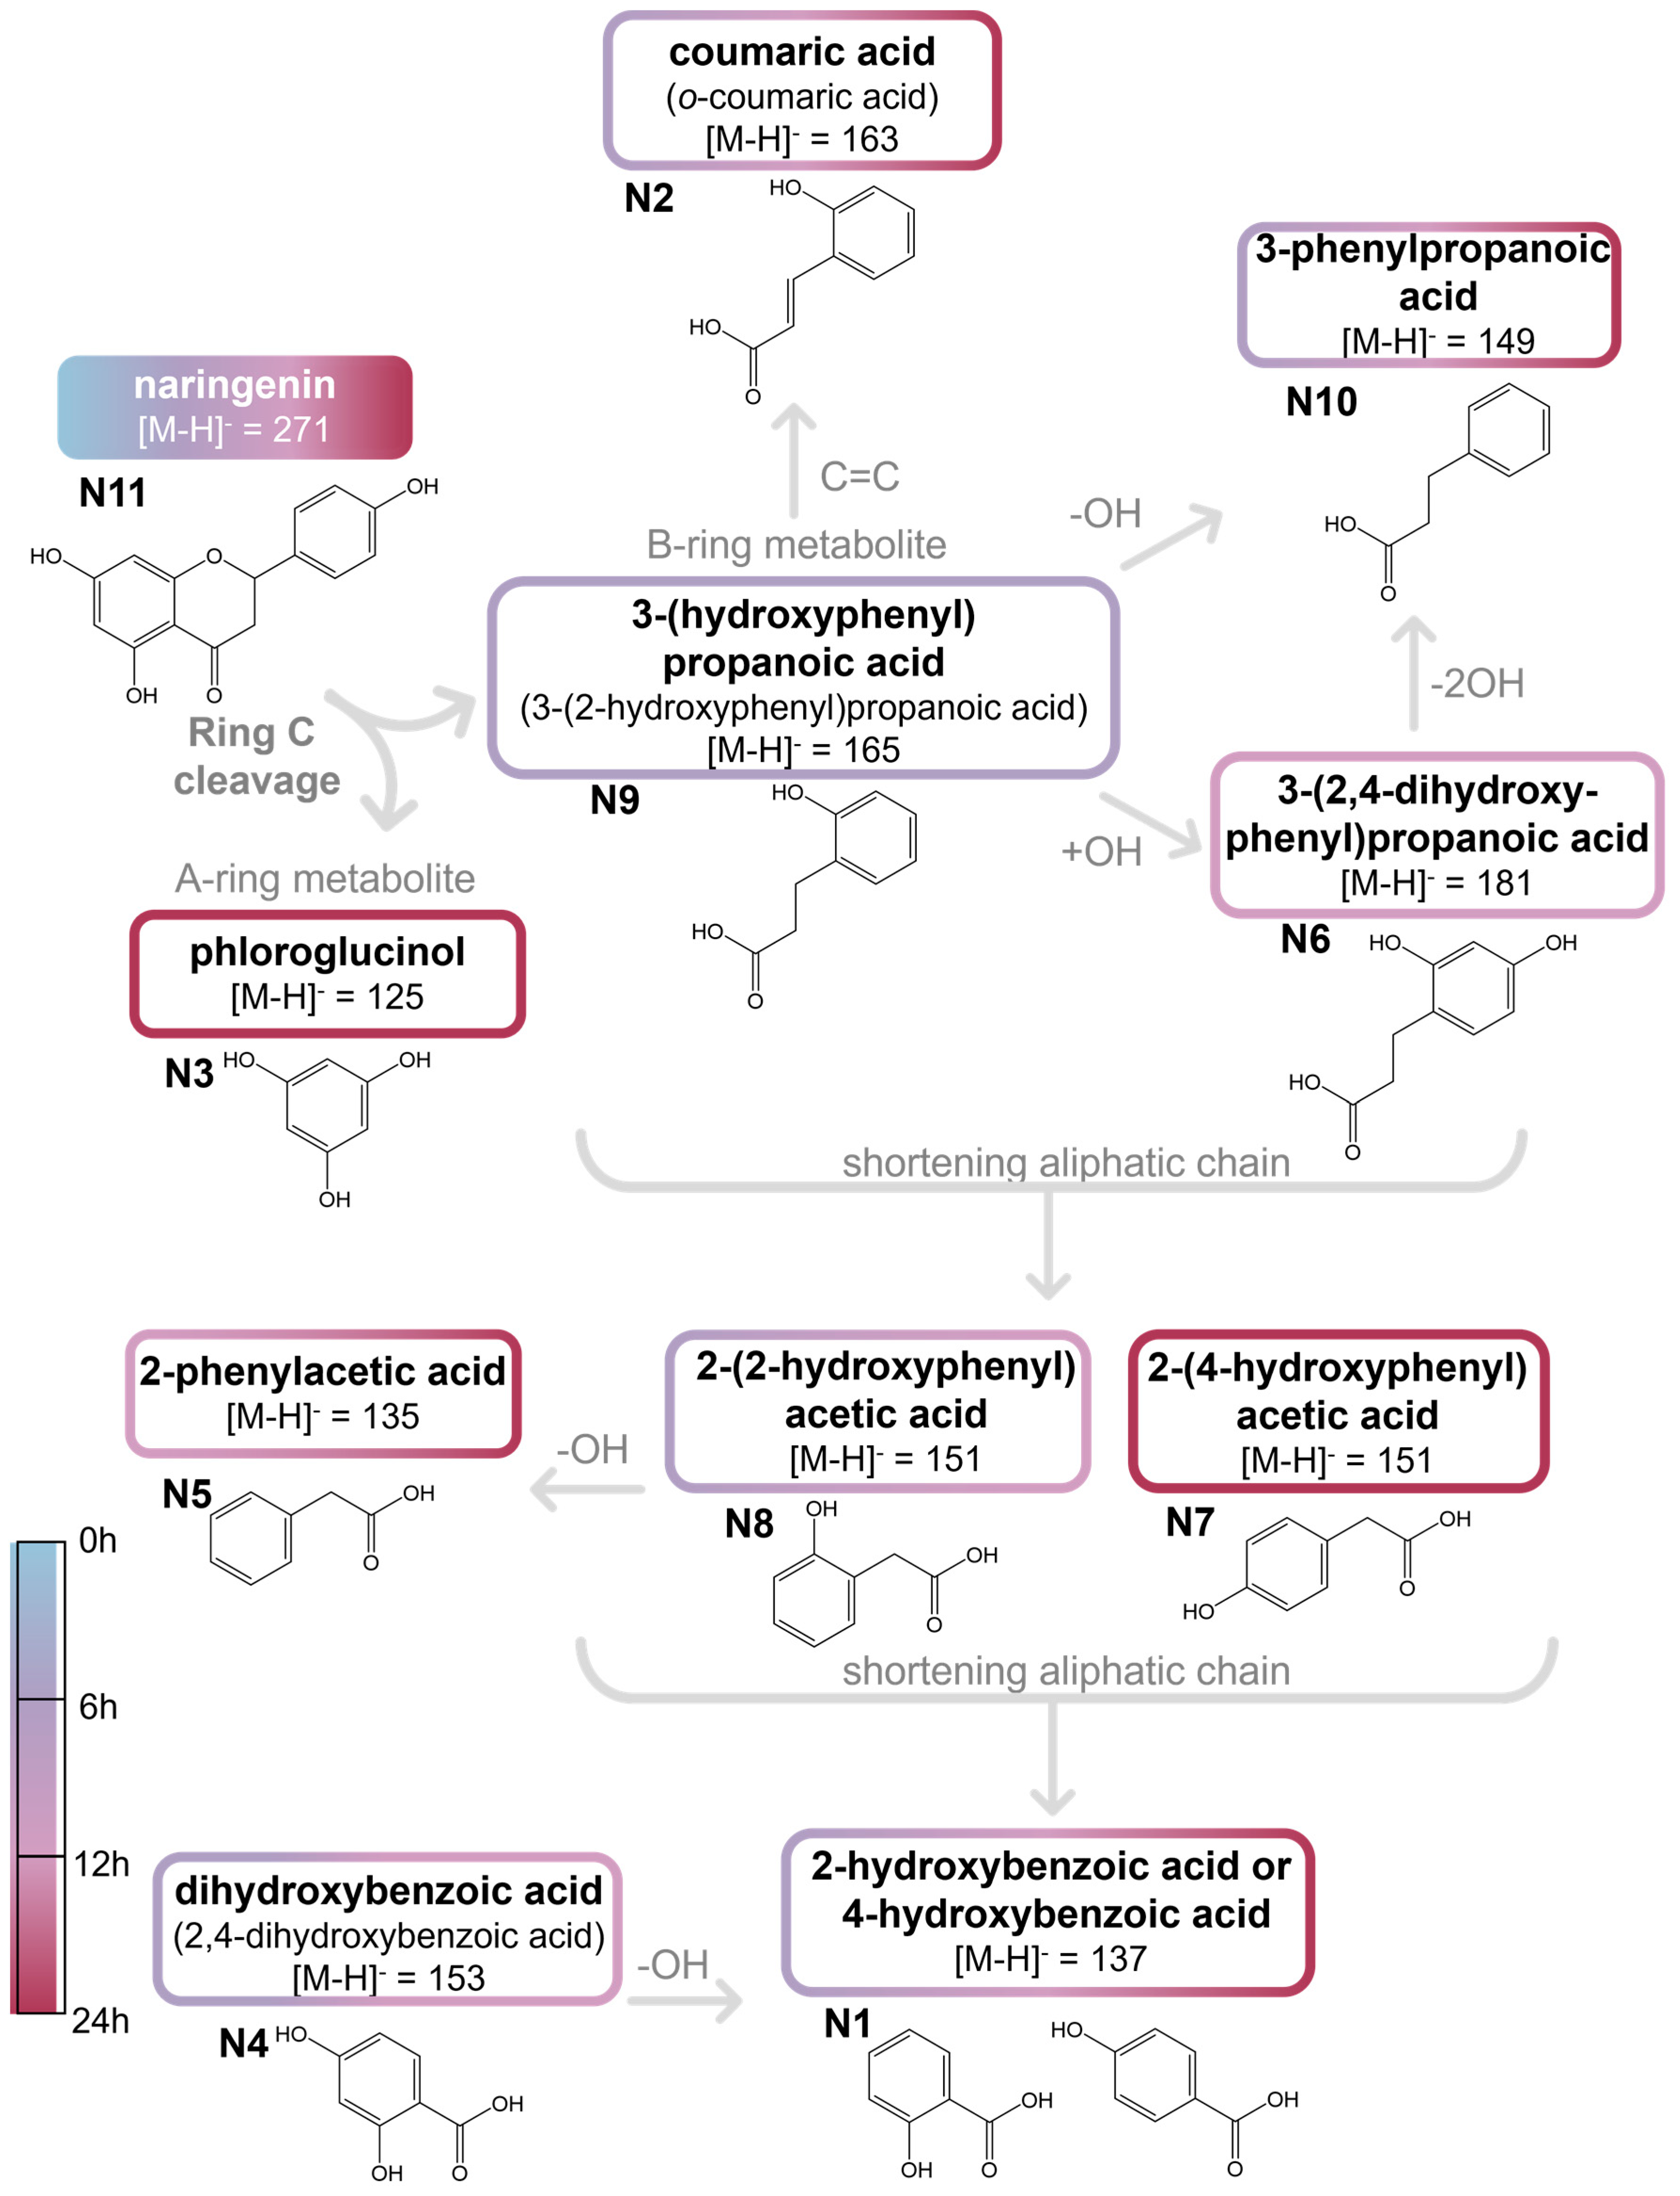
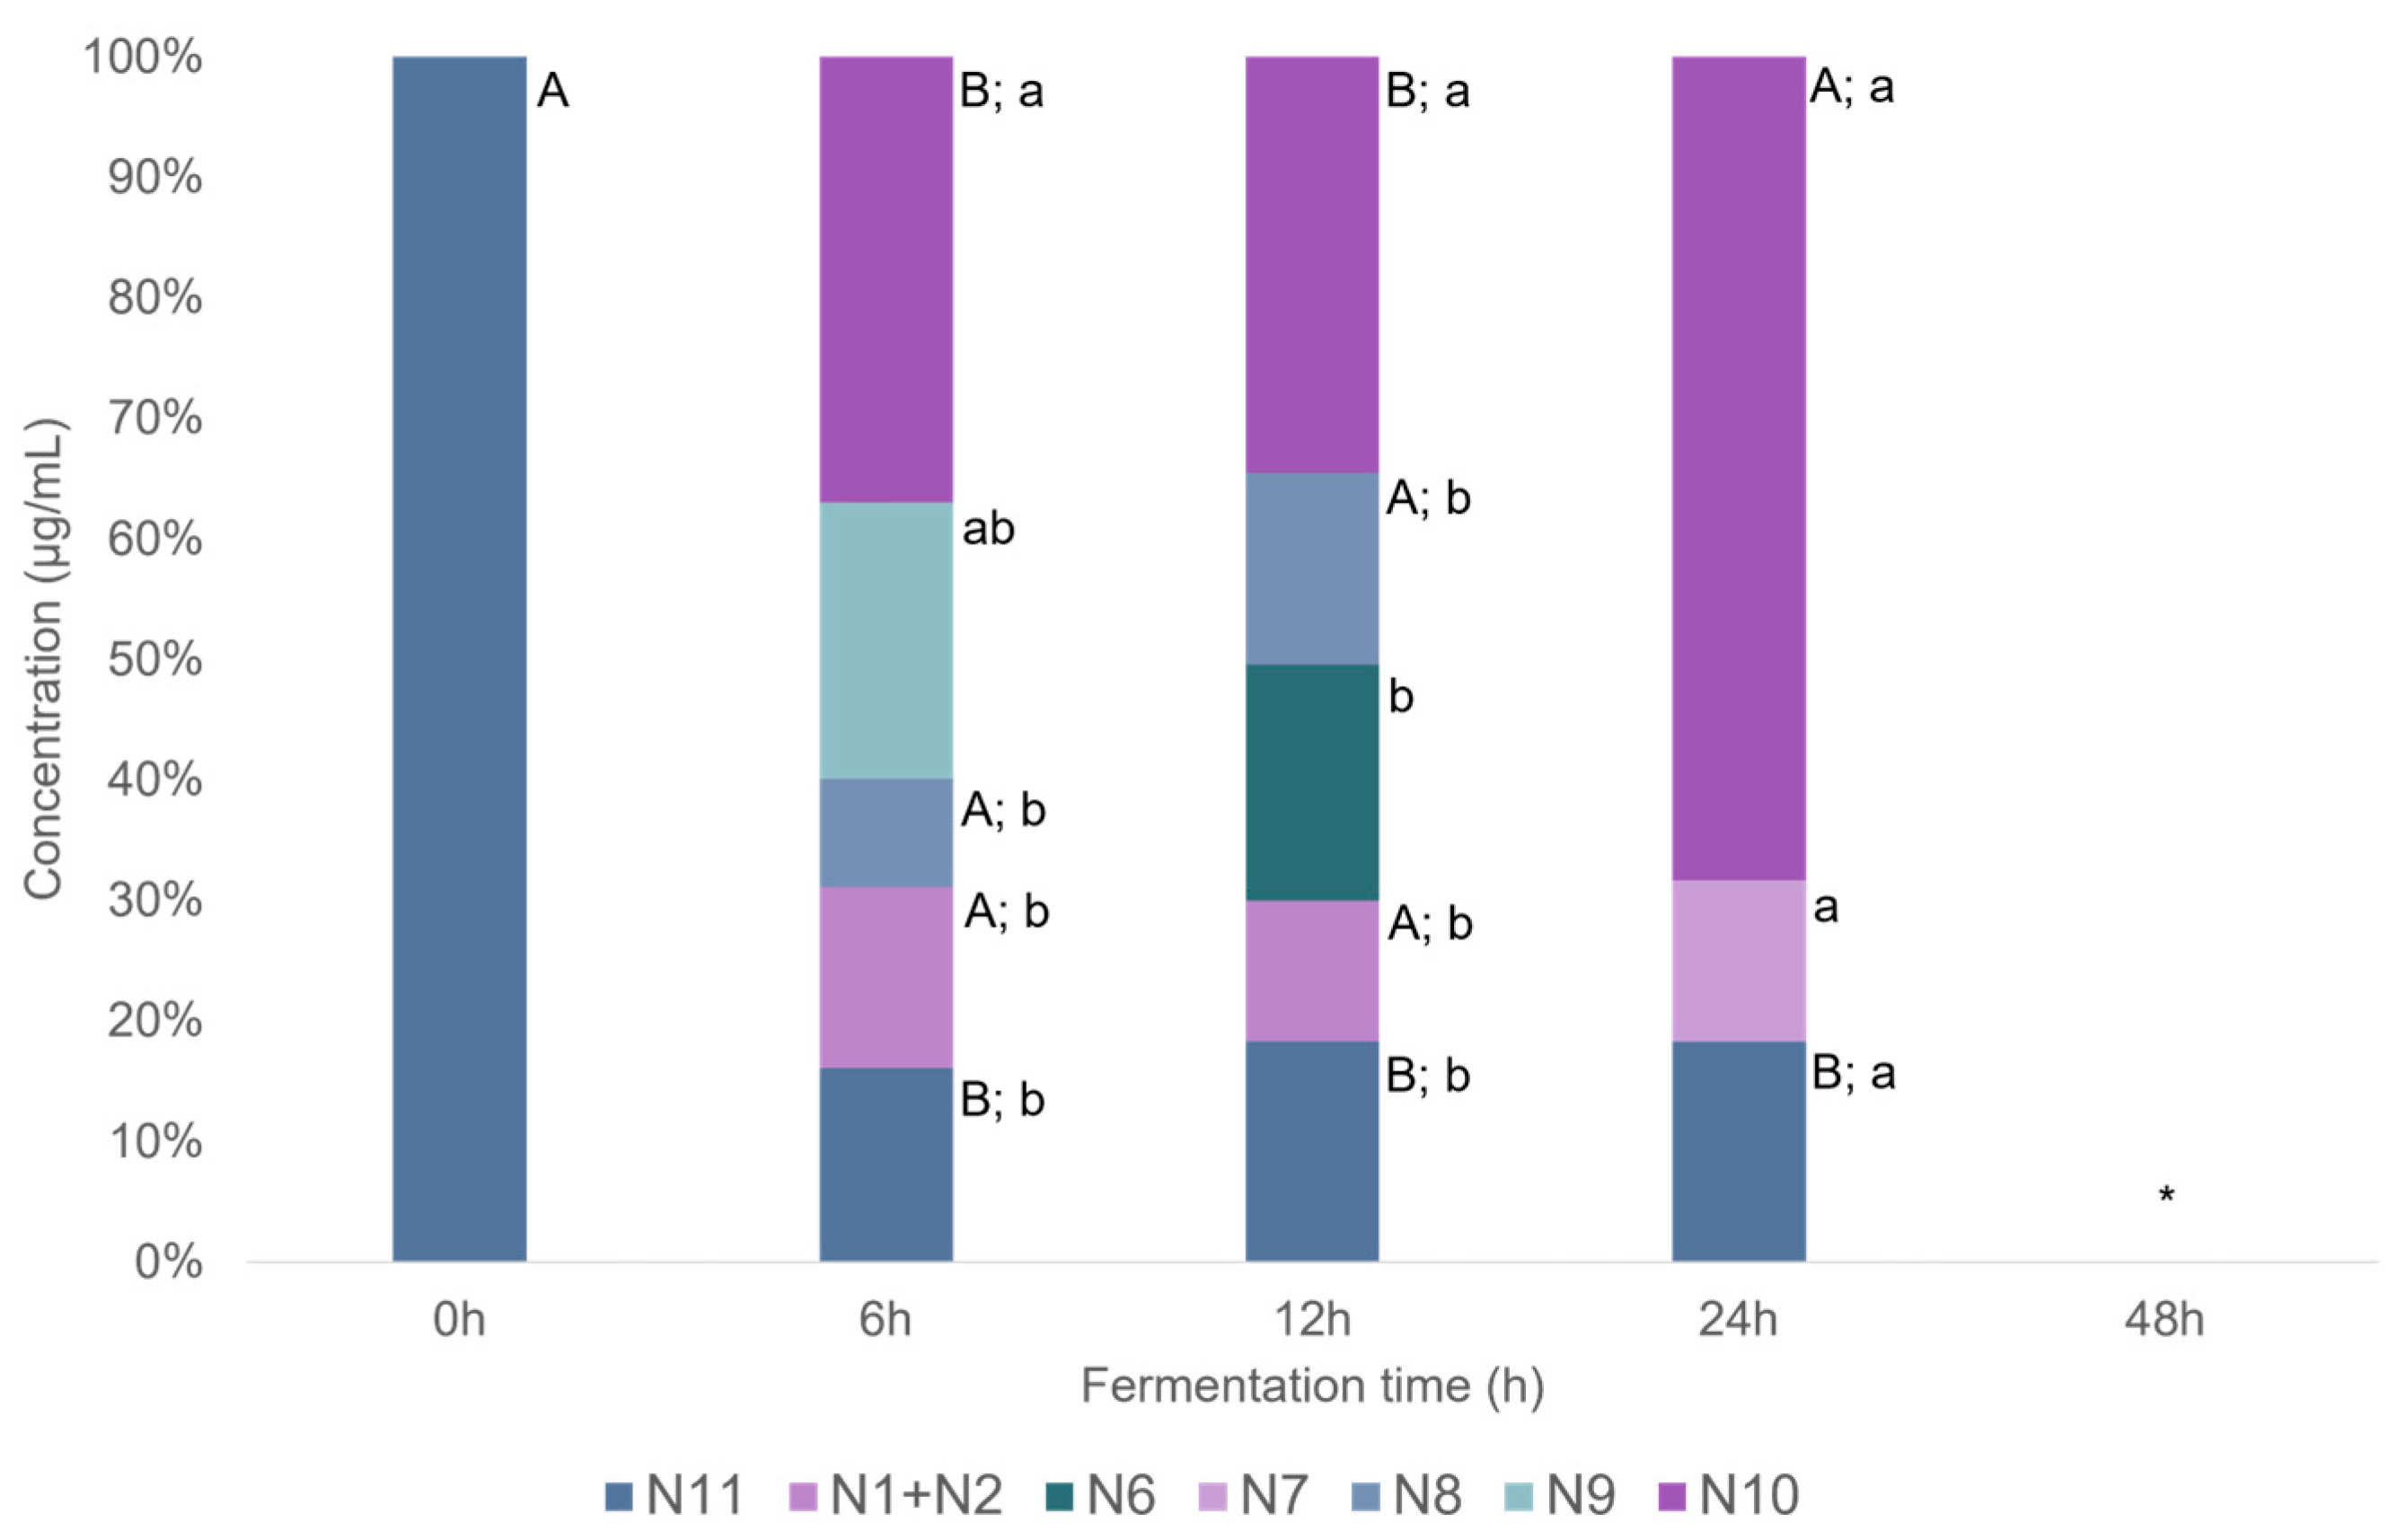
UHPLC-DAD-MS2 analysis of naringenin samples after incubation with human feces allowed to detect 10 metabolites, namely N1, N2, N3, N4, N5, N6, N7, N8, N9, and N10 (Figure 3 and Figure 4). Significant differences (p < 0.05, Summary Statistical Tables S8–S14) concerning the concentration of each compound throughout the fermentation period were determined by one-way ANOVA followed by Tukey’s post hoc test, except for N10 (naringenin) which did not follow a normal distribution and was therefore assessed using the Kruskal–Wallis test. Regarding differences among the phenolic compounds at each fermentation time, only for the samples collected at 24 h, was the Kruskal–Wallis test applied, as those samples did not follow a normal distribution. For the remaining samples, significant differences were evaluated by one-way ANOVA with Tukey’s post hoc test.
Metabolites N1 and N2 were identified as hydroxybenzoic acid and coumaric acid isomers, respectively, based on their [M-H] ions at m/z 137 and 163, respectively. Further, the MS2 fragmentation profile of hydroxybenzoic acid, which shows the loss of carboxyl group, yielding the ion at m/z 93, did not allow precise identification of the hydroxy group position; therefore, the compound could correspond to either 2-hydroxybenzoic or 4-hydroxybenzoic acid [66] (Figure 3).
Compound N2 showed MS2 product ions at m/z 135 ([M-H-CO]) and 119 ([M-H-CO2]), which matched those of the p-coumaric acid standard, although with a different retention time. Thus, compound N2 was tentatively identified as a p-coumaric acid isomer, namely o-coumaric acid, following the pathway proposed in Figure 3. Moreover, in the literature, 4-hydroxybenzoic acid has already been reported as a metabolite of naringin (naringenin-7-O-rhamnoglucoside) metabolism by the gut microbiota, being first converted into its corresponding aglycone (naringenin) [67].
Compound N3 was identified as phloroglucinol (Figure 3) based on the comparison of its retention time, UV spectrum, [M-H] at m/z 125, and MS2 fragmentation profile with those of the standard compound. Similarly, compound N4 was assigned as a dihydroxybenzoic acid derivative, due to the coincident [M-H] ion at m/z 153 and the product ion at m/z 125 ([M-H-CO]) with those of 3,4-dihydroxybenzoic acid standard compound. However, since the retention time differed, compound N4 was tentatively identified as 2,4-dihydroxybenzoic acid (Figure 3). Nevertheless, the literature reports only 3,4-dihydroxybenzoic acid as a naringenin metabolite [21].
Compounds N5 and N10 were proposed to correspond to 2-phenylacetic and 3-phenylpropanoic acids (Figure 3), respectively, based on their [M-H] ions (at m/z 153 and 149, respectively) and their MS2 product ions [68,69].
Compound N6 was identified as 3-(2,4-dihydroxyphenyl)-propanoic acid (Figure 3), with its [M-H] ion at m/z 181 and MS2 product ion at m/z 137, corresponding to the loss of a carboxyl group, consistent with the authentic standard compound.
The observed fragmentation pathways, UV spectra and retention times of compounds N7 and N8, were consistent with those of 2-(4-hydroxyphenyl)acetic and 2-(2-hydroxyphenyl)-acetic acids standards, respectively (Figure 3).
Compound N9 was assigned to 3-(hydroxyphenyl)propanoic acid (Figure 3), based on its [M-H] ion at m/z 165 and MS2 product ion at m/z 147 ([M-H-H2O]). Since its retention time did not match that of 3-(4-hydroxyphenyl)propanoic acid, the hydroxy group is likely positioned differently, probably corresponding to 3-(2/3-hydroxyphenyl)propanoic acid.
Finally, compound N11 corresponds to the precursor naringenin (Figure 3), which was identified based on its retention time, UV spectrum, [M-H] at m/z 271 and its characteristic product ions, matching those of the standard compound.
Considering the pathway proposed in Figure 3, the first step in naringenin transformation by the gut microbiota appears to be the C-ring cleavage, as N9 was detected after 6 h of fermentation (Figure 4). This finding is consistent with the transformation observed by other authors [21,70]. Phloroglucinol, also detected in the present study (although below the limit of quantification), has been proposed as the complementary metabolite of this C-ring cleavage. Further, N10 was detected after 6 h of fermentation and persistent throughout the fermentation process, reaching its maximum concentration at 24 h (2.0 ± 0.14 µg mL−1). In fact, 3-(hydroxyphenyl) propanoic acid (N9) and 2-(hydroxyphenyl)propanoic acid (N7 and N8) are two of the main products of naringenin metabolism, as reported by Serra et al. [21]. Naringenin transformation by the human gut microbiota appears to occur primarily within the first 24 h of fermentation. This was also observed when naringin was incubated with human faces being first converted to naringenin and subsequently to lower molecular weight metabolites, within the first 24 h of fermentation [71].
The gut microbiota metabolism of naringenin has been proposed to occur through a four-step pathway [12,38]. Initially, the C-ring of naringenin is cleaved, yielding naringenin chalcone via chalcone isomerase, which is subsequently reduced to the dihydrochalcone phloretin by an enoate reductase. These enzymes have been previously purified from Eubacterium ramulus and Clostridium orbiscindens [38,40]. However, these two metabolites were not detected in the present study, possibly due to their rapid transformation into downstream metabolites, remaining below the detection limit. Following these two first reported steps of naringenin metabolism, two main groups of metabolites are formed, derived from the A- and B-rings after C-ring cleavage (Figure 3) [12,21,70]. At this stage, phloretin is converted by phloretin hydrolase (already isolated from E. ramulus) into 3-(4-hydroxyphenyl)propanoic acid and phloroglucinol (N3) originating from the B- and A-rings, respectively [41,70]. C. orbiscindens is another bacterial strain capable of generating both A-ring and B-ring metabolites [40].
3-(4-Hydroxyphenyl)propanoic acid has been described as the major gut microbiota metabolite of naringenin [21,70]. However, the compound detected in the present study appears to be an isomer of this metabolite, with the hydroxy group located at a different position. Although this metabolite has not been reported previously, two possible pathways could account for this transformation. The first one involves the isomerization of 3-(4-hydroxyphenyl)propanoic acid, derived from the B-ring fragment of naringenin, resulting in a hydroxy group positioned, for example, at positions 2 or 3. An alternative pathway involves the dehydroxylation of 3-(2,4-dihydroxyphenyl)propanoic acid, N6, one of the remaining metabolites identified in this study and previously reported as a naringenin metabolite [21]. However, since 3-(2,4-dihydroxyphenyl)propanoic acid was detected at 12 h of fermentation and 3-(hydroxyphenyl)-propanoic acid (N9) appeared at 6 h, this hypothesis seems unlikely.
As illustrated in Figure 3, the subsequent successive transformations of hydroxyphenylpropanoic acid occurred through dehydroxylation and β-oxidation, resulting in the formation of phenolic acids with shorter aliphatic side acids. These include hydroxyphenylacetic (N7 and N8) and hydroxybenzoic acids (N1), as previously reported [14,21,72].

2.2.3. Phloroglucinol and Metabolites from In Vitro Batch Fecal Fermentation

The UHPLC-DAD-MS2 analysis of phloroglucinol after gut microbiota fermentation enabled the identification of two resulting metabolites: compounds P2 and P3. Significant differences (p < 0.05, Summary Statistical Tables S15–S21) concerning the concentration of each compound throughout the fermentation period as well as among the different phenolic compounds at each time point, were evaluated by the Kruskal–Wallis test. The homogeneity of variance for P1 and P2 was not verified across samples during fermentation and the data for the different phenolic compounds at each time did not follow a normal distribution. Only for the determination of significant differences in P3 during the fermentation time, the one-way ANOVA with Tukey’s post hoc test was used.
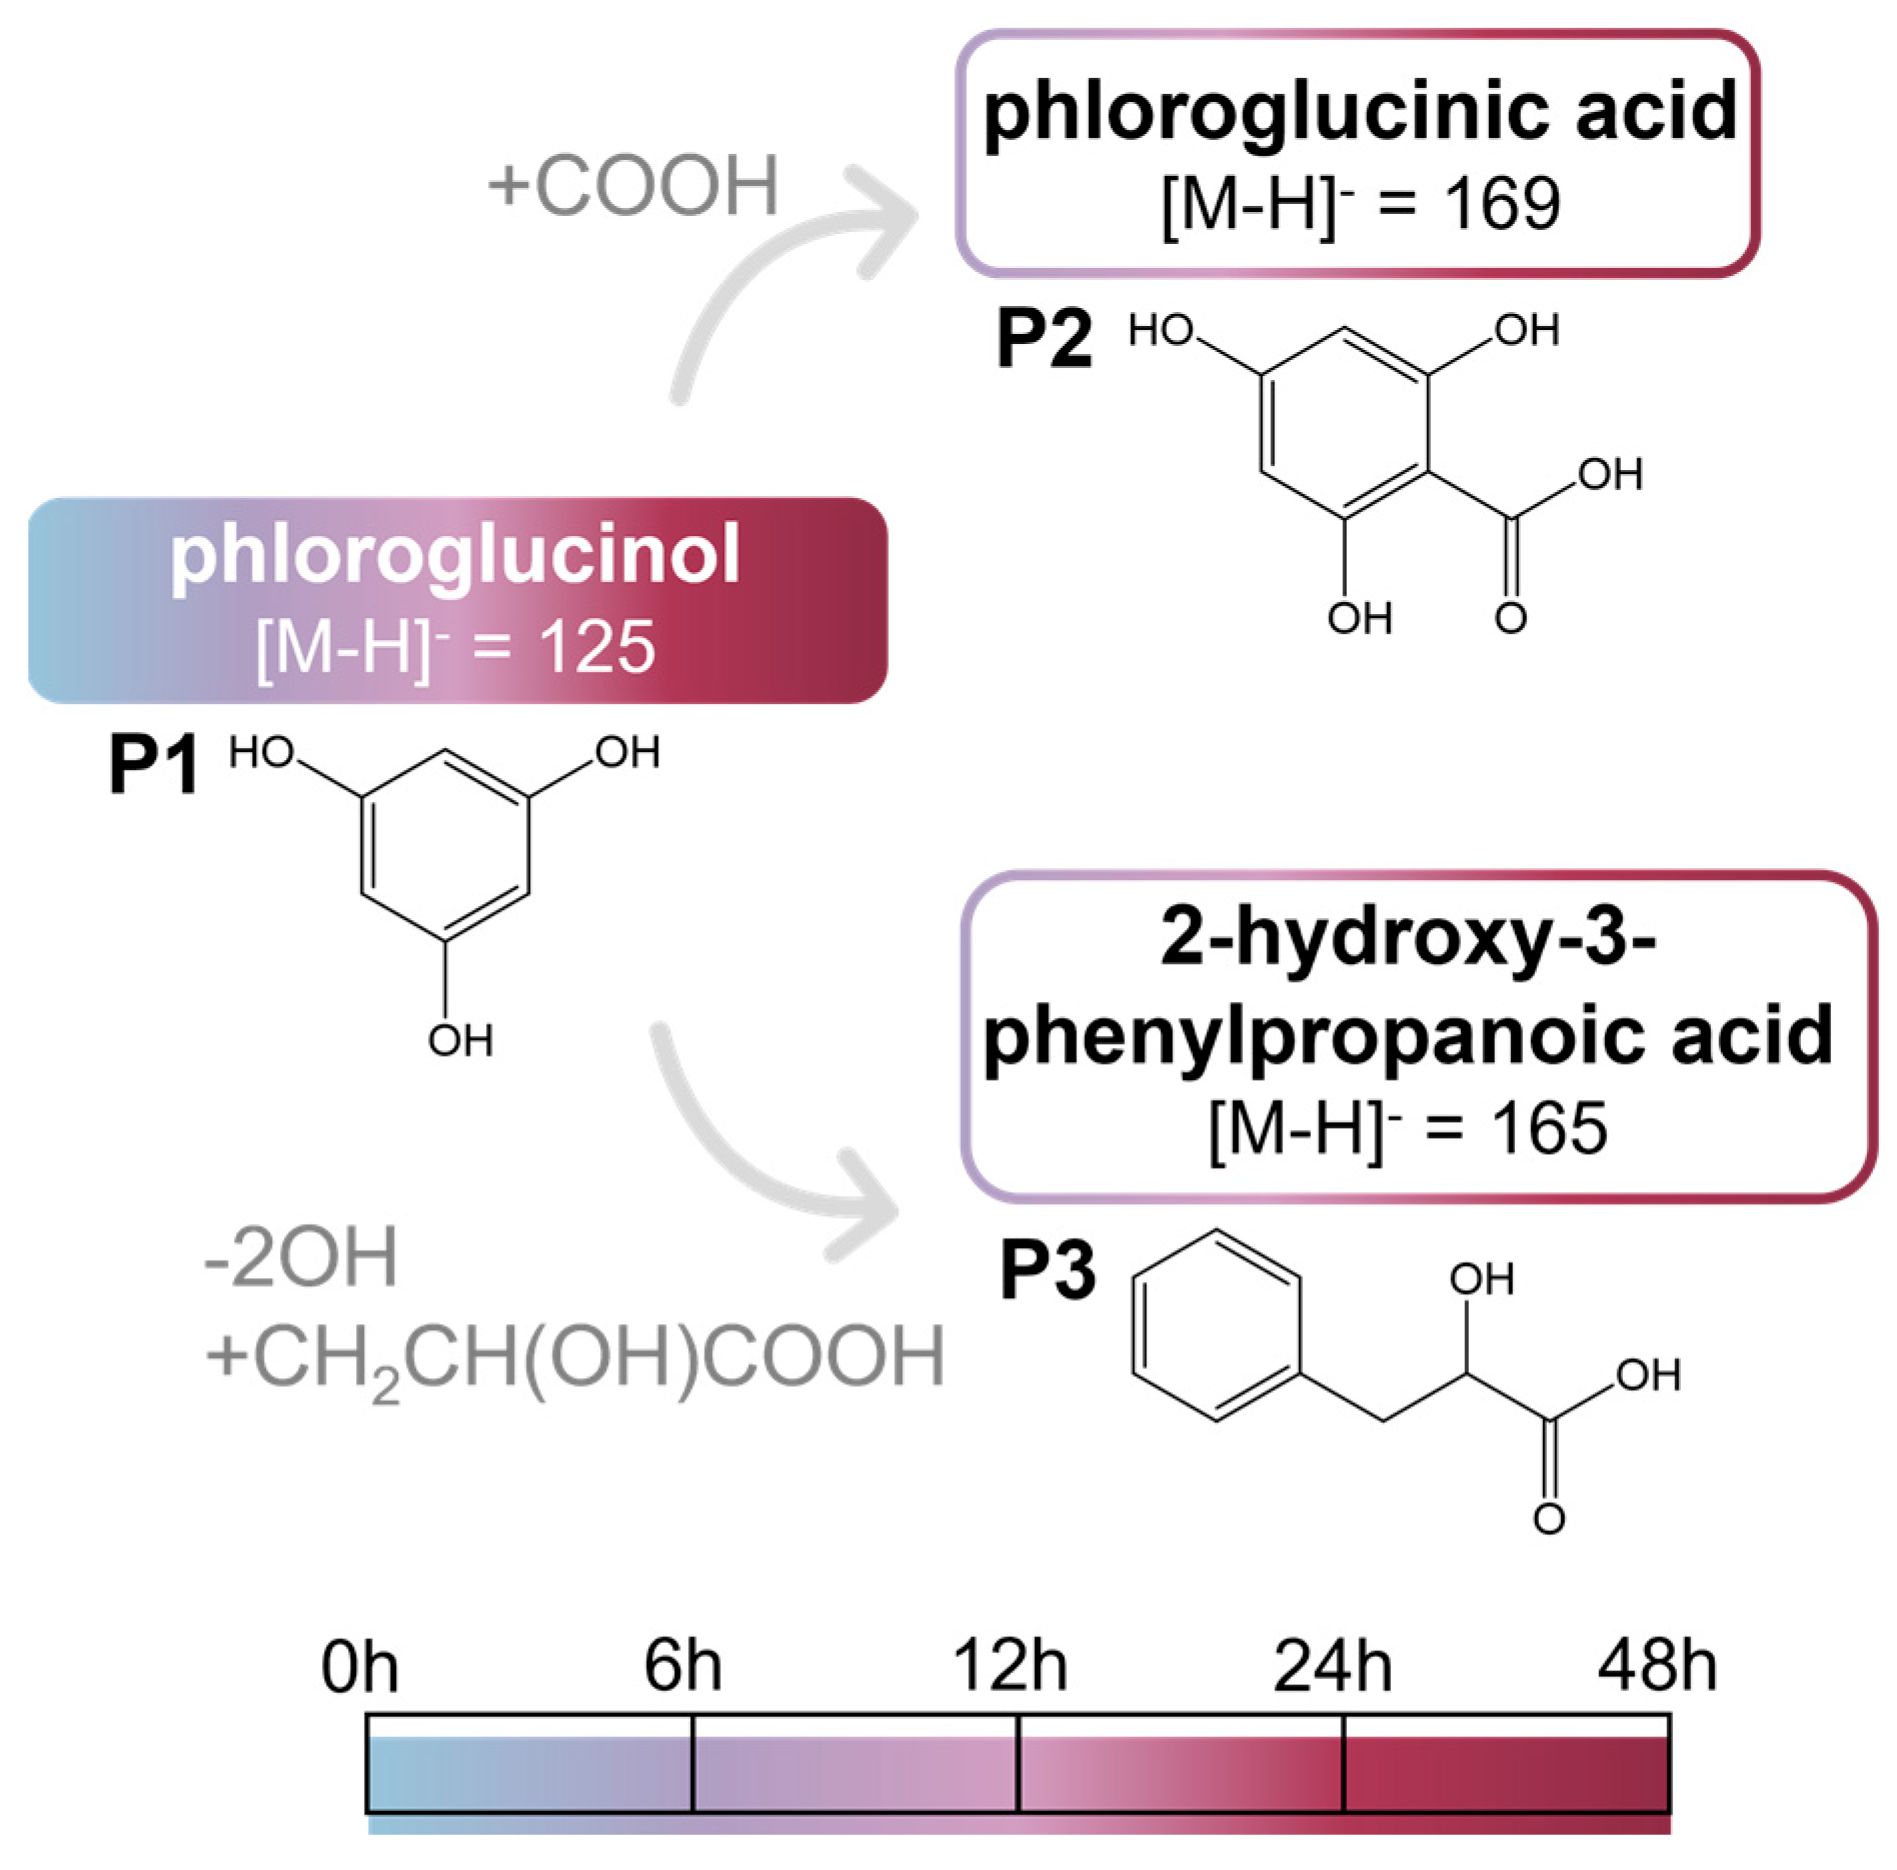
Compound P1 was identified as phloroglucinol (Figure 5) based on its retention time, UV spectrum, [M-H] at m/z 125, and the respective product ions, which were coincident with those of the standard compound.
To the best of our knowledge, this is the first study reporting these compounds as gut microbiota metabolites resulting from phloroglucinol transformation. Compound P2 was identified as phloroglucinic acid (Figure 5) based on its [M-H] ion at m/z 169 and its MS2 product ions at m/z 151 ([M-H-H2O]), 141 ([M-H-CO]), 125 ([M-H-CO2]). Compound P3 was assigned as 2-hydroxy-3-phenylpropanoic acid (Figure 5) based on its [M-H] ion at m/z 165, which upon fragmentation yielded product ions at m/z 147 ([M-H-H2O]) and 121 ([M-H-CO2]).
Furthermore, complementing the UHPLC-DAD-MS2 results, the GC-MS analysis of phloroglucinol samples collected at 0, 24, and 48 h of fermentation, allowed the identification of four metabolites resulting from phloroglucinol transformation by gut microbiota, as shown in the chromatograms and mass spectra in Figure S6 (Supplementary Material). In addition to compounds P2 (phloroglucinic acid) and P3 (2-hydroxy-3-phenylpropanoic acid), both detected in 24 and 48 h samples, the GC-MS analysis also allowed to identify 3-phenylpropanoic acid and 2-phenylacetic acid, both detected in samples after 48 h of fermentation.
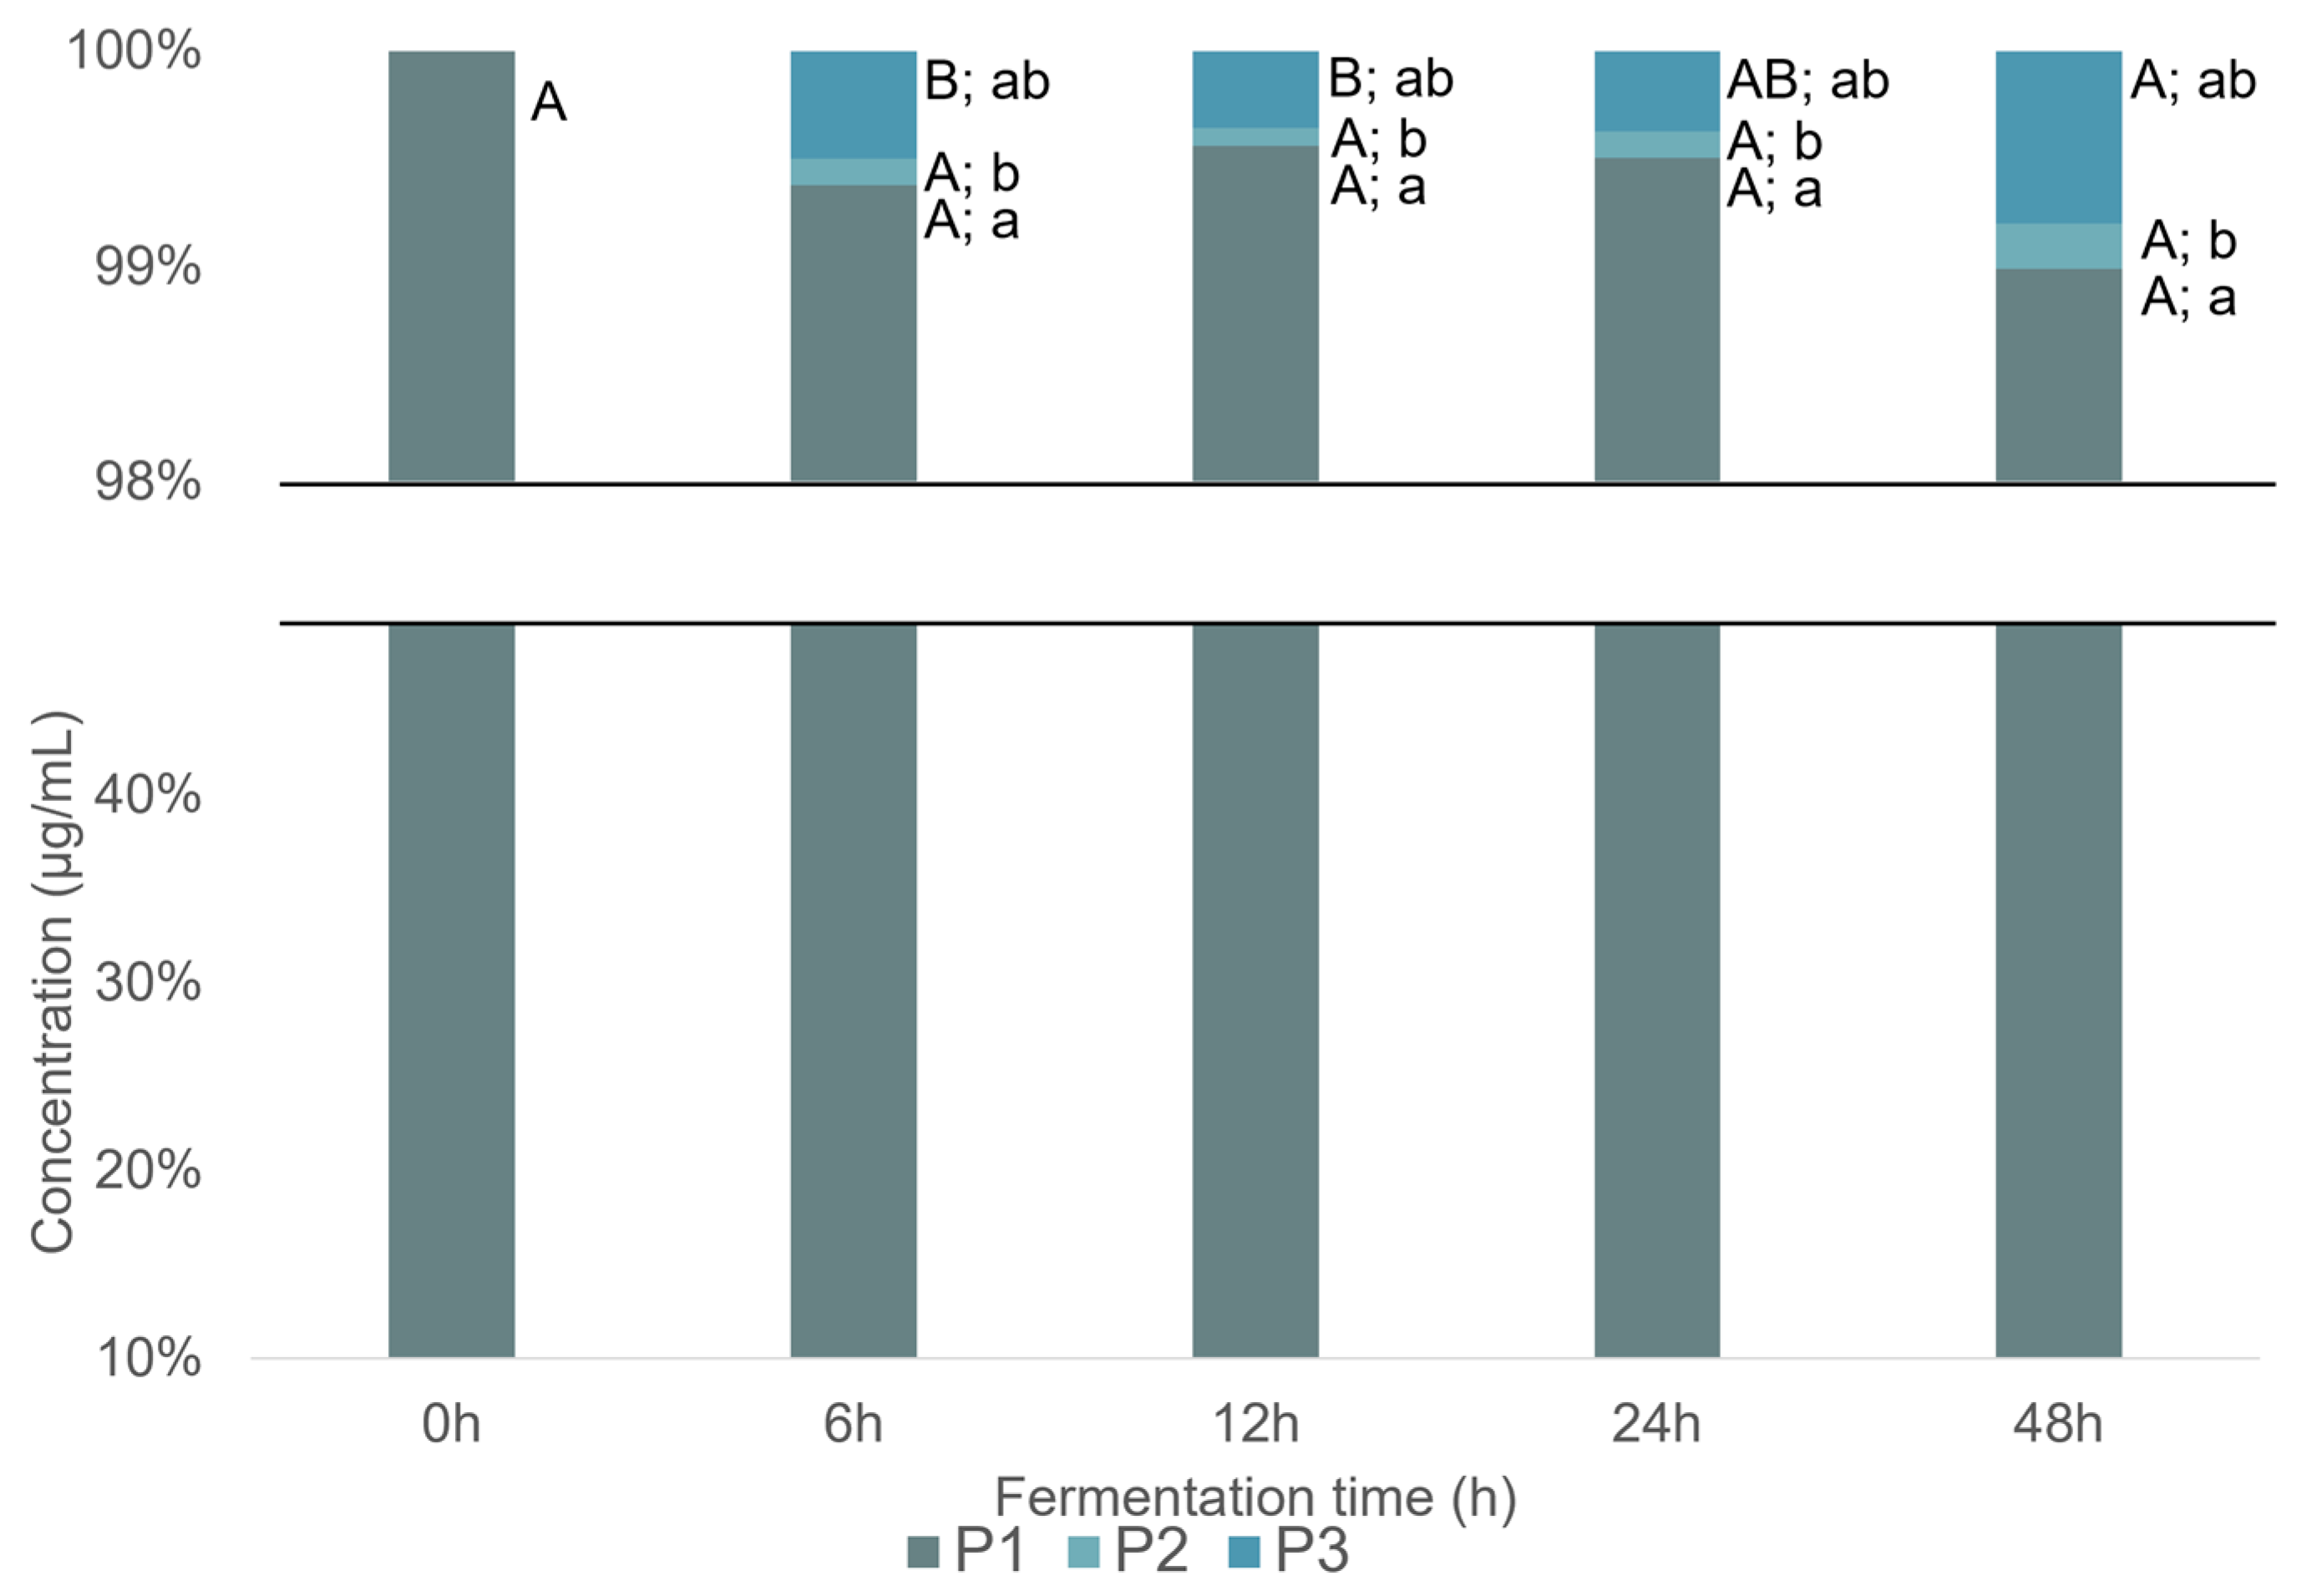
Phloroglucinol (P1) was detected in all samples collected during fermentation (Figure 6), indicating that it was not completely metabolized. Based on the UHPLC-DAD-MS2 results, P2 and P3 were detected after 6 h of fermentation. The concentration of P2 did not change significantly over time (0.60 ± 0.06 µg mL−1 and 0.70 ± 0.06 µg mL−1, at 6 h and 48 h, respectively), whereas P3 concentration showed a significant increase after 24 h of fermentation (Figure 6), reaching about 4.4 ± 0.53 µg mL−1 at 48 h. Despite the formation of these metabolites, the concentration of P1 during the fermentation showed only minor, statistically insignificant variations (Figure 6). This could be attributed to the initially higher concentration of P1compared to that of the detected metabolites.
As mentioned before, to the best of our knowledge this is the first study describing the metabolites of phloroglucinol by the human gut microbiota. Krumholz et al. [51] showed that Eubacterium oxidoreducens (isolated from the rumen) is capable of transforming gallic acid into phloroglucinol, which is subsequently metabolized into 3-hydroxy-5-oxohexanoate. Moreover, the gut microbiota metabolism of phlorotannins, found in some edible seaweeds, has not yet been investigated. So far, only the effects of phlorotannin enriched extracts from Fucus vesiculosus and from Silvetia compressa on human gut microbiota have been studied [73,74].
Phloroglucinol has been identified as a gut-derived metabolite of several flavonoids, such as naringenin, luteolin, kaempferol, and quercetin, among others, and it appears to be one of the lowest-molecular-weight metabolites, resulting in an A-ring fragment from C-cleavage, as mentioned before [21,39,67,75]. The amount of phloroglucinol produced during such fermentation is often below the limit of detection [21], thereby hindering further investigation of its metabolic fate in the large intestine in the presence of gut microbiota. As a low-molecular-weight compound, phloroglucinol would be expected to be readily absorbed and to reach the circulatory system. However, in this study, it was demonstrated that isolated phloroglucinol undergoes biotransformation by the human gut microbiota.
Phloroglucinic, 2-hydroxy-3-phenylpropanoic, 3-phenylpropanoic, and 2-phenylacetic acids are four phenolic acids belonging to benzoic phenyllactic, phenylpropanoic and phenylacetic acids subclasses, respectively, which are structurally related to gut microbiota metabolites of flavonoids [21,39,67,75].

3. Materials and Methods

3.1. Materials

The reagents used in this study are listed in Table 1.

3.2. Preliminary Screening of Antimicrobial and Prebiotic Effects of Phenolic Compounds

Five phenolic compounds previously studied in terms of bioaccessibility and intestinal absorption (ellagic acid, quercetin, naringenin, naringin, and phloroglucinol) [48] were solubilized in pure DMSO and then 4% (v/v) DMSO; growth medium solutions were used to evaluate their antimicrobial and/or prebiotic effect [76,77,78]. Mueller Hinton broth (MHB) and MRS media were used for pathogenic (Escherichia coli and Salmonella enterica) and probiotic strains (Bifidobacterium animalis subsp. lactis BB-12 and Lactobacillus casei LC1), respectively. Thus, 200 μL of each 4% (v/v) DMSO phenolic compound solution, previously filtered (0.22 μm Ø sized), was added in each well of 96-well microplate, to reach a range of final concentrations between 25 and 1600 μg mL−1 (except for ellagic acid, which was 12.5–200 μg mL−1, due to its low solubility). Then, the inoculum of each bacterial strain was also added (10 μL). As well as two negative (one with only the respective medium and the other with the phenolic compounds solution (4% (v/v) DMSO), at the higher concentration) and one positive (corresponding to the respective inoculum and medium) controls were performed. For pathogenic bacterial strains, the incubation time was 24 h at 37 °C, whereas for probiotic strains, it was 48 h at 37 °C (under an anaerobic environment using paraffin only to BB-12). Cell growth was monitored by measuring the optical density at 600 nm (OD600 nm) of the test culture, against the OD of the bacteria used alone as the control. All experiments were conducted in triplicate.

3.3. In Vitro Fermentation Assays

3.3.1. Pool of Human Fecal Inoculum

According to the methodology developed by Carvalho et al. [79], fresh feces from five healthy human donors (2 women and 3 men) were collected into sterile plastic vases, maintaining anaerobic conditions, before being used (maximum of 2 h). Before their participation in the study, all subjects provided informed consent. Prior to collection, the donors were required to demonstrate that they met the following criteria: they were healthy, aged between 18 and 65, had not experienced any food intolerances, and had not taken any probiotic, prebiotic, or antibiotic supplements within the previous six months.
To ensure uniformity and representativeness, similar amounts of each donor fecal sample were pooled together. Subsequently, the fecal inoculum pool was diluted at a concentration of 10% (w/w) in phosphate-buffered saline (PBS) solution (0.1 M, pH 7.4) and subjected to homogenization in a stomacher for a period of two minutes at a rate of 460 paddle-beats per minute [79].

3.3.2. Fermentation Media

As previously described by Campos et al. [80], the nutrient base medium (NBS) used was constituted by trypticase soya broth (TSB) without dextrose (5.0 g L−1), bactopeptone (5.0 g L−1), yeast nitrogen base (5.0 g L−1), cysteine-HCl (0.5 g L−1), 1.0% (v/v) of salt solution A (100.0 g L−1 NH4Cl, 10.0 g L−1 MgCl2·6H2O, 10.0 g L−1 CaCl2·2H2O), 0.2% (v/v) of salt solution B (200.0 g L−1 K2HPO4·3H2O), 0.2% (v/v) resazurin solution (0.5 g L−1), and 1% (v/v) trace minerals (ATCC, 10 mL L−1), dissolved in distilled water and the pH adjusted to 6.8. Then, NBS was capped and sterilized by an autoclave.

3.3.3. In Vitro Fermentation

Following sterilization, all components of fecal fermentation were placed in an anaerobic cabinet (5% H2, 10% CO2, and 85% N2). Previously to inoculation, phenolic compounds solutions in DMSO (ellagic acid and naringenin 10 mg mL−1 and phloroglucinol 20 mg mL−1) were added to tubes with NBS (4% DMSO) to achieve a final concentration of 100 and 200 μg mL−1 of ellagic acid, 200 and 400 μg mL−1 of naringenin, and 200 and 800 μg mL−1 of phloroglucinol. Then, each tube was inoculated with fecal slurry (final concentration of 2% (v/v)) and incubated at 37 °C for 48 h without agitation [79,80]. Negative (only fecal inoculum) and positive (with a well-known prebiotic, fructooligosaccharides (FOS) controls were also carried out, as well as a respective control of each phenolic compound at 200 μg mL−1 with inoculum. To ensure that fermentation assay conditions were not perturbed or interrupted, individual tubes were prepared for each compound, allowing sample collection at 0, 6, 12, 24, and 48 h of fermentation and immediately centrifuged at 16,000× g for 5 min. Both resulting pellet and supernatants were stored at −80 °C, the pellet conserved for genomic DNA extraction, whereas the supernatants were stored for further identification and quantification of phenolic compounds and resultants metabolites analysis. All the experiments were conducted in triplicate.

3.4. Analysis of Phenolic Compounds and Their Metabolites

3.4.1. Qualitative and Quantitative UHPLC-DAD-MSn Analysis

Fermentation samples were freeze-dried, solubilized in methanol and filtered through a 0.2 μm PTFE syringe filter before injection (20 µL) in a UHPLC system equipped with a variable loop Accela autosampler (set at 16 °C), an Accela 600 LC pump, and an Accela 80 Hz photodiode array detector (DAD) (Thermo Fisher Scientific, San Jose, CA, USA). The column used for separation was a Hypersil Gold C18 (100 mm × 2.1 mm × 1.9 μm) column protected with a pre-column (10 mm × 2.1 mm × 1.9 μm), both supplied by ThermoFisher (Thermo Fisher Scientific, San Jose, CA, USA). The mobile phase was composed of acetonitrile (A) and water:acetonitrile (99:1, v/v) (B), each containing 0.1% (v/v) of formic acid. The gradient elution was carried out with a flow rate of 0.4 mL min−1, at 40 °C, for 29 min, as follows: 0–1 min: 99% B; 1–17 min: 99–73% B, 17–20 min: 73–0% B, 20–25 min: 0–99% B, followed by re-equilibration of the column at 99% B for 4 min. The 200–600 nm UV spectra were recorded, and chromatograms were also obtained at 270, 285 and 370 nm.
An LCQ Fleet ion trap mass spectrometer (ThermoFinnigan, San Jose, CA, USA) was coupled to the UHPLC system with an electrospray ionization (ESI) source, operating in negative mode, as previously described by Santos et al. [81]. The analysis was carried out with the following conditions: spray voltage of 5 kV; capillary temperature 360 °C; capillary and tune lens voltages at −28 V and −115 V, respectively; CID-MSn experiments in the range of m/z 100–1500; collision energy from 15 and 45 (arbitrary units), using helium as collision gas. The data acquisition was carried out by using Xcalibur® data system 4.0.27.19 (ThermoFiningan, San Jose, CA, USA).
Ellagic acid, naringenin, phloroglucinol, and several other standard compounds, representative of identified metabolites, were solubilized in HPLC-grade methanol with at least five concentrations to obtain standard curves. The quantification of each phenolic compound and identified metabolites was carried out through the corresponding linear regression equation or that of the most similar standard compound (Table S1, Supplementary Material).

3.4.2. Qualitative GC-MS Analysis

Fermentation samples were filtered through a 0.2 μm nylon syringe filter before being freeze-dried. Before GC-MS analysis, these dried samples were dissolved in 50 µL pyridine. Further, 250 µL of N,O-bis(trimethylsilyl)trifluoro-acetamide, and 50 µL of trimethylchlorosilane were added, standing at 70 °C for 30 min, in order to convert the compounds containing hydroxyl and carboxyl groups into trimethylsilyl (TMS) ethers and esters, respectively [82,83].
After derivatization, the samples were analyzed by GC-MS following previously described methodologies [83] on a GC-MS-QP2020 NX (Shimadzu, Columbia, MD, USA) equipped with a DB-5 J&W capillary column (30 m × 0.32 mm inner diameter, 0.25 µm film thickness). The carrier gas used was helium (40 cm s−1). The chromatographic conditions were as follows: initial temperature, 80 °C for 5 min; temperature gradient, 4 °C min−1; final temperature, 260 °C; temperature gradient 2 °C min−1; final temperature, 285 °C for 8 min; injector temperature, 250 °C; transfer-line temperature, 290 °C; and split ratio, 1:50. The mass spectrometer was operated in the electron impact mode with an energy of 70 eV, and data were collected at a rate of 1 scan s−1 over a range of m/z 33–700. The ion source was kept at 250 °C [83]. The data acquisition was carried out by using GC Solution 4.20 (Shimadzu, Columbia, MD, USA).
The identification of TMS derivatives was carried out by comparing their mass spectra with the GC-MS spectral library (NIST14) and by comparing their mass spectra with published data or by injection of the available standards.

3.4.3. Statistical Analysis

In the present study, statistical analysis was carried out using OriginPRO 2024 v10.1.0.170. We first checked whether the data followed a normal distribution. In cases where we confirmed a normal distribution, we assessed the homogeneity of variances using Levene’s test (p-value > 0.05).
For samples with normal distribution and homogeneous variance, a one-way ANOVA was employed to compare the concentration of each identified phenolic compound over fermentation time and the concentration of the identified compounds at each specific time. To determine a pairwise comparison of means, we applied Tukey’s post hoc test. However, we opted for the non-parametric Kruskal–Wallis test for cases where the data did not follow a normal distribution or when the homogeneity of variances was not confirmed, with the exception of the cases where only two groups were considered in statistical analysis, in which Mann–Whitney test U was applied
The variation in the sample number (n) can be attributed to two possible factors: first, the loss of some samples during the process of freeze-drying; and second, a variation in the replicate injections that were performed twice.

4. Conclusions

In this study, the gut microbiota metabolic pathways of ellagic acid, naringenin, and phloroglucinol were proposed. Naringenin and phloroglucinol metabolites produced by the gut microbiota, rather than by isolated bacterial strains, were investigated for the first time. An isomeric form of urolithin with a lower molecular weight (urolithin B) was identified for the first time as an ellagic acid metabolite in studies involving human fecal fermentation. Naringenin metabolites were generated through C-ring cleavage, yielding phloroglucinol and 3-(hydroxyphenyl)propanoic acid, which was subsequently metabolized into phenylpropanoic, phenylacetic, and benzoic acids.
The use of two chromatographic techniques (UHPLC-DAD-MSn and GC-MS) provided detailed insights into the phloroglucinol metabolic pathway, which includes phloroglucinic, 2-hydroxy-3-phenylpropanoic, 3-phenylpropanoic, and 2-phenylacetic acids. To the best of our knowledge, this is the first study identifying these metabolites as products of phloroglucinol fermentation by human gut microbiota.
Therefore, this study provides a valuable contribution to the understanding of phenolic compound metabolism by human gut bacteria, particularly regarding the metabolic pathways of naringenin and phloroglucinol. In the absence of a food matrix, the results must be interpreted cautiously to avoid overgeneralized conclusions. Nevertheless, these findings enhance our understanding of the complex interactions between phenolic compounds and gut microbiota. Furthermore, they lay the foundation for future studies focused on the biological activities and potential health benefits of these metabolites, which represent an essential step toward the development of effective phenolic compound-based nutraceuticals and pharmaceuticals.

Supplementary Materials

The supporting information can be downloaded at https://www.mdpi.com/article/10.3390/ijms262211009/s1. References [84,85,86] are cited in the supplementary materials.

Author Contributions

The authors’ contributions were as follows: A.C.S.P.: Writing—original draft, Investigation, Formal Analysis; T.B.R.—Investigation, Writing—review and editing, Validation; E.R.C.—Investigation, Writing—review and editing, Validation; M.M.P.: Writing—review and editing, Supervision, Funding Acquisition; A.J.D.S.: Writing—review and editing, Supervision, Funding Acquisition; S.A.O.S.: Writing—review and editing, Supervision, Funding Acquisition, Conceptualization. All authors have read and approved the final manuscript.

Funding

This work was developed within the scope of the project CICECO-Aveiro Institute of Materials, UID/50011/2025 (DOI 10.54499/UID/50011/2025) & LA/P/0006/2020 (DOI 10.54499/LA/P/0006/2020), financed by national funds through the FCT/MCTES (PIDDAC). CBQF was supported by the Fundação para a Ciência e a Tecnologia (FCT) through the project UID/50016/2025. Ezequiel R. Coscueta was supported by FCT through an Assistant Researcher contract (ref. 2023.08679.CEECIND/CP2855/CT0005). Acknowledgments are also due to FCT/MCTES for the PhD grant to ACSP (SFRH/BD/143348/2019) and for the research contract under Scientific Employment Stimulus to S. Santos (2021.03348.CEECIND).

Institutional Review Board Statement

Not applicable.

Informed Consent Statement

Informed consent was obtained from all subjects involved in the study.

Data Availability Statement

The original contributions presented in this study are included in the article/Supplementary Material. Further inquiries can be directed to the corresponding author.

Conflicts of Interest

The authors declare no conflicts of interest.

Abbreviations

The following abbreviations are used in this manuscript:
UHPLC-DAD-MSnUltra-high performance liquid chromatography with diode array detector coupled to an ion trap mass spectrometer
GC-MSGas chromatography coupled to mass spectrometer
MHBMueller Hinton broth
TMSTrimethylsilyl

References

  1. Zmora, N.; Suez, J.; Elinav, E. You Are What You Eat: Diet, Health and the Gut Microbiota. Nat. Rev. Gastroenterol. Hepatol. 2019, 16, 35–56. [Google Scholar] [CrossRef] [PubMed]
  2. Lederer, A.-K.; Huber, R. The Relation of Diet and Health: You Are What You Eat. Int. J. Environ. Res. Public Health 2022, 19, 7774. [Google Scholar] [CrossRef]
  3. Espín, J.C.; González-Sarrías, A.; Tomás-Barberán, F.A. The Gut Microbiota: A Key Factor in the Therapeutic Effects of (Poly)Phenols. Biochem. Pharmacol. 2017, 139, 82–93. [Google Scholar] [CrossRef] [PubMed]
  4. Cueva, C.; Gil-Sánchez, I.; Ayuda-Durán, B.; González-Manzano, S.; González-Paramás, A.M.; Santos-Buelga, C.; Bartolomé, B.; Victoria Moreno-Arribas, M. An Integrated View of the Effects of Wine Polyphenols and Their Relevant Metabolites on Gut and Host Health. Molecules 2017, 22, 99. [Google Scholar] [CrossRef]
  5. Selma, M.V.; Espín, J.C.; Tomás-Barberán, F.A. Interaction between Phenolics and Gut Microbiota: Role in Human Health. J. Agric. Food Chem. 2009, 57, 6485–6501. [Google Scholar] [CrossRef] [PubMed]
  6. Dueñas, M.; Muñoz-González, I.; Cueva, C.; Jiménez-Girón, A.; Sánchez-Patán, F.; Santos-Buelga, C.; Moreno-Arribas, M.V.; Bartolomé, B. A Survey of Modulation of Gut Microbiota by Dietary Polyphenols. Biomed. Res. Int. 2015, 1, 850902. [Google Scholar] [CrossRef]
  7. Hervert-Hernández, D.; Goñi, I. Dietary Polyphenols and Human Gut Microbiota: A Review. Food Rev. Int. 2011, 27, 154–169. [Google Scholar] [CrossRef]
  8. Duda-Chodak, A.; Tarko, T.; Satora, P.; Sroka, P. Interaction of Dietary Compounds, Especially Polyphenols, with the Intestinal Microbiota: A Review. Eur. J. Nutr. 2015, 54, 325–341. [Google Scholar] [CrossRef]
  9. Tomás-Barberán, F.A.; Selma, M.V.; Espín, J.C. Interactions of Gut Microbiota with Dietary Polyphenols and Consequences to Human Health. Curr. Opin. Clin. Nutr. Metab. Care 2016, 19, 471–476. [Google Scholar] [CrossRef]
  10. Popa, D.E.; Dragoi, C.M.; Arsene, A.L.; Dumitrescu, I.B.; Nicolae, A.C.; Burcea-Dragomiroiu, G.T.A. The Relationship between Phenolic Compounds from Diet and Microbiota. In Phenolic Compounds—Biological Activity; InTech: London, UK, 2017; pp. 25–38. [Google Scholar]
  11. Cardona, F.; Andrés-Lacueva, C.; Tulipani, S.; Tinahones, F.J.; Queipo-Ortuño, M.I. Benefits of Polyphenols on Gut Microbiota and Implications in Human Health. J. Nutr. Biochem. 2013, 24, 1415–1422. [Google Scholar] [CrossRef]
  12. Braune, A.; Blaut, M. Bacterial Species Involved in the Conversion of Dietary Flavonoids in the Human Gut. Gut Microbes 2016, 7, 216–234. [Google Scholar] [CrossRef]
  13. Valdés, L.; Cuervo, A.; Salazar, N.; Ruas-Madiedo, P.; Gueimonde, M.; González, S. The Relationship between Phenolic Compounds from Diet and Microbiota: Impact on Human Health. Food Funct. 2015, 6, 2424–2439. [Google Scholar] [CrossRef]
  14. Ozdal, T.; Sela, D.A.; Xiao, J.; Boyacioglu, D.; Chen, F.; Capanoglu, E. The Reciprocal Interactions between Polyphenols and Gut Microbiota and Effects on Bioaccessibility. Nutrients 2016, 8, 78. [Google Scholar] [CrossRef] [PubMed]
  15. Gowd, V.; Karim, N.; Shishir, M.R.I.; Xie, L.; Chen, W. Dietary Polyphenols to Combat the Metabolic Diseases via Altering Gut Microbiota. Trends Food Sci. Technol. 2019, 93, 81–93. [Google Scholar] [CrossRef]
  16. Clemente, J.C.; Ursell, L.K.; Parfrey, L.W.; Knight, R. The Impact of the Gut Microbiota on Human Health: An Integrative View. Cell 2012, 148, 1258–1270. [Google Scholar] [CrossRef] [PubMed]
  17. Dueñas, M.; Cueva, C.; Muñoz-González, I.; Jiménez-Girón, A.; Sánchez-Patán, F.; Santos-Buelga, C.; Moreno-Arribas, M.; Bartolomé, B. Studies on Modulation of Gut Microbiota by Wine Polyphenols: From Isolated Cultures to Omic Approaches. Antioxidants 2015, 4, 1–21. [Google Scholar] [CrossRef] [PubMed]
  18. Dicksved, J. Exploring the Human Intestinal Microbiome in Health and Disease. Ph.D. Thesis, Swedish University of Agricultural Sciences, Uppsala, Sweden, 2008. [Google Scholar]
  19. de Souza, E.L.; de Albuquerque, T.M.R.; dos Santos, A.S.; Massa, N.M.L.; de Brito Alves, J.L. Potential Interactions among Phenolic Compounds and Probiotics for Mutual Boosting of Their Health-Promoting Properties and Food Functionalities—A Review. Crit. Rev. Food Sci. Nutr. 2019, 59, 1645–1659. [Google Scholar] [CrossRef]
  20. Braune, A.; Gütschow, M.; Engst, W.; Blaut, M. Degradation of Quercetin and Luteolin by Eubacterium ramulus. Appl. Environ. Microbiol. 2001, 67, 5558–5567. [Google Scholar] [CrossRef]
  21. Serra, A.; Macià, A.; Romero, M.-P.; Reguant, J.; Ortega, N.; Motilva, M.-J. Metabolic Pathways of the Colonic Metabolism of Flavonoids (Flavonols, Flavones and Flavanones) and Phenolic Acids. Food Chem. 2012, 130, 383–393. [Google Scholar] [CrossRef]
  22. Parkar, S.G.; Trower, T.M.; Stevenson, D.E. Fecal Microbial Metabolism of Polyphenols and Its Effects on Human Gut Microbiota. Anaerobe 2013, 23, 12–19. [Google Scholar] [CrossRef]
  23. Di Pede, G.; Bresciani, L.; Calani, L.; Petrangolini, G.; Riva, A.; Allegrini, P.; Del Rio, D.; Mena, P. The Human Microbial Metabolism of Quercetin in Different Formulations: An in Vitro Evaluation. Foods 2020, 9, 1121. [Google Scholar] [CrossRef] [PubMed]
  24. Sankaranarayanan, R.; Sekhon, P.K.; Ambat, A.; Nelson, J.; Jose, D.; Bhat, G.J.; Scaria, J. Screening of Human Gut Bacterial Culture Collection Identifies Species That Biotransform Quercetin into Metabolites with Anticancer Properties. Int. J. Mol. Sci. 2021, 22, 7045. [Google Scholar] [CrossRef] [PubMed]
  25. Krumholz, L.R.; Bryant, M.P. Eubacterium oxidoreducens Sp. Nov. Requiring H2 or Formate to Degrade Gallate, Pyrogallol, Phloroglucinol and Quercetin. Arch. Microbiol. 1986, 144, 8–14. [Google Scholar] [CrossRef]
  26. Peng, X.; Zhang, Z.; Zhang, N.; Liu, L.; Li, S.; Wei, H. In Vitro Catabolism of Quercetin by Human Fecal Bacteria and the Antioxidant Capacity of Its Catabolites. Food Nutr. Res. 2014, 58, 23406. [Google Scholar] [CrossRef]
  27. Ulbrich, K.; Reichardt, N.; Braune, A.; Kroh, L.W.; Blaut, M.; Rohn, S. The Microbial Degradation of Onion Flavonol Glucosides and Their Roasting Products by the Human Gut Bacteria Eubacterium ramulus and Flavonifractor plautii. Food Res. Int. 2015, 67, 349–355. [Google Scholar] [CrossRef]
  28. Jin, J.S.; Hattori, M. Isolation and Characterization of a Human Intestinal Bacterium Eggerthella Sp. CAT-1 Capable of Cleaving the C-Ring of (+)-Catechin and (-)-Epicatechin, Followed by p-Dehydroxylation of the B-Ring. Biol. Pharm. Bull. 2012, 35, 2252–2256. [Google Scholar] [CrossRef]
  29. Kutschera, M.; Engst, W.; Blaut, M.; Braune, A. Isolation of Catechin-Converting Human Intestinal Bacteria. J. Appl. Microbiol. 2011, 111, 165–175. [Google Scholar] [CrossRef]
  30. Takagaki, A.; Nanjo, F. Biotransformation of (−)-Epigallocatechin and (−)-Gallocatechin by Intestinal Bacteria Involved in Isoflavone Metabolism. Biol. Pharm. Bull. 2015, 38, 325–330. [Google Scholar] [CrossRef]
  31. Takagaki, A.; Nanjo, F. Bioconversion of (-)-Epicatechin, (+)-Epicatechin, (-)-Catechin, and (+)-Catechin by (-)-Epigallocatechin-Metabolizing Bacteria. Biol. Pharm. Bull. 2015, 38, 789–794. [Google Scholar] [CrossRef] [PubMed]
  32. Wang, L.-Q.; Meselhy, M.R.; Li, Y.; Nakamura, N.; Min, B.-S.; Qin, G.-W.; Hattori, M. The Heterocyclic Ring Fission and Dehydroxylation of Catechins and Related Compounds by Eubacterium Sp. Strain SDG-2, a Human Intestinal Bacterium. Chem. Pharm. Bull. 2001, 49, 1640–1643. [Google Scholar] [CrossRef]
  33. Meselhy, M.R.; Nakamura, N.; Hattori, M. Biotransformation of (-)-Epicatechin 3-O-Gallate by Human Intestinal Bacteria. Chem. Pharm. Bull. 1997, 45, 888–893. [Google Scholar] [CrossRef] [PubMed]
  34. Ou, K.; Sarnoski, P.; Schneider, K.R.; Song, K.; Khoo, C.; Gu, L. Microbial Catabolism of Procyanidins by Human Gut Microbiota. Mol. Nutr. Food Res. 2014, 58, 2196–2205. [Google Scholar] [CrossRef]
  35. Takagaki, A.; Nanjo, F. Catabolism of (+)-Catechin and (-)-Epicatechin by Rat Intestinal Microbiota. J. Agric. Food Chem. 2013, 61, 4927–4935. [Google Scholar] [CrossRef]
  36. Tzounis, X.; Vulevic, J.; Kuhnle, G.G.C.; George, T.; Leonczak, J.; Gibson, G.R.; Kwik-Uribe, C.; Spencer, J.P.E. Flavanol Monomer-Induced Changes to the Human Faecal Microflora. Br. J. Nutr. 2008, 99, 782–792. [Google Scholar] [CrossRef]
  37. van’t Slot, G.; Humpf, H.U. Degradation and Metabolism of Catechin, Epigallocatechin-3-Gallate (EGCG), and Related Compounds by the Intestinal Microbiota in the Pig Cecum Model. J. Agric. Food Chem. 2009, 57, 8041–8048. [Google Scholar] [CrossRef]
  38. Herles, C.; Braune, A.; Blaut, M. First Bacterial Chalcone Isomerase Isolated from Eubacterium ramulus. Arch. Microbiol. 2004, 181, 428–434. [Google Scholar] [CrossRef]
  39. Schneider, H.; Blaut, M. Anaerobic Degradation of Flavonoids by Eubacterium ramulus. Arch. Microbiol. 2000, 173, 71–75. [Google Scholar] [CrossRef]
  40. Schoefer, L.; Mohan, R.; Schwiertz, A.; Braune, A.; Blaut, M. Anaerobic Degradation of Flavonoids by Clostridium orbiscindens. Appl. Env. Microbiol. 2003, 69, 5849–5854. [Google Scholar] [CrossRef]
  41. Winter, J.; Moore, L.H.; Dowell, V.R.; Bokkenheuser, V.D. C-Ring Cleavage of Flavonoids by Human Intestinal Bacteria. Appl. Env. Microbiol. 1989, 55, 1203–1208. [Google Scholar] [CrossRef] [PubMed]
  42. Lee, H.C.; Jenner, A.M.; Low, C.S.; Lee, Y.K. Effect of Tea Phenolics and Their Aromatic Fecal Bacterial Metabolites on Intestinal Microbiota. Res. Microbiol. 2006, 157, 876–884. [Google Scholar] [CrossRef] [PubMed]
  43. Schantz, M.; Erk, T.; Richling, E. Metabolism of Green Tea Catechins by the Human Small Intestine. Biotechnol. J. 2010, 5, 1050–1059. [Google Scholar] [CrossRef]
  44. Roowi, S.; Stalmach, A.; Mullen, W.; Lean, M.E.J.; Edwards And, C.A.; Crozier, A. Green Tea Flavan-3-Ols: Colonic Degradation and Urinary Excretion of Catabolites by Humans. J. Agric. Food Chem. 2010, 58, 1296–1304. [Google Scholar] [CrossRef]
  45. García-Villalba, R.; Selma, M.V.; Espín, J.C.; Tomás-Barberán, F.A. Identification of Novel Urolithin Metabolites in Human Feces and Urine after the Intake of a Pomegranate Extract. J. Agric. Food Chem. 2019, 67, 11099–11107. [Google Scholar] [CrossRef]
  46. Li, Z.; Summanen, P.H.; Komoriya, T.; Henning, S.M.; Lee, R.P.; Carlson, E.; Heber, D.; Finegold, S.M. Pomegranate Ellagitannins Stimulate Growth of Gut Bacteria in Vitro: Implications for Prebiotic and Metabolic Effects. Anaerobe 2015, 34, 164–168. [Google Scholar] [CrossRef] [PubMed]
  47. Gullon, B.; Pintado, M.E.; Fernández-López, J.; Pérez-Álvarez, J.A.; Viuda-Martos, M. In Vitro Gastrointestinal Digestion of Pomegranate Peel (Punica granatum) Flour Obtained from Co-Products: Changes in the Antioxidant Potential and Bioactive Compounds Stability. J. Funct. Foods 2015, 19, 617–628. [Google Scholar] [CrossRef]
  48. Pais, A.C.S.; Coscueta, E.R.; Pintado, M.M.; Silvestre, A.J.D.; Santos, S.A.O. Exploring the Bioaccessibility and Intestinal Absorption of Major Classes of Pure Phenolic Compounds Using in Vitro Simulated Gastrointestinal Digestion. Heliyon 2024, 10, e28894. [Google Scholar] [CrossRef]
  49. Duda-Chodak, A. The Inhibitory Effect of Polyphenols on Human Gut Microbiota. J. Physiol. Pharmacol. 2012, 63, 497–503. [Google Scholar] [PubMed]
  50. Gwiazdowska, D.; Juś, K.; Jasnowska-Małecka, J.; Kluczyńska, K. The Impact of Polyphenols on Bifidobacterium Growth. Acta Biochim. Pol. 2015, 62, 895–901. [Google Scholar] [CrossRef]
  51. Krumholz, L.R.; Crawford, R.L.; Hemling, M.E.; Bryant, M.P. Metabolism of Gallate and Phloroglucinol in Eubacterium Oxidoreducens via 3-Hydroxy-5-Oxohexanoate. J. Bacteriol. 1987, 169, 1886–1890. [Google Scholar] [CrossRef]
  52. Selma, M.V.; Beltrán, D.; García-Villalba, R.; Espín, J.C.; Tomás-Barberán, F.A. Description of Urolithin Production Capacity from Ellagic Acid of Two Human Intestinal Gordonibacter Species. Food Funct. 2014, 5, 1779–1784. [Google Scholar] [CrossRef]
  53. Gaya, P.; Medina, M.; Sánchez-Jiménez, A.; Landete, J. Phytoestrogen Metabolism by Adult Human Gut Microbiota. Molecules 2016, 21, 1034. [Google Scholar] [CrossRef]
  54. Selma, M.V.; Beltrán, D.; Luna, M.C.; Romo-Vaquero, M.; García-Villalba, R.; Mira, A.; Espín, J.C.; Tomás-Barberán, F.A. Isolation of Human Intestinal Bacteria Capable of Producing the Bioactive Metabolite Isourolithin A from Ellagic Acid. Front. Microbiol. 2017, 8, 1521. [Google Scholar] [CrossRef]
  55. García-Villalba, R.; Beltrán, D.; Espín, J.C.; Selma, M.V.; Tomás-Barberán, F.A. Time Course Production of Urolithins from Ellagic Acid by Human Gut Microbiota. J. Agric. Food Chem. 2013, 61, 8797–8806. [Google Scholar] [CrossRef]
  56. Mi, H.; Liu, S.; Hai, Y.; Yang, G.; Lu, J.; He, F.; Zhao, Y.; Xia, M.; Hou, X.; Fang, Y. Lactococcus Garvieae FUA009, a Novel Intestinal Bacterium Capable of Producing the Bioactive Metabolite Urolithin A from Ellagic Acid. Foods 2022, 11, 2621. [Google Scholar] [CrossRef]
  57. Braune, A.; Engst, W.; Blaut, M. Degradation of Neohesperidin Dihydrochalcone by Human Intestinal Bacteria. J. Agric. Food Chem. 2005, 53, 1782–1790. [Google Scholar] [CrossRef] [PubMed]
  58. Tu, J.; Li, Q.; Zhou, B. The Tannins from Sanguisorba officinalis l. (Rosaceae): A Systematic Study on the Metabolites of Rats Based on HPLC–LTQ–Orbitrap MS2 Analysis. Molecules 2021, 26, 4053. [Google Scholar] [CrossRef] [PubMed]
  59. García-Villalba, R.; Espín, J.C.; Tomás-Barberán, F.A. Chromatographic and Spectroscopic Characterization of Urolithins for Their Determination in Biological Samples after the Intake of Foods Containing Ellagitannins and Ellagic Acid. J. Chromatogr. A 2016, 1428, 162–175. [Google Scholar] [CrossRef] [PubMed]
  60. Wu, S.; Li, H.; Li, G.; Lv, N.; Qi, Y. Metabolite Identification of Gut Microflora-cassia Seed Interactions Using UPLC-QTOF/MS. Exp. Ther. Med. 2020, 19, 3305–3315. [Google Scholar] [CrossRef]
  61. González-Barrio, R.; Truchado, P.; Ito, H.; Espín, J.C.; Tomás-Barberán, F.A. UV and MS Identification of Urolithins and Nasutins, the Bioavailable Metabolites of Ellagitannins and Ellagic Acid in Different Mammals. J. Agric. Food Chem. 2011, 59, 1152–1162. [Google Scholar] [CrossRef]
  62. Pfundstein, B.; Haubner, R.; Würtele, G.; Gehres, N.; Ulrich, C.M.; Owen, R.W. Pilot Walnut Intervention Study of Urolithin Bioavailability in Human Volunteers. J. Agric. Food Chem. 2014, 62, 10264–10273. [Google Scholar] [CrossRef]
  63. Tomás-Barberán, F.A.; González-Sarrías, A.; García-Villalba, R.; Núñez-Sánchez, M.A.; Selma, M.V.; García-Conesa, M.T.; Espín, J.C. Urolithins, the Rescue of “Old” Metabolites to Understand a “New” Concept: Metabotypes as a Nexus among Phenolic Metabolism, Microbiota Dysbiosis, and Host Health Status. Mol. Nutr. Food Res. 2017, 61, 1500901. [Google Scholar] [CrossRef]
  64. Selma, M.V.; Tomás-Barberán, F.A.; Beltrán, D.; García-Villalba, R.; Espín, J.C. Gordonibacter urolithinfaciens Sp. Nov., a Urolithin-Producing Bacterium Isolated from the Human Gut. Int. J. Syst. Evol. Microbiol. 2014, 64, 2346–2352. [Google Scholar] [CrossRef]
  65. Gaya, P.; Peirotén, Á.; Medina, M.; Álvarez, I.; Landete, J.M. Bifidobacterium pseudocatenulatum INIA P815: The First Bacterium Able to Produce Urolithins A and B from Ellagic Acid. J. Funct. Foods 2018, 45, 95–99. [Google Scholar] [CrossRef]
  66. Laveriano-Santos, E.P.; Marhuenda-Muñoz, M.; Vallverdú-Queralt, A.; Martínez-Huélamo, M.; Tresserra-Rimbau, A.; Miliarakis, E.; Arancibia-Riveros, C.; Jáuregui, O.; Ruiz-León, A.M.; Castro-Baquero, S.; et al. Identification and Quantification of Urinary Microbial Phenolic Metabolites by HPLC-ESI-LTQ-Orbitrap-HRMS and Their Relationship with Dietary Polyphenols in Adolescents. Antioxidants 2022, 11, 1167. [Google Scholar] [CrossRef] [PubMed]
  67. Kim, D.-H.; Jung, E.-A.; Sohng, I.-S.; Han, J.-A.; Kim, T.-H.; Han, M.J. Intestinal Bacterial Metabolism of Flavonoids and Its Relation to Some Biological Activities. Arch. Pharm. Res. 1998, 21, 17–23. [Google Scholar] [CrossRef] [PubMed]
  68. Martínez-Huélamo, M.; Tulipani, S.; Jáuregui, O.; Valderas-Martinez, P.; Vallverdú-Queralt, A.; Estruch, R.; Torrado, X.; Lamuela-Raventós, R. Sensitive and Rapid UHPLC-MS/MS for the Analysis of Tomato Phenolics in Human Biological Samples. Molecules 2015, 20, 20409–20425. [Google Scholar] [CrossRef]
  69. Zhang, B.; Zhang, Y.; Liu, X.; Zhao, C.; Yin, J.; Li, X.; Zhang, X.; Wang, J.; Wang, S. Distinctive Anti-Inflammatory Effects of Resveratrol, Dihydroresveratrol, and 3-(4-Hydroxyphenyl)-Propionic Acid on DSS-Induced Colitis in Pseudo-Germ-Free Mice. Food Chem. 2023, 400, 133904. [Google Scholar] [CrossRef]
  70. Rechner, A.R.; Smith, M.A.; Kuhnle, G.; Gibson, G.R.; Debnam, E.S.; Srai, S.K.S.; Moore, K.P.; Rice-Evans, C.A. Colonic Metabolism of Dietary Polyphenols: Influence of Structure on Microbial Fermentation Products. Free Radic. Biol. Med. 2004, 36, 212–225. [Google Scholar] [CrossRef]
  71. Chen, T.; Su, W.; Yan, Z.; Wu, H.; Zeng, X.; Peng, W.; Gan, L.; Zhang, Y.; Yao, H. Identification of Naringin Metabolites Mediated by Human Intestinal Microbes with Stable Isotope-Labeling Method and UFLC-Q-TOF-MS/MS. J. Pharm. Biomed. Anal. 2018, 161, 262–272. [Google Scholar] [CrossRef]
  72. Gonthier, M.P.; Remesy, C.; Scalbert, A.; Cheynier, V.; Souquet, J.M.; Poutanen, K.; Aura, A.M. Microbial Metabolism of Caffeic Acid and Its Esters Chlorogenic and Caftaric Acids by Human Faecal Microbiota in Vitro. Biomed. Pharmacother. 2006, 60, 536–540. [Google Scholar] [CrossRef] [PubMed]
  73. Catarino, M.D.; Marçal, C.; Bonifácio-Lopes, T.; Campos, D.; Mateus, N.; Silva, A.M.S.; Pintado, M.M.; Cardoso, S.M. Impact of Phlorotannin Extracts from Fucus Vesiculosus on Human Gut Microbiota. Mar. Drugs 2021, 19, 375. [Google Scholar] [CrossRef]
  74. Vázquez-Rodríguez, B.; Santos-Zea, L.; Heredia-Olea, E.; Acevedo-Pacheco, L.; Santacruz, A.; Gutiérrez-Uribe, J.A.; Cruz-Suárez, L.E. Effects of Phlorotannin and Polysaccharide Fractions of Brown Seaweed Silvetia Compressa on Human Gut Microbiota Composition Using an in Vitro Colonic Model. J. Funct. Foods 2021, 84, 104596. [Google Scholar] [CrossRef]
  75. Schneider, H.; Schwiertz, A.; Collins, M.D.; Blaut, M. Anaerobic Transformation of Quercetin-3-Glucoside by Bacteria from the Human Intestinal Tract. Arch. Microbiol. 1999, 171, 81–91. [Google Scholar] [CrossRef]
  76. Bordiga, M.; Meudec, E.; Williams, P.; Montella, R.; Travaglia, F.; Arlorio, M.; Coïsson, J.D.; Doco, T. The Impact of Distillation Process on the Chemical Composition and Potential Prebiotic Activity of Different Oligosaccharidic Fractions Extracted from Grape Seeds. Food Chem. 2019, 285, 423–430. [Google Scholar] [CrossRef]
  77. Araújo-Rodrigues, H.; Coscueta, E.R.; Pereira, M.F.; Cunha, S.A.; Almeida, A.; Rosa, A.; Martins, R.; Pereira, C.D.; Pintado, M.E. Membrane Fractionation of Cynara cardunculus Swine Blood Hydrolysate: Ingredients of High Nutritional and Nutraceutical Value. Food Res. Int. 2022, 158, 111549. [Google Scholar] [CrossRef] [PubMed]
  78. Alves, M.J.; Ferreira, I.C.F.R.; Martins, A.; Pintado, M. Antimicrobial Activity of Wild Mushroom Extracts against Clinical Isolates Resistant to Different Antibiotics. J. Appl. Microbiol. 2012, 113, 466–475. [Google Scholar] [CrossRef]
  79. de Carvalho, N.M.; Oliveira, D.L.; Dib Saleh, M.A.; Pintado, M.; Madureira, A.R. Preservation of Human Gut Microbiota Inoculums for in Vitro Fermentations Studies. Fermentation 2021, 7, 14. [Google Scholar] [CrossRef]
  80. Campos, D.A.; Coscueta, E.R.; Vilas-Boas, A.A.; Silva, S.; Teixeira, J.A.; Pastrana, L.M.; Pintado, M.M. Impact of Functional Flours from Pineapple By-Products on Human Intestinal Microbiota. J. Funct. Foods 2020, 67, 103830. [Google Scholar] [CrossRef]
  81. Santos, S.A.O.; Vilela, C.; Freire, C.S.R.; Neto, C.P.; Silvestre, A.J.D. Ultra-High Performance Liquid Chromatography Coupled to Mass Spectrometry Applied to the Identification of Valuable Phenolic Compounds from Eucalyptus Wood. J. Chromatogr. B Anal. Technol. Biomed. Life Sci. 2013, 938, 65–74. [Google Scholar] [CrossRef]
  82. Santos, S.A.O.; Oliveira, C.S.D.; Trindade, S.S.; Abreu, M.H.; Rocha, S.S.M.; Silvestre, A.J.D. Bioprospecting for Lipophilic-like Components of Five Phaeophyta Macroalgae from the Portuguese Coast. J. Appl. Phycol. 2016, 28, 3151–3158. [Google Scholar] [CrossRef]
  83. Rabah, S.; Kouachi, K.; Ramos, P.A.B.; Gomes, A.P.; Almeida, A.; Haddadi-Guemghar, H.; Khodir, M.; Silvestre, A.J.D.; Santos, S.A.O. Unveiling the Bioactivity Potential of Allium triquetrum L. Lipophilic Fraction: Chemical Characterization and in Vitro Antibacterial Activity against Methicillin-Resistant Staphylococcus aureus. Food Funct. 2020, 11, 5257–5265. [Google Scholar] [CrossRef]
  84. Bayle, M.; Roques, C.; Marion, B.; Audran, M.; Oiry, C.; Bressolle-Gomeni, F.M.; Cros, G. Development and validation of a liquid chromatography-electrospray ionization-tandem mass spectrometry method for the determination of urolithin C in rat plasma and its application to a pharmacokinetic study. J. Pharm. Biomed. Anal. 2016, 131, 33–39. [Google Scholar] [CrossRef] [PubMed]
  85. Lech, K.; Fornal, E. A mass spectrometry-based approach for characterization of red, blue, and purple natural dyes. Molecules 2020, 25, 3223. [Google Scholar] [CrossRef] [PubMed]
  86. Ibdah, M.; Gang, D.R. Use of coupled ion mobility spectrometry-time of flight mass spectrometry to analyze saturated and unsaturated phenylpropanoic acids and chalcones. Chem. Cent. J. 2014, 8, 1–9. [Google Scholar] [CrossRef] [PubMed]
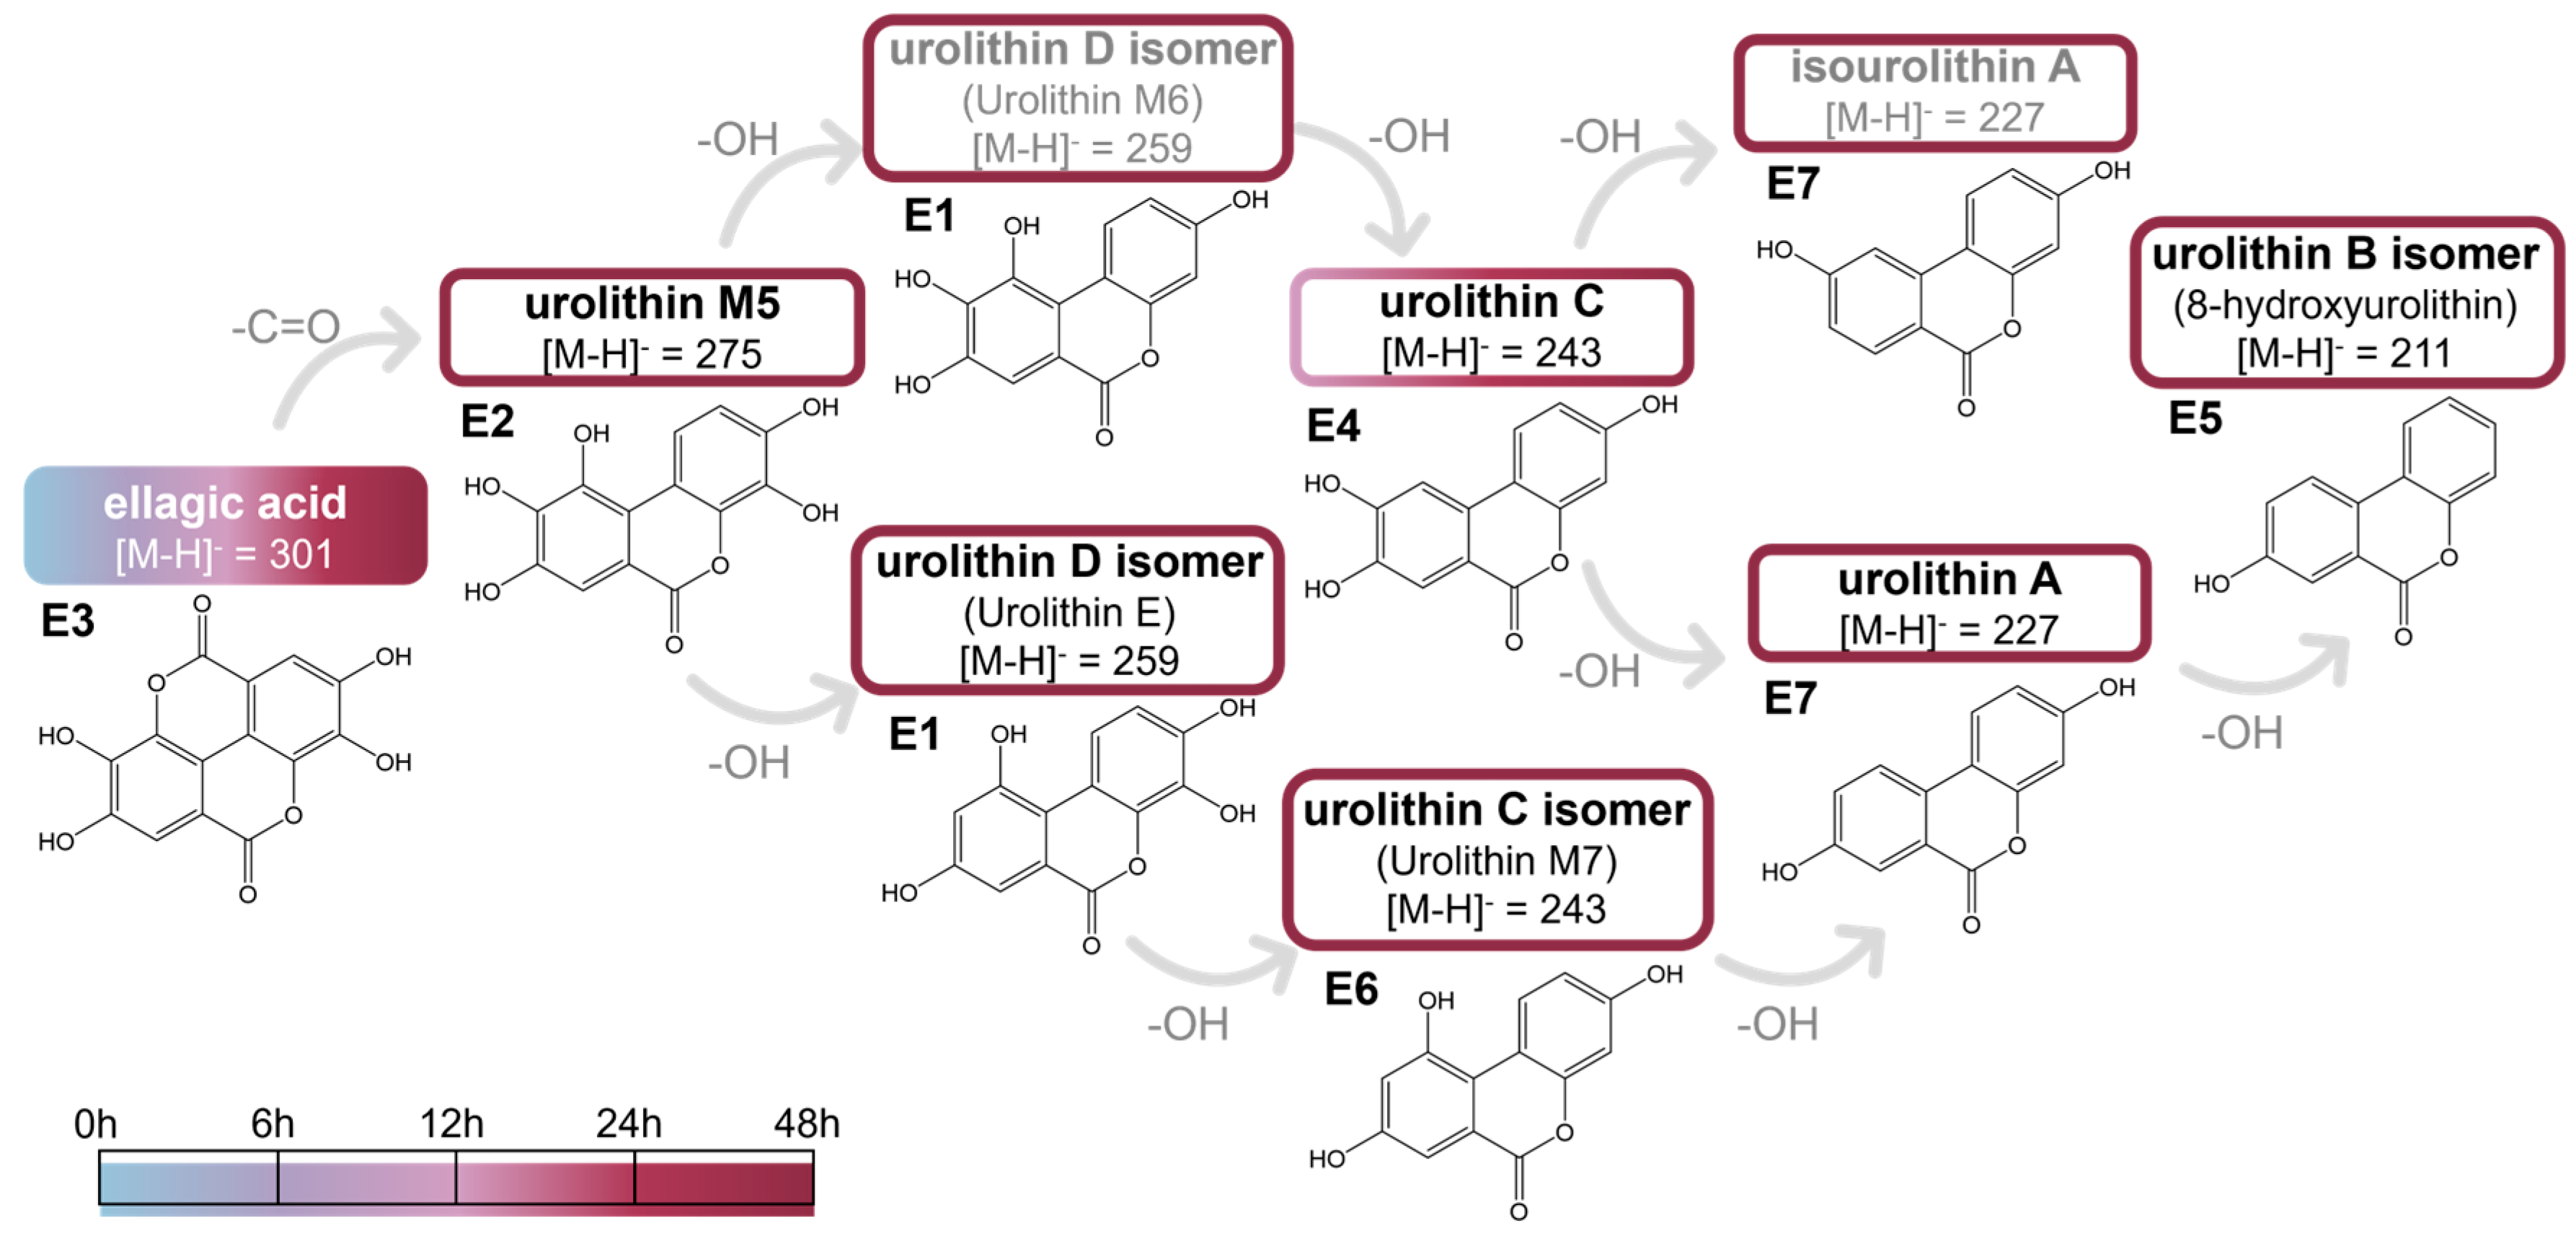
Figure 1. Putative pathway of gut microbiota transformation of ellagic acid, according to the detected metabolites through UHPLC-DAD-MS2. The color of the boxes, as indicated by the presented scale, represents the fermentation time at which the compounds were identified.
Ijms 26 11009 g001
Figure 2. Concentration (µg mL−1) of ellagic acid (E3) and its metabolites (E1—urolithin D isomer, E2—urolithin M5, E4—urolithin C, E5—urolithin B isomer, E6—urolithin C isomer, E7—(iso)urolithin A) along the fermentation time, obtained through UHPLC-DAD-MS2 analysis. Significant differences (p < 0.05, Summary Statistical Tables S3–S4) concerning the concentration of each compound at the time of fermentation are indicated by capital letters. Significant differences (p < 0.05, Summary Statistical Tables S5–S7) concerning the different phenolic compounds at each time of fermentation are indicated by lowercase letters.
Ijms 26 11009 g002
Figure 3. Putative pathway of gut microbiota transformation of naringenin, according to the detected metabolites through UHPLC-DAD-MS2. The color of the boxes, as indicated by the presented scale, represents the fermentation time at which the compounds were identified.
Ijms 26 11009 g003
Figure 4. Concentration (µg mL−1) of naringenin (N11) and the metabolites (N1—hydroxybenzoic acid, N2—coumaric acid, N6—3-(2,4-dihydroxyphenyl)propanoic acid, N7—2-(4-hydroxyphenyl)acetic acid, N8—2-(2-hydroxyphenyl)acetic acid, N9—3-(hydroxyphenyl)propanoic acid, N10—3-phenylpropanoic acid) along the fermentation time, obtained through UHPLC-DAD-MS2 analysis. Significant differences (p < 0.05, Summary Statistical Tables S8–S11) concerning the concentration of each compound along the time of fermentation are indicated by capital letters. Significant differences (p < 0.05, Summary Statistical Tables S12–S14) concerning the different phenolic compounds at each time of fermentation are indicated by lowercase letters. * < LOD.
Ijms 26 11009 g004
Figure 5. Putative pathway of gut microbiota transformation of phloroglucinol, according to the detected metabolites through UHPLC-DAD-MS2. The color of the boxes, as indicated by the presented scale, represents the fermentation time at which the compounds were identified.
Ijms 26 11009 g005
Figure 6. Concentration (µg mL−1) of phloroglucinol (P1) and the metabolites (P2—phloroglucinic acid and P3—2-hydroxy-3-phenylpropanoic acid) along the fermentation time, obtained through UHPLC-DAD-MS2 analysis. Significant differences (p < 0.05, Summary Statistical Table S15–S17) concerning the concentration of each compound at the time of fermentation are indicated by capital letters. Significant differences (p < 0.05, Summary Statistical Tables S18–S21) concerning the different phenolic compounds at each time of fermentation are indicated by lowercase letters.
Ijms 26 11009 g006
Table 1. List of reagents used in this study.
Reagent NameSupplier
2-(2-Hydroxyphenyl)acetic acid (99% purity)Sigma-Aldrich (Madrid, Spain)
2-(4-Hydroxyphenyl)acetic acid (>98% purity)Sigma-Aldrich (Madrid, Spain)
3-(2,4-Dihydroxyphenyl)propanoic acid (95% purity)Sigma-Aldrich (Madrid, Spain)
3-(4-Hydroxyphenylpropanoic acid (98% purity)Sigma-Aldrich (Madrid, Spain)
3,4-Dihydroxybenzoic acid (97% purity)Thermo-scientific (Slovakia)
Acetonitrile (HPLC grade)Honeywell (Villepinte, France)
Bile salts (48305)Sigma-Aldrich (St. Louis, MO, USA)
Calcium chloride (102378)Merck (New Jersey, USA)
D-(+)-Glucose (G8270)Sigma-Aldrich (St. Louis, MO, USA)
D-(+)-Maltose monohydrate (63419)Sigma-Aldrich (St. Louis, MO, USA)
Ellagic acid (96% purity)Sigma-Aldrich (Madrid, Spain)
Heme chloride (A11165)Alfa Aesar (Stoughton, MA, USA)
L-Cysteine hydrochloride (1.02839.0100)Merck (Rahway, NJ, USA)
Lysozyme (P00698)Sigma-Aldrich (St. Louis, MO, USA)
Magnesium sulfate hexahydrate (459337)Carlo Erba (Emmendingen, Deutschland)
N,O-bis(trimethylsilyl)trifluoroacetamide (99% purity)Merck (Madrid, Spain)
Naringenin (98% purity)Biosynth® CarboSynth (Bratislava, Slovakia)
Naringin (95% purity)Biosynth® CarboSynth (Bratislava, Slovakia)
NZY Tissue gDNA kit for DNA extraction (MB13502)NZYTech (Lisbon, Portugal)
p-Coumaric acid (≥98% purity)Sigma-Aldrich (Madrid, Spain)
Phloroglucinol (99% purity)Sigma-Aldrich (Madrid, Spain)
Potassium dihydrogen phosphate (1.04871.1000)Merck (Rahway, NJ, USA)
Pyridine (≥ 99.5% purity)Merck (Madrid, Spain)
Quercetin (95% purity)Sigma-Aldrich (Madrid, Spain)
Resazurin sodium salt (199303)Sigma-Aldrich (St. Louis, MO, USA)
Sodium bicarbonate (1.06329.1000)Merck (Rahway, NJ, USA)
Sodium chloride (31434)Honeywell (Charlotte, NC, USA)
Solvent Filtration Apparatus 58061Supelco (Bellefonte, PA, USA)
Soya peptone (84616.0500)VWR Chemicals (Radnor, PA, USA)
Tetracosane (99% purity)Merck (Madrid, Spain)
Trimethylchlorosilane (99% purity)Merck (Madrid, Spain)
Tris-EDTA buffer (TE, 10× concentrate, PPB010)Sigma-Aldrich (St. Louis, MO, USA)
Tryptone (A1401 HA)Biokar Diagnostics (Cedex, France)
Tween 80 (28830,291)VWR Chemicals (Radnor, PA, USA)
Urolithin B (≥98% purity)Cayman Chemical company (Ann Arbor, MI, USA)
Urolithin C (>97% purity)Sigma-Aldrich (Madrid, Spain)
Urolithin D (95% purity)Sigma-Aldrich (Madrid, Spain)
Vitamin K1 (V3501)Sigma-Aldrich (St. Louis, MO, USA)
Water (HPLC grade)Merck (Darmstadt, Germany)
Yeast extract (A1202)Biokar Diagnostics (Paris La Défense Cedex, France)
Disclaimer/Publisher’s Note: The statements, opinions and data contained in all publications are solely those of the individual author(s) and contributor(s) and not of MDPI and/or the editor(s). MDPI and/or the editor(s) disclaim responsibility for any injury to people or property resulting from any ideas, methods, instructions or products referred to in the content.