Article

Caraway Extract Increases Ucp-1 mRNA Expression in C3H10T1/2 Adipocytes Through Direct and Indirect Effects

1
Department of Agricultural Chemistry, School of Agriculture, Meiji University, 1-1-1 Higashimita, Tama-ku, Kawasaki-shi 214-8571, Kanagawa, Japan
2
Department of Nutritional Science and Food Safety, Faculty of Applied Bioscience, Tokyo University of Agriculture, 1-1-1 Sakuragaoka, Setagaya-ku, Tokyo 156-8502, Japan
3
Department of Fermentation Science, Faculty of Applied Bioscience, Tokyo University of Agriculture, 1-1-1 Sakuragaoka, Setagaya-ku, Tokyo 156-8502, Japan
4
Division of Food Science and Biotechnology, Graduate School of Agriculture, Kyoto University, Kitashirakawa Oiwake-cho, Sakyo-ku, Kyoto 606-8502, Japan
*
Author to whom correspondence should be addressed.
Int. J. Mol. Sci. 2025, 26(22), 10970; https://doi.org/10.3390/ijms262210970
Submission received: 15 August 2025 / Revised: 10 November 2025 / Accepted: 12 November 2025 / Published: 12 November 2025
(This article belongs to the Special Issue The Effect of Food-Derived Compounds on Brown Fat Cell Function)

Abstract

Carum carvi, commonly known as caraway, is a medicinal and culinary plant recognized for its anti-inflammatory properties, primarily attributed to its essential oil components. However, the thermogenic potential of caraway—particularly the biological activity of its water-soluble extract—remains largely unexplored. In this study, we investigated the effects and underlying mechanisms of caraway on Ucp-1 mRNA expression in beige adipocytes and on inflammation-mediated suppression of thermogenesis, by treating C3H10T1/2 adipocytes with caraway water extract (CWE) or caraway hexane extract (CHE) during both the induction and maturation phases, followed by isoproterenol stimulation, and measurement of mRNA levels of Ucp-1 and differentiation-related genes. Additionally, RAW264.7 cells were treated with CWE prior to stimulation with lipopolysaccharides followed by evaluation of inflammatory marker expression. CWE increased Ucp-1 mRNA expression directly by enhancing adrenergic sensitivity and promoting beige adipocyte differentiation during the induction phase of differentiation. Further, CWE mediated an indirect effect on Ucp-1 expression by suppressing macrophage inflammation, thus restoring Ucp-1 expression otherwise inhibited under inflammatory conditions. These results suggest that caraway extracts—especially the water-soluble compounds—may serve as therapeutic candidates for obesity-related conditions by enhancing energy expenditure and mitigating chronic inflammation.

1. Introduction

Brown and beige adipocytes are thermogenic cells that play a crucial role in energy expenditure by dissipating the proton gradient across the inner mitochondrial membrane via uncoupling protein-1 (UCP-1), thereby generating heat instead of ATP [1]. Increased UCP-1 expression in mouse adipose tissue suppresses fat accumulation and improves metabolism [2]. Furthermore, in humans, activation of brown adipose tissue contributes to increased energy expenditure [3]. Consequently, promoting UCP-1 expression in adipocytes has emerged as a promising strategy for treating obesity and related metabolic disorders [4,5]. However, the thermogenic capacity of adipose tissue can be attenuated under chronic inflammatory conditions that are prevalent in obesity. Proinflammatory cytokines such as tumor necrosis factor-alpha (TNFα) and interleukin-1 beta (IL-1β) regulate UCP-1 expression, thereby affecting the process of energy dissipation [6,7,8]. Previous studies investigating food-derived compounds that promote UCP-1 expression have often focused solely on effects at the basal expression level, without considering conditions such as adrenergic stimulation [9,10,11]. Consequently, the potential of these compounds to enhance UCP-1 expression under physiologically relevant stimuli that mimic in vivo thermogenic activation remains to be elucidated. Furthermore, these food-derived compounds are lipid-soluble, among which spices, in particular, have been studied for their essential oil components [10,12,13,14,15]. In contrast, water-soluble compounds derived from medicinal and edible plants have received comparatively limited attention, despite their potential to exhibit unique biological effects via various mechanisms.
Carum carvi (C. carvi), commonly known as caraway, is a medicinal and culinary plant recognized for its anti-inflammatory properties, which are primarily attributed to its essential oils [16,17,18]. Caraway has been shown to reduce colitis in animals [19]. However, the efficacy of caraway has been reported for essential oils and lipid-soluble extracts, with limited data regarding its water-soluble extracts. Furthermore, its potential thermogenic effects have not been investigated. Evaluating the activity of water-soluble extracts is crucial as they are commonly extracted using water or hot water during culinary preparation, in addition to oil-based methods. Therefore, this study examined the effects of both hexane and water extracts of caraway on Ucp-1 mRNA expression in C3H10T1/2 adipocytes and on inflammatory responses in RAW264.7 macrophages. Our findings indicate that caraway water extract (CWE) increases Ucp-1 mRNA expression through two distinct mechanisms: (1) a direct effect that enhances adrenergic sensitivity and promotes beige adipocyte differentiation when applied during the induction phase of differentiation, and (2) an indirect effect mediated by suppression of macrophage inflammation, which restores Ucp-1 mRNA expression suppressed under inflammatory conditions. These results suggest that caraway extracts, particularly their water-soluble components, could serve as functional food ingredients to prevent obesity-associated metabolic dysfunction by promoting thermogenesis and alleviating chronic inflammation.

2. Results

2.1. C. carvi Extract Enhances UCP-1 Expression by Increasing Adrenergic Sensitivity in C3H10T1/2 Adipocytes

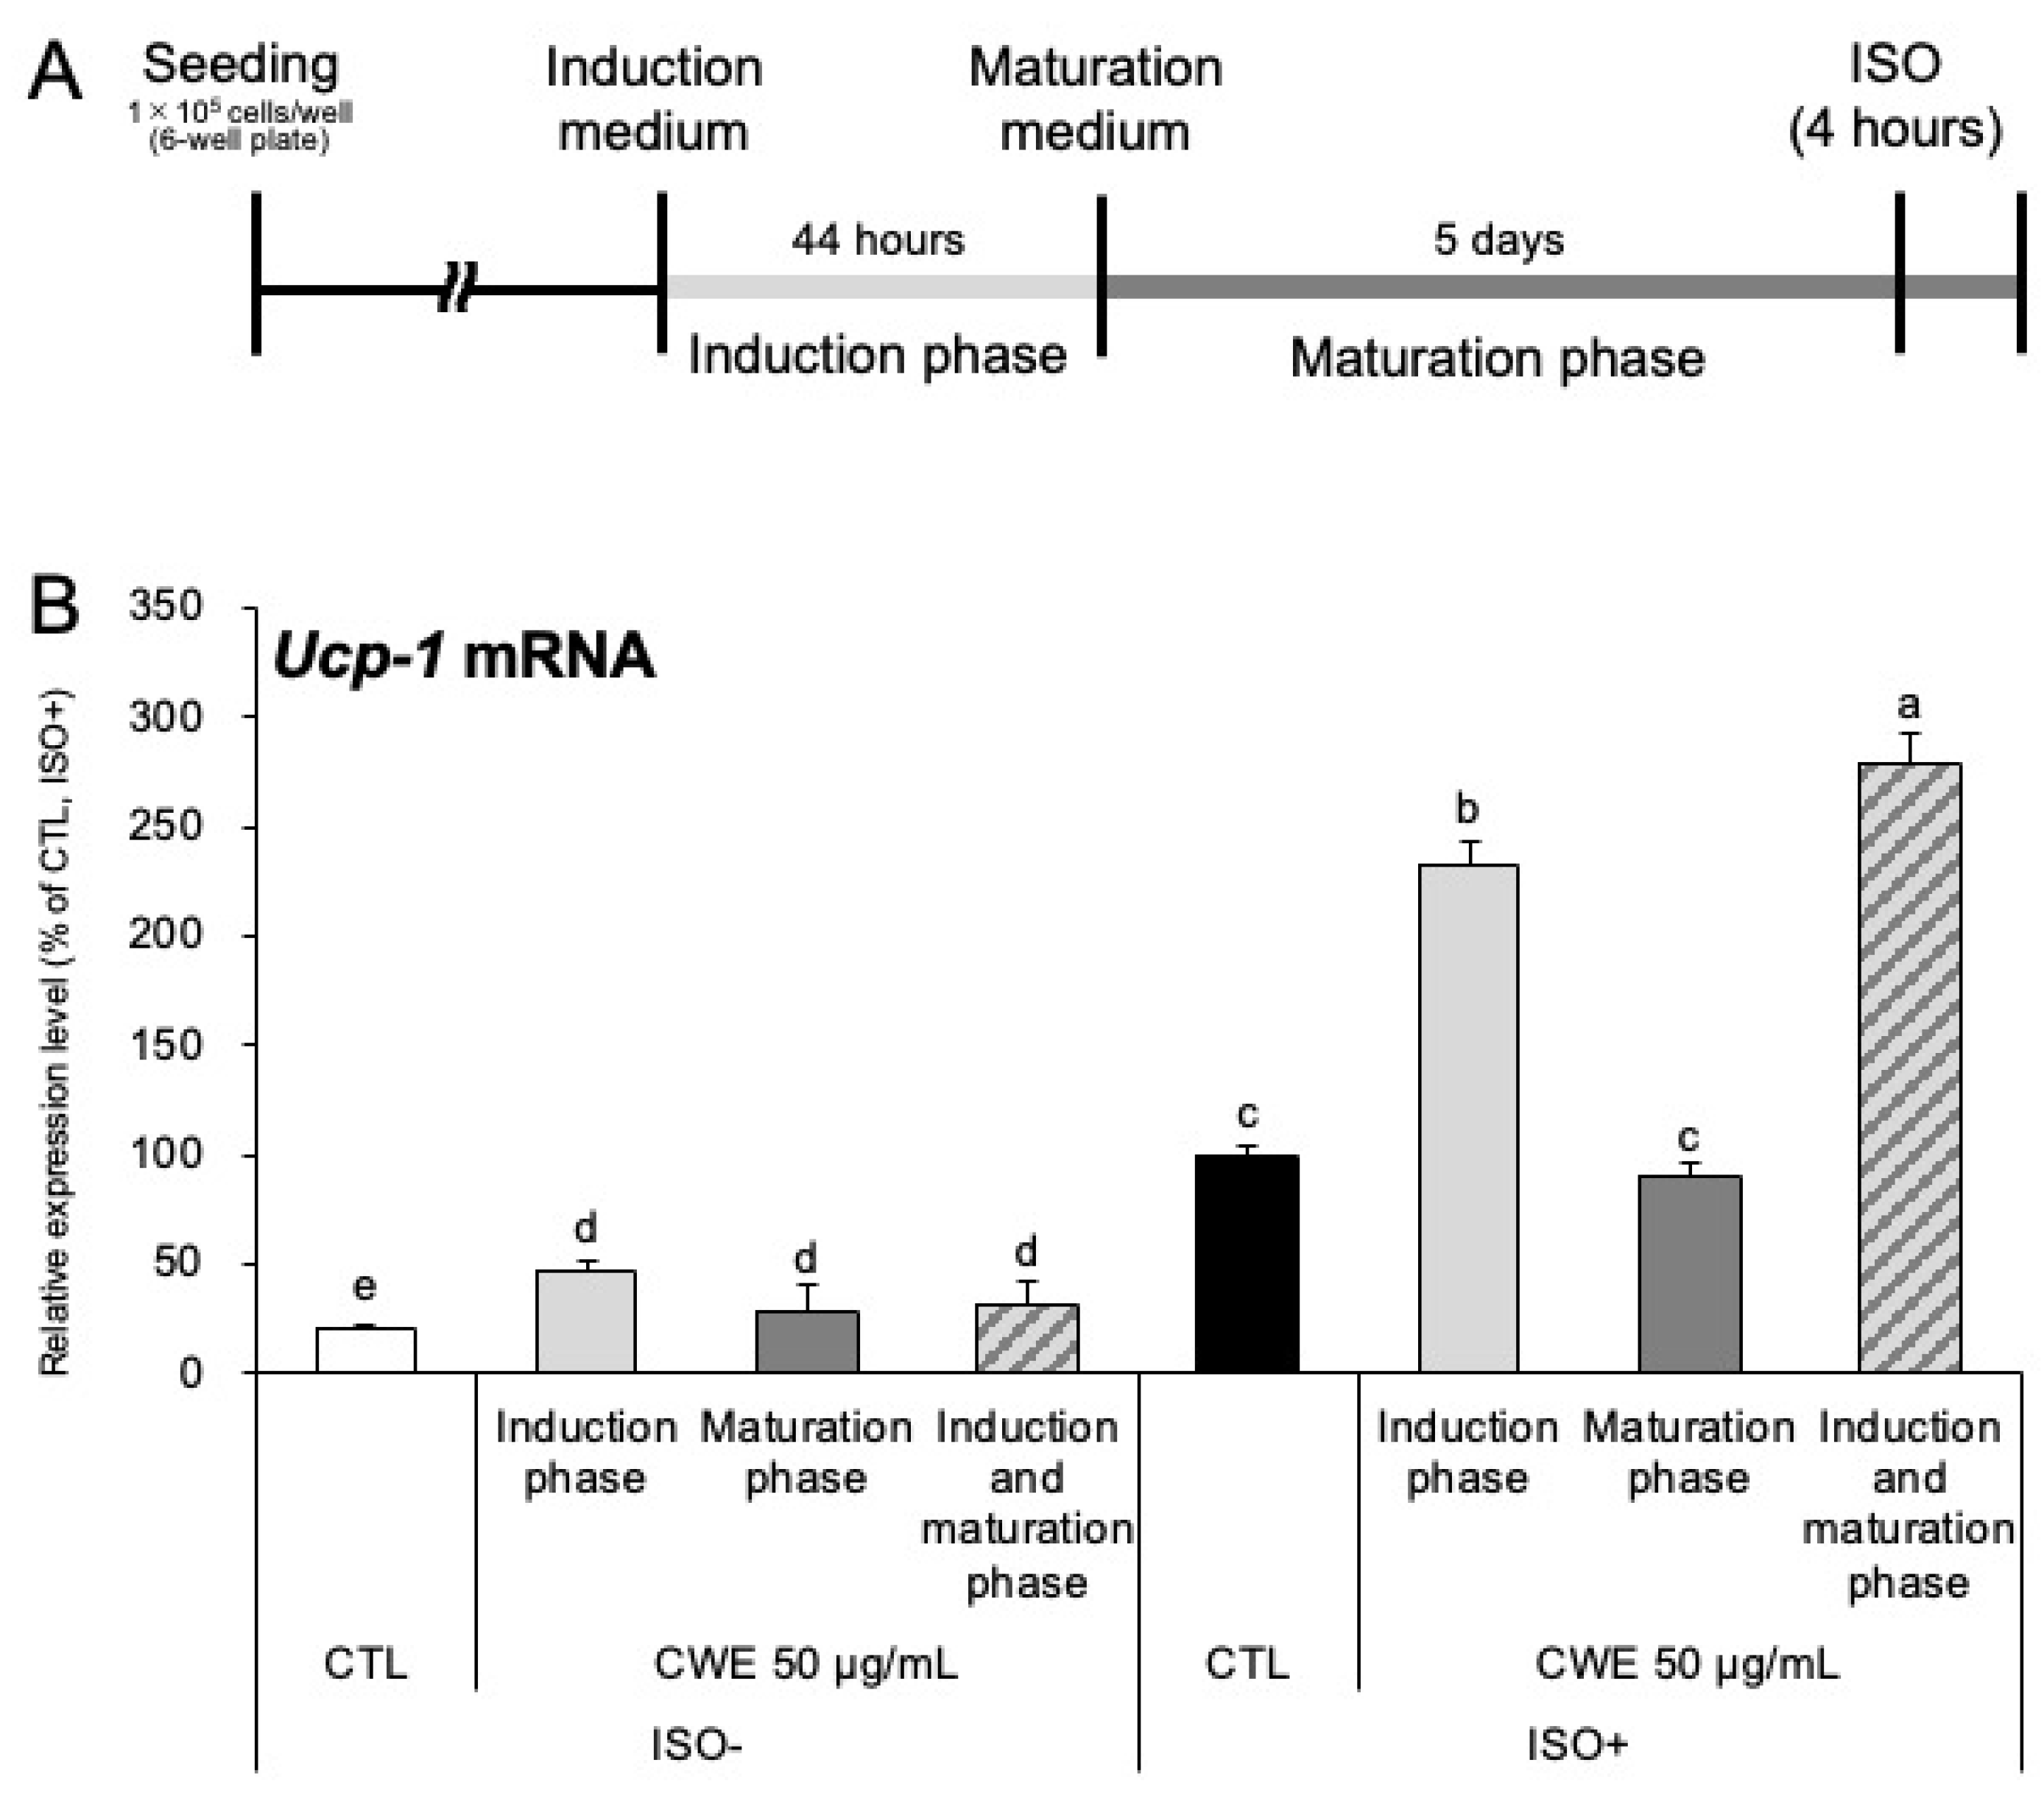
We evaluated the effects of the hexane (CHE) and water (CWE) extracts of C. carvi on Ucp-1 mRNA expression in C3H10T1/2 cells. First, we assessed the cytocompatibility of both extracts and found that concentrations of up to 50 µg/mL were non-toxic for both CHE and CWE (Figure S1A,B). C3H10T1/2 cells were treated with CHE or CWE for 7 days (Figure 1A) and stimulated with the adrenergic agonist isoproterenol (ISO) for 4 h to induce Ucp-1 expression. Neither CHE nor CWE affected Ucp-1 mRNA expression in the absence of ISO stimulation. In contrast, under ISO stimulation, CHE had no effect on Ucp-1 mRNA levels, whereas CWE significantly increased Ucp-1 mRNA in a dose-dependent manner (Figure 1B). Ppargc1a mRNA also increased under ISO stimulation (Figure S2). Furthermore, the effect of caraway on increasing Ucp-1 mRNA expression was maintained under hot water extraction (CHWE), acetic acid extraction (CAE), heating treatment (HT-CWE), and acetic acid treatment (AA-CAE) (Figure S3). CWE treatment did not alter Ucp-1 mRNA expression before ISO stimulation, indicating that the Ucp-1 expression-enhancing effect of CWE manifests exclusively under ISO-induced adrenergic stimulation.
The expression levels of adipocyte differentiation marker genes (Pparg, Fabp4, and Adipoq), beige adipocyte marker genes (Prdm16, Cidea, and Dio2), and genes related to mitochondrial biogenesis and function (Cox4, Cycs, and Ppargc1a) were analyzed using RT-qPCR in C3H10T1/2 cells treated with CWE without ISO stimulation. The mRNA expression levels of Prdm16, Cidea, and Dio2 exhibited a dose-dependent increase in response to CWE (Figure 1C). This effect was also confirmed under ISO stimulation (Figure S4). The expression of adipocyte differentiation marker genes and genes associated with mitochondrial function has not increased. In addition, CWE had no effect on lipid accumulation (Figure S5A,B).

2.2. CWE Enhances Adrenergic Sensitivity During the Induction Phase of Adipocyte Differentiation

As shown in Section 2.1, CWE enhances adrenergic sensitivity in C3H10T1/2 adipocytes, leading to increased Ucp-1 mRNA expression in response to ISO stimulation. Adipocyte differentiation is a multistep process that begins with a 44 h stimulation period (the induction phase), using an induction medium to trigger the early differentiation steps. This is followed by the maturation phase, supported by a maturation medium, which facilitates the formation and maturation of fat droplets. To pinpoint the active stage, we treated cells with CWE separately during the induction or maturation phase (Figure 2A). CWE increased adrenergic sensitivity only when administered during the induction phase (Figure 2B). At this time, no change was observed in the expression of β3 adrenergic receptor (Adrb3) mRNA (Figure S6A). Furthermore, analysis of the cAMP and CREB pathway—a representative pathway linking adrenergic stimulation to Ucp-1 expression—revealed no effect on cAMP levels, CREB phosphorylation, or transcriptional activity (Figure S6B–D).

2.3. CWE Promotes Beige Adipocyte Differentiation During the Induction Phase

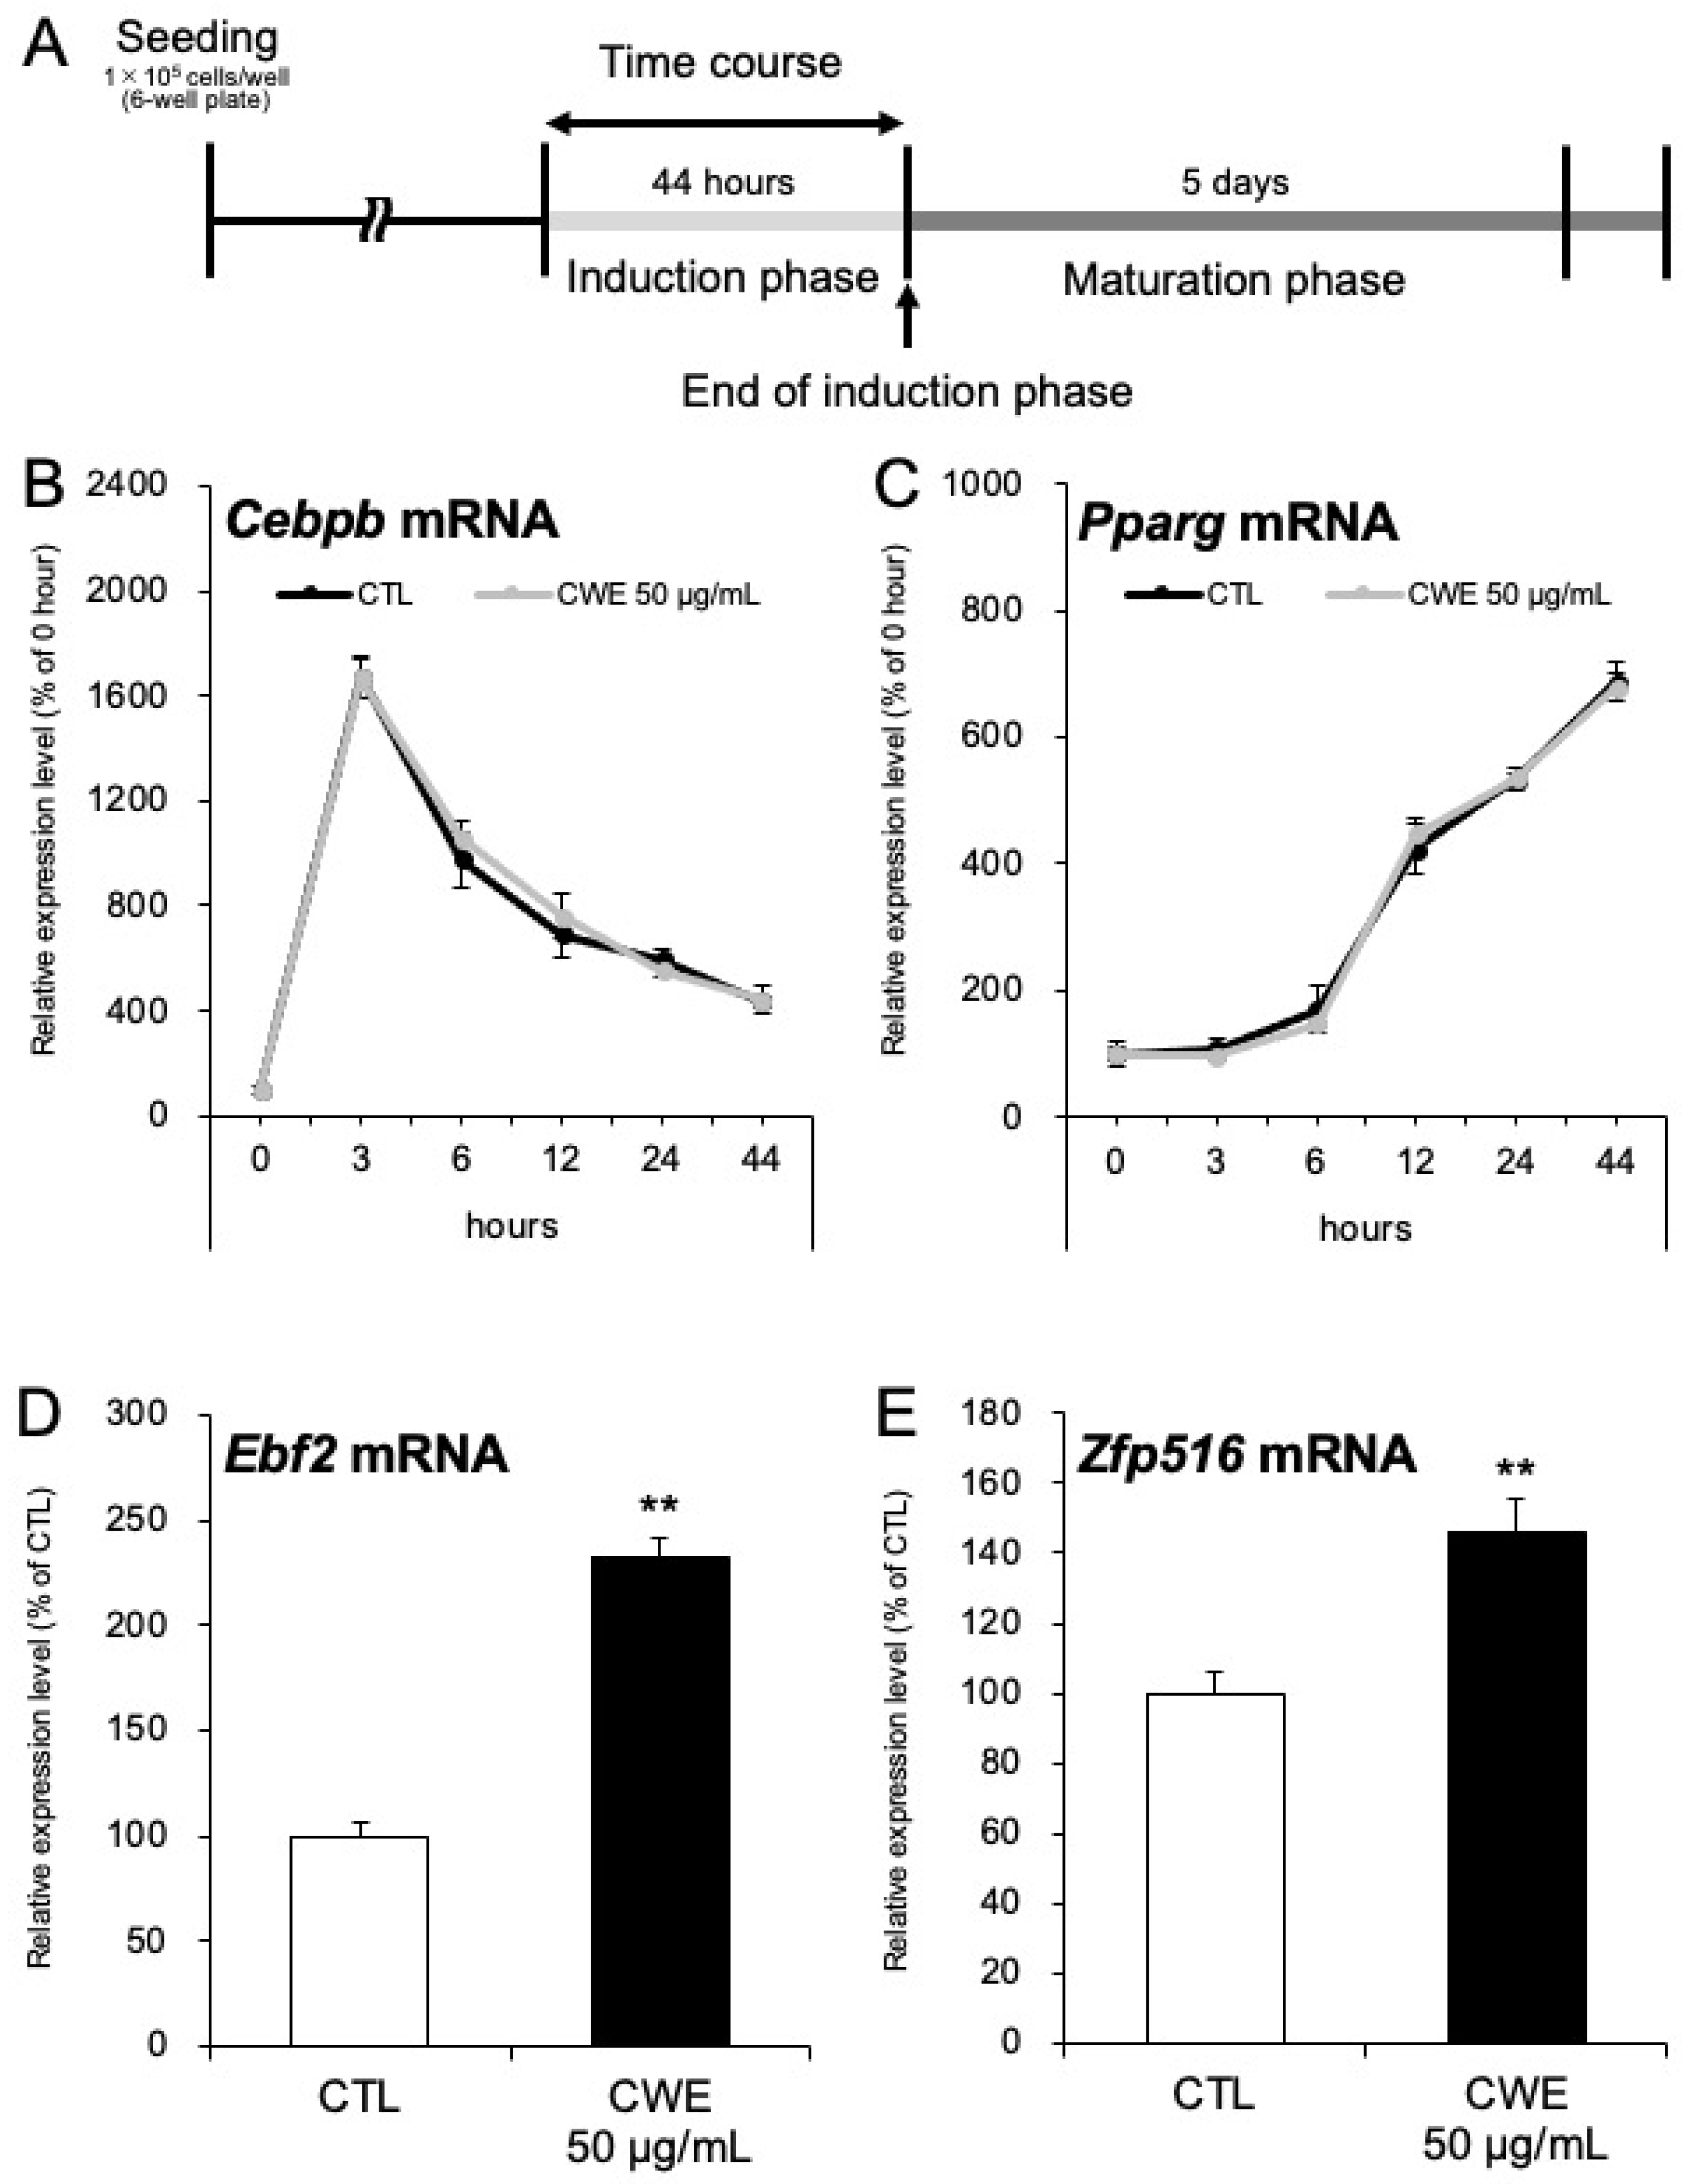
As demonstrated in Section 2.2, CWE enhances adrenergic sensitivity in C3H10T1/2 adipocytes during the induction phase. To further investigate CWE’s effects during this critical period, we analyzed the expression of differentiation-related genes at multiple time points throughout the induction phase (Figure 3A). The mRNA expression of Cebpb (an early differentiation marker) and Pparg (a late differentiation marker) was not significantly different between the control and CWE-treated groups across the time points analyzed (Figure 3B,C). However, at the end of the induction phase (44 h), we further examined the expression of beige adipocyte markers. CWE treatment significantly increased the expression of Ebf2 and Zfp516, which are considered early and mid-stage markers of beige adipocyte differentiation, respectively (Figure 3D,E).

2.4. CHE and CWE Inhibit AP-1/NF-κB Activity and Suppress Inflammatory Gene Expression in RAW264.7 Macrophages

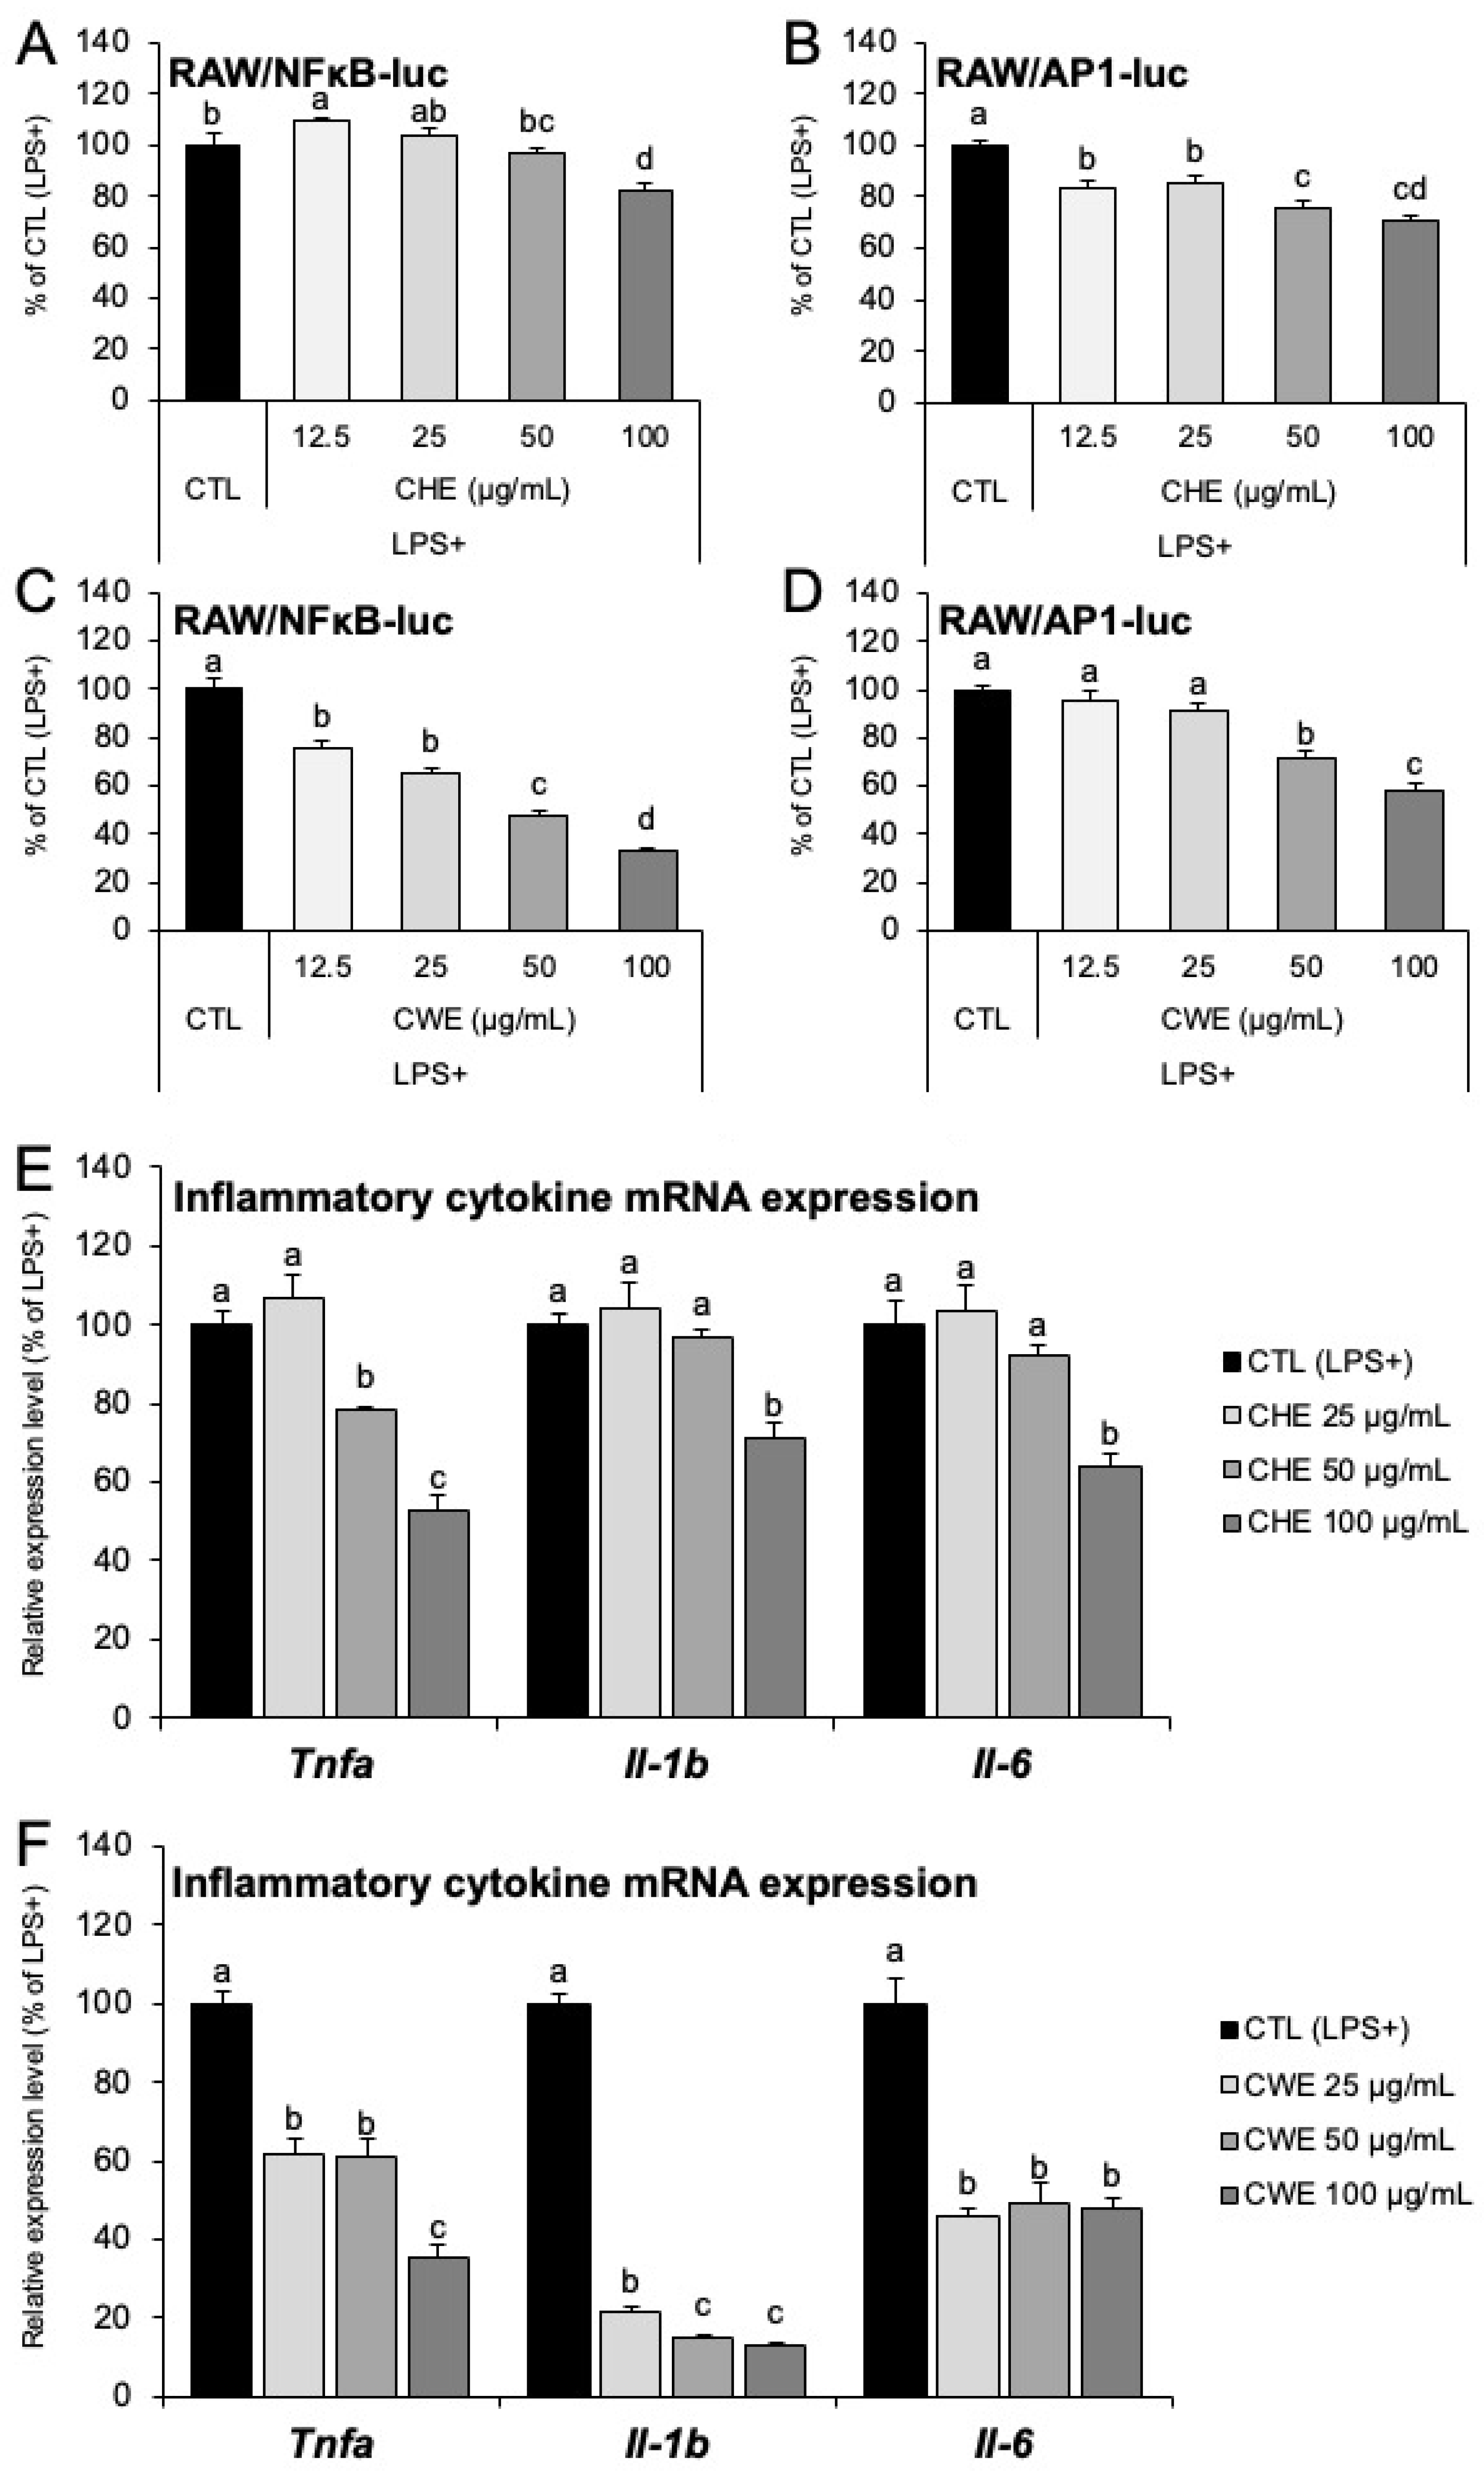
To assess the effect of CHE and CWE on inflammatory gene expression in RAW264.7 macrophages, we first confirmed their cytocompatibility. Concentrations up to 100 µg/mL were non-toxic for both CHE and CWE (Figure S7A,B). We initially evaluated the anti-inflammatory effects using RAW/NFκB-luc and RAW/AP1-luc cells, which are RAW264.7 cells engineered to express respective reporter plasmids. Treatment with 100 µg/mL of CHE led to a reduction in NF-κB activity (Figure 4A). Further, AP-1 activity exhibited a dose-dependent reduction at CHE concentrations of ≥12.5 µg/mL (Figure 4B). CWE demonstrated a dose-dependent reduction in NF-κB activity, with concentrations of ≥12.5 µg/mL showing significant suppression (Figure 4C). AP-1 activity was reduced in a dose-dependent manner at concentrations of ≥50 µg/mL (Figure 4D). Following the reporter assays, we determined the effects of CHE and CWE on the mRNA expression of inflammatory cytokines. Both CHE and CWE suppressed mRNA expression of Tnfa, Il-1b, and Il-6 at concentrations ranging from 25 to 100 µg/mL (Figure 4E,F). When evaluating the anti-inflammatory effects of other extracts—CHWE, CAE, HT-CWE, and AA-CWE—using the same method, only CAE showed no anti-inflammatory effects (Figure S8A,B). We further studied the effect of CHE, carvone, and limonene on the expression of inflammatory cytokines in lipopolysaccharide (LPS)-induced RAW264.7 macrophages. Neither carvone nor limonene had any inhibitory effects individually or in combination, whereas CHE showed significant inhibitory effects (Figure S10A). However, using RAW/NFκB-luc cells, luciferase reporter assays indicated that when macrophages were treated with LPS, carvone had significant inhibitory effects on expression at certain concentrations, whereas limonene had no such effects (Figure S10B,C). The GC-MS results of CHE showed more peaks than previously reported, suggesting that compounds other than carvone and limonene may contribute to the anti-inflammatory effects (Figure S9A).

2.5. Anti-Inflammatory Effects of C. carvi Extracts Restore UCP-1 Expression Suppressed by Inflammation

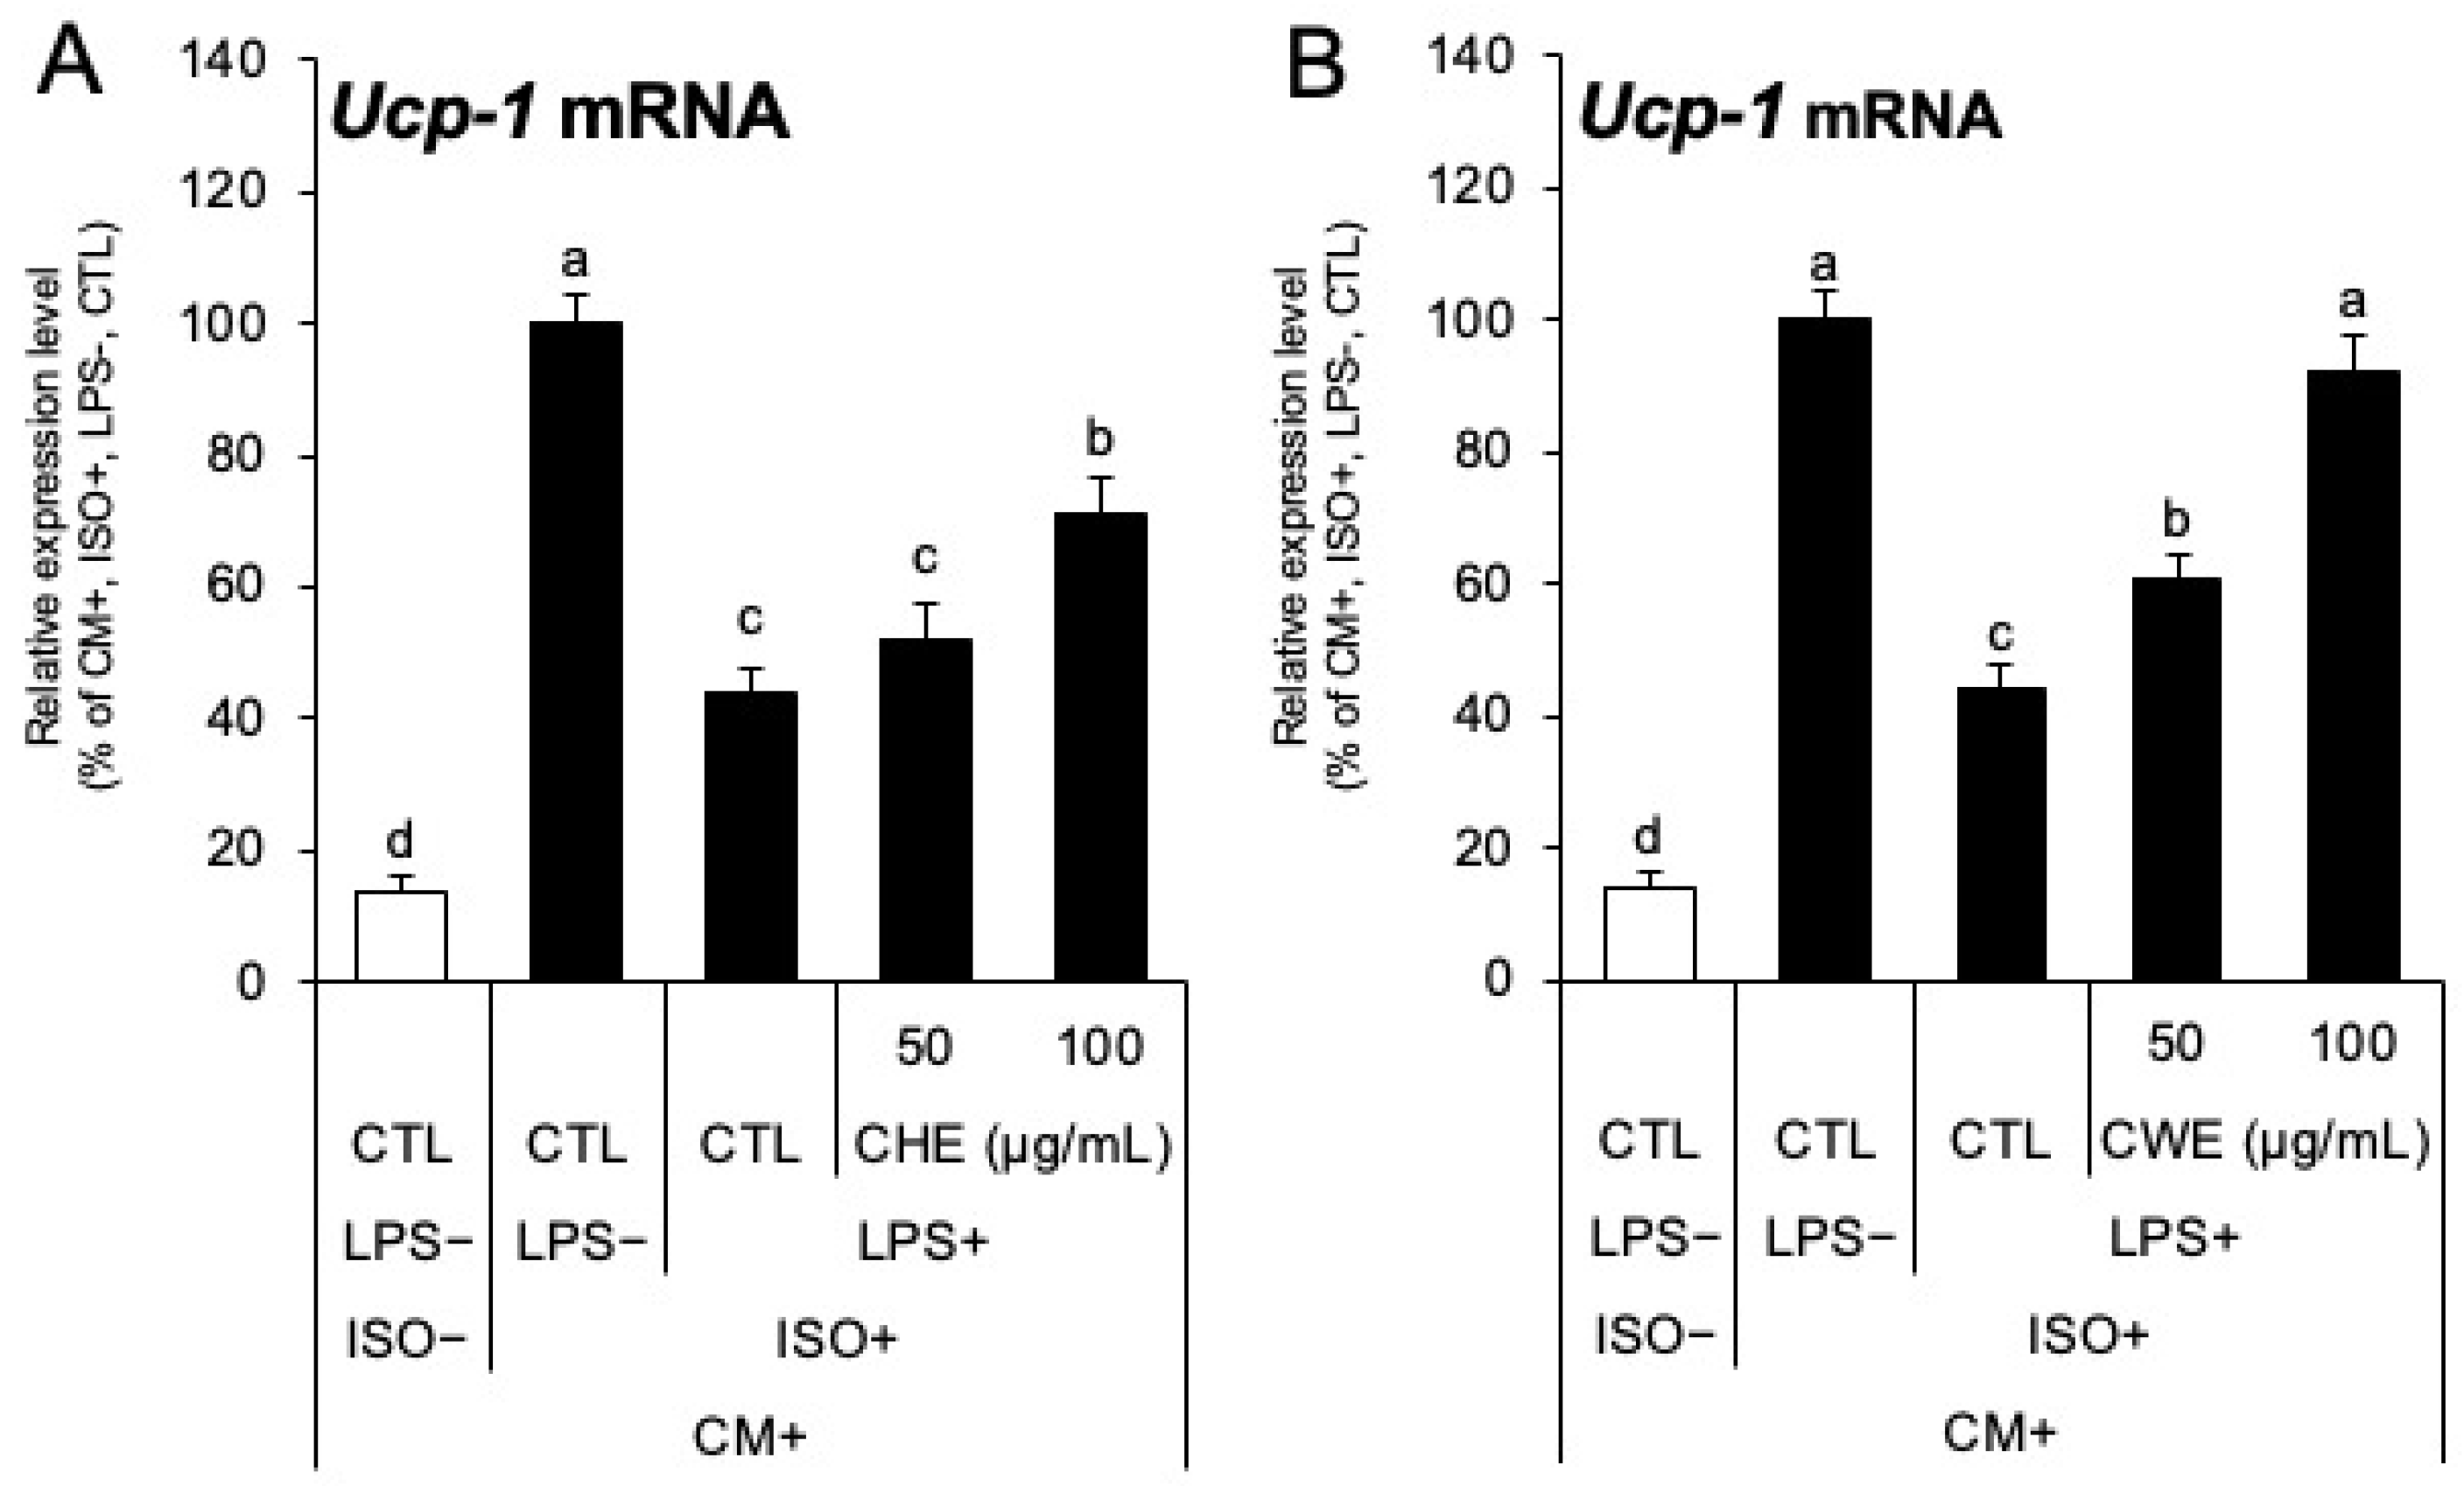
Section 2.4 demonstrated that both CHE and CWE have anti-inflammatory effects. We therefore investigated whether these anti-inflammatory properties could restore Ucp-1 expression, which is typically suppressed by LPS-induced inflammation, by culturing C3H10T1/2 adipocytes with conditioned medium (CM) from RAW264.7 cells (the CM preparation procedure is detailed in Section 4.1). Ucp-1 expression was suppressed in C3H10T1/2 adipocytes after LPS treatment (CTL LPS− ISO+ versus CTL LPS+ ISO+), which was partially restored in C3H10T1/2 adipocytes cultured in CM prepared from RAW264.7 cells treated with 100 µg/mL CHE (Figure 5A). The expression was almost completely restored in a dose-dependent manner in C3H10T1/2 adipocytes treated with CM prepared from RAW264.7 cells treated with 50 and 100 µg/mL CWE (Figure 5B).

3. Discussion

In this study, we showed that CWE increases Ucp-1 mRNA expression in C3H10T1/2 adipocytes through both direct and indirect effects. This activity was not observed with CHE, suggesting that the primary active compound(s) are water-soluble. Generally, increased Ucp-1 expression in adipocytes implies enhanced thermogenic capacity, which is considered an anti-obesity effect [20]. As shown in Figure 1B, the increase in Ucp-1 expression occurred only under adrenergic stimulation with ISO, suggesting that CWE enhances adrenergic sensitivity rather than inducing basal Ucp-1 expression. Notably, CWE selectively increased the expression of beige adipocyte marker genes (Prdm16, Cidea, and Dio2) but did not affect general adipogenic differentiation markers (Pparg, Fabp4, and Adipoq) or mitochondrial-related genes (Cox4, Cycs, and Ppargc1a) (Figure 1C,D). This selective effect is supported by the unaltered lipid accumulation observed in the cells (Figure S5A,B). The activation of Ucp-1 transcription is significantly influenced by PR domain containing 16 (PRDM16) [21,22]. The increased expression of Prdm16 likely contributes to the elevated Ucp-1 levels. Similarly, Cell death–inducing DNA fragmentation factor, alpha subunit-like effector A (CIDEA) and deiodinase, iodothyronine, type II (DIO2) are specifically increased during beige adipocyte differentiation [23,24,25]. Their upregulation indicates that the adipocytes are in a state more conducive to Ucp-1 expression. This evidence strongly suggests that CWE selectively induces beige adipocyte differentiation rather than promoting general adipogenesis. Furthermore, the results shown in Figure 2A,B indicate that CWE’s action is specific to the induction phase of adipocyte differentiation, implying its involvement in early transcriptional regulatory events that direct precursor cells toward a beige phenotype.
To investigate the mechanisms by which CWE enhances adrenergic sensitivity, we analyzed the representative cascade leading from adrenergic stimulation to Ucp-1 expression. This pathway begins with norepinephrine binding to the β3 adrenergic receptor (Adrb3), which increases intracellular cAMP concentration, activating PKA, and subsequently phosphorylating and activating CREB to initiate transcription [26]. We first analyzed Adrb3 mRNA levels but observed no change following CWE treatment (Figure S6A). Next, we examined intracellular cAMP concentration after ISO stimulation, which was not altered by CWE (Figure S6B). Finally, no changes in CREB activity were observed with CWE treatment across any experimental method (Figure S6C,D). These findings suggest that CWE does not activate the major Adrb3-to-CREB pathway for Ucp-1 expression. Isolating the active compounds from the extract would enable a more detailed investigation of the underlying mechanisms.
Early B cell factor 2 (EBF2) is an established early differentiation marker of beige adipocytes [27,28], while ZFP516 is a mid-stage marker [29]. The increased expression of both Ebf2 and Zfp516 suggests that CWE acts upstream of PRDM16, potentially enhancing the commitment to beige adipocyte differentiation. EBF2 influences the chromatin structure at the binding site for PGC1-α (a transcription regulator of Ucp-1 activated by adrenaline), thereby facilitating PGC1-α binding [26,27,28]. Thus, the increased Ebf2 expression further supports the claim that CWE enhances adrenaline sensitivity. While we have previously reported that food-derived compounds can enhance adrenaline sensitivity [30], the mechanism remained unclear. The present study provides direct evidence that increased Ebf2 expression may upregulate Ucp-1 expression via enhanced adrenaline.
Based on the observation that CWE does not alter Adrb3 expression or CREB activity (Figure S6A,C,D) but increases Ebf2, Zfp516 (Figure 3D,E), and Prdm16 (Figure 1C) expression, we anticipate that increased Ebf2 contributes to stabilizing chromatin structure, while increased Zfp516 and Prdm16 lead to the formation of more transcription complexes, ultimately increasing Ucp-1 mRNA expression during adrenergic stimulation (Figure S11).
CWE also exhibited strong anti-inflammatory effects in RAW264.7 macrophages. Both CHE and CWE reduced the transcriptional activity of NF-κB and AP-1 (Figure 4A–D) and significantly suppressed the mRNA expression of inflammatory cytokines (Figure 4E,F), suggesting that both extracts may exert anti-inflammatory effects by acting upstream of NF-κB and AP-1. Notably, carvone and limonene, major compounds of CHE, did not show any anti-inflammatory effects [16,18] at the concentrations present in the CHE used in this study (Figure S10A–C). Thus, the anti-inflammatory effect of CHE is likely due to compounds other than carvone and limonene. Since CHE and CWE contain different compounds [31,32], the active anti-inflammatory compounds in CWE are also likely distinct. Due to the large number of compounds in CWE, individual compound analysis was beyond the scope of this study; further investigation of the hydrophilic compounds is necessary.
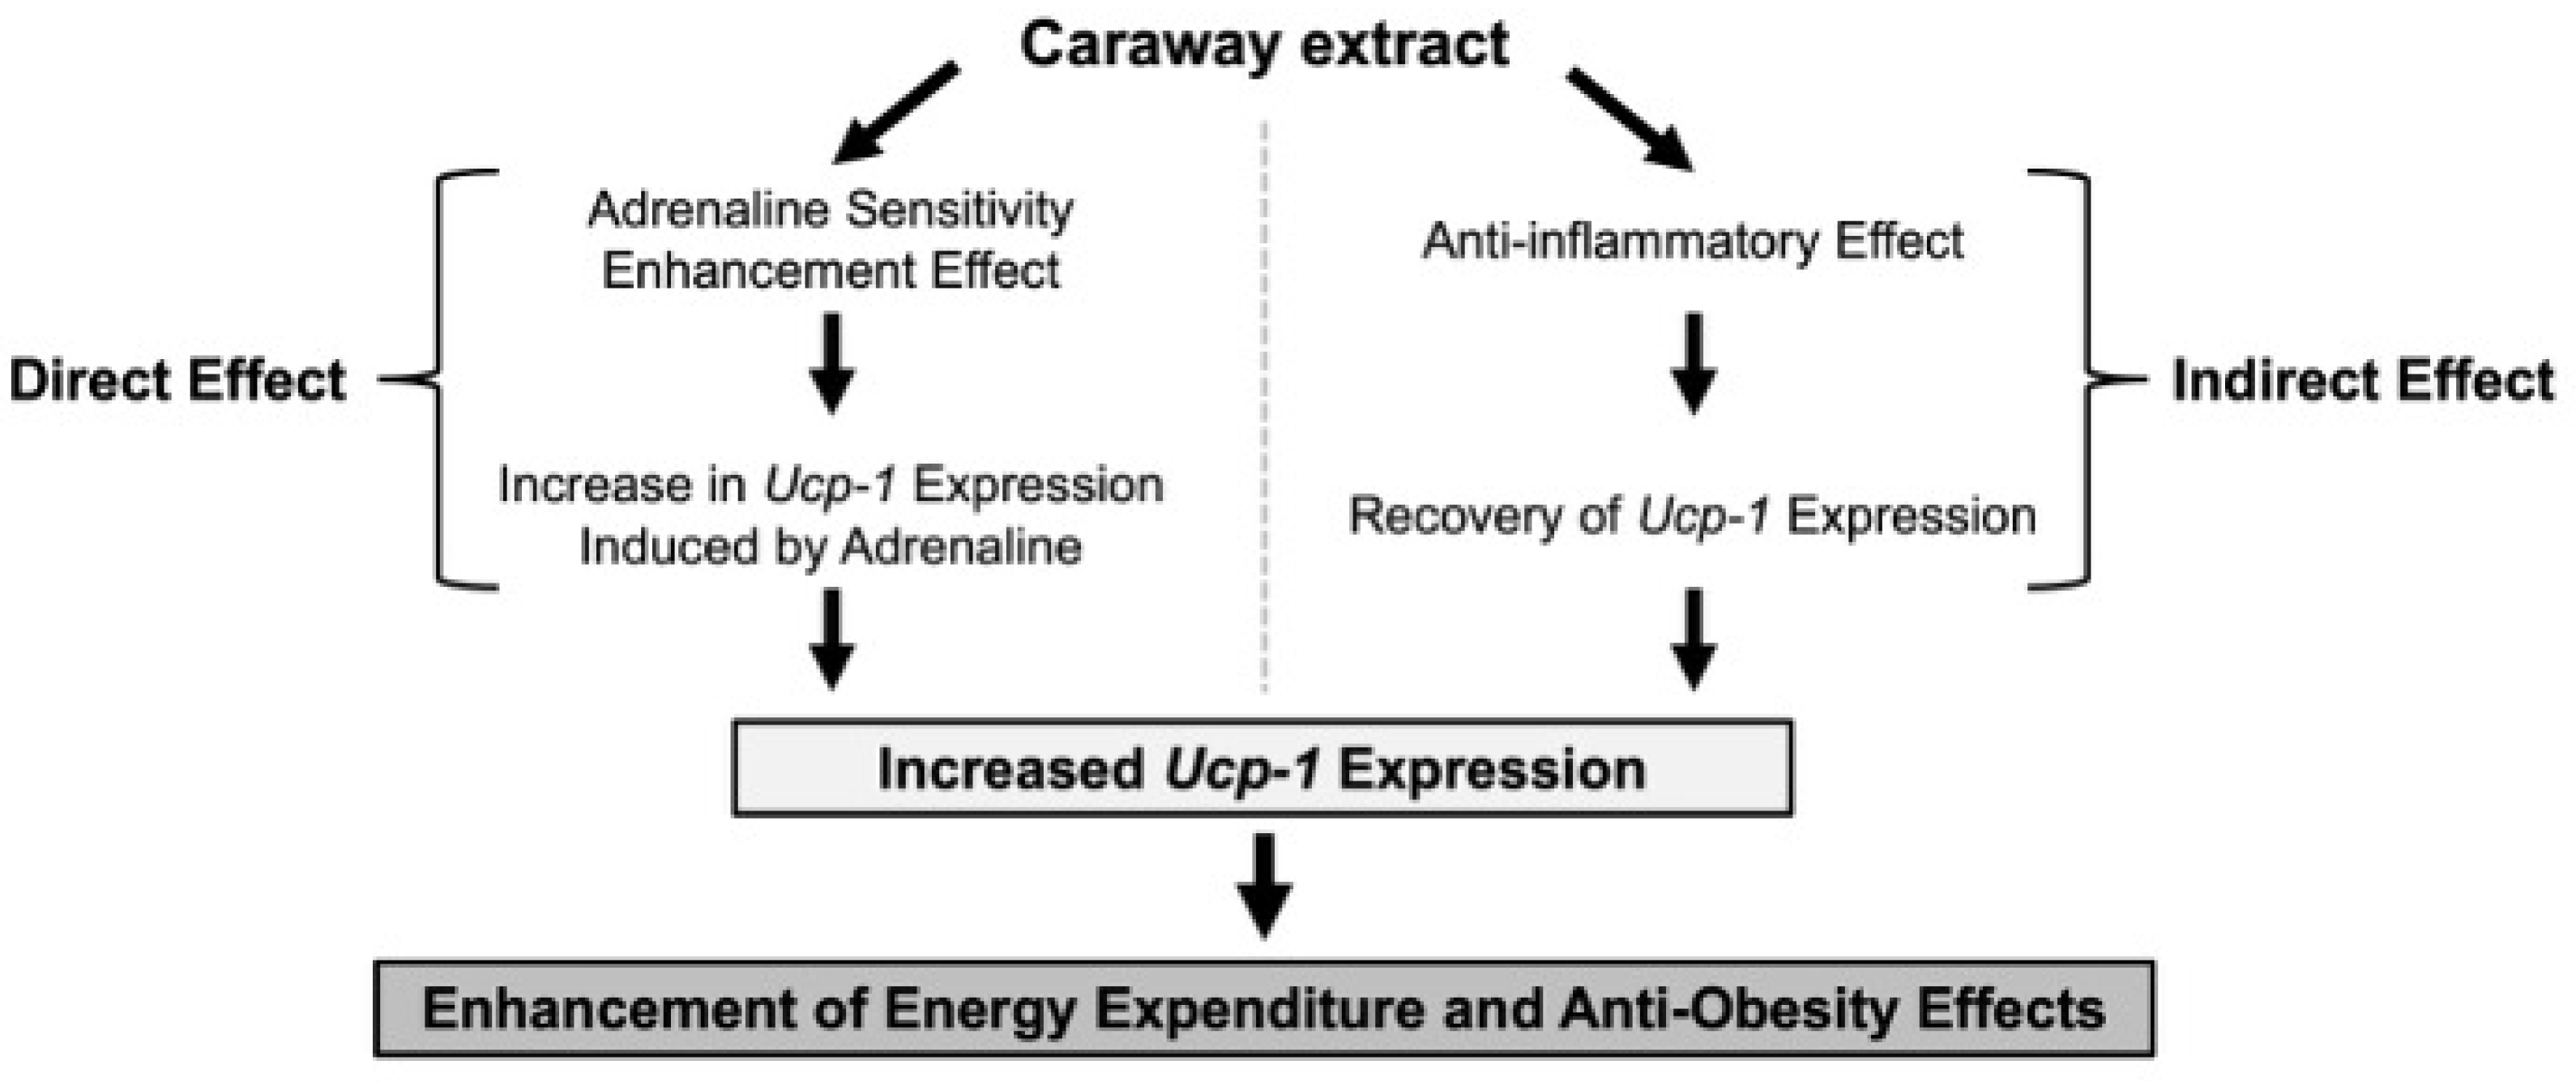
As the physiological significance of the anti-inflammatory effect was established, we further examined its impact on thermogenesis. We found that the CM obtained from macrophages treated with CHE or CWE restored Ucp-1 expression in adipocytes that had been suppressed by inflammation (Figure 5A,B). Chronic inflammation associated with obesity and metabolic disorders is known to impair heat production [7,33]. This suggests that the anti-inflammatory effects of CHE or CWE may indirectly contribute to maintaining beige adipocyte function. The combined results indicate that CWE possesses a dual mechanism for enhancing Ucp-1 expression: (1) direct promotion of beige adipocyte differentiation during the adipocyte induction phase, and (2) indirect support through macrophage-mediated suppression of inflammation (Figure 6). Previous analyses of the physiological effects of C. carvi have primarily focused on lipophilic compounds such as essential oils [34]. However, this study is novel in finding that CWE increases Ucp-1 expression via adrenaline sensitivity enhancement and restores inflammation-suppressed Ucp-1 expression via anti-inflammatory effects. These findings expand the potential of spices and highlight the importance of investigating water-soluble extracts, particularly since the mechanism of adrenaline sensitivity enhancement has been partly elucidated through the role of Ebf2. The findings of this study suggest that CWE may serve as a functional ingredient with potential anti-obesity properties.

4. Materials and Methods

4.1. Chemicals

Carvone and limonene were purchased from Tokyo Chemical Industry Co., Ltd. (Tokyo, Japan). All other reagents were purchased from FUJIFILM Wako Pure Chemical Corporation (Osaka, Japan) or Nacalai Tesque, Inc. (Kyoto, Japan).

4.2. Cell Culture

We used the cell lines C3H10T1/2 (adipocyte model, Sumitomo Dainippon Pharmaceutical Co., Ltd., Osaka, Japan) and RAW264.7 (macrophage model, RIKEN BioResource Center, Tsukuba, Japan). C3H10T1/2 cells were maintained in high-glucose DMEM (glucose 4.5 mg/mL), whereas RAW264.7 cells were cultured in αMEM supplemented with 10% FBS, 100 U/mL penicillin, and 100 μg/mL streptomycin. Both cell lines were cultured at 37 °C in a humidified 5% CO2 atmosphere. C3H10T1/2 differentiation was initiated by culturing cells in an induction medium (containing 0.5 mM 3-isobutyl-1-methylxanthine, 0.25 μM dexamethasone, and 10 μg/mL insulin) for 44 h. The medium was then switched to a maturation medium (containing 5 μg/mL insulin), which was refreshed every 2 days thereafter. Ucp-1 mRNA expression was induced by treating mature adipocytes with 10 µM ISO for 4 h at the end of the maturation phase.

4.3. Treatment of C3H10T1/2 Cells with Extracts

C3H10T1/2 adipocytes were treated with the respective extracts (CHE or CWE) at the indicated concentrations during the induction phase, maturation phase, or both. ISO stimulation was performed at the same time point as described in Section 4.2. Upon completion of all treatments, cells were collected for RNA isolation and gene expression measurement.

4.4. Treatment of RAW264.7 Macrophages with Extracts

Inflammation in RAW264.7 cells was induced using LPS. RAW264.7 cells expressing the respective luciferase reporter plasmids were pre-treated with the extract for 24 h. Inflammation was then induced by adding 0.1 µg/mL of LPS during the final 3 h of the 24 h period. Luciferase activity was measured as described in Section 4.8. RAW264.7 cells were treated with extracts for 24 h. Inflammation was induced by adding 1 µg/mL LPS during the final 6 h of the 24 h treatment. Ucp-1 mRNA expression was measured using RT-qPCR.

4.5. Treatment of C3H10T1/2 Adipocytes with RAW264.7-Conditioned Medium

CM was prepared following a previously reported method [35]. RAW264.7 macrophages were pre-treated with the indicated concentrations of CWE/CHE for 24 h. During this 24 h period, the cells were stimulated with 1 μg/mL LPS for 6 h. Cells were then washed and cultured in serum-free medium for 24 h. This medium was collected, stored at 4 °C and used as CM. Differentiated C3H10T1/2 adipocytes were treated with CM for 24 h. At 20 h of culture, the cells were treated with 10 μM ISO for 4 h. Cells were then collected to measure Ucp-1 mRNA levels using qRT-PCR.

4.6. Preparation of Extracts

C. carvi (Caraway) was sourced from the Netherlands and supplied by Camel Coffee Co., Ltd. (Japan, Tokyo). Extraction methods were based on previous reports [32]. One gram of C. carvi was extracted with 22 mL of n-hexane by heating at 60 °C for 2 h. The filtered extract was dried using an evaporator at 55 °C to remove n-hexane. The resultant extract was dissolved in DMSO and designated as CHE for use in experiments. The C. carvi residue remaining after hexane extraction was subjected to water extraction at 4 °C for 24 h. The filtered extract was lyophilized (freeze-dried) to remove water. The resulting powder was dissolved in water, and designated as CWE for cell experiments.

4.7. RNA Preparation and Quantitative RT-PCR Analysis

Total RNA was extracted from cultured cells using Sepasol (R)-RNA I Super (Nacalai Tesque, Inc.) following the manufacturer’s instructions. Reverse transcription (RT) was performed using a ReverTra ACE® kit (TOYOBO Co., Ltd., Osaka, Japan) on a thermal cycler (LifeEco, Nippon Genetics Co., Ltd., Tokyo, Japan). Quantitative RT-PCR (qPCR) was conducted using SYBR Green fluorescent signals on the StepOnePlus system (Thermo Fisher Scientific Inc., Waltham, MA, USA) following established protocols [25]. Oligonucleotide primers were designed using the Primer-BLAST website. Primer sequences are provided in Supplementary Table S1. 36b4 mRNA expression was used as an internal control. All mRNA expression levels are presented as a ratio relative to the control in each experiment.

4.8. Luciferase Ligand Assay

pGL4.32 [luc2p/NFκB-RE/Hygro] and pGL4.44 [luc2P/AP1-RE/Hygro] plasmids (Promega K.K., Madison, WI, USA) were transfected into different RAW264.7 cells using Lipofectamine 2000 (Thermo Fisher Scientific Inc.). Stable expression strains were selected with 100 μg/mL hygromycin. Transfected cells were cultured in 96-well plates and treated with extracts and LPS as described in Section 4.4. Cells were then lysed, and the luciferase assay was performed using the luciferase reporter gene assay system from Promega K.K.

4.9. Statistical Analyses

Results are presented as the mean ± S.D. (n = 3 for all analyses). No experimental units were excluded. Statistical significance was determined using Tukey’s multiple comparison test following one-way analysis of variance (ANOVA). For results involving multiple factors, Tukey’s multiple comparison test was performed after two-way ANOVA when interactions were observed. The statistical significance level was set at p < 0.05.

Supplementary Materials

The following supporting information can be downloaded at: https://www.mdpi.com/article/10.3390/ijms262210970/s1.

Author Contributions

Conceptualization, T.K., M.U. and N.T. (Nobuyuki Takahashi); methodology, H.T., T.G., T.K. and N.T. (Nobuyuki Takahashi); investigation, H.T., N.T. (Nanami Tomishima), T.S., H.M. and H.I.; data curation, H.T., N.T. (Nanami Tomishima), T.S., H.M. and H.I.; writing—original draft preparation, H.T.; writing—review and editing, K.K., T.K., M.U. and N.T. (Nobuyuki Takahashi); funding acquisition, N.T. (Nobuyuki Takahashi). All authors have read and agreed to the published version of the manuscript.

Funding

This research was supported by Research Grant from Urakami Foundation for Food and Food Culture Promotion (No. R05314) and Grants-in-Aid for Scientific Research from the Ministry of Education, Culture, Sports, Science and Technology of Japan (No. 24K01710).

Institutional Review Board Statement

Not applicable.

Informed Consent Statement

Not applicable.

Data Availability Statement

The datasets used are available on request from the authors.

Acknowledgments

The authors thank Ayame Inoue, Yuto Kimura, and Takaharu Sangawa for technical assistance.

Conflicts of Interest

The authors declare no conflicts of interest.

References

  1. Chouchani, E.T.; Kazak, L.; Spiegelman, B.M. New advances in adaptive thermogenesis: UCP1 and beyond. Cell Metab. 2019, 29, 27–37. [Google Scholar] [CrossRef]
  2. Kopecky, J.; Clarke, G.; Enerbäck, S.; Spiegelman, B.; Kozak, L.P. Expression of the Mitochondrial Uncoupling Protein Gene from the aP2 Gene Promoter Prevents Genetic Obesity. J. Clin. Investig. 1995, 96, 2914–2923. [Google Scholar] [CrossRef] [PubMed]
  3. Nishimura, T.; Katsumura, T.; Motoi, M.; Oota, H.; Watanuki, S. Experimental Evidence Reveals the UCP1 Genotype Changes the Oxygen Consumption Attributed to Non-Shivering Thermogenesis in Humans. Sci. Rep. 2017, 7, 5570. [Google Scholar] [CrossRef] [PubMed]
  4. Rousset, S.; Alves-Guerra, M.-C.; Mozo, J.; Miroux, B.; Cassard-Doulcier, A.-M.; Bouillaud, F.; Ricquier, D. The biology of mitochondrial uncoupling proteins. Diabetes 2004, 53 (Suppl. S1), S130–S135. [Google Scholar] [CrossRef]
  5. Sidossis, L.; Kajimura, S. Brown and beige fat in humans: Thermogenic adipocytes that control energy and glucose homeostasis. J. Clin. Investig. 2015, 125, 478–486. [Google Scholar] [CrossRef]
  6. Sakamoto, T.; Takahashi, N.; Sawaragi, Y.; Naknukool, S.; Yu, R.; Goto, T.; Kawada, T. Inflammation induced by RAW macrophages suppresses UCP1 mRNA induction via ERK activation in 10T1/2 adipocytes. Am. J. Physiol. Cell Physiol. 2013, 304, C729–C738. [Google Scholar] [CrossRef]
  7. Sakamoto, T.; Nitta, T.; Maruno, K.; Yeh, Y.-S.; Kuwata, H.; Tomita, K.; Goto, T.; Takahashi, N.; Kawada, T. Macrophage infiltration into obese adipose tissues suppresses the induction of UCP1 level in mice. Am. J. Physiol. Endocrinol. Metab. 2016, 310, E676–E687. [Google Scholar] [CrossRef] [PubMed]
  8. Goto, T.; Naknukool, S.; Yoshitake, R.; Hanafusa, Y.; Tokiwa, S.; Li, Y.; Sakamoto, T.; Nitta, T.; Kim, M.; Takahashi, N.; et al. Proinflammatory cytokine interleukin-1β suppresses cold-induced thermogenesis in adipocytes. Cytokine 2016, 77, 107–114. [Google Scholar] [CrossRef]
  9. El Hadi, H.; Di Vincenzo, A.; Vettor, R.; Rossato, M. Food ingredients involved in white-to-brown adipose tissue conversion and in calorie burning. Front. Physiol. 2018, 9, 1954. [Google Scholar] [CrossRef]
  10. Kim, N.; Nam, M.; Kang, M.S.; Lee, J.O.; Lee, Y.W.; Hwang, G.-S.; Kim, H.S. Piperine regulates UCP1 through the AMPK pathway by generating intracellular lactate production in muscle cells. Sci. Rep. 2017, 7, 41066. [Google Scholar] [CrossRef] [PubMed]
  11. Kobayashi, H.; Horiguchi-Babamoto, E.; Suzuki, M.; Makihara, H.; Tomozawa, H.; Tsubata, M.; Shimada, T.; Sugiyama, K.; Aburada, M. Effects of ethyl acetate extract of Kaempferia parviflora on brown adipose tissue. J. Nat. Med. 2016, 70, 54–61. [Google Scholar] [CrossRef]
  12. Kim, M.; Goto, T.; Yu, R.; Uchida, K.; Tominaga, M.; Kano, Y.; Takahashi, N.; Kawada, T. Fish oil intake induces UCP1 upregulation in brown and white adipose tissue via the sympathetic nervous system. Sci. Rep. 2015, 5, 18013. [Google Scholar] [CrossRef] [PubMed]
  13. Wang, S.; Liang, X.; Yang, Q.; Fu, X.; Rogers, C.J.; Zhu, M.; Rodgers, B.D.; Jiang, Q.; Dodson, M.V.; Du, M. Resveratrol induces brown-like adipocyte formation in white fat through activation of AMP-activated protein kinase (AMPK) α1. Int. J. Obes. 2015, 39, 967–976. [Google Scholar] [CrossRef]
  14. Lee, M.-S.; Shin, Y.; Jung, S.; Kim, Y. Effects of epigallocatechin-3-gallate on thermogenesis and mitochondrial biogenesis in brown adipose tissues of diet-induced obese mice. Food Nutr. Res. 2017, 61, 1325307. [Google Scholar] [CrossRef]
  15. Hara, H.; Takahashi, H.; Mohri, S.; Murakami, H.; Kawarasaki, S.; Iwase, M.; Takahashi, N.; Sugiura, M.; Goto, T.; Kawada, T. β-Cryptoxanthin Induces UCP-1 Expression via a RAR Pathway in Adipose Tissue. J. Agric. Food Chem. 2019, 67, 10595–10603. [Google Scholar] [CrossRef]
  16. Yoon, W.-J.; Lee, N.H.; Hyun, C.-G. Limonene suppresses lipopolysaccharide-induced production of nitric oxide, prostaglandin E2, and pro-inflammatory cytokines in RAW 264.7 macrophages. J. Oleo Sci. 2010, 59, 415–421. [Google Scholar] [CrossRef]
  17. Seddighfar, M.; Mirghazanfari, S.M.; Dadpay, M. Analgesic and anti-inflammatory properties of hydroalcoholic extracts of Malva sylvestris, Carum carvi or Medicago sativa, and their combination in a rat model. J. Integr. Med. 2020, 18, 181–188. [Google Scholar] [CrossRef] [PubMed]
  18. Sousa, C.; Neves, B.M.; Leitão, A.J.; Mendes, A.F. Molecular mechanisms underlying the anti-inflammatory properties of (R)-(-)-carvone: Potential roles of JNK1, Nrf2 and NF-κB. Pharmaceutics 2023, 15, 249. [Google Scholar] [CrossRef] [PubMed]
  19. Keshavarz, A.; Minaiyan, M.; Ghannadi, A.; Mahzouni, P. Effects of Carum carvi L. (Caraway) Extract and Essential Oil on TNBS-Induced Colitis in Rats. Res. Pharm. Sci. 2013, 8, 1–8. [Google Scholar]
  20. Takahashi, A.; Adachi, S.; Morita, M.; Tokumasu, M.; Natsume, T.; Suzuki, T.; Yamamoto, T. Post-Transcriptional Stabilization of Ucp1 mRNA Protects Mice from Diet-Induced Obesity. Cell Rep. 2015, 13, 2756–2767. [Google Scholar] [CrossRef]
  21. Seale, P.; Kajimura, S.; Yang, W.; Chin, S.; Rohas, L.M.; Uldry, M.; Tavernier, G.; Langin, D.; Spiegelman, B.M. Transcriptional control of brown fat determination by PRDM16. Cell Metab. 2007, 6, 38–54. [Google Scholar] [CrossRef]
  22. Iida, S.; Chen, W.; Nakadai, T.; Ohkuma, Y.; Roeder, R.G. PRDM16 enhances nuclear receptor-dependent transcription of the brown fat-specific Ucp1 gene through interactions with Mediator subunit MED1. Genes Dev. 2015, 29, 308–321. [Google Scholar] [CrossRef] [PubMed]
  23. Garcia, R.A.; Roemmich, J.N.; Claycombe, K.J. Evaluation of markers of beige adipocytes in white adipose tissue of the mouse. Nutr. Metab. 2016, 13, 24. [Google Scholar] [CrossRef]
  24. Hoang, A.C.; Yu, H.; Röszer, T. Transcriptional landscaping identifies a beige adipocyte depot in the newborn mouse. Cells 2021, 10, 2368. [Google Scholar] [CrossRef]
  25. Machado, S.A.; Pasquarelli-do-Nascimento, G.; Da Silva, D.S.; Farias, G.R.; De Oliveira Santos, I.; Baptista, L.B.; Magalhães, K.G. Browning of the white adipose tissue regulation: New insights into nutritional and metabolic relevance in health and diseases. Nutr. Metab. 2022, 19, 61. [Google Scholar] [CrossRef]
  26. Tabuchi, C.; Sul, H.S. Signaling Pathways Regulating Thermogenesis. Front. Endocrinol. 2021, 12, 595020. [Google Scholar] [CrossRef]
  27. Stine, R.R.; Shapira, S.N.; Lim, H.-W.; Ishibashi, J.; Harms, M.; Won, K.-J.; Seale, P. EBF2 promotes the recruitment of beige adipocytes in white adipose tissue. Mol. Metab. 2016, 5, 57–65. [Google Scholar] [CrossRef]
  28. Angueira, A.R.; Shapira, S.N.; Ishibashi, J.; Sampat, S.; Sostre-Colón, J.; Emmett, M.J.; Titchenell, P.M.; Lazar, M.A.; Lim, H.W.; Seale, P. Early B cell factor activity controls developmental and adaptive thermogenic gene programming in adipocytes. Cell Rep. 2020, 30, 2869–2878.e4. [Google Scholar] [CrossRef]
  29. Dempersmier, J.; Sambeat, A.; Gulyaeva, O.; Paul, S.M.; Hudak, C.S.S.; Raposo, H.F.; Kwan, H.Y.; Kang, C.; Wong, R.H.F.; Sul, H.S. Cold-inducible Zfp516 activates UCP1 transcription to promote browning of white fat and development of brown fat. Mol. Cell 2015, 57, 235–246. [Google Scholar] [CrossRef] [PubMed]
  30. Takahashi, H.; Morimoto, H.; Tanaka, M.; Inoue, H.; Goto, T.; Kawada, T.; Uehara, M.; Takahashi, N. Myricetin and myricitrin indirectly and directly increases uncoupling protein-1 mRNA expression in C3H10T1/2 beige adipocytes. Biochem. Biophys. Res. Commun. 2024, 734, 150771. [Google Scholar] [CrossRef] [PubMed]
  31. Matsumura, T.; Ishikawa, T.; Kitajima, J. Water-soluble constituents of caraway: Aromatic compound, aromatic compound glucoside and glucides. Phytochemistry 2002, 61, 455–459. [Google Scholar] [CrossRef] [PubMed]
  32. Kim, Y.-J.; Choi, H.-J.; Chung, M.-S.; Ko, M.-J. Selective extraction of oxygenated terpene in caraway (Carum carvi L.) using subcritical water extraction (SWE) technique. Food Chem. 2022, 381, 132192. [Google Scholar] [CrossRef]
  33. Nøhr, M.K.; Bobba, N.; Richelsen, B.; Lund, S.; Pedersen, S.B. Inflammation downregulates UCP1 expression in brown adipocytes potentially via SIRT1 and DBC1 interaction. Int. J. Mol. Sci. 2017, 18, 1006. [Google Scholar] [CrossRef]
  34. Alomar, H.A.; Fathallah, N.; Abdel-Aziz, M.M.; Ibrahim, T.A.; Elkady, W.M. GC-MS profiling, anti-Helicobacter pylori, and anti-inflammatory activities of three apiaceous fruits’ essential oils. Plants 2022, 11, 2617. [Google Scholar] [CrossRef] [PubMed]
  35. Takahashi, H.; Morikawa, M.; Ozaki, E.; Numasaki, M.; Morimoto, H.; Tanaka, M.; Inoue, H.; Goto, T.; Kawada, T.; Eguchi, F.; et al. A modified system using macrophage-conditioned medium revealed that the indirect effects of anti-inflammatory food-derived compounds improve inflammation-induced suppression of UCP-1 mRNA expression in 10T1/2 adipocytes. Biosci. Biotechnol. Biochem. 2024, 88, 679–688. [Google Scholar] [CrossRef] [PubMed]
Figure 1. Analysis of mRNA expression in C3H10T1/2 adipocytes treated with C. carvi extracts (CHE or CWE). (A) Diagram showing the experimental timeline. After treatment with either hexane extract (CHE) or water extract (CWE) during the induction and maturation phases, cells received isoproterenol (ISO) treatment for 4 h. (B) Ucp-1 mRNA expression with ISO stimulation: mRNA expression of Ucp-1 in C3H10T1/2 cells treated with CHE or CWE. The control group, which received ISO but not the extract, was set as 100%, and the relative values of other groups are shown. (C) mRNA expression in CWE-treated cells (without ISO stimulation). mRNA expression in C3H10T1/2 cells treated with CWE. Only the group without ISO stimulation was included. The extract-untreated group was used as the control, set at 100%, and the relative values of the extract-treated groups are shown. Each bar represents the mean ± S.D. (n = 3). Different letters indicate statistically significant differences between groups (p < 0.05).
Ijms 26 10970 g001
Figure 2. Ucp-1 mRNA expression analysis in CWE-treated C3H10T1/2 adipocytes. (A) Diagram showing the experimental timeline. After treatment with CWE during the induction or maturation phase, cells were treated with ISO (ISO+) or continued in culture without ISO (ISO−) for 4 h. (B) Ucp-1 mRNA expression in C3H10T1/2 cells treated with CWE. The control group, which received only ISO but no CWE, was set as 100%. Each bar represents the mean ± S.D. (n = 3). Different letters indicate statistically significant differences between groups (p < 0.05).
Ijms 26 10970 g002
Figure 3. mRNA expression analysis in C3H10T1/2 adipocytes treated with CWE in the induction phase. (A) Diagram showing the experimental timeline. CWE was administered only during the induction phase. (B,C) mRNA expression of Cebpb (B) and Pparg (C) in C3H10T1/2 cells treated with CWE. mRNA expression was analyzed at multiple time points in the induction phase: 3, 6, 12, 24, and 44 h (corresponding to the “Time course” section in Figure 3A). The 0 h control was set as 100%, and relative expression levels were calculated accordingly. (D,E) mRNA expression of Ebf2 (D) and Zfp516 (E) in C3H10T1/2 cells treated with CWE in the induction phase (corresponding to the “End of induction phase” section in Figure 3A). The extract-untreated group was used as the control, set at 100%, and the relative values of the extract-treated groups are shown. Each bar represents the mean ± S.D. (n = 3); The significance is indicated by ** (p < 0.01).
Ijms 26 10970 g003
Figure 4. Analysis of anti-inflammatory effects of CHE or CWE on RAW 264.7 macrophages. (AD) NF-κB and AP-1 activities were assessed using RAW/NFκB-luc and RAW/AP1-luc reporter cells. Anti-inflammatory effects of CHE are shown in panels (A,B). Anti-inflammatory effects of CWE are shown in panels (C,D). The LPS- and extract-untreated groups serve as the control, and relative values are expressed as 100% relative to this control. (E,F) mRNA expression of inflammatory cytokines in RAW264.7 cells treated with CHE and CWE. The LPS-stimulated group without CHE/CWE treatment was used as the control, and relative values are expressed as 100%. Each bar represents the mean ± S.D. (n = 3). Different letters indicate statistically significant differences between groups (p < 0.05).
Ijms 26 10970 g004
Figure 5. Ucp-1 mRNA expression analysis when C3H10T1/2 cells were treated with conditioned medium (CM) from RAW264.7 cells. (A) CM prepared from CHE-treated RAW264.7 cells was added to C3H10T1/2 adipocytes. The black bars indicate the groups that received ISO stimulation. The control group, used to set the 100% mRNA expression level, received ISO stimulation after adding CM prepared from RAW264.7 cells not stimulated with LPS. (B) CM prepared from CWE-treated RAW264.7 cells was added to C3H10T1/2 adipocytes. The black bars indicate the groups stimulated with ISO. The control group, used to set the 100% mRNA expression level, received ISO stimulation after adding CM prepared from RAW264.7 cells not stimulated with LPS. Each bar represents the mean ± S.D. (n = 3). Different letters indicate statistically significant differences between groups (p < 0.05).
Ijms 26 10970 g005
Figure 6. Direct and indirect enhancement of Ucp-1 expression by caraway extract leads to anti-obesity effects.
Ijms 26 10970 g006
Disclaimer/Publisher’s Note: The statements, opinions and data contained in all publications are solely those of the individual author(s) and contributor(s) and not of MDPI and/or the editor(s). MDPI and/or the editor(s) disclaim responsibility for any injury to people or property resulting from any ideas, methods, instructions or products referred to in the content.