You are currently viewing a new version of our website. To view the old version click .
International Journal of Molecular Sciences
  • Article
  • Open Access

8 November 2025

Differences in the Gene Regulatory Network for Floral Induction in Two Camellia Species

,
,
,
,
,
and
1
Research Institute of Subtropical Forestry, Chinese Academy of Forestry, Hangzhou 311400, China
2
Zhejiang Key Laboratory of Forest Genetics and Breeding, Hangzhou 311400, China
*
Author to whom correspondence should be addressed.
These authors contributed equally to this work.
This article belongs to the Special Issue Trees Genetics, Genomics, and Molecular Breeding

Abstract

The formation of plant flower buds is regulated by various genes occurring upstream in floral induction pathways. However, the precise regulatory roles and underlying molecular mechanisms of these pathways in Camellia flower bud formation remain unclear. This study investigated the annual periodicity pattern of flower bud formation in two Camellia species exhibiting distinct flowering phenotypes: Camellia azalea, which initiates flower buds continuously throughout the year, and Camellia japonica, which forms buds only between May and July. C. azalea helps address the lack of summer-flowering representatives within the Camellia genus. Elucidating its unique molecular mechanism of flowering regulation provides valuable guidance for breeding new cultivars with summer blooming traits. Comparative transcriptome analysis of mature leaves sampled annually from the two Camellia species revealed the highest number of differentially expressed genes (DEGs) in C. azalea between May and December, whereas in C. japonica, the peak number of DEGs occurred between June and December. Gene ontology analysis indicated that the most enriched category in the transcriptomes of both species was oxidoreductase activity, which was followed by cofactor binding in C. azalea, whereas in C. japonica, it was cellular amino acid metabolic process. Flowering-related genes were identified from the transcriptome database, yielding 248 transcripts in C. azalea and 257 in C. japonica. The transcriptome analysis also revealed that C. azalea lacks certain floral inhibitory pathways that are present in C. japonica, such as the photoperiod pathway genes including GI2, FKF1, and COL14 and the thermosensitive pathway gene SVP. The reliability of the transcriptome results was further validated by quantitative real-time PCR (qRT-PCR) analysis. These results suggest that differences in upstream regulatory mechanisms within the floral induction pathways of C. azalea and C. japonica may underlie the species-specific patterns in the annual distribution of flower bud formation.

1. Introduction

Plant flowering is a complex process regulated by both endogenous and exogenous signals. Plants perceive a range of environmental cues to initiate floral induction and promote flower bud formation. Research has shown that the pathways of floral induction in plants include the photoperiodic, vernalization, gibberellin (GA), thermosensitive, age, and autonomous pathways [,,]. These pathways involve a series of interconnected signaling pathways that respond to internal and external signals—such as light, temperature, and hormones—to regulate the expression of flowering-related genes, ultimately directing the shoot apical meristem to transition into a floral meristem and initiate flower bud development [,,]. Different plant species exhibit distinct annual patterns of flower bud formation, which is a major contributor to the variation in flowering phenotypes among plants.
In the photoperiod pathway, GIGANTEA (GI) is an enhancer of CONSTANS (CO), which can bind with FLAVINBINDING KELCH REPEAT F-BOX1 (FKF1) to activate CO expression through the CYCLING DOF FACTOR1 (CDF1) protein [,]. A ZmLUX2-ZmFKF1a–ZmGI1-ZMM4 regulatory module is found that fine-tunes photoperiodic flowering of day-neutral temperate maize lines []. BRASSINAZOLE RESISTANT 1 (BZR1), a key transcription factor in the phytohormone brassinosteroid (BR) signaling pathway, directly binds to the proximal promoter region of CO to suppress its transcription during long days, thus regulating photoperiodic flowering []. GI can function both as a promoter and a repressor of flowering, depending on the species and environmental context. In rice, overexpression of the GI homologous gene OsGI was reported to delay flowering []. In Arabidopsis, CO and 16 other CONSTANS-LIKE (COL) genes constitute the CO gene family [,]. Different members of this family exhibit divergent responses to the photoperiod: COL1 and COL2 are insensitive to photoperiodic changes [], whereas COL9 acts as a flowering repressor in Arabidopsis and COL10 functions similarly in rice [,]. In Chrysanthemum, overexpression of a COL16 homologous gene promoted early flowering in Arabidopsis []. In the vernalization pathway, the expression of the floral inhibitor gene FLOWERING LOCUS C (FLC) was inhibited after vernalization in Arabidopsis, leading to an increase in FLOWERING LOCUS T (FT) gene expression, thereby promoting flowering [,]. GIBBERELLIN 3-OXIDASE (GA3OX), GIBBERELLIN 20-OXIDASE (GA20OX), and GIBBERELLIN 2-OXIDASE (GA2OX) are the main regulatory genes in the GA pathway. GA3OX and GA20OX can catalyze the biosynthesis of active GA, whereas GA2OX can inactivate them, thereby modulating the levels of active GA in the plant and ultimately influencing growth and development [,]. In the autonomous pathway, genes such as FLOWERING TIME CONTROL LOCUS A (FCA) and FVE can promote flowering by inhibiting expression of FLC [,]. In the age pathway, miR156 acts as an inhibitory factor for flowering, whereas miR172 is a promoter of flowering. During Arabidopsis development, the expression of miR156 gradually declines, while that of miR172 increases, and together they facilitate the transition to flowering [,]. In the thermosensitive pathway, a moderate rise in temperature induces the expression of both FCA and PIF4. PIF4 directly binds to the FT promoter to activate transcription, while FCA further enhances FT expression, collectively promoting flowering [,]. Additionally, SHORT VEGETATIVE PHASE (SVP) encodes an important transcription factor in the thermosensitive pathway. Studies in kiwifruit and apple have shown that SVP represses flower bud formation by suppressing FT expression [,]. There are five SVP genes in Mangifera indica, among which MiSVP1 and MiSVP2 play key roles in the temperature-regulated flowering pathway [], and MiSVP3 and MiSVP4 can inhibit mango flowering and participate in the regulation of mango flower formation gene network [].
In summary, flower bud formation in plants is regulated by multiple genes acting upstream in floral induction pathways, and species-specific differences in the architecture of these upstream regulatory networks likely underlie the variation in the annual timing and distribution of flower bud formation across plant species.
Most Camellia species flower during winter and spring. For instance, Camellia japonica, the model species of the genus, typically blooms from January to March. However, Camellia azalea is a rare species capable of flowering year-round, making it a valuable parent for breeding camellias with continuous blooming traits. To further understand the mechanisms underlying flower bud formation and flowering regulation in Camellia, we compared the annual periodicity of flower bud development and leaf transcriptomes between C. japonica and C. azalea. Understanding the molecular regulatory mechanisms underlying the distinct flowering patterns of these two species is of great significance for identifying key genes associated with continuous flowering, facilitating the development of novel Camellia cultivars with prolonged blooming periods, and ultimately extending the ornamental viewing window of camellias.

2. Results

2.1. Annual Distribution of Flower Bud Formation Rates in C. azalea and C. japonica

Given the pronounced difference in flowering phenology between C. azalea and C. japonica, we conducted monthly surveys and statistical analyses of floral bud abundance in both species (Table 1). The survey revealed that in Hangzhou, where the average annual temperature is approximately 6 °C lower than that in the native habitat of C. azalea (Ehuangzhang, Yangchun, Guangdong Province, China)—the flower buds formed continuously throughout the year. Flower buds measuring less than 2 mm in length were classified as newly formed. Among the three surveyed C. azalea plants, the annual number of flower buds formed ranged from 250 to 265, with a consistent monthly distribution pattern. Flower bud formation peaked in April, with high levels also observed in March and May. The flower bud formation quantity declined in June, showed a slight increase in July, and then gradually decreased over the subsequent months, reaching only 1–2 buds, or none at all, in January and February. A parallel survey of three C. japonica plants revealed that its peak flower bud formation occurred in June, approximately two months later than in C. azalea, with relatively few buds formed in May and July. Annual total bud production in C. japonica varied among individuals, ranging from 66 to 178 buds, and this inter-individual variation was also reflected in monthly bud counts.
Table 1. Monthly flower bud germination of C. azalea and C. japonica.
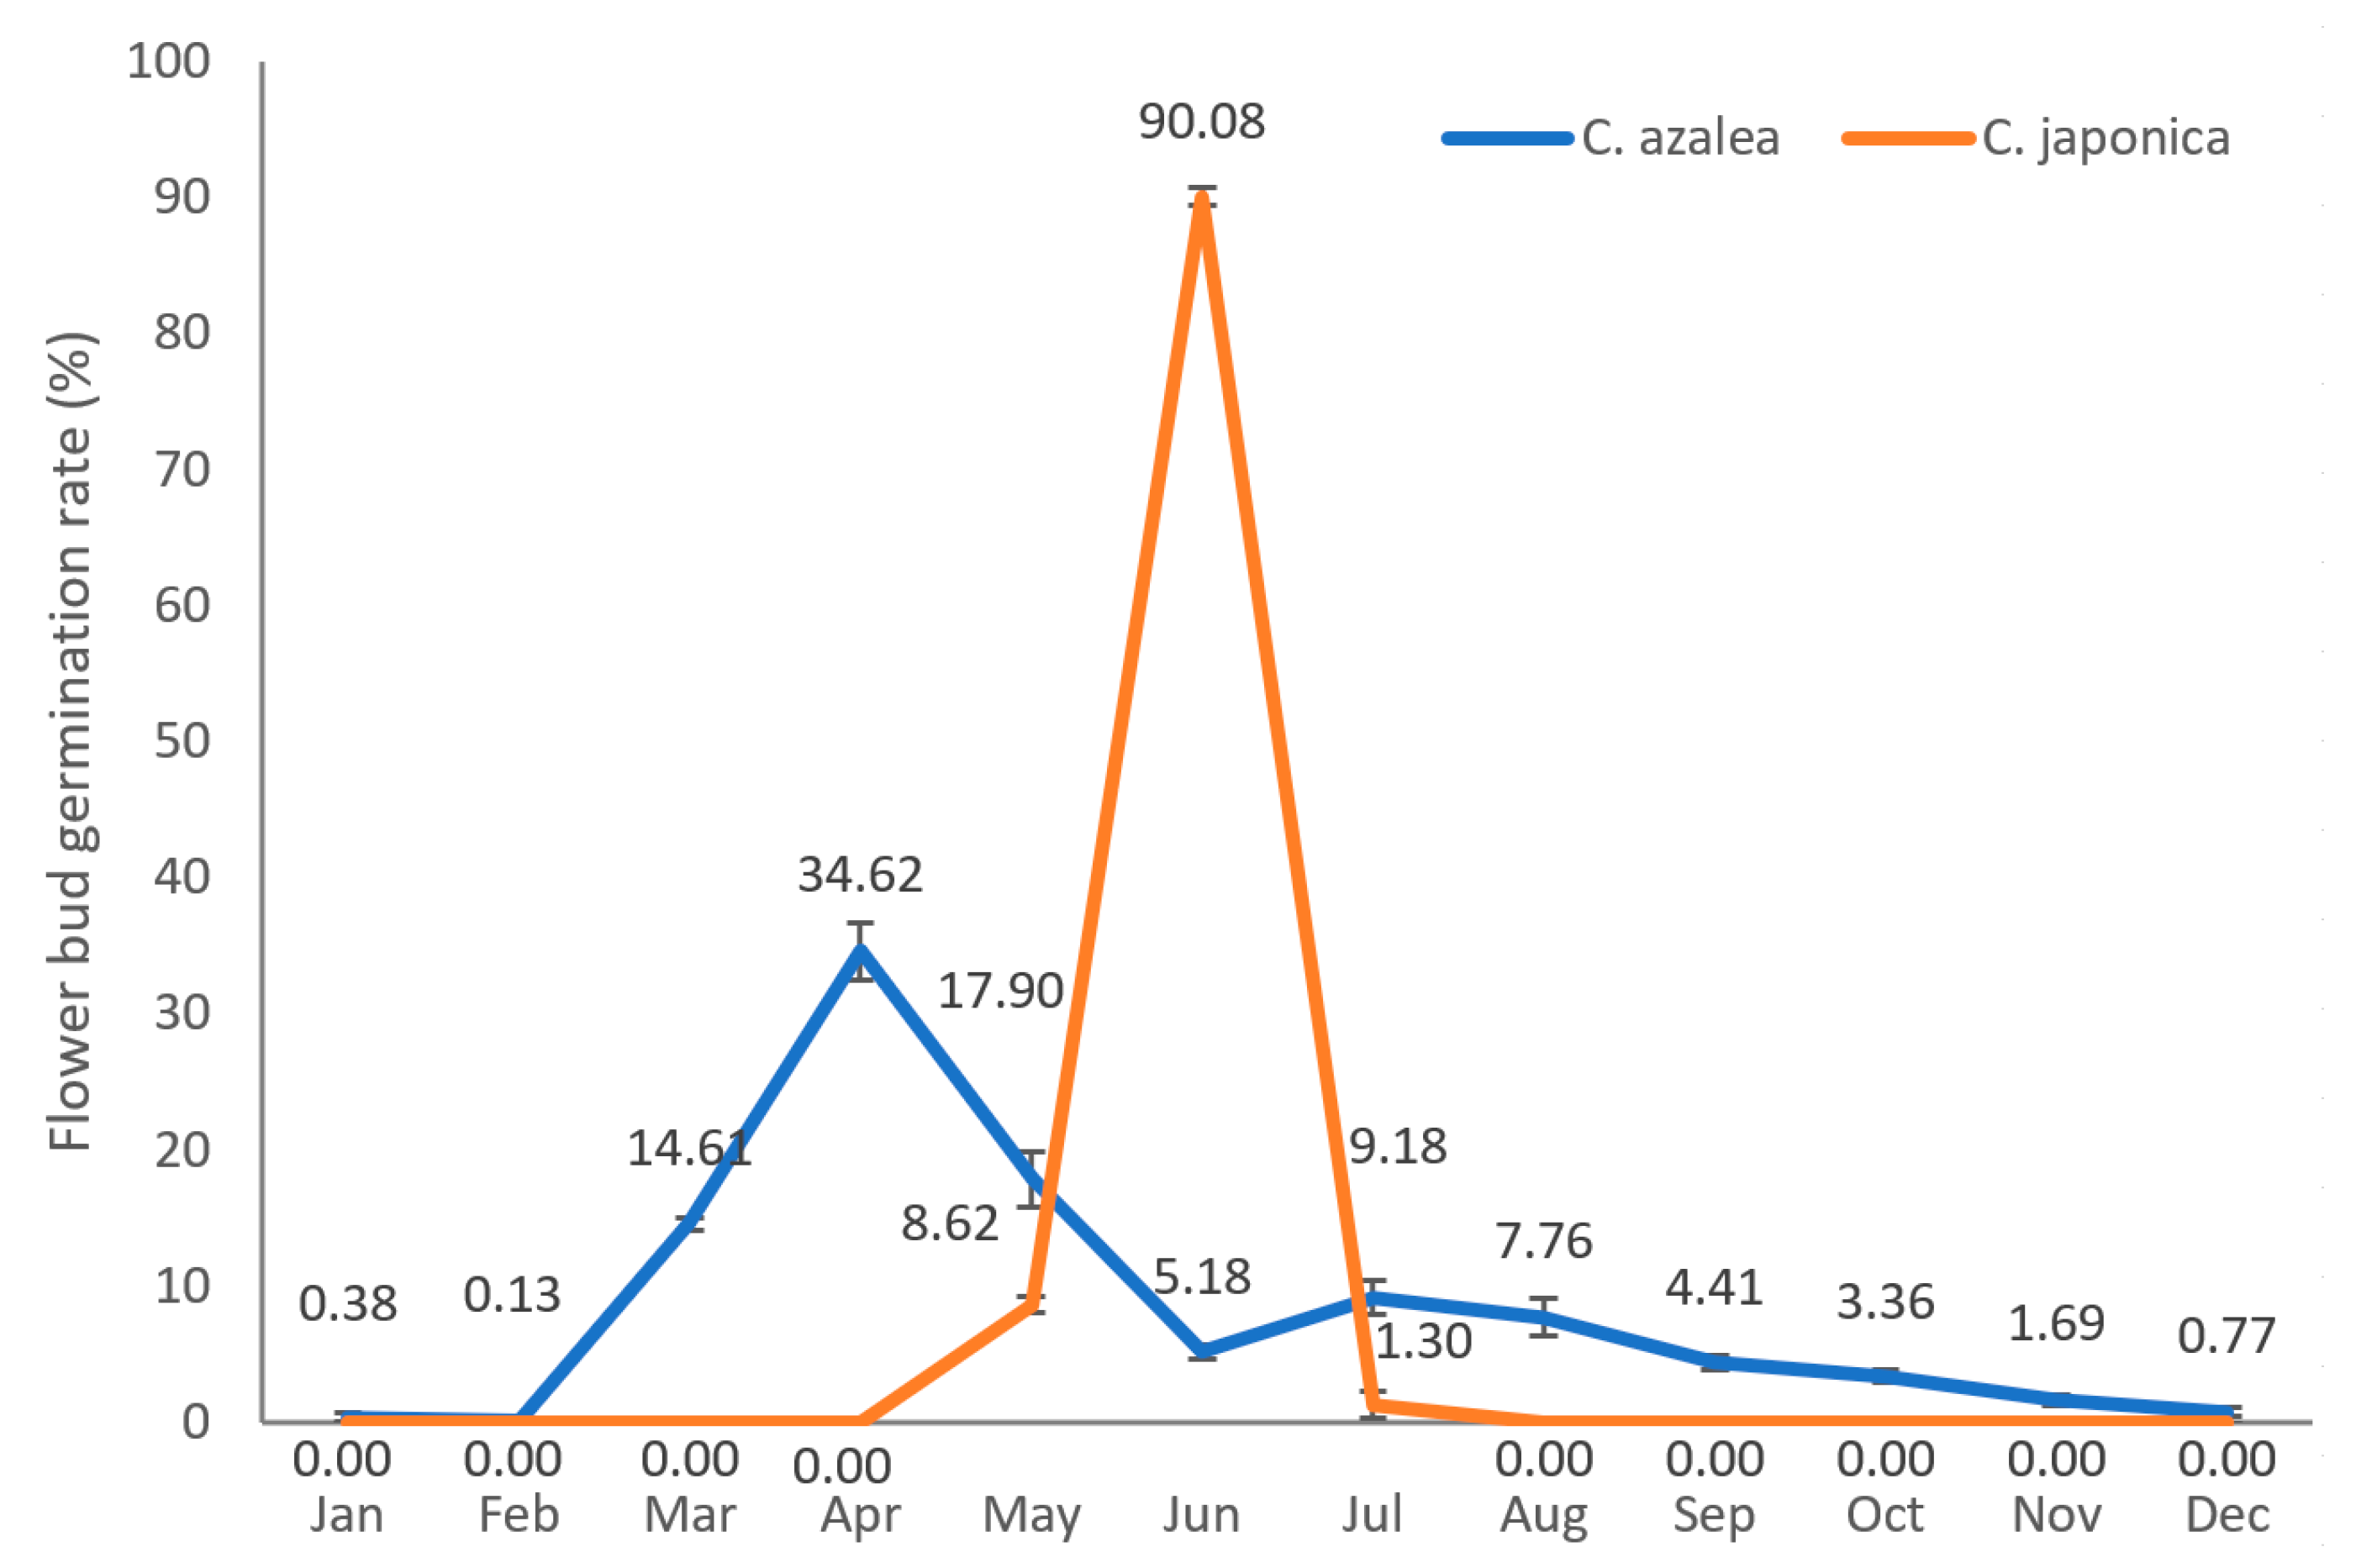
To minimize inter-individual variation and better compare the monthly dynamics of new flower bud formation between C. azalea and C. japonica, we generated a line graph showing the percentage of buds formed each month relative to the annual total (Figure 1). In C. azalea, flower bud formation occurred year-round, peaking in April (34.62%) with a secondary peak in July (9.18%). Bud production was nearly absent in January and February (<1%), consistent with its perpetual flowering habit. Notably, the flower buds formed in large numbers in April subsequently develop and bloom during the peak flowering period in July. C. japonica formed flower buds exclusively from May to July, with the vast majority (90.08%) initiated in June. These buds subsequently developed and bloomed from January to March of the following year, with peak flowering occurring in February.
Figure 1. Annual germination distribution of C. azalea and C. japonica flower buds.

2.2. Transcriptome Analysis of C. azalea and C. japonica Leaves Throughout the Year

We compared and analyzed the leaf transcriptional profiles of C. azalea and C. japonica. For C. azalea, transcriptome sequencing was performed and generated a total of 248.91 Gb of clean data, with Q30 values exceeding 93.7% for all samples (Supplementary Table S1). For C. japonica, two sequencing strategies were employed: (1) a pooled sample comprising equal amounts of RNA from 36 monthly leaf samples (three replicates per month, 12 months), which yielded 11.81 Gb of data with a Q30 of 95.2%; and (2) individual sequencing of the same 36 monthly leaf samples, which generated 58.06 Gb of clean data, with Q30 values above 95.94% per sample (Supplementary Table S2). The results of the correlation analyses and principal component analyses showed good repeatability between the three samples in the same group (Supplementary Figure S1).
By comparison with various functional databases, the unigenes of the two species were annotated separately. C. azalea had 35,111 unique genes annotated, with the number of annotated unigenes ranging from 16,121 to 34,247 across the databases. C. japonica had 85,782 unique genes annotated, with the number of annotated unigenes ranging from 26,512 to 85,228 across databases.
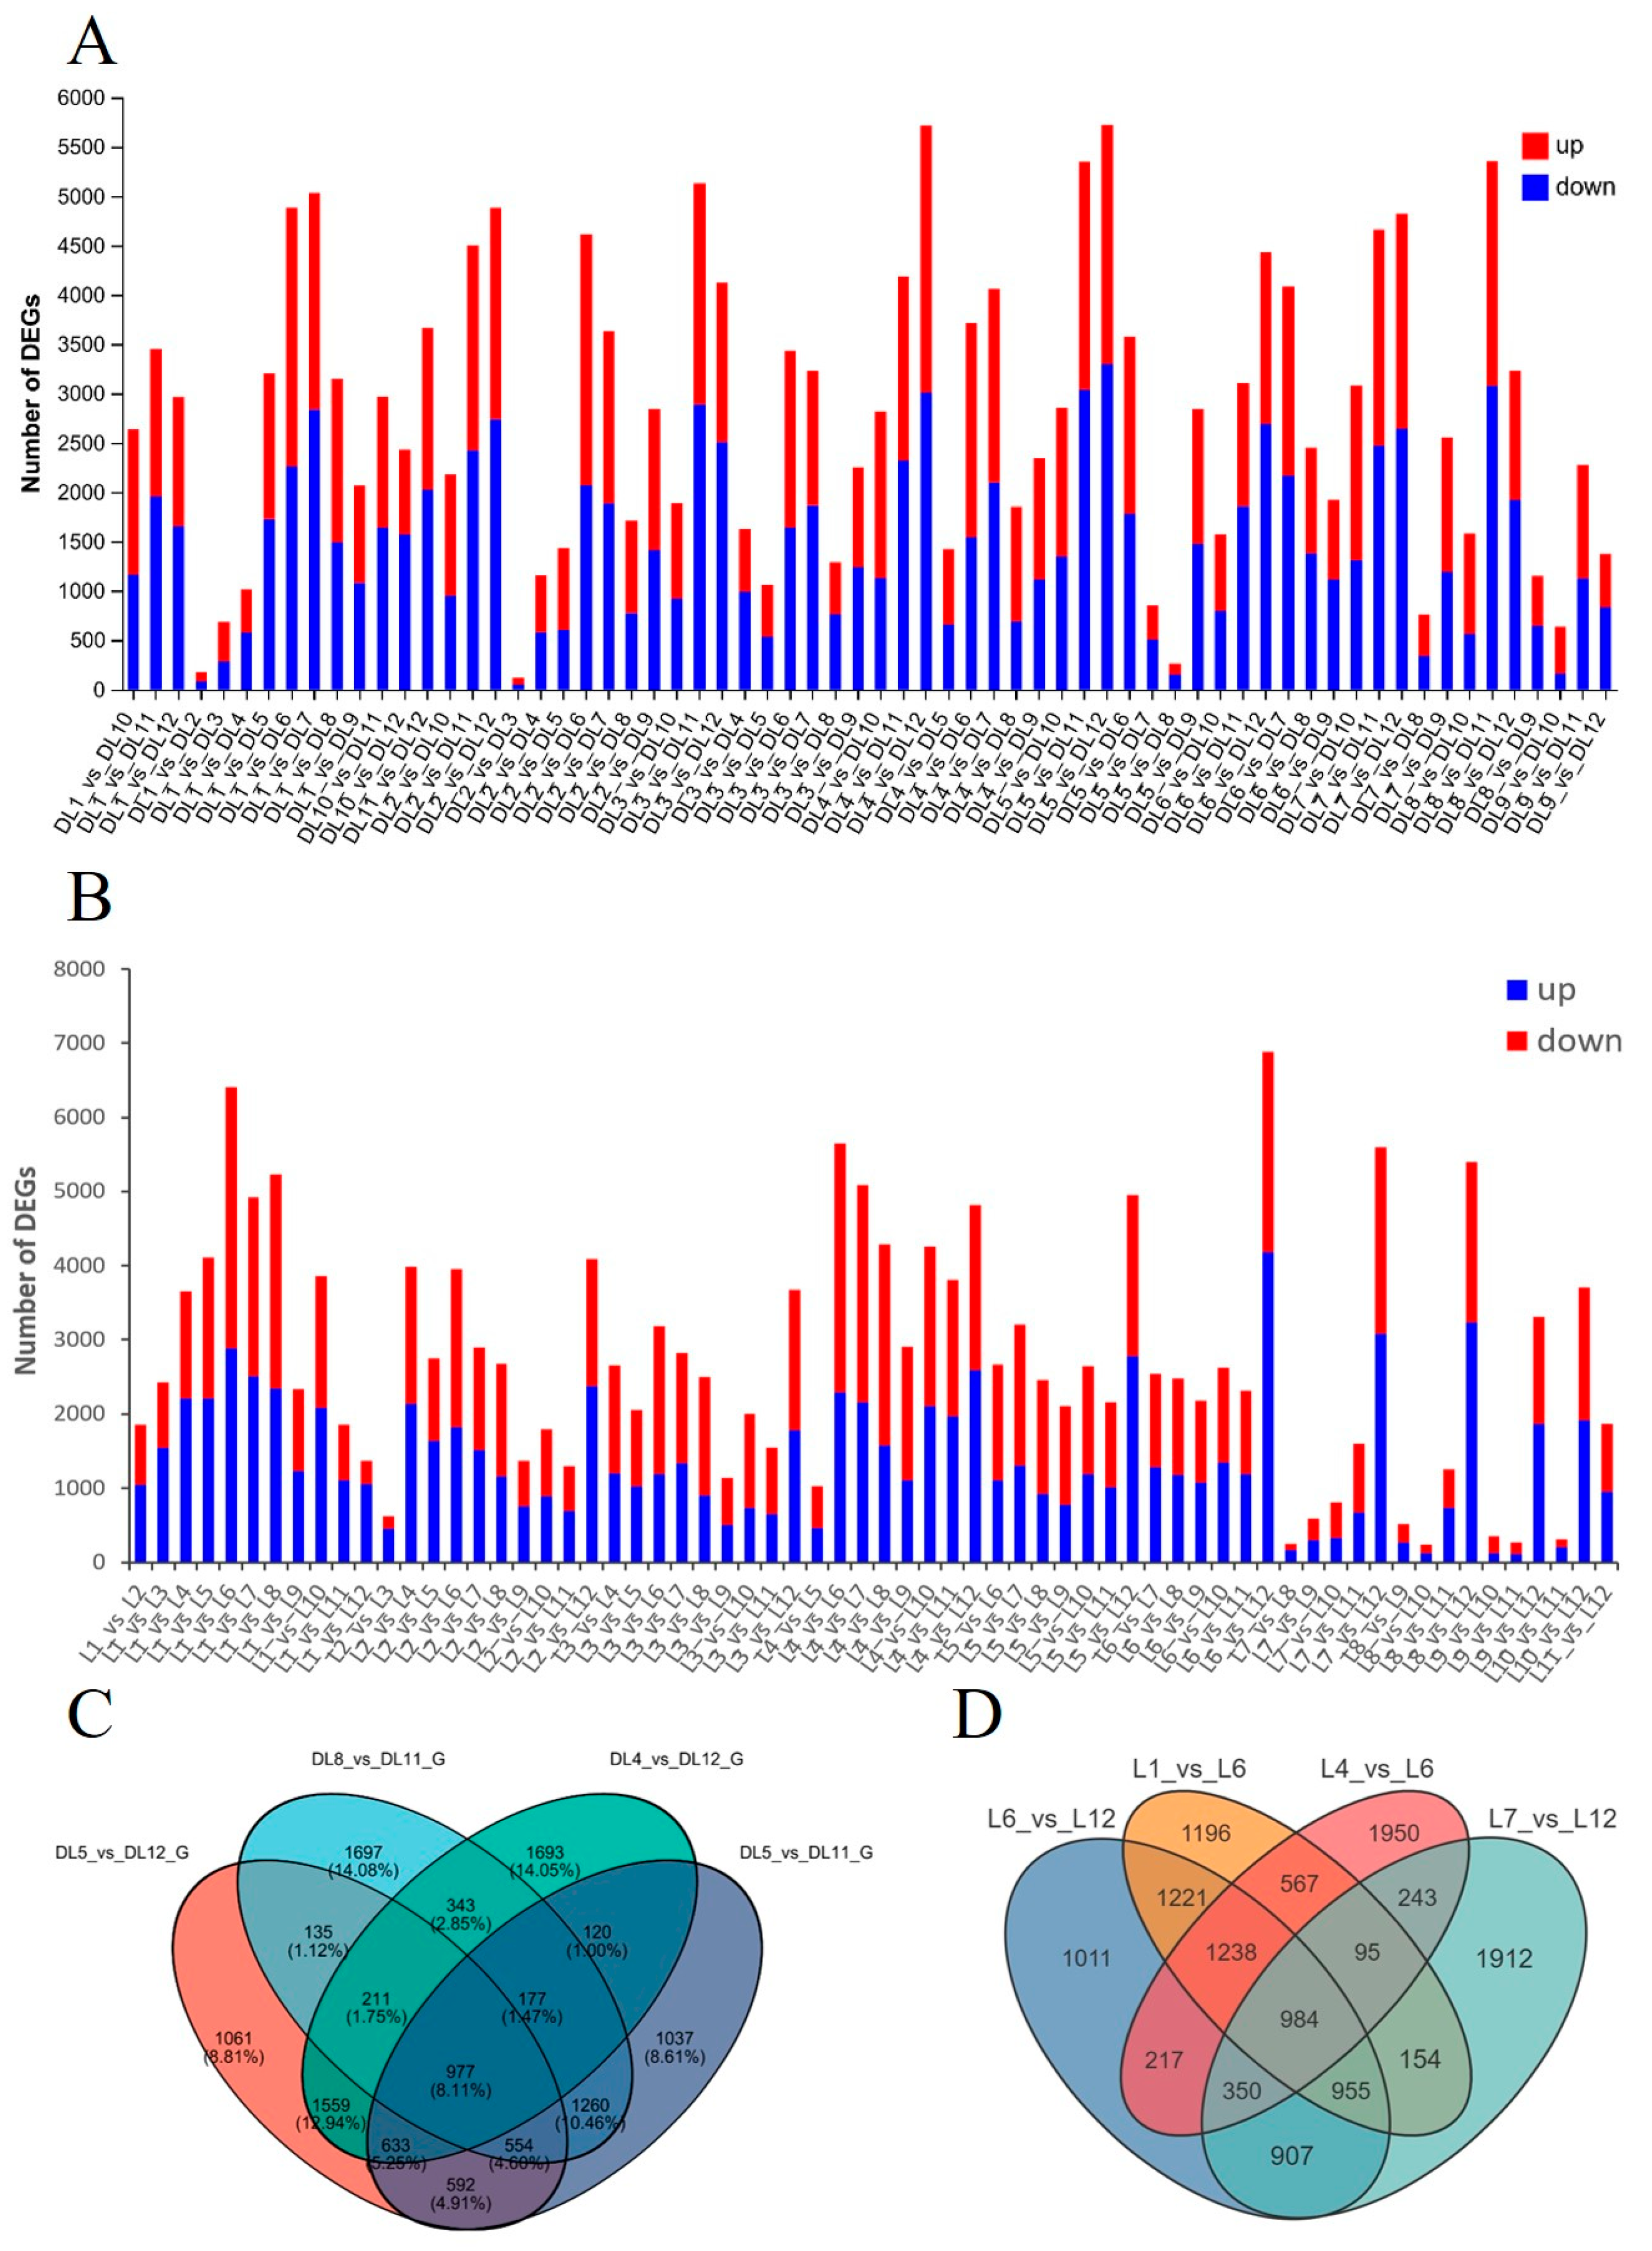
Differentially expressed genes (DEGs) were identified using DESeq2 based on raw read counts, with significance thresholds of an adjusted p-value < 0.05 and |log2(fold change)| ≥ 1. Normalized expression levels were estimated as transcripts per kilobase per million mapped reads (TPM) for C. azalea and fragments per kilobase per million mapped fragments (FPKM) for C. japonica for downstream visualization and comparison. In C. azalea, the transcriptome comparisons yielding the highest numbers of DEGs were DL5_vs_DL12, DL4_vs_DL12, DL8_vs_DL11, and DL5_vs_DL11, whereas the fewest DEGs were observed in DL2_vs_DL3, DL1_vs_DL2, and DL5_vs_DL8 (Figure 2A). This pattern corresponds to the periods of high flower bud formation in C. azalea during April, May, and August, and very low bud formation from November through February. A Venn diagram was constructed for the four pairwise comparisons with the highest numbers of differentially expressed genes (DEGs)—DL5_vs_DL12, DL4_vs_DL12, DL8_vs_DL11, and DL5_vs_DL11—showing 5722, 5713, 5354, and 5350 DEGs, respectively, with 977 DEGs shared across all four comparisons (Figure 2C). In C. japonica, The four groups with the highest numbers of DEGs transcriptome were L6_vs_L12, L1_vs_L6, L4_vs_L6, and L7_vs_L12, and the three groups with the lowest number of DEGs were L8_vs_L10, L7_vs_L8, and L9_vs_L11 (Figure 2B). This pattern corresponds to the peak in flower bud formation observed in June for C. japonica, as well as the absence of bud formation from August to April of the following year. A Venn diagram was constructed for the four pairwise comparisons with the highest numbers of DEGs—L6_vs_L12, L1_vs_L6, L4_vs_L6, and L7_vs_L12—revealing 6883, 6410, 5644, and 5600 DEGs, respectively, with 984 DEGs shared across all four comparisons (Figure 2D).
Figure 2. Statistical analysis of DEGs identified in Camellia leaves from transcriptome data between different months. (A) Number of DEGs between different months in C. azalea leaves. (B) Number of DEGs between different months in C. japonica leaves. (C) Venn diagram of DEGs in C. azalea. (D) Venn diagram of DEGs in C. japonica.
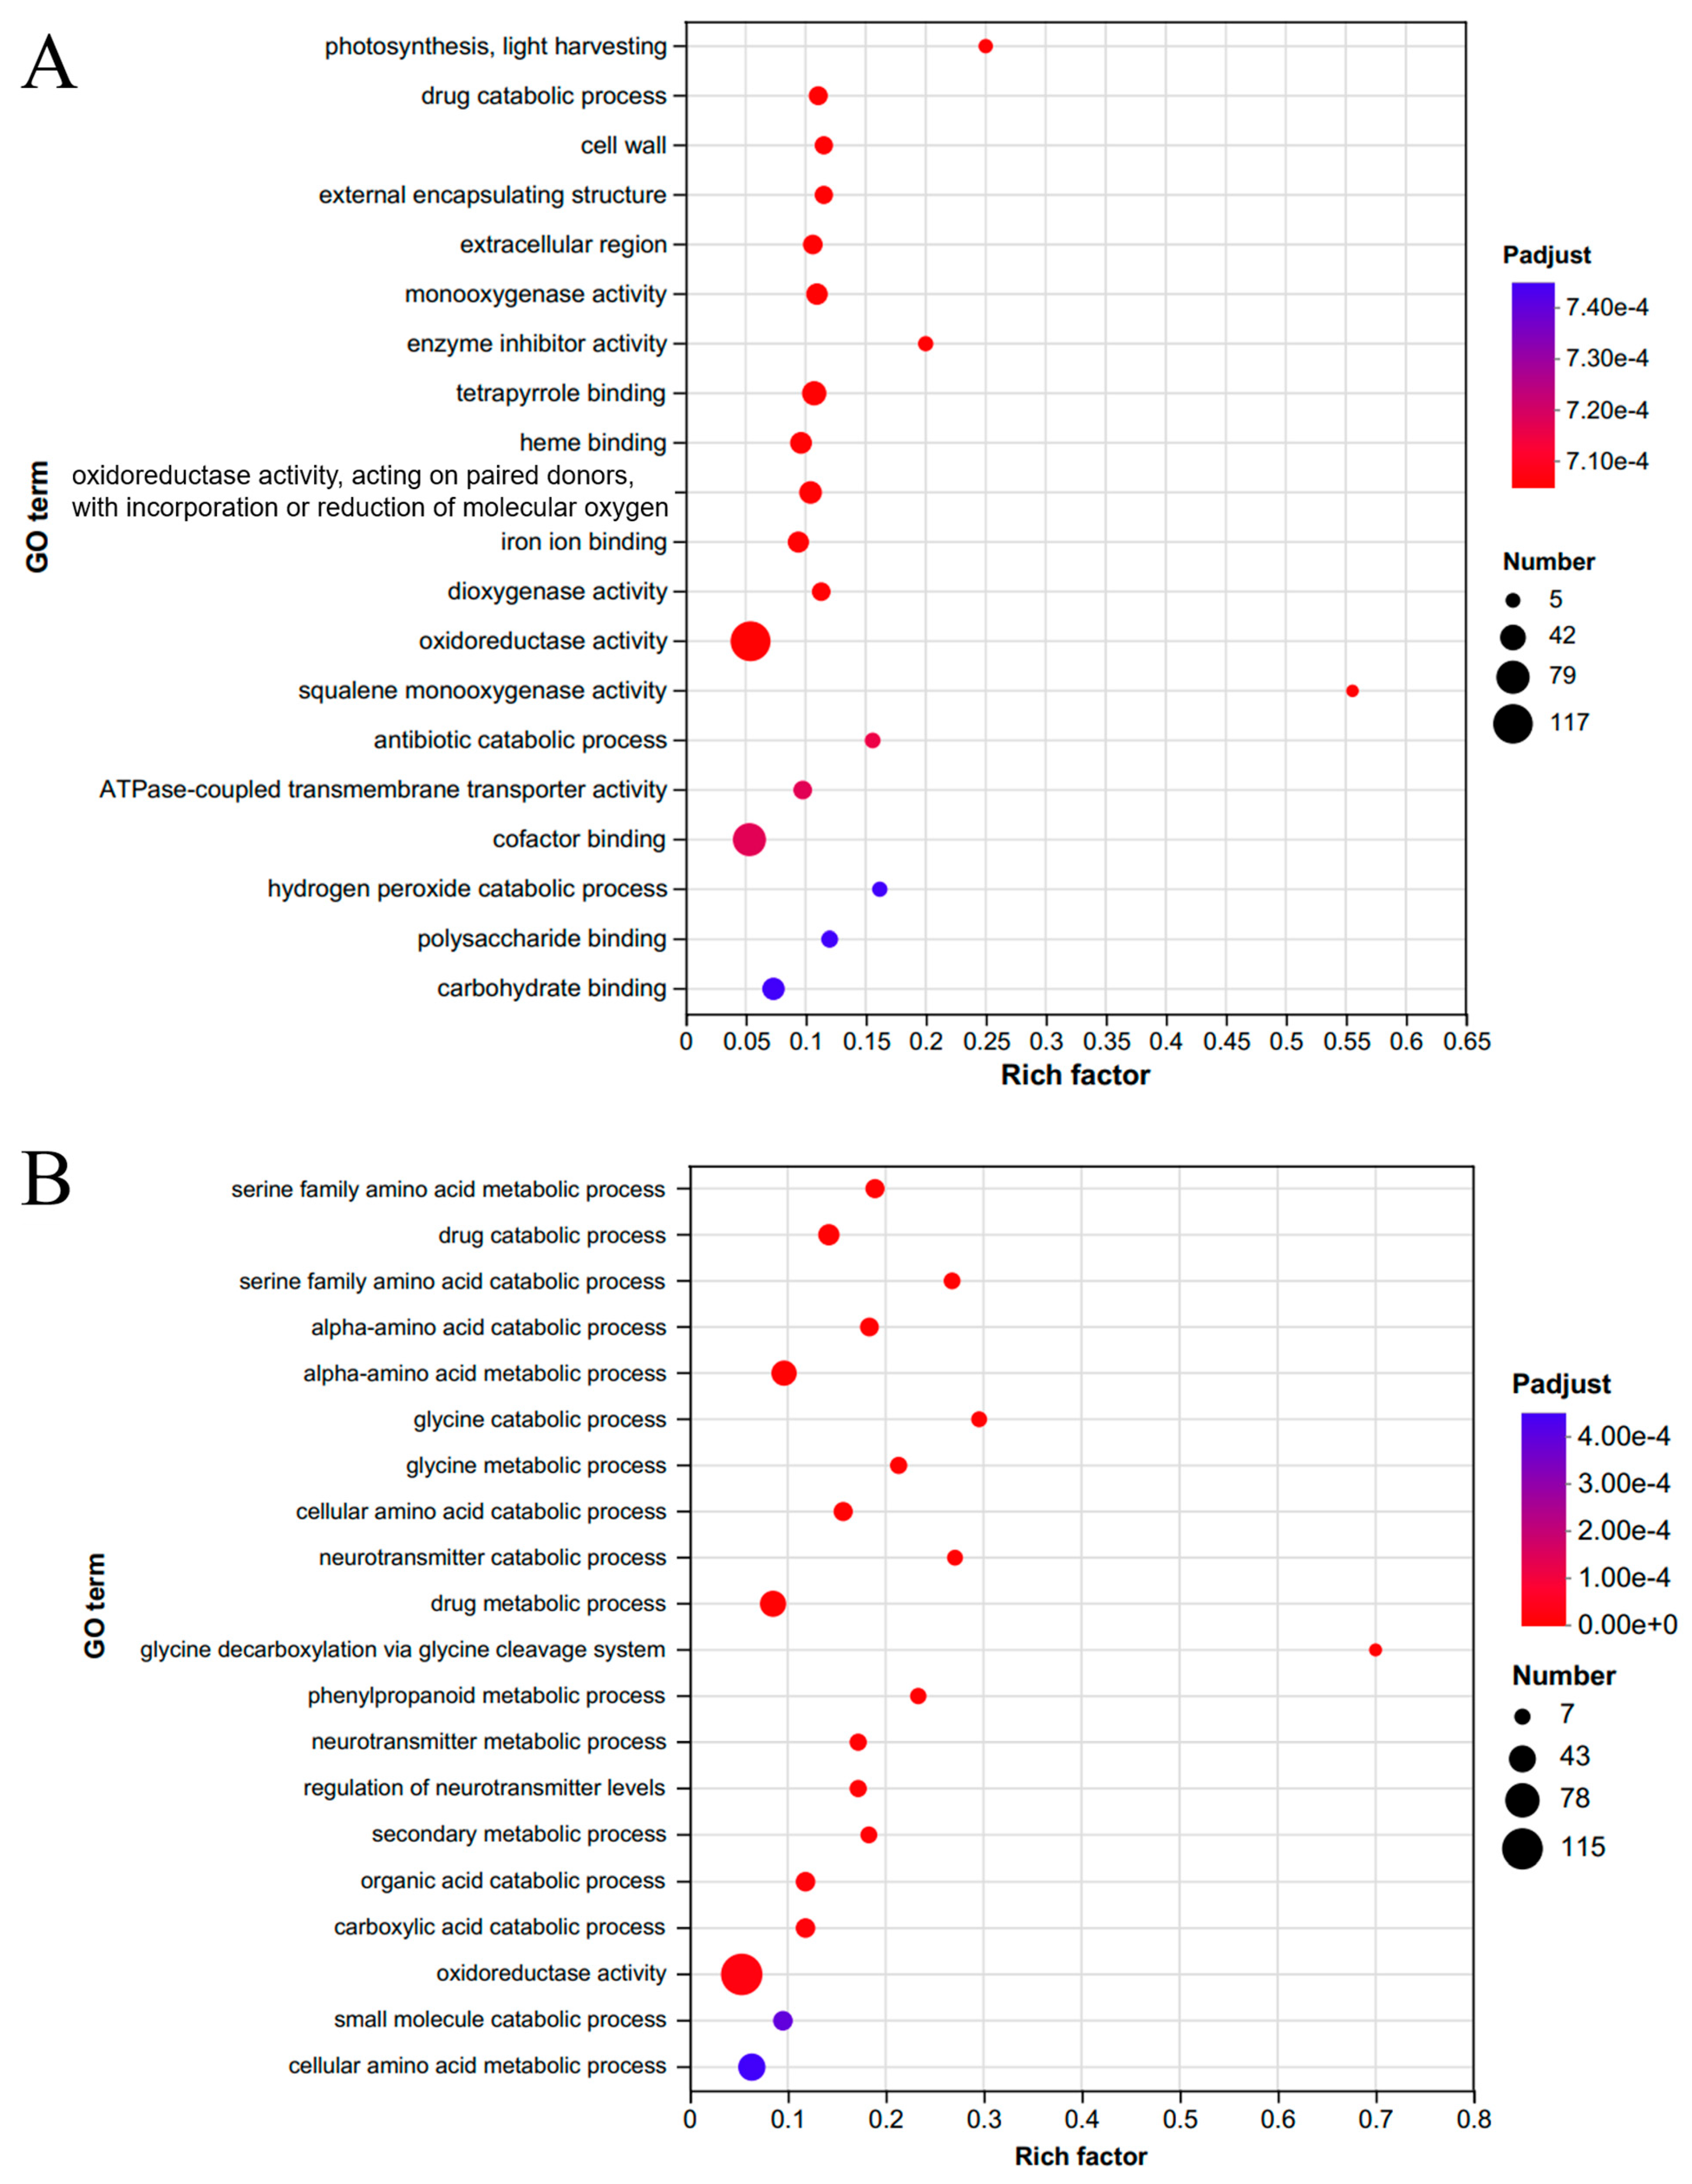
Gene ontology (GO) analysis of the 977 common DEGs in C. azalea and the 984 common DEGs in C. japonica showed that the most validly enriched category in the C. azalea transcriptome was oxidoreductase activity, followed by cofactor binding (Figure 3A). Similarly, the most validly enriched category in the C. japonica transcriptome was oxidoreductase activity, followed by cellular amino acid metabolic process (Figure 3B).
Figure 3. Gene ontology (GO) enrichment functional analysis for (A) C. azalea and (B) C. japonica.
Further functional analysis of these DEGs revealed a limited number of flowering-related regulators: only ELF4 and AP2 were identified in C. japonica, while COL2 and COL16 were detected in C. azalea. Therefore, we searched all known flowering-related genes to enable a targeted analysis of their differential expression levels.

2.3. Analysis of Flowering-Related Genes in Different Pathways Based on Transcriptome Data

Based on the transcriptome analysis of C. azalea and C. japonica, flowering-related genes were identified from the assembled transcriptomes by screening for components of six canonical floral regulatory pathways: photoperiod, thermosensitivity, GA, vernalization, autonomous, and age. These included both floral repressors (e.g., SVP, FLC-like genes) and integrators (e.g., FT, SOC1). A total of 248 and 257 flowering-related gene transcripts were obtained for C. azalea and C. japonica, respectively. Some genes have multiple transcripts, and the number of genes varies between the two species. Detailed information on the number of flowering-related genes in the transcriptomes of the two species can be found in Supplementary Table S3.
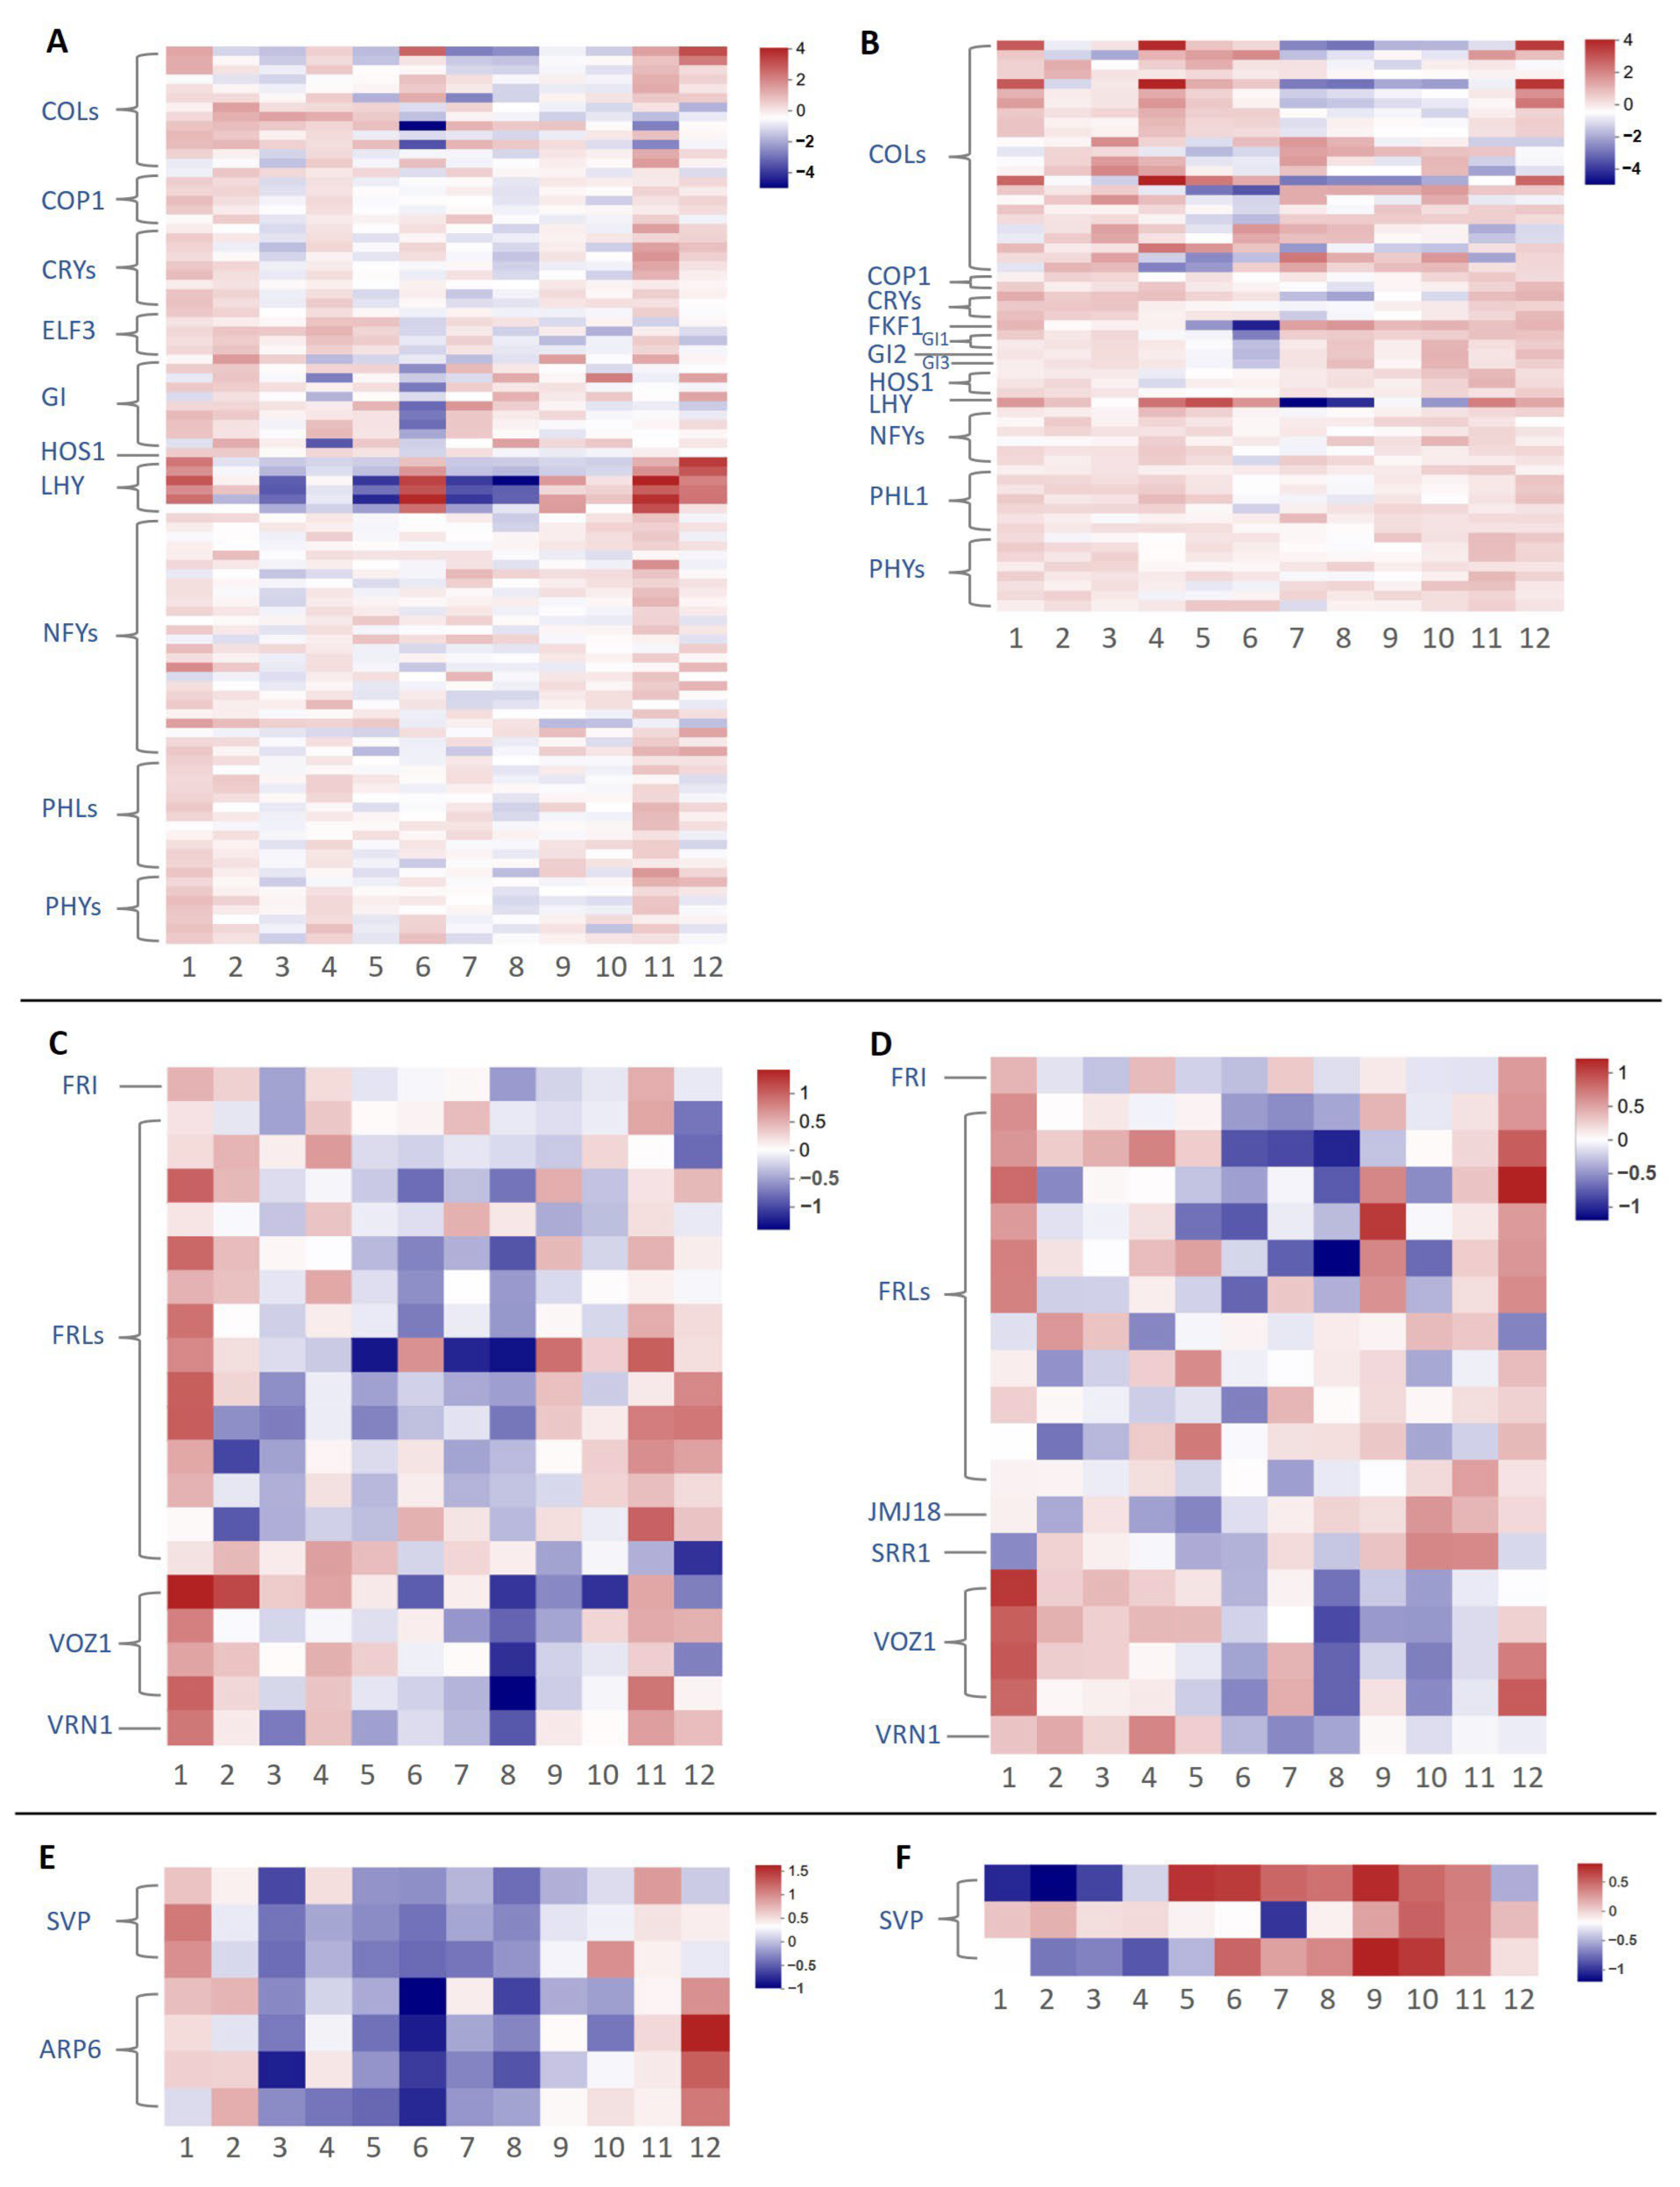
For each pathway, we excluded genes with 12-month average TPM (For C. azalea) or FPKM (C. japonica) values below 5. After filtering, 98 and 59 genes remained in the photoperiod pathway for C. azalea and C. japonica, respectively. Among these, LHY, GI, and COLs exhibited the most pronounced expression changes across the 12 months in both species (Figure 4A,B). Several transcripts exhibited dramatic upregulation or downregulation in June. Although the number of DEGs varied between species, most displayed clear seasonal expression patterns. Additionally, GI2 and FKF1 were detected only in C. japonica, where they showed low expression during May–June, the period of active floral bud formation, and high expression during the rest of the year.
Figure 4. Heatmap of flowering-related genes through the photoperiodic, vernalization, and thermosensitive pathways in C. azalea and C. japonica. (A) Heatmap through the photoperiodic pathway of C. azalea. (B) Heatmap through the photoperiodic pathway of C. japonica. (C) Heatmap through the vernalization pathway of C. azalea. (D) Heatmap through the vernalization pathway of C. japonica. (E) Heatmap through the thermosensitive pathway of C. azalea. (F) Heatmap through the thermosensitive pathway of C. japonica. The numbers from negative to positive represent the changes in the log2-transformed relative TPM or FPKM value from low to high.
In the vernalization pathway, 20 and 19 genes were retained for analysis in C. azalea and C. japonica, respectively, following expression filtering. Overall, vernalization-related genes showed lower expression levels compared to those in the photoperiod pathway. In C. azalea, these genes exhibited no clear seasonal expression pattern, with only modestly elevated expression in January and minimal variation across other months (Figure 4C). In C. japonica, VOZ1 and VRN1 were upregulated from January to May and downregulated from June to December (Figure 4D). In C. azalea, most genes exhibited slightly higher expression in January, but no clear patterns were observed for the other months.
In the thermosensitive pathway, seven highly expressed genes were identified in C. azalea, including SVP and ARP6 (Figure 4E), whereas only SVP was detected in C. japonica (Figure 4F). In C. azalea, SVP was highly expressed only in January, corresponding to the observed reduction in flower bud formation during that month. In C. japonica, two SVP genes exhibited high expression from May to November, and the other from June to December. Both exhibited low expression from January to April, the period encompassing floral induction and flowering, consistent with SVP as a flowering repressor. SVP expression in C. azalea was more uniform across the annual cycle compared to the pronounced seasonal fluctuation in C. japonica.
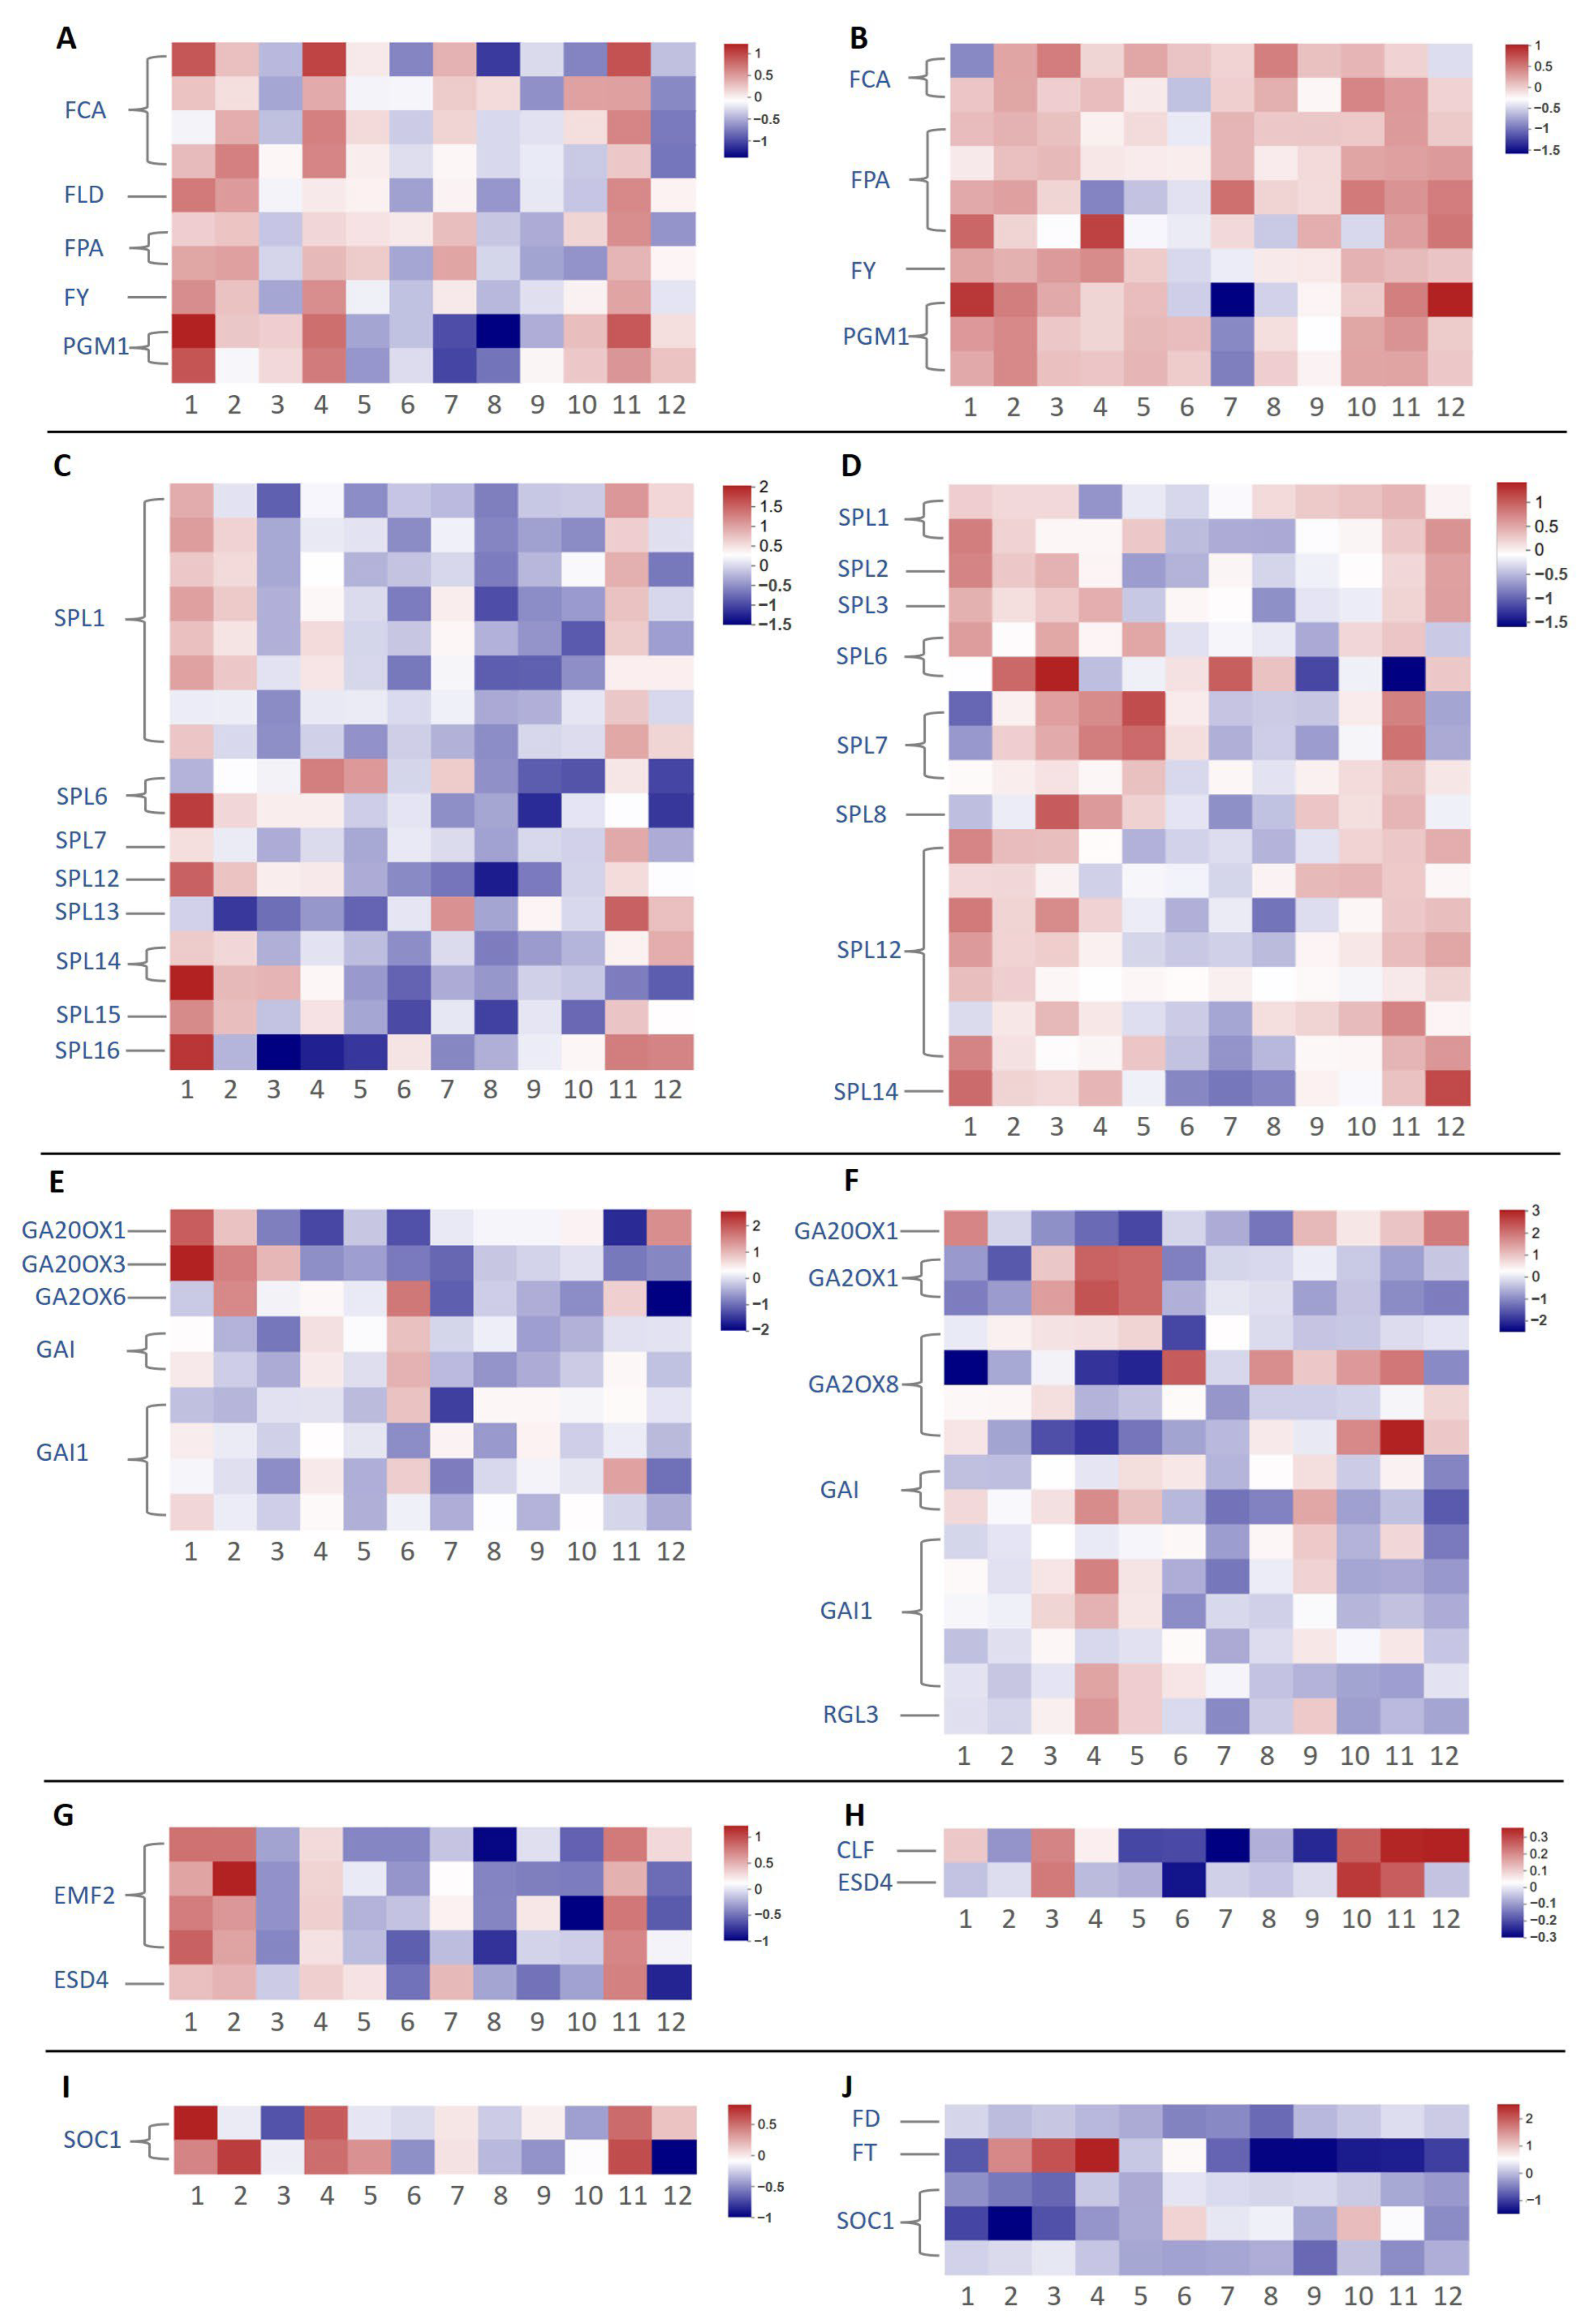
Among the genes in the autonomous pathway, PGM1 exhibited a seasonal expression pattern over the 12 months. In C. azalea, PGM1 was upregulated from October to April of the following year and downregulated from May to September (Figure 5A). In C. japonica, PGM1 expression was only lower in July (Figure 5B).
Figure 5. Heatmap of flowering-related genes through the autonomous, age, and GA pathways, along with flowering suppressors and flowering integrators in C. azalea and C. japonica. (A) Heatmap through the autonomous pathway of C. azalea. (B) Heatmap through the autonomous pathway of C. japonica. (C) Heatmap through the age pathway of C. azalea. (D) Heatmap through the age pathway of C. japonica. (E) Heatmap through the GA pathway of C. azalea. (F) Heatmap through the GA pathway of C. japonica. (G) Heatmap through flowering suppressors of C. azalea. (H) Heatmap through flowering suppressors of C. japonica. (I) Heatmap through flowering integrators of C. azalea. (J) Heatmap through flowering integrators of C. japonica. The numbers from negative to positive represent the changes in the log2-transformed relative TPM or FPKM value from low to high.
All age pathway-related genes identified belonged to the SPL family. In C. azalea, SPLs generally exhibited low expression levels (Figure 5C), whereas in C. japonica, they were consistently expressed at higher levels (Figure 5D). Additionally, the number of SPL1 transcripts was greater in C. azalea than in C. japonica. The overall higher SPL expression in C. japonica likely reflects the older developmental age of the sampled plants, as SPL genes are known to accumulate with plant maturity and promote the juvenile-to-adult transition.
Genes identified in GA pathway mainly fell into two categories: gibberellin oxidase genes (GAsOXs) and DELLA genes (GAI/RGL). An RGL3 gene was also identified in C. japonica, but no RGL genes were found in C. azalea. In C. azalea, GA20OX1, GA20OX3, and GA2OX6 showed variable expression, with GA20OX1 exhibited elevated levels in December, January, and February (Figure 5E). In C. japonica, GA20OX1, GA2OX1, and GA2OX8 exhibited notable variation, with GA20OX1 showing relatively high expression in October, November, December, and January (Figure 5F). Additionally, GA2OX1 and GA2OX8 were exclusively detected only in C. japonica.
In C. azalea, the flowering repressors EMF2 and ESD4 were identified (Figure 5G), whereas C. japonica expressed CLF and ESD4 (Figure 5H). Over the 12-month period, both species exhibited only minor fluctuations in expression: in C. azalea, EMF2 and ESD4 showed slightly elevated levels in January and February, while in C. japonica, CLF and ESD4 peaked modestly from October to December. Overall, the magnitude of seasonal variation in these repressors was negligible in both species.
The flowering integrators identified included FT and SOC1 in C. japonica, whereas only SOC1 was detected in C. azalea (Figure 5I,J). In C. japonica, FT exhibited pronounced seasonal expression, peaking in March, April, and May—the period coinciding with floral bud formation—and remaining nearly undetectable during the rest of the year. SOC1 expression patterns differed between species: in C. azalea, SOC1 showed elevated levels in January, April, and November. In C. japonica, one SOC1 paralog was highly expressed from June to November, while the other two paralogs remained consistently low throughout the year.

2.4. Differential Expression of Key Floral Induction Genes in Two Camellia Species

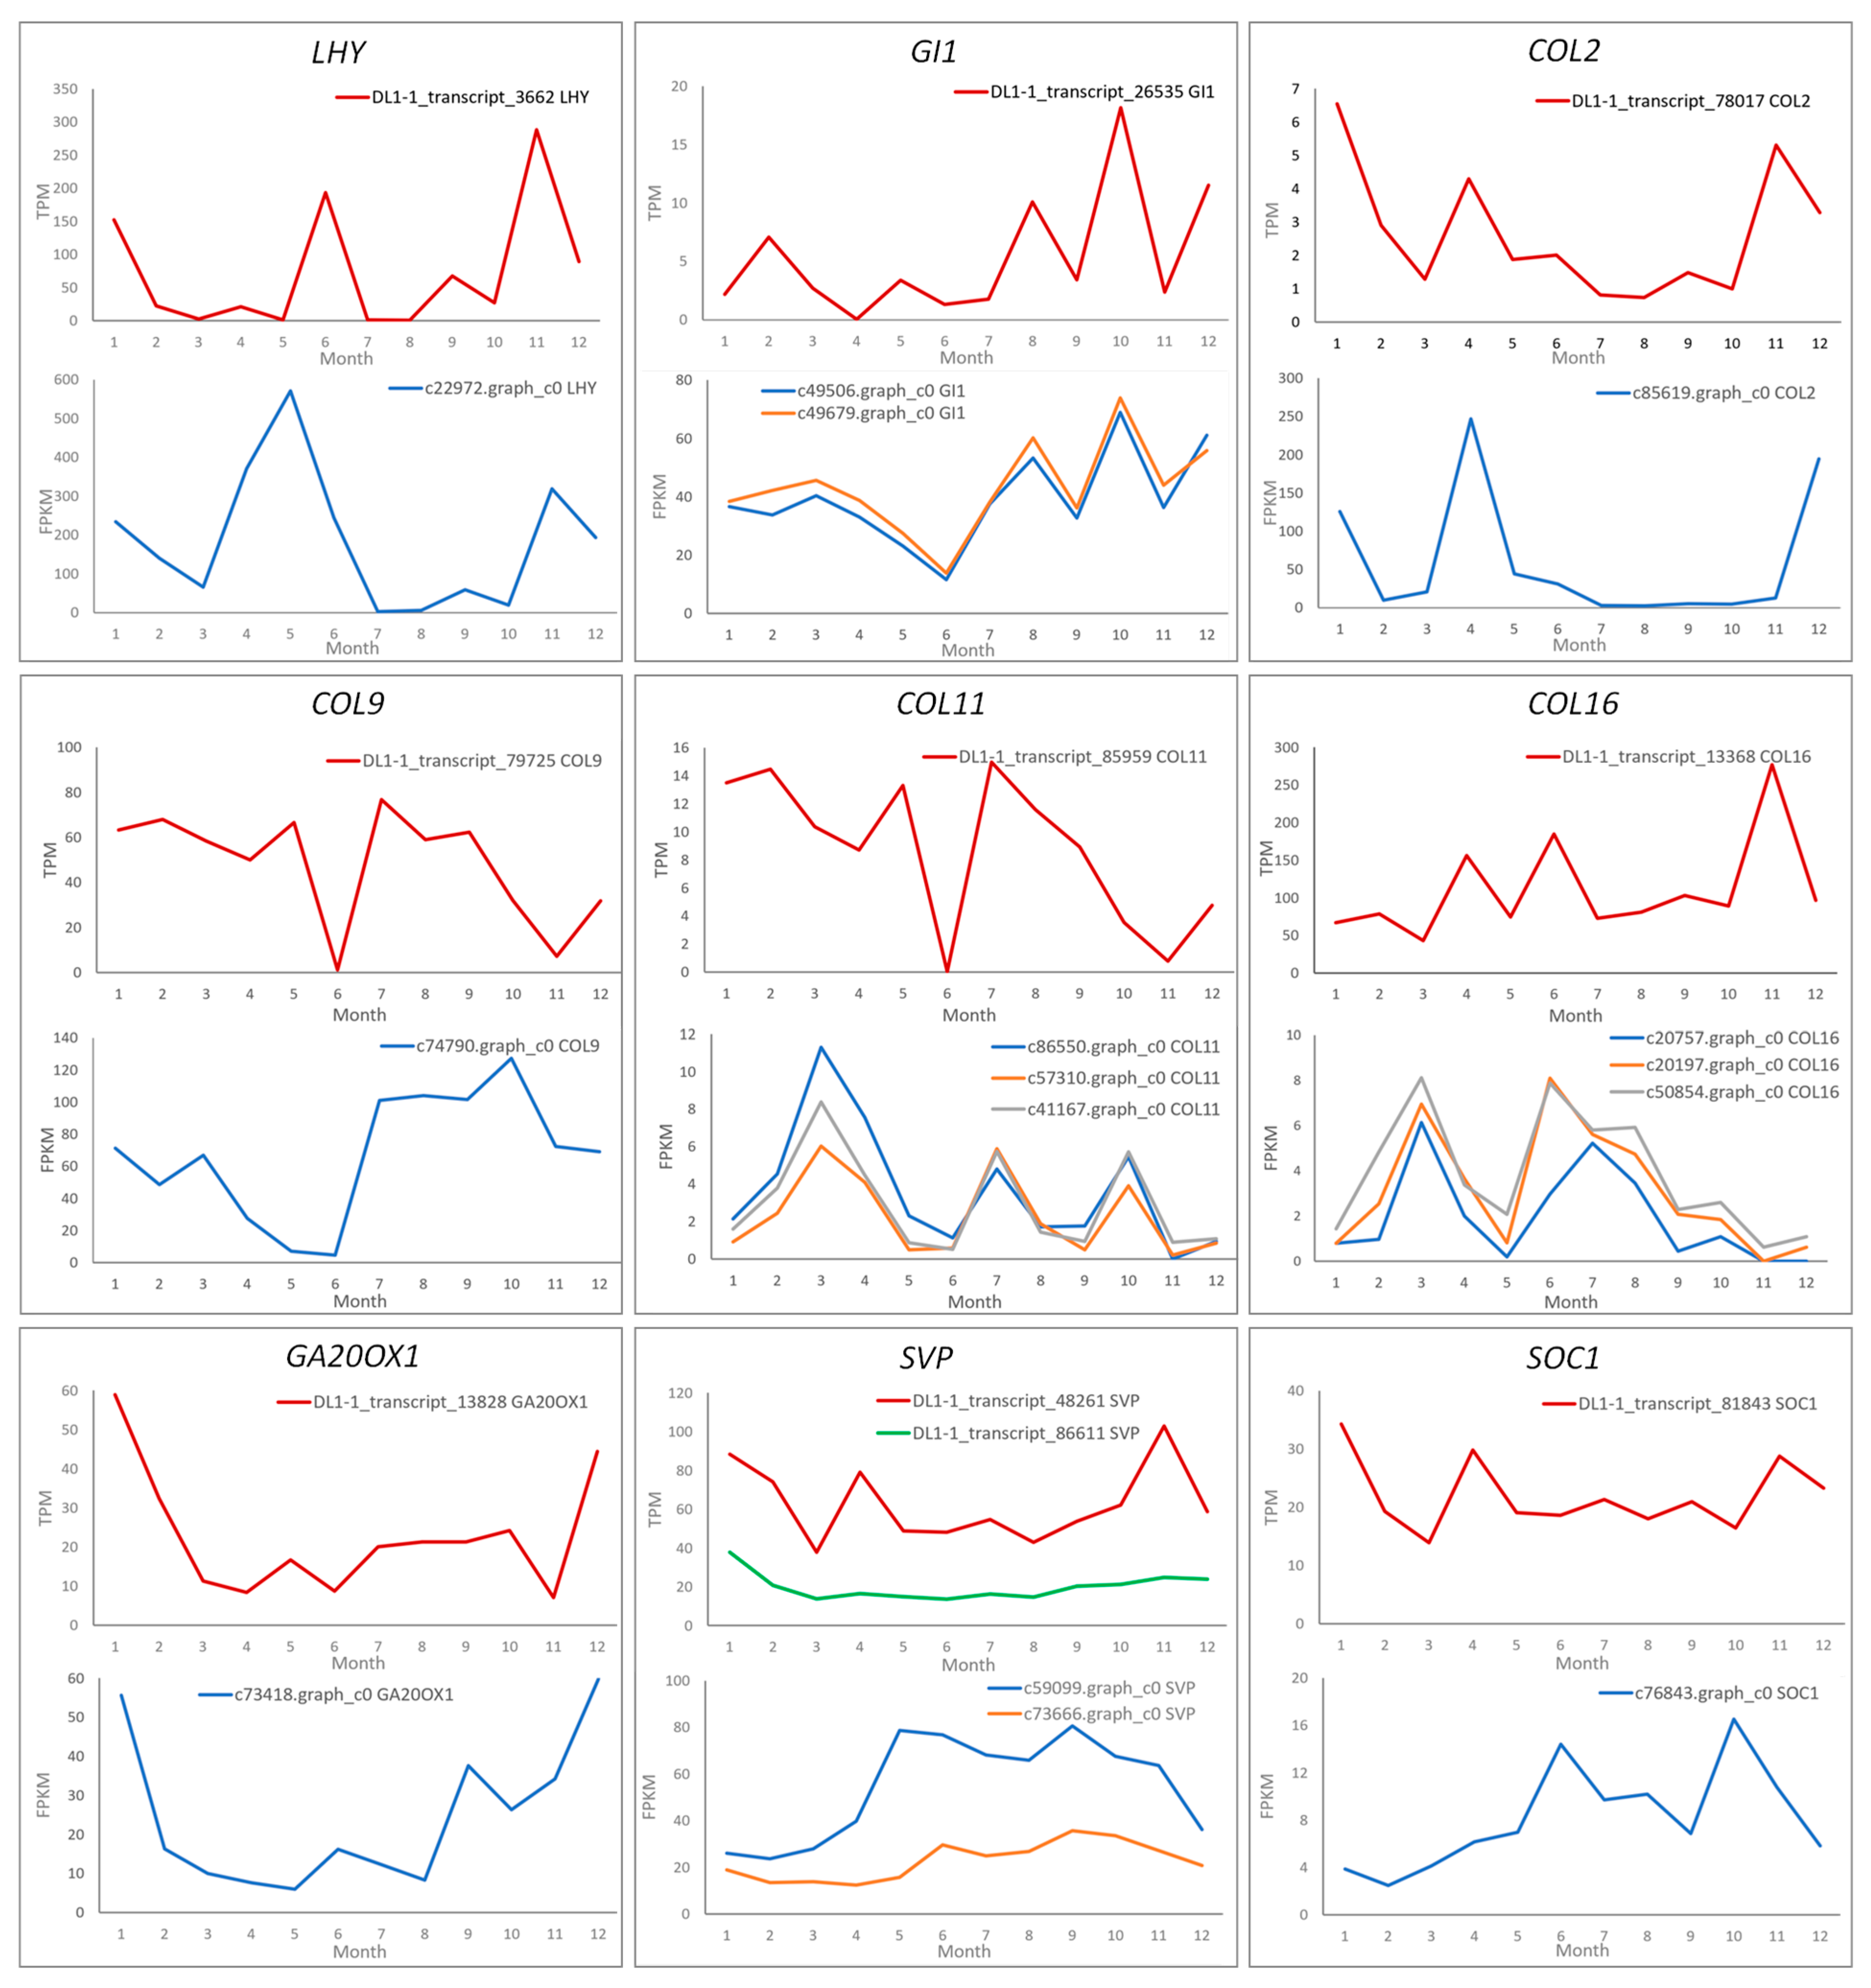
A blast analysis was conducted on the flowering-related genes differentially expressed in C. japonica using the transcriptome sequences from C. azalea. Homologous unigenes corresponding to 20 C. japonica transcripts were successfully identified in C. azalea (Figure 6). Further comparative analysis showed that LHY, GI1, COL2, COL9, and GA20OX1 exhibited similar annual expression patterns in both species. The two transcripts of the GI1 gene in C. japonica exhibited consistent expression patterns.
Figure 6. Annual expression trends of genes with differential expression across the year in C. japonica and C. azalea. DL1-1_transcript_XXX represents the transcript of C. azalea; cXXX.graph_cX represents the transcript of C. japonica.
Among the genes showing divergent expression patterns, COL11 in C. azalea (DL1-1_transcript_85959) exhibited high expression levels in January, May, August, and September, whereas all three corresponding C. japonica COL11 transcripts (c86550.graph_c0, c57310.graph_c0, and c41167.graph_c0) displayed consistently low expression throughout the year. By contrast, COL16 maintained high expression levels throughout the year in C. azalea, whereas its three corresponding transcripts in C. japonica exhibited uniformly low expression with stable patterns over time. both species possessed two orthologous transcripts of the thermosensitive flowering regulator SVP, with each species exhibiting one transcript at high expression and the other at low expression. In C. azalea, the higher-expressing SVP transcript (DL1-1_transcript_48261) exhibited a high expression level only in January and November, while the lower-expressing transcript showed a relatively stable expression profile throughout the year, with a modest increase in January. In C. japonica, the higher-expression SVP transcript (c59099.graph_c0) maintained a high level from June to November, correlating with the period when new flower buds did not form. Similarly, the lower-expression SVP transcript in C. japonica also showed higher expression from June to November. The expression pattern of C. azalea SOC1 (DL1-1_transcript_81843) was opposite to that in C. japonica. In C. azalea, SOC1 (DL1-1_transcript_81843) peaked in January and remained low from June to October, whereas in C. japonica, SOC1 (c76843.graph_c0) showed minimal expression in January and February but was highly expressed from June through November.
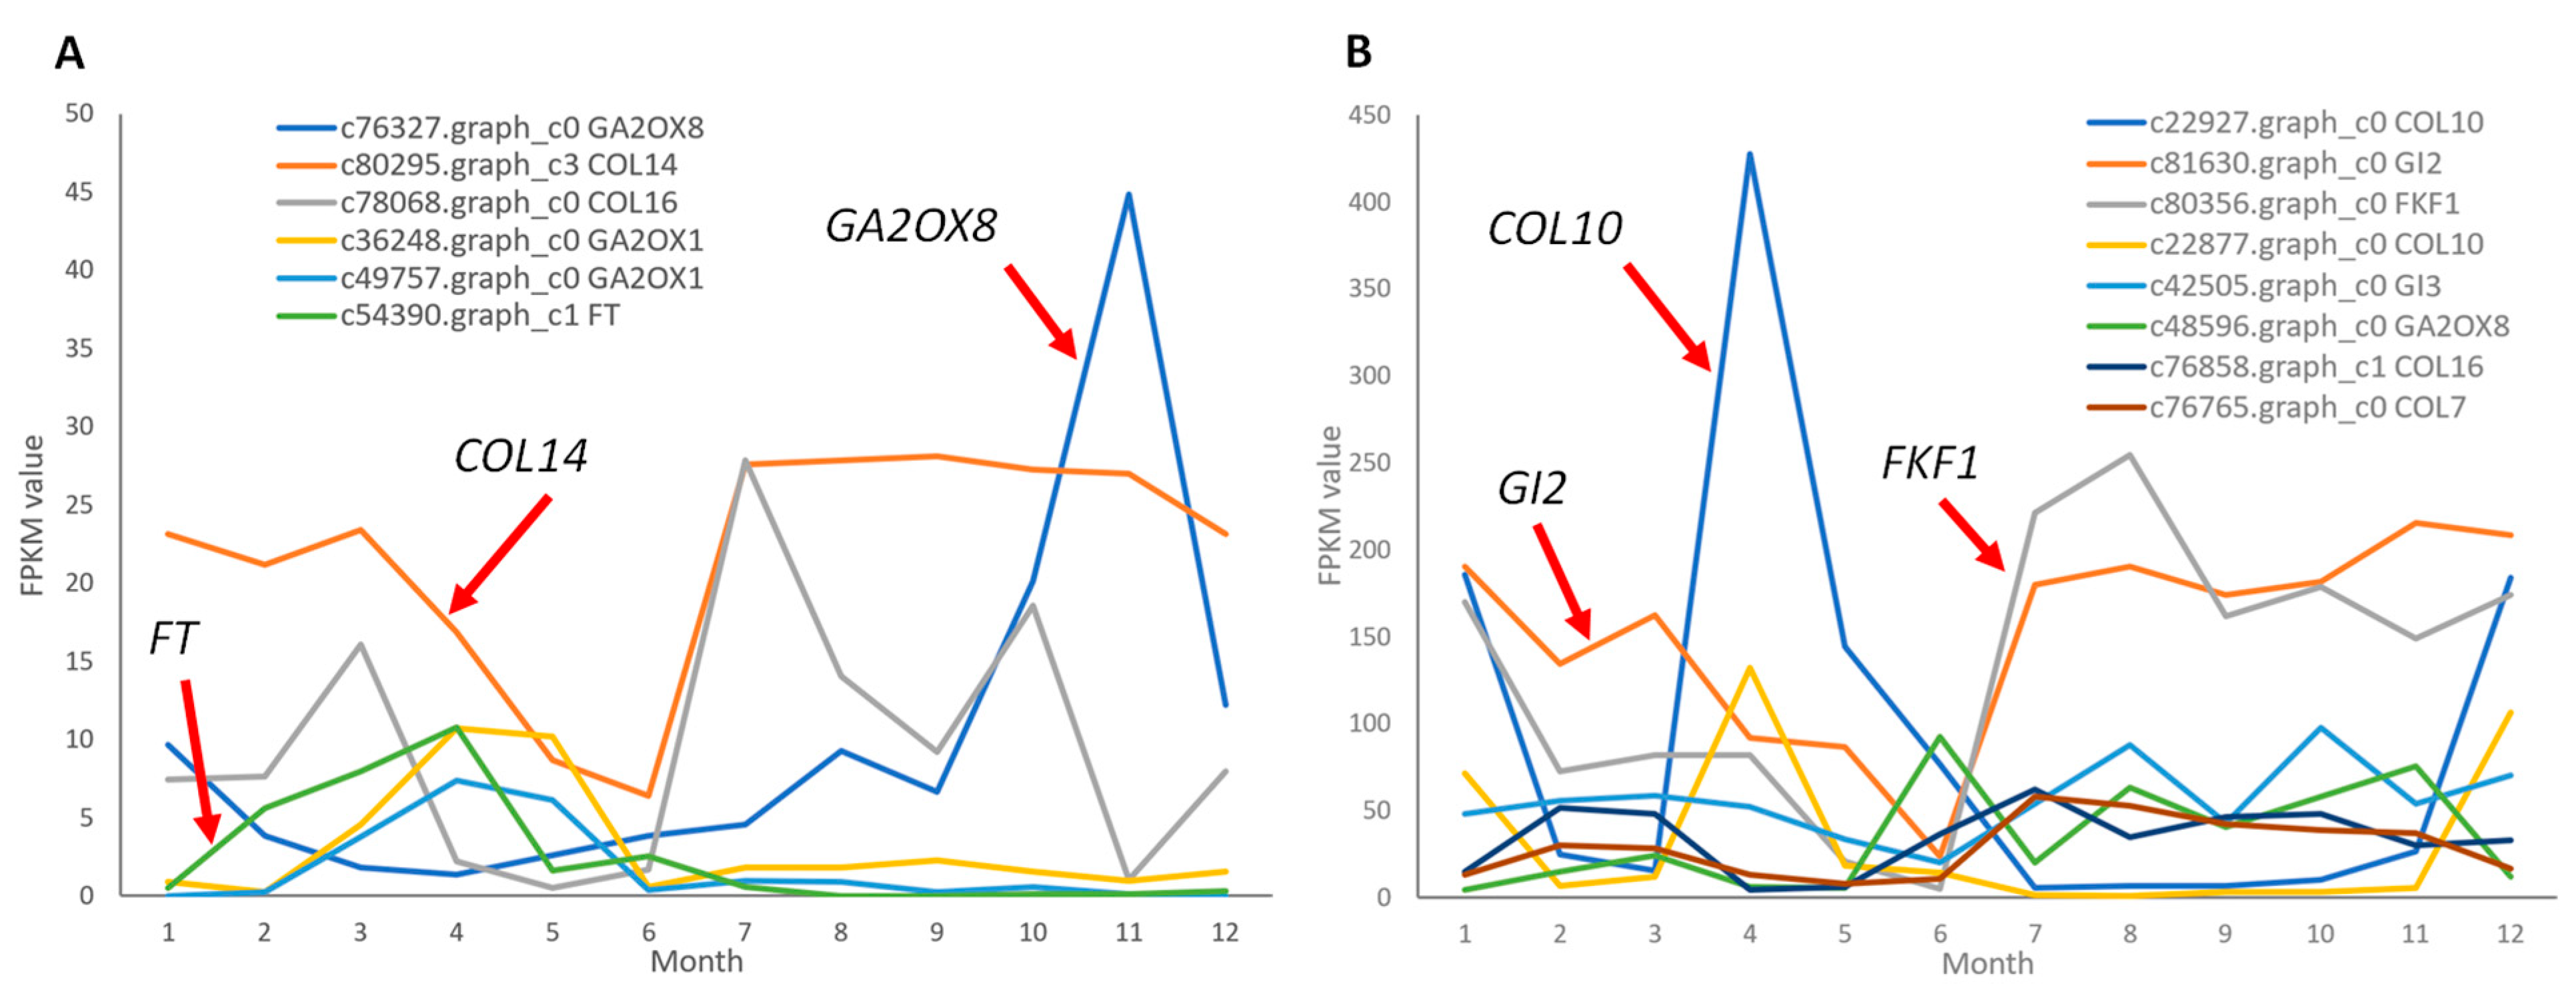
Additionally, among the 34 transcripts differentially expressed across months in C. japonica, 14 lacked identifiable corresponding unigenes in C. azalea, including GA2OX1, GA2OX8, FT, COL7, COL14, FKF1, COL10, and GI2 (Figure 7). Given the substantial variation in expression levels among these genes, their annual expression dynamics were further analyzed by categorizing them into two groups based on whether their maximum FPKM value over the 12-month period exceeded or fell below 50. Among genes with FPKM values below 50 (Figure 7A), the floral integrator FT (c54390.graph_c1) was expressed almost exclusively from February to April, with negligible levels in all other months—its peak expression aligning precisely with the floral bud induction period in C. japonica. GA2OX1 (c49757.graph_c0, c36248.graph_c0) showed an expression pattern similar to that of FT. GA2OX8 (c76327.graph_c0) and COL14 (c80295.graph_c3) showed an opposite expression trend to that of FT: GA2OX8 peaked in November, while COL14 showed a pronounced dip in expression during May and June but maintained relatively high levels throughout the rest of the year.
Figure 7. Annual expression trends of genes with differential expressions that are only expressed in C. japonica. (A) Genes with FPKM values between 5 and 50 in the highest expression month. (B) Genes with FPKM values above 50 in the highest expression month.
Among genes with FPKM values exceeding 50 (Figure 7B), COL10 (c22927.graph_c0) exhibited pronounced monthly fluctuations, reaching its highest expression in April and showing smaller peaks in January and December. Additionally, GI2 (c81630.graph_c0) and FKF1 (c80356.graph_c0) displayed their lowest expression levels in May and June, with elevated expression from July to January of the following year.

2.5. Validation of the Key Flowering-Related Genes by qRT-PCR

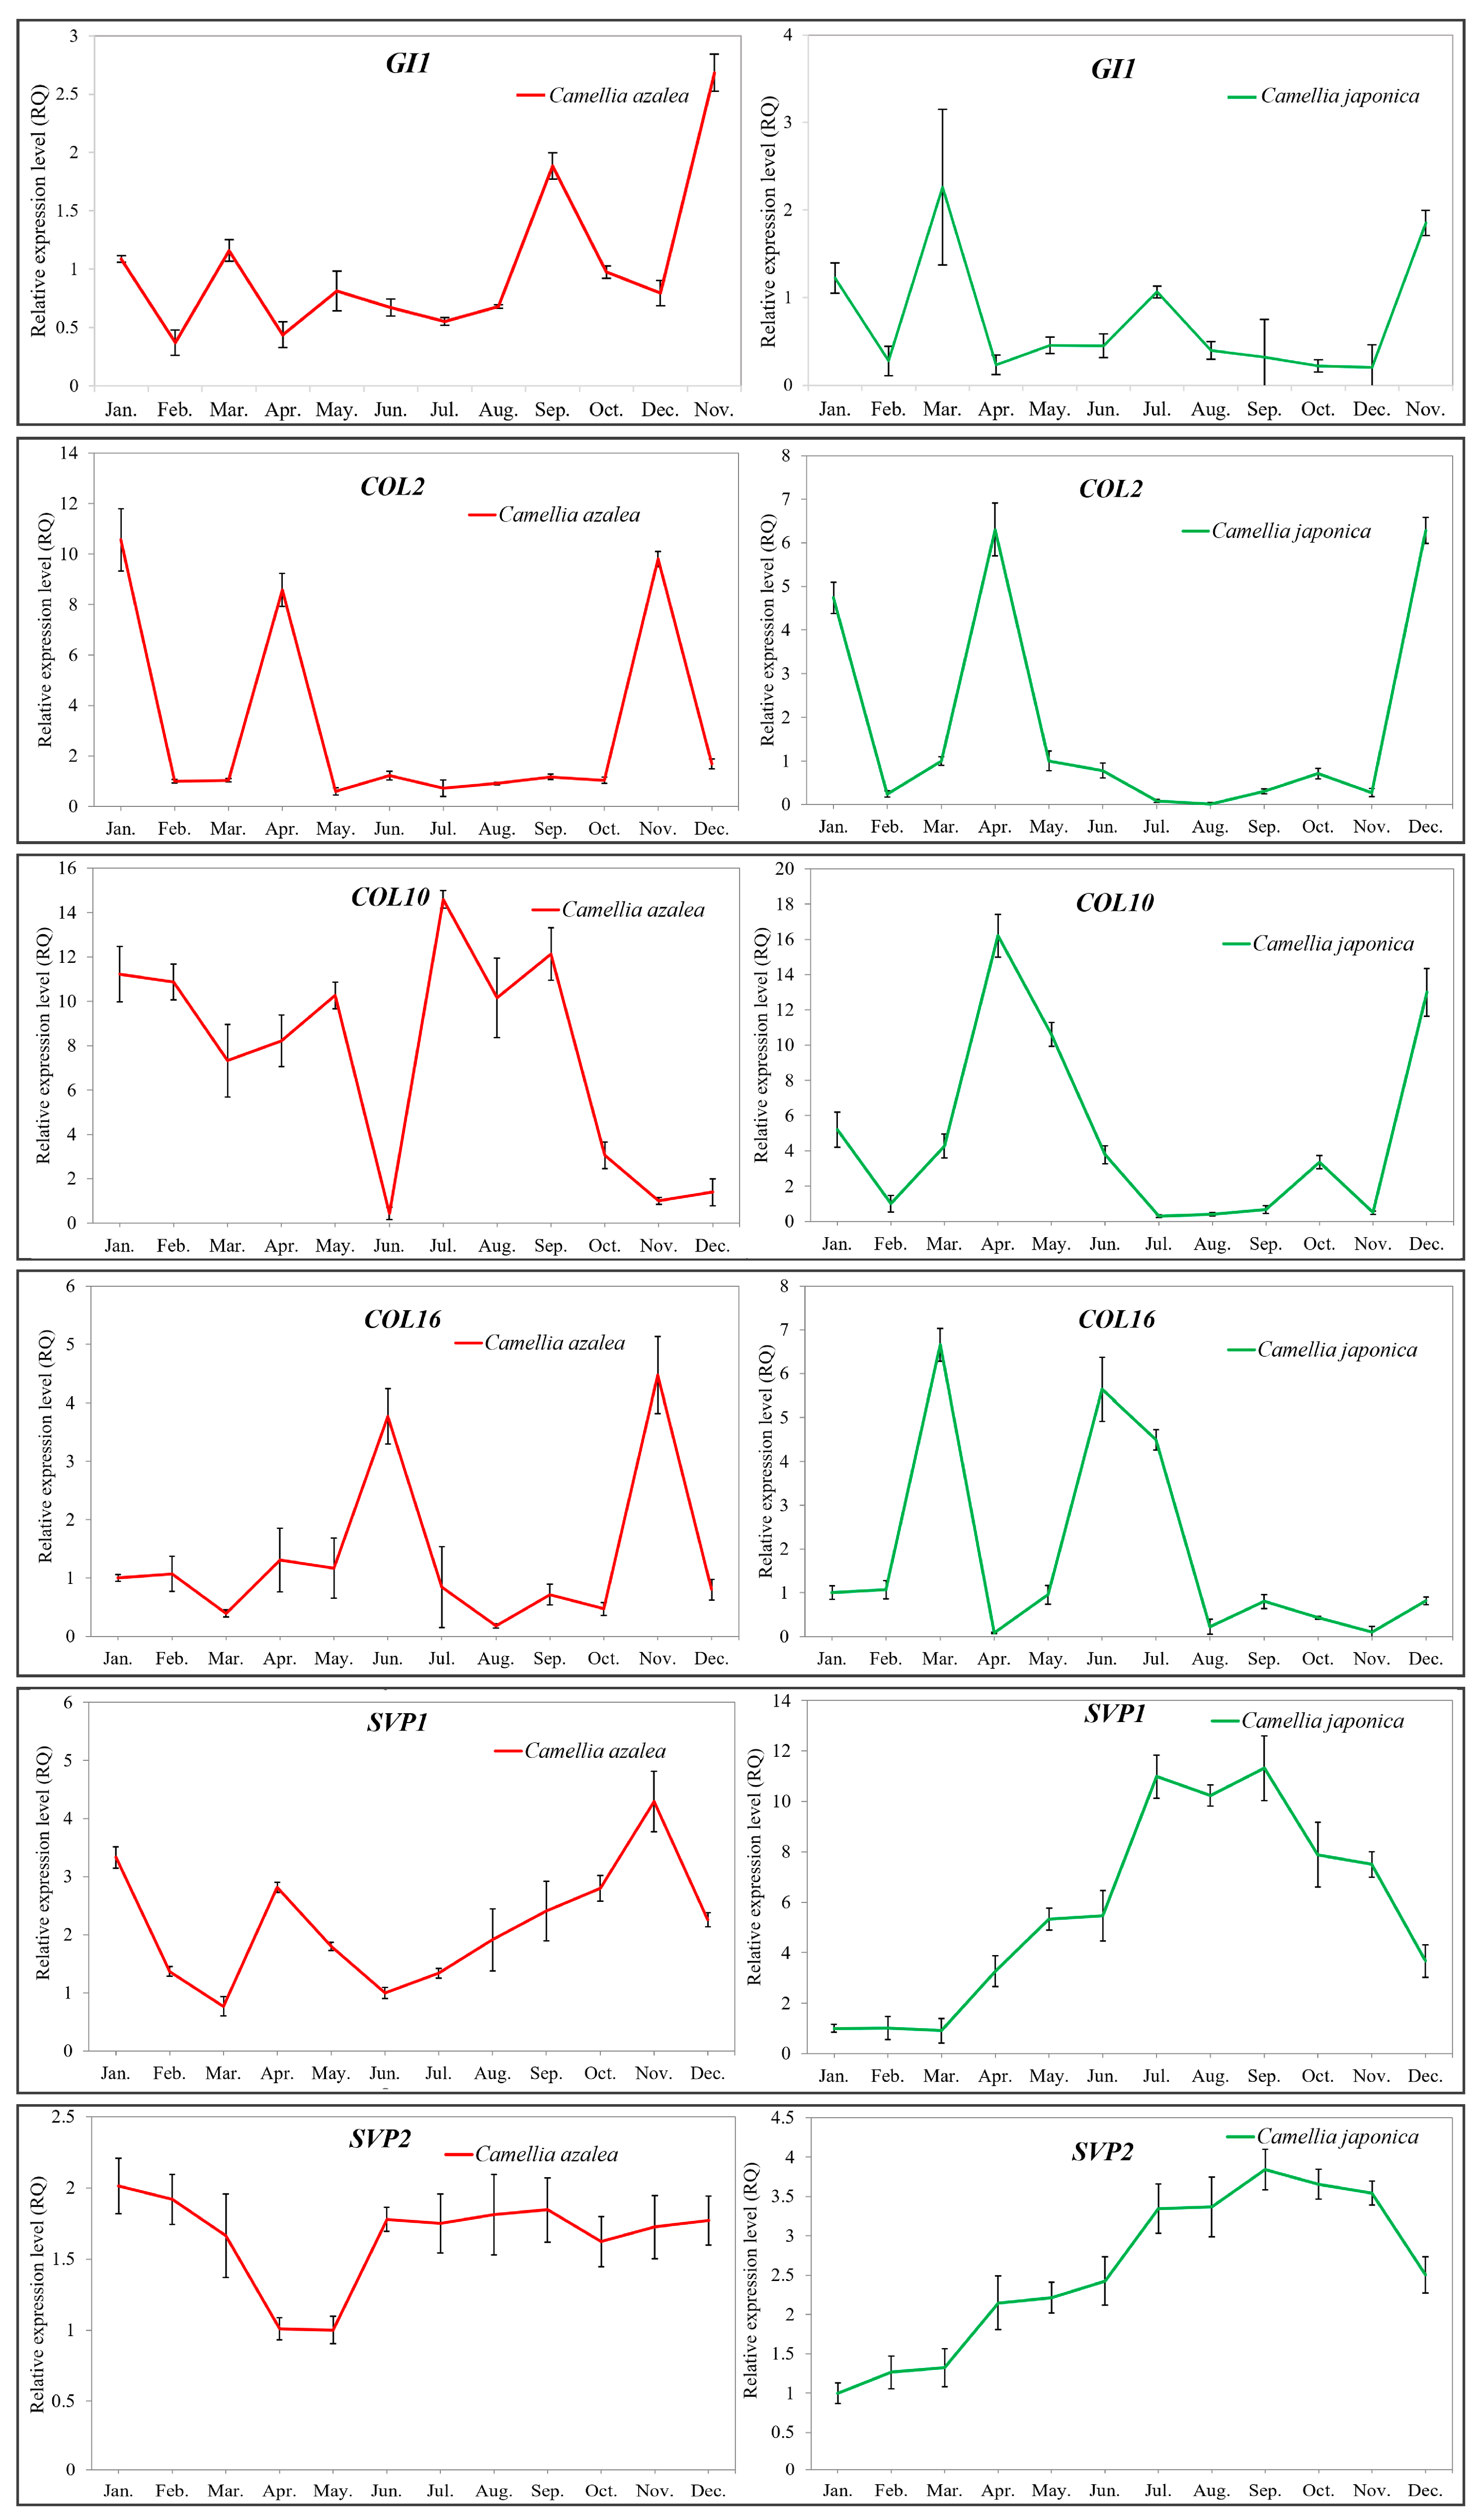
To validate the reproducibility and reliability of the transcriptome data and its analysis, we performed qRT-PCR on six genes from Figure 6 (GI1, COL2, COL10, COL16, SVP1, SVP2) identified as differentially expressed in the leaves of the two Camellia species sampled across all months of the year. The annual expression patterns observed by qRT-PCR were generally consistent with those derived from the transcriptome data (Figure 8).
Figure 8. Validation of several flowering-related genes expressed in C. azalea and C. japonica by qRT-PCR analyses. SVP1 represents the SVP transcript expressed at a higher level in both species shown in Figure 6, while SVP2 represents the SVP transcript expressed at a lower level in both species shown in Figure 6.
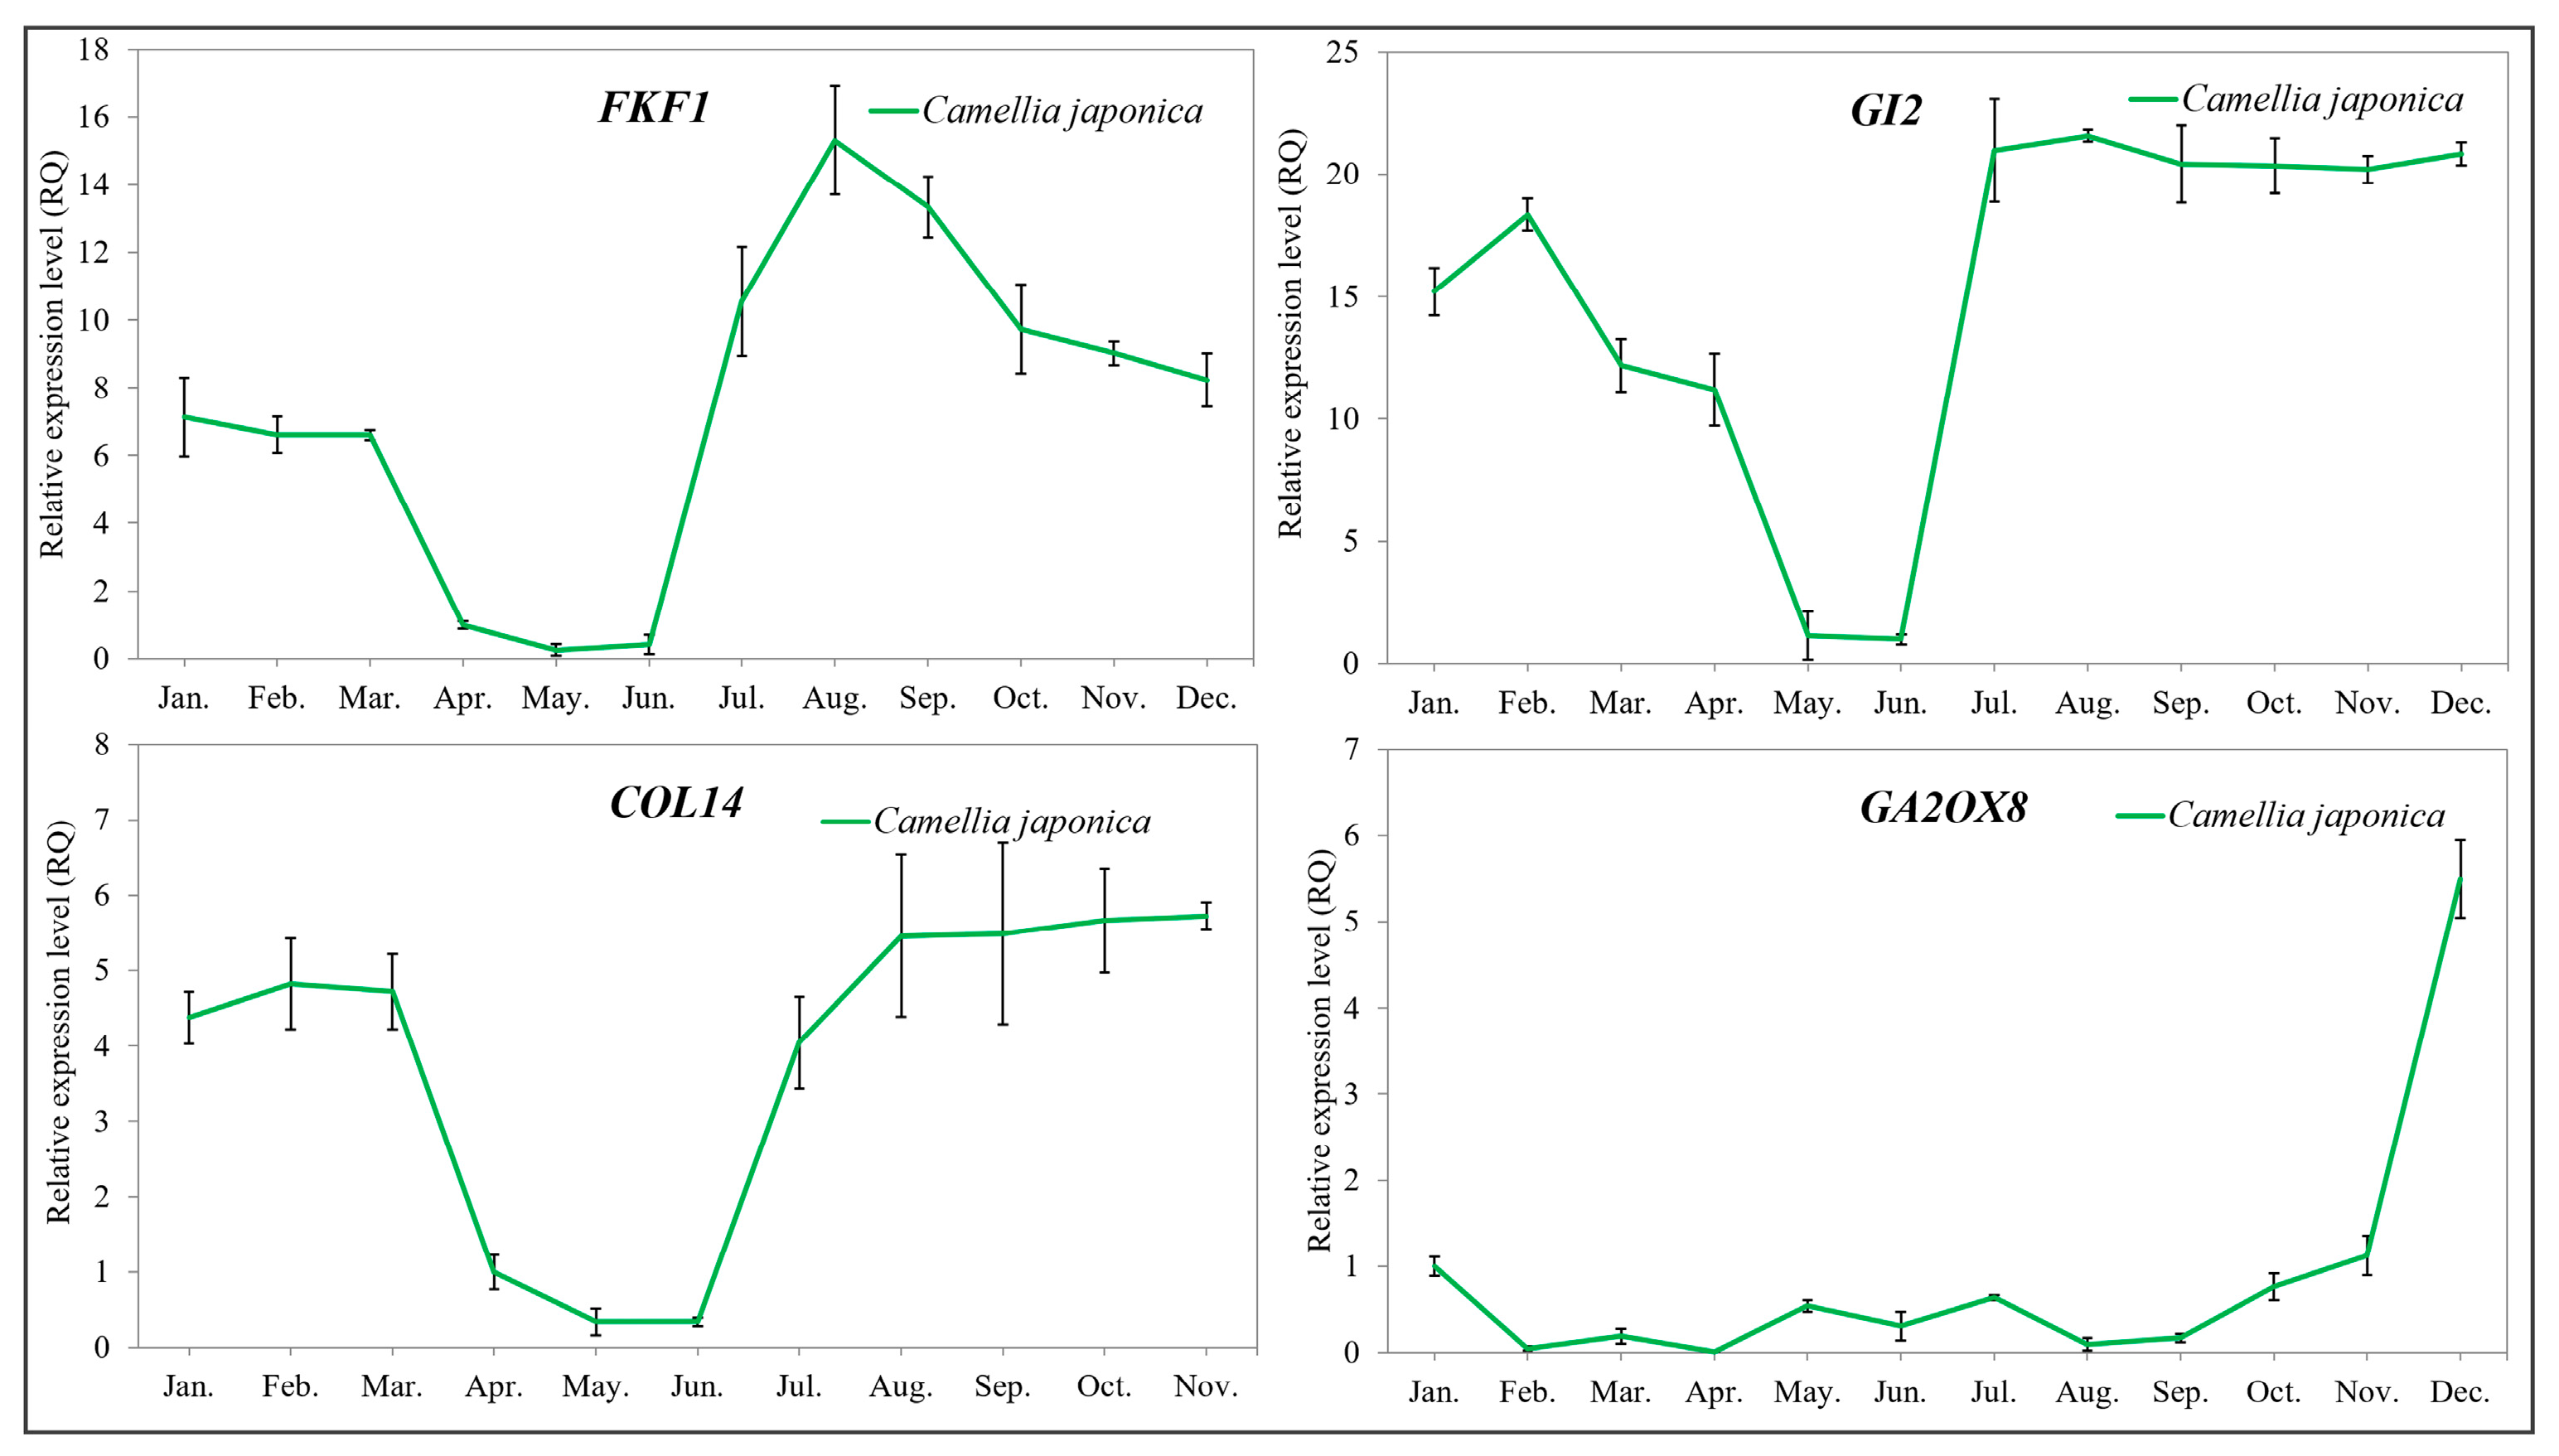
Additionally, the genes FKF1, GI2, COL14 and GA2OX8, shown in Figure 7, were detected exclusively in C. japonica via qRT-PCR, and their expression patterns align with those observed in the transcriptome (Figure 9).
Figure 9. Validation of four flowering-related genes expressed only in C. japonica by qRT-PCR analyses. These four genes all appear in Figure 7.

3. Discussion

Transcriptome analysis identified 248 and 257 flowering-related transcripts in C. azalea and C. japonica, respectively. Among these genes, some were found to have multiple transcripts. These may arise from the presence of distinct gene family members—as observed for SOC1 and SVP—or from alternative splicing of a single gene locus, as seen in GI1, COL11, and COL16. All of which are associated with the six canonical floral induction pathways. Comparative expression pattern revealed pronounced differences between the two species, particularly in genes belonging to the photoperiod and thermosensitive pathways.
In the photoperiod pathway, GI promotes CO expression by forming a complex with FKF1 that targets CDF1 for degradation, thereby relieving CDF1-mediated repression of CO [,]. GI can not only promote flowering but also suppress it. For example, overexpression of OsGI was found to delay flowering in rice []. In this study, a C. japonica-specific member of the GI gene family, GI2, exhibited high expression during the non-floral-bud-formation period but was barely detectable during the floral bud formation period (May to June), suggesting that GI2 may act as a repressor of floral bud formation in C. japonica. However, this gene was absent in C. azalea. This underscores its potential role as a key factor underlying the divergent flowering patterns between the two Camellia species. FKF1 displayed an expression pattern similar to that of GI2 and was detected exclusively in C. japonica. Thus, FKF1 represents an important target for investigating the molecular mechanisms underlying flowering regulation. In Arabidopsis, CO and other COL genes constitute the CO gene family [,]. Different members of this family exhibit divergent responses to photoperiod. For example, COL1 and COL2 are insensitive to photoperiod [], whereas COL9 and COL10 act as flowering inhibitors in Arabidopsis and rice, respectively [,]. Overexpression of the Chrysanthemum COL16 promotes early flowering in Arabidopsis []. In our study, C. japonica COL10 exhibited peak expression in April and maintained high expression levels in May, December, and January. No corresponding unigene was detected in C. azalea; Consequently, further functional validation is required to determine whether COL10 acts as a flowering promoter or inhibitor. In contrast to its expression pattern in C. japonica, COL16 was constitutively expressed at high levels throughout the year in C. azalea, suggesting a potential role in the latter’s year-round flowering phenotype. The COL14 gene, detected exclusively in C. japonica, exhibited high expression throughout the year except during May and June—the period of floral bud formation—suggesting that it may act as a repressor of floral initiation in this species.
SVP encodes an important transcription factor in the thermosensitive pathway that inhibits flowering by repressing FT expression [,]. Two SVP genes were identified in this study that exhibited markedly divergent expression patterns across the 12 months in leaves of C. azalea and C. japonica. SVP expression in C. japonica was relatively stable within seasons, showing low levels from January to April and high levels from July to November, consistent with regulation by seasonal temperature changes. In C. azalea, SVP expression remained relatively stable and showed little response to seasonal changes. This differential regulation suggests that SVP may act as a key repressor of floral bud formation in C. japonica, while its constitutive low expression in C. azalea could contribute to continuous flowering.
SOC1 is a downstream gene of FT. In C. japonica, one of the SOC1 transcript exhibited a seasonal expression pattern, with its peak coinciding with the high-expression phase of SVP. In contrast, this SOC1 expression in C. azalea remained stable throughout the year, whereas its seasonal upregulation in C. japonica—coinciding with SVP—suggests that this SOC1 transcript may function atypically, potentially contributing to the repression of floral bud induction in C. japonica.
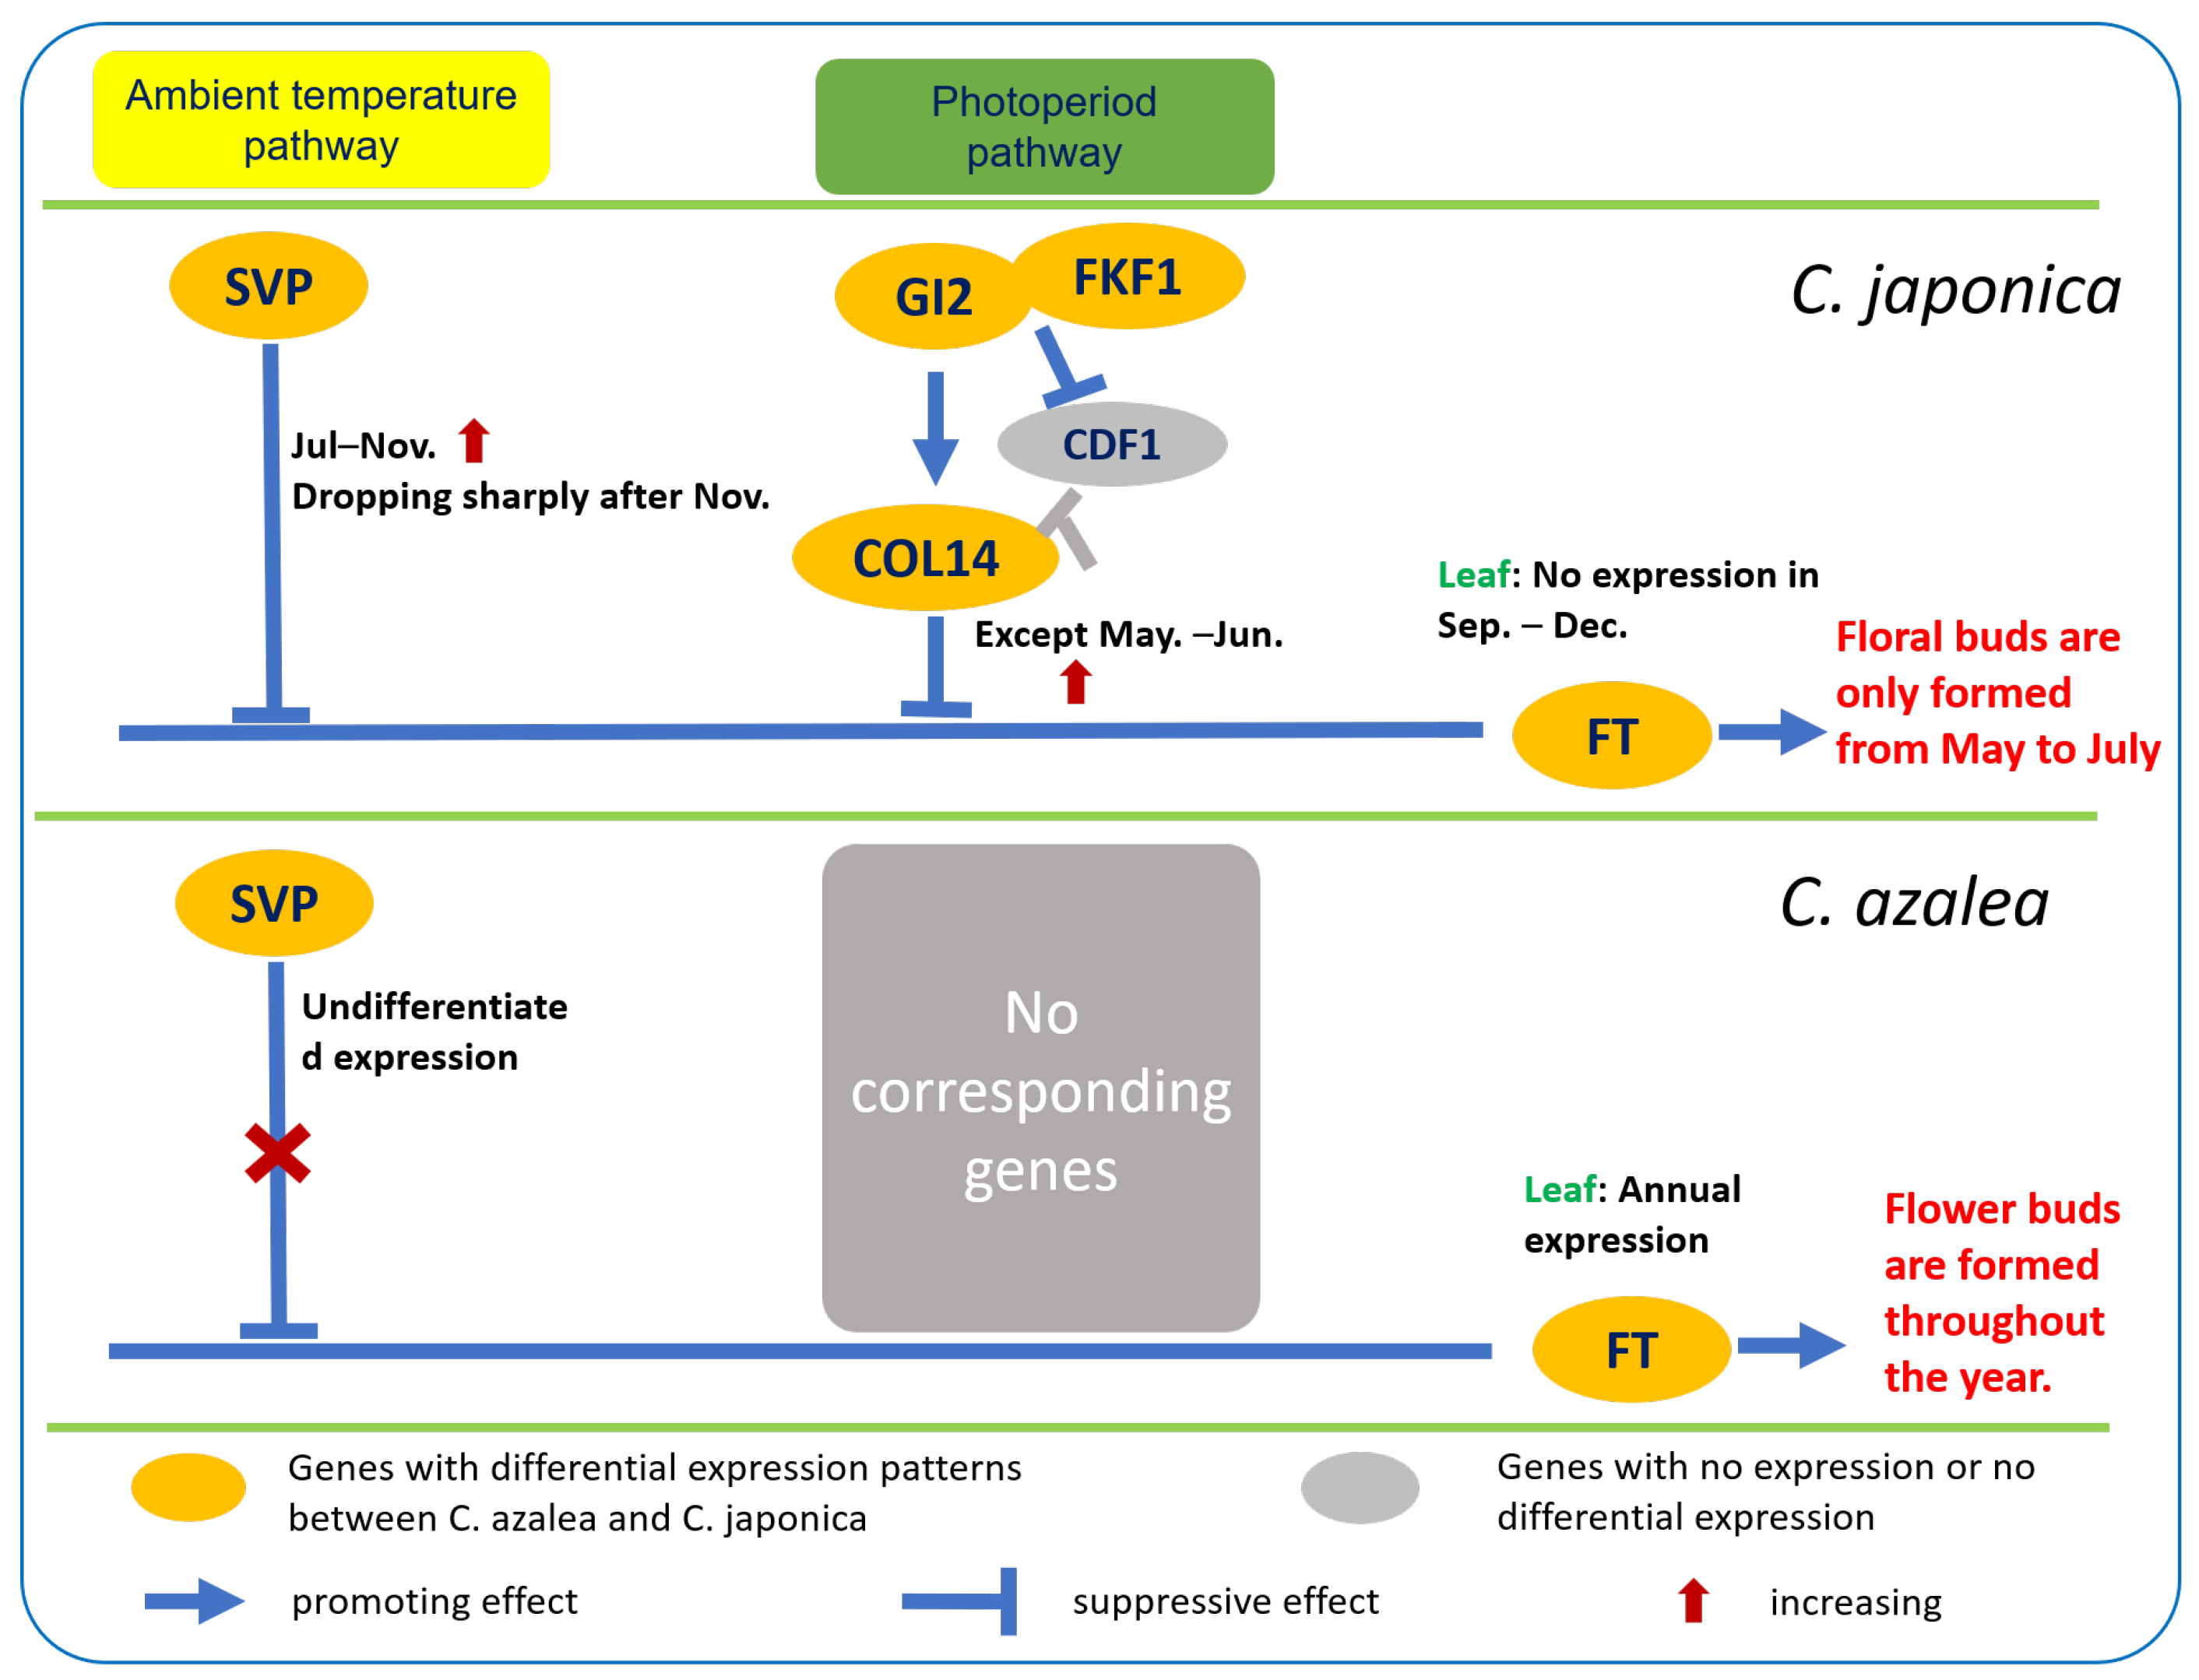
Although FT transcripts were not detected in the leaf transcriptome of C. azalea in this study, our previous qRT-PCR analysis revealed year-round FT expression in its leaves, with a peak from April to May []—a pattern that aligns with the species’ continuous floral bud formation and coincides with its primary bud development period. In C. japonica leaves, FT expression peaked from April to June, coinciding with the floral bud induction period, and was undetectable from September to December—consistent with the absence of new floral buds during these months. This expression pattern indicates that FT plays a critical regulatory role in floral bud formation in both C. azalea and C. japonica. Based on transcriptome analysis, we formulated a working hypothesis and constructed a simplified regulatory network illustrating the differential control of floral induction in the two Camellia species, incorporating DEGs identified in the photoperiod and thermosensory pathways (Figure 10). The divergence in photoperiod pathway regulation between C. azalea and C. japonica is primarily attributed to GI2, FKF1, and COL14—genes absent in C. azalea but exhibiting almost consistent expression in C. japonica leaves. These three genes are highly expressed throughout most of the year, except during the floral bud formation period (May and June), suggesting that they likely act as repressors of floral initiation. The primary divergence in the thermosensitive pathway between the two species lie in SVP expression dynamics: C. azalea exhibits minimal seasonal variation, whereas C. japonica shows sustained high expression from July to November—corresponding to the period when floral bud formation is absent. This suggests that SVP acts as a repressor of floral bud formation in C. japonica, whereas its stable, seasonally unresponsive expression in C. azalea may reflect a diminished or altered regulatory role, potentially contributing to year-round flowering.
Figure 10. Differential molecular regulation mechanisms of floral induction in C. azalea and C. japonica.
The absence of GI2, FKF1, and COL14, combined with the lack of pronounced seasonal variation in SVP expression in C. azalea, collectively suggest the absence of photoperiod- and thermosensitive-mediated repression of FT expression in this species. Consequently, FT is constitutively expressed throughout the year in C. azalea, resulting in continuous floral bud formation.
In C. japonica, the combined action of the photoperiod and thermosensitive pathways, marked by high expression of GI2, FKF1, COL14, and SVP from July to December, suppresses FT expression, consistent with the absence of floral bud formation during this period. Following a decline in SVP expression after November, FT expression in C. japonica increases slightly from January to March of the following year, coinciding with its flowering period. In April, the downregulation of photoperiod-associated repressors, GI2, FKF1, and COL14, combined with persistently low SVP expression, leads to a peak in FT expression, marking the onset of floral bud formation in C. japonica. By July, high expression of GI2, FKF1, COL14, and SVP resumes, repressing FT and thereby preventing further floral bud initiation for the remainder of the year.
Overall, we confirmed a clear difference in the annual pattern of floral bud formation between C. azalea and C. japonica: C. azalea is capable of forming floral buds year-round, whereas C. japonica initiates buds only from May to July. This phenotypic divergence is likely attributable to the absence of photoperiod- and thermosensitive-mediated repression of flowering in C. azalea. In general, our results suggest that the differences in the relevant upstream inhibitory pathways of floral induction in C. azalea and C. japonica may lead to the discrepancies in the annual distribution of floral bud formation between the two species. However, elucidating the specific regulatory mechanisms requires more direct validation. Overall, our results suggest that species-specific differences in the upstream repressive modules of floral induction pathways underlie the contrasting annual patterns of floral bud formation in C. azalea and C. japonica. However, elucidating the precise regulatory mechanisms will require further functional validation.

4. Materials and Methods

4.1. Plant Materials and Growth Conditions

The plant materials were selected from two Camellia species exhibiting distinct flowering phenotypes: C. azalea, a rare species that flowers year-round with a peak blooming period in summer, and C. japonica, the model species of the genus Camellia, which blooms exclusively in spring. All plants were grown under natural light conditions in the experimental field at the Research Institute of Subtropical Forestry in Hangzhou, Zhejiang, China (30°03′ N, 119°57′ E). The C. azalea individuals used in this study were 5-year-old field-grown seedlings, whereas the C. japonica plants were 10-year-old field-grown seedlings.

4.2. Investigation of the Annual Bud Formation Pattern

Three individual plants of C. azalea and three of C. japonica were selected for analysis. The number of floral buds measuring less than 2 mm in diameter was recorded at mid-month over a 12-month period. For each species, the monthly floral bud formation rate (%) was then calculated as the number of new floral buds observed in a given month divided by the total number of floral buds formed over the entire year, multiplied by 100. This metric enabled a comparative assessment of the seasonal distribution patterns of floral bud initiation between C. azalea and C. japonica.

4.3. Transcriptome Sequencing and Gene Expression Analysis of Leaves Throughout the Year

Transcriptome sequencing was performed on leaves of C. azalea and C. japonica collected at mid-month over a 12-month period, spanning from June of the current year—when tender shoots begin to lignify—through May of the following year. For each species, a cohort of continuously developing leaves was sampled monthly, with three biological replicates per month, yielding a total of 36 samples. Total RNA from these samples was extracted using the RNAprep Pure Plant Polysaccharide & Polyphenol Total RNA Extraction Kit from TIANGEN (Beijing, China). RNA samples from C. azalea were sent to Shanghai Majorbio Technology Co., Ltd. (Shanghai, China) for individual sequencing of all 36 samples. The RNA samples from C. japonica were sent to Beijing Biomarker Technologies, where the 36 samples were individually profiled for gene expression, but the transcriptome sequencing library was constructed from an equimolar pool of all 36 samples.
RNA sequencing (RNA-seq) for C. azalea was performed using the Illumina Novaseq 6000 platform, while both RNA-seq and expression profile sequencing for C. japonica were carried out using the Illumina HiSeqTM 2500 platform. Transcript assembly was carried out using Trinity (https://github.com/trinityrnaseq/trinityrnaseq/wiki 30 October 2025), and the resulting full-length transcripts were treated as unigenes.
The quality of the clean data was assessed by calculating the Q20, Q30, and GC values. All acquired transcripts functionally annotated by aligning them against the following public databases: National Center for Biotechnology Information non-redundant protein sequences (NR) (https://ftp.ncbi.nlm.nih.gov/blast/db/FASTA/, 5 May 2022), Swiss-Prot (a manually annotated and reviewed protein sequence database) (http://web.expasy.org/docs/swiss-prot_guideline.html, 6 May 2022), Protein family (Pfam) (http://pfam.xfam.org/, 9 May 2022), Clusters of Orthologous Groups of proteins (KOG/COG) (http://www.ncbi.nlm.nih.gov/COG, 10 May 2022), Gene Ontology (GO) (http://www.geneontology.org, 11 May 2022), and Kyoto Encyclopedia of Genes and Genomes (KEGG) (http://www.genome.jp/kegg/, 12 May 2022). For C. azalea, transcript expression levels were quantified using RSEM. The transcriptome assembly was used as the reference, and expression was reported as both TPM (transcripts per million) and read counts (i.e., the number of reads mapped to each gene). For C. japonica, sequencing reads were aligned to the reference genome using Tophat (v2.0.13), and the gene expression levels were estimated with Cufflinks/RSE. FPKM (fragments per kilobase of transcript per million mapped reads) values were used to represent the expression abundance of individual genes. DEG expression was analyzed using five complementary methods: DESeq2, DEGseq, edgeR, Limma, and NOISeq. The significance thresholds applied were as follows: DESeq2: adjusted p-value < 0.05 and |log2(fold change)| ≥ 1; DEGseq: adjusted p-value < 0.001 and |log2(fold change)| ≥ 1; edgeR: adjusted p-value < 0.05 and |log2(fold change)| ≥ 1; Limma: adjusted p-value < 0.05 and |log2(fold change)| ≥ 1; NOISeq: probability > 0.8. Analyses of DEGs, including Venn diagram comparisons, hierarchical clustering, gene function enrichment, and expression level difference analyses, were conducted using the Majorbio Cloud Platform (https://cloud.majorbio.com/page/tools.html, 10 July 2023). The original sequencing data of C. japonica are deposited in NCBl Bioproject under accession No. PRNA901631, which includes annual transcriptome sequencing (SAMN31778641-SAMN31778721). The original sequencing data of C. azalea are deposited in the Genome Sequence Archive (GSA) under accession No. CRA031967 (https://ngdc.cncb.ac.cn/gsa, 29 October 2025).

4.4. Validation of the Key Genes by qRT-PCR

Total RNA extracted from C. azalea and C. japonica was reverse-transcribed into cDNA using PrimeScript™ RT Master Mix (Perfect Real Time; Takara) (Beijing, China). Subsequently, qRT-PCR detection was performed using TB Green Premix Ex Taq II (Tli RNaseH Plus, RR820, TaKaRa) (Beijing, China). The GAPDH gene was used as the internal control gene for normalization of relative expression levels. Amplification was carried out on a QuantStudio®7 Flex system (Applied Biosystems, Foster City, CA, USA) under the following conditions: pre-denaturation at 95 °C for 30 s; 40 cycles of 98 °C for 5 s and 60 °C for 30 s; followed by 95 °C for 15 s, 60 °C for 1 min, and 95 °C for 15 s. The 2−ΔΔCT method was employed to determine the relative expression levels of genes across different species and various time points []. The primers are listed in Table 2.
Table 2. Sequences of primers for quantitative real-time polymerase chain reaction.

Supplementary Materials

The following supporting information can be downloaded at https://www.mdpi.com/article/10.3390/ijms262210854/s1.

Author Contributions

X.W., Z.F. and W.L. designed the workflow; X.W. performed the experiments and data analysis; X.W., W.L., J.L., Z.F., H.Y., X.L. and M.W. interpreted the data and wrote the manuscript. All authors have read and agreed to the published version of the manuscript.

Funding

The research was supported by the Zhejiang Science and Technology Major Program on Agricultural New Variety Breeding (2021C02071-2).

Institutional Review Board Statement

Not applicable.

Data Availability Statement

The data presented in this study are available on request from the corresponding author. The data are not publicly available due to privacy restrictions.

Conflicts of Interest

The authors declare that they have no conflicts of interest.

References

  1. Wellmer, F.; Riechmann, J.L. Gene networks controlling the initiation of flower development. Trends Genet. 2010, 26, 519–527. [Google Scholar] [CrossRef]
  2. Fornara, F.; de Montaigu, A.; Coupland, G. SnapShot: Control of flowering in Arabidopsis. Cell 2010, 141, 550. [Google Scholar] [CrossRef]
  3. Bäurle, I.; Dean, C. The timing of developmental transitions in plants. Cell 2006, 125, 655–664. [Google Scholar] [CrossRef]
  4. Kobayashi, Y.; Kaya, H.; Goto, K.; Iwabuchi, M.; Araki, T. A pair of related genes with antagonistic roles in mediating flowering signals. Science 1999, 286, 1960–1962. [Google Scholar] [CrossRef] [PubMed]
  5. Lebedeva, M.A.; Dodueva, I.E.; Gancheva, M.S.; Tvorogova, V.E.; Kuznetsova, K.A.; Lutova, L.A. The evolutionary aspects of flowering control: Florigens and anti-florigens. Russ. J. Genet. 2020, 56, 1323–1344. [Google Scholar] [CrossRef]
  6. Sheppard, T.L. Flowers from a sweetheart. Nat. Chem. Biol. 2013, 9, 215–216. [Google Scholar] [CrossRef]
  7. Park, D.H.; Somers, D.E.; Kim, Y.S.; Choy, Y.H.; Lim, H.K.; Soh, M.S.; Kim, H.J.; Kay, S.A. Control of circadian rhythms and photoperiodic flowering by the Arabidopsis GIGANTEA gene. Science 1999, 285, 1579–1582. [Google Scholar] [CrossRef]
  8. Sawa, M.; Nusinow, D.A.; Kay, S.A.; Imaizumi, T. FKF1 and GIGANTEA complex formation is required for day-length measurement in Arabidopsis. Science 2007, 318, 261–265. [Google Scholar] [CrossRef]
  9. Xu, X.; Jiang, W.; Chen, Y.; Tian, H.; Yang, Z.; Liu, S.; Li, X.; Song, C.; Ye, Z.; Guo, W.; et al. BRASSINAZOLE RESISTANT 1 delays photoperiodic flowering by repressing CONSTANS transcription. Plant Physiol. 2025, 197, kiaf032. [Google Scholar] [CrossRef]
  10. Wu, F.; Kang, Y.; Liu, L.; Lei, J.; He, B.; He, Y.; Li, J.; Liu, F.; Du, Q.; Zhang, X.; et al. The blue light receptor ZmFKF1a recruits ZmGI1 to the nucleus to accelerate shoot apex development and flowering in maize. Plant Cell 2025, 37, koaf199. [Google Scholar] [CrossRef] [PubMed]
  11. Hayama, R.; Yokoi, S.; Tamaki, S.; Yano, M.; Shimamoto, K. Adaptation of photoperiodic control pathways produces short-day flowering in rice. Nature 2003, 422, 719–722. [Google Scholar] [CrossRef]
  12. Robson, F.; Costa, M.M.R.; Hepworth, S.R.; Vizir, I.; Piñeiro, M.; Reeves, P.H.; Putterill, J.; Coupland, G. Functional importance of conserved domains in the flowering-time gene CONSTANS demonstrated by analysis of mutant alleles and transgenic plants. the Plant J. 2001, 28, 619–631. [Google Scholar] [CrossRef]
  13. Valverde, F. CONSTANS and the evolutionary origin of photoperiodic timing of flowering. J. Exp. Bot. 2011, 62, 2453–2463. [Google Scholar] [CrossRef] [PubMed]
  14. Ledger, S.; Strayer, C.; Ashton, F.; Kay, S.A.; Putterill, J. Analysis of the function of two circadian-regulated CONSTANS-LIKE genes. Plant J. 2001, 26, 15–22. [Google Scholar] [CrossRef] [PubMed]
  15. Cheng, X.F.; Wang, Z.Y. Overexpression of COL9, a CONSTANS-LIKE gene, delays flowering by reducing expression of CO and FT in Arabidopsis thaliana. the Plant J. 2005, 43, 758–768. [Google Scholar] [CrossRef] [PubMed]
  16. Tan, J.; Wu, F.; Wan, J. Flowering time regulation by the CONSTANS-Like gene OsCOL10. Plant Signal. Behav. 2017, 12, 143–147. [Google Scholar] [CrossRef]
  17. Chen, X.; Zhang, L.; Yu, X.; Chen, D.; Huang, C.; Li, Y. Cloning and functional analysis of ClCOL16 from Chrysanthemum lavandulifolium. Acta Bot. Boreali-Occident. Sin. 2023, 43, 366–373. [Google Scholar]
  18. Kinmonth-Schultz, H.; Lewandowska-Sabat, A.; Imaizumi, T.; Ward, J.K.; Rognli, O.A.; Fjellheim, S. Flowering times of wild Arabidopsis accessions from across Norway correlate with expression levels of FT, CO, and FLC genes. Front. Plant Sci. 2021, 12, 747740. [Google Scholar] [CrossRef]
  19. Angel, A.; Song, J.; Yang, H.; Questa, J.I.; Dean, C.; Howard, M. Vernalizing cold is registered digitally at FLC. Proc. Natl. Acad. Sci. USA 2015, 112, 4146–4151. [Google Scholar] [CrossRef]
  20. Vidal, A.M.; Ben-Cheikh, W.; Talón, M. Regulation of gibberellin 20-oxidase gene expression and gibberellin content in citrus by temperature and citrus exocortis viroid. Planta 2003, 217, 442–448. [Google Scholar] [CrossRef]
  21. Hedden, P.; Thomas, S.G. Gibberellin biosynthesis and its regulation. Biochem. J. 2012, 444, 11–25. [Google Scholar] [CrossRef]
  22. Hu, Q.; Jin, Y.; Shi, H.; Yang, W. GmFLD, a soybean homolog of the autonomous pathway gene FLOWERING LOCUS D, promotes flowering in Arabidopsis thaliana. BMC Plant Biol. 2014, 14, 263. [Google Scholar] [CrossRef] [PubMed]
  23. Eom, H.; Park, S.J.; Kim, M.K.; Kim, H.; Kang, H.; Lee, I. TAF15b, involved in the autonomous pathway for flowering, represses transcription of FLOWERING LOCUS C. Plant J. 2018, 93, 79–91. [Google Scholar] [CrossRef]
  24. Wang, J.; Czech, B.; Weigel, D. MiR156-regulated SPL transcription factors define an endogenous flowering pathway in Arabidopsis thaliana. Cell 2009, 138, 738–749. [Google Scholar] [CrossRef] [PubMed]
  25. Wu, G.; Park, M.Y.; Conway, S.R.; Wang, J.W.; Weigel, D.; Poethig, R.S. The sequential action of miR156 and miR172 regulates developmental timing in Arabidopsis. Cell 2009, 138, 750–759. [Google Scholar] [CrossRef]
  26. Liu, L.; Zhang, Y.; Yu, H. Florigen trafficking integrates photoperiod and temperature signals in Arabidopsis. J. Integr. Plant Biol. 2020, 62, 1385–1398. [Google Scholar] [CrossRef] [PubMed]
  27. Thines, B.C.; Youn, Y.; Duarte, M.I.; Harmon, F.G. The time of day effects of warm temperature on flowering time involve PIF4 and PIF5. J. Exp. Bot. 2014, 65, 1141–1151. [Google Scholar] [CrossRef]
  28. Wu, R.; Walton, E.F.; Richardson, A.C.; Wood, M.; Hellens, R.P.; Varkonyi-Gasic, E. Conservation and divergence of four kiwifruit SVP-like MADS-box genes suggest distinct roles in kiwifruit bud dormancy and flowering. J. Exp. Bot. 2012, 63, 797–807. [Google Scholar] [CrossRef]
  29. Wu, R.; Tomes, S.; Karunairetnam, S.; Tustin, S.D.; Hellens, R.P.; Allan, A.C.; Macknight, R.C.; Varkonyi-Gasic, E. SVP-like MADS box genes control dormancy and budbreak in apple. Front. Plant Sci. 2017, 8, 477. [Google Scholar] [CrossRef]
  30. Mo, X.; Mo, W.; Jiang, T.; He, S.; Liu, Y.; Xie, F.; Luo, C.; He, X. Functional characterization and regulatory mechanism of mango SHORT VEGETATIVE PHASE (SVP) gene family in response to temperature regulation of flowering. Plant Physiol. Biochem. 2025, 228, 110278. [Google Scholar] [CrossRef]
  31. Mo, X.; Luo, C.; Xia, L.; Mo, W.; Zhu, J.; Zhang, Y.; Hu, W.; Liu, Y.; Xie, F.; He, X. Overexpression of mango MiSVP3 and Mi-SVP4 delays flowering time in transgenic Arabidopsis. Sci. Hortic. 2023, 317, 112021. [Google Scholar] [CrossRef]
  32. Wang, X.; Li, J.; Yin, H.; Li, X.; Liu, W.; Fan, Z. Function of FT in flowering induction in two Camellia species. Plants 2024, 13, 784. [Google Scholar] [CrossRef]
  33. Livak, K.J.; Schmittgen, T.D. Analysis of relative gene expression data using real-time quantitative PCR and the 2−ΔΔCT method. Methods 2001, 25, 402–408. [Google Scholar] [CrossRef] [PubMed]
Disclaimer/Publisher’s Note: The statements, opinions and data contained in all publications are solely those of the individual author(s) and contributor(s) and not of MDPI and/or the editor(s). MDPI and/or the editor(s) disclaim responsibility for any injury to people or property resulting from any ideas, methods, instructions or products referred to in the content.

Article Metrics

Citations

Article Access Statistics

Multiple requests from the same IP address are counted as one view.