Abstract
Hormonal alterations associated with polycystic ovary syndrome (PCOS) also impact bone metabolism, though it is unclear if this is bone-protective or not. Bone marker dysfunction has been reported in PCOS and appears to be associated with obesity. This study sought to determine whether a panel of bone marker proteins (BMPs) would be dysregulated in PCOS stratified by BMI as a potential biomarker for bone in PCOS. In this exploratory cross-sectional study, plasma was collected from 234 women (137 with PCOS and 97 controls) from a biobank cohort and compared to a nonobese, non-insulin resistant population (24 with PCOS and 24 controls). Slow Off-rate Modified Aptamer (SOMA)-scan plasma protein measurement was undertaken for the following BMPs: sclerostin; Dickkopf-related protein-1; glycogen synthase kinase-3 alpha/beta; periostin; tumor necrosis factor ligand superfamily member 11; fibroblast growth factor 23; sphingosine kinase 1; sphingosine kinase 2; cathepsins A, B, D, E, G, L2, S and Z; parathyroid hormone; osteocalcin; tumor necrosis factor ligand superfamily member 11 (sRANKL) and interleukin-1 beta. Four BMPs differed in the PCOS cohort (whole set without matching for body mass index (BMI) or insulin resistance (IR)): periostin (p = 0.05), cathepsin L (p = 0.05) and osteocalcin (p = 0.02) decreased in PCOS, whilst cathepsin D (p = 0.02) increased; however, linear regression showed that only cathepsins D and L and osteocalcin differed. None of the BMPs differed in the nonobese women with and without PCOS, nor in obese PCOS and controls stratified by BMI greater than 30 kg/m2. In subgroup analysis, periostin (p = 0.001), sphingosine kinase 2 (p = 0.01) and cathepsin L (p = 0.001) were higher in obese versus nonobese PCOS (p = 0.01). Cathepsin Z (p = 0.02), sphingosine kinase 2 (p = 0.04) and lysosomal protective protein (p = 0.05) were lower in obese versus nonobese controls. Changes in BMPs indicative of impaired bone physiology were associated with BMI in both controls and PCOS, but did not differ between women with and without PCOS when BMI was matched. Hyperandrogenemia in PCOS did not affect BMP levels.
1. Introduction
Polycystic ovary syndrome (PCOS) is a common endocrine-metabolic disorder in women of reproductive age with an unclear etiology, characterized by infertility, irregular menstrual cycles, hirsutism, and acne [1]. PCOS is also associated with metabolic features with an increased risk of type 2 diabetes (T2DM), hypertension and early-onset cardiovascular disease (CVD) [2,3]. The underlying pathophysiology of PCOS leading to these conditions is still unclear. Obesity frequently co-occurs with PCOS and is associated with adverse reproductive outcomes [4]. Systemic, low-level inflammation and insulin resistance (IR), both common features of obesity and exacerbated by the PCOS phenotype might be the main mediators of PCOS pathophysiology [5,6]. The prevalence and phenotype of PCOS varies considerably according to ethnicity with, for example, women from the Middle East having a higher prevalence and a more metabolic phenotype [7].
There is debate as to whether PCOS may impact upon bone metabolism, either in a protective or detrimental fashion, with studies on bone mineral density (BMD) suggesting a positive effect [8], a negative effect [9] or no effect [10]. In a large population based study in Denmark, there was a protective effect of PCOS on fracture rates [11] but, conversely, in a Chinese population there was a negative effect of PCOS on fracture rates [12]; however, the two populations differed in terms of hyperandrogenism, body mass index (BMI) and insulin resistance.
Obesity may be related to bone protection with only a decrease in lumbar BMD being seen in normal weight PCOS [13], and lower femur and spine BMD particularly being found in those women with PCOS with a BMI of less than 27 kg/m2 [14] and perhaps a BMI of less than 25 kg/m2 [15], data suggesting that the increased BMI associated with PCOS may have a protective effect on BMD. Hyperandrogenism may be protective in women with PCOS. In women with hypothalamic amenorrhea associated with low estrogen levels, low BMD was reported but, in women with PCOS, their BMD was not lowered and femoral neck BMD was positively associated with circulating androgens [16].
IR has been positively correlated to BMD [13] and, in a clinical study, women with PCOS had higher BMD compared to amenorrheic women without PCOS, and insulin levels correlated to BMD suggesting that insulin resistance and hyperinsulinemia in women with PCOS may be a relative protective factor against bone mineral loss [17]. Conversely, there is evidence that IR may play a key role in the increased fracture risk observed in both obesity and type 2 diabetes (T2DM), two conditions prevalent in women with PCOS [18].
Chronic inflammation is reported to negatively impact upon BMD [19] with an increased risk of osteoporosis with leptin deficiency and increased oxidative stress [20]. In women with PCOS and inflammation, this has been shown to offset the protective effects of increased weight and muscle mass on bone strength [19].
Given the complexity and uncertainty around the effect of PCOS on bone, and the fact that it is difficult to account statistically for BMI with the associated IR and chronic inflammation seen in obesity, this study was undertaken in weight stratified patients with and without PCOS, including a cohort of age- and BMI-matched nonobese women with and without PCOS and without chronic inflammation, to determine if a panel of bone marker proteins differed between the cohorts. Figure 1 details the potential modes of action of the BMPs in the panel.
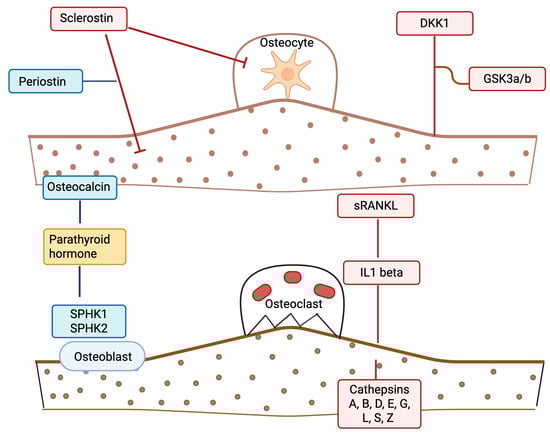
Figure 1.
A schematic illustrating potential bone marker protein effects in polycystic ovary syndrome (PCOS). Proteins depicted in blue are anabolic/formation factors. Proteins depicted in red are catabolic/formation factors. The protein in yellow (parathyroid hormone (PTH)) is a mixed regulatory factor. Straight lines indicate a stimulatory effect; blunt-ended lines indicate an inhibitory effect. The illustration was created using BioRender.com (with publication license).
2. Results
Baseline data for the PCOS biobank of 146 PCOS patients and 97 controls are shown in Table 1a and the 24 nonobese, non-insulin-resistant PCOS subjects and controls are shown in Table 1b. For the obese cohort, age was matched, but PCOS subjects had a greater BMI and showed increased insulin resistance, hyperandrogenemia with an elevated testosterone and FAI and increased CRP (a marker of inflammation). For the nonobese, non-insulin-resistant cohort, age and BMI were matched, and the women with PCOS were not insulin-resistant nor was their CRP elevated, but they did have hyperandrogenemia.

Table 1.
(a) Demographics and baseline hormonal and metabolic parameters of the polycystic ovary syndrome biobank (PCOS) subjects and controls. (b) Demographics and baseline hormonal and metabolic parameters of the age- and BMI-matched PCOS subjects and controls (mean ± SD). All parameters did not differ, other than those marked ** = p < 0.01.
The results of the BMP factors are shown in Table 2 for the PCOS biobank cohort and PCOS versus controls (whole set without matching for BMI or IR). Four BMPs differed in PCOS: periostin (p = 0.05), cathepsin L2 (p = 0.05) and osteocalcin (p = 0.02) were decreased in PCOS, whilst cathepsin D was increased in PCOS (p = 0.02).
Table 2.
Bone marker proteins for the polycystic ovary syndrome (PCOS) biobank cohort. PCOS n = 137, controls n = 97, without body mass index (BMI) stratification. Data presented as Mean ± 1 Standard Deviation of Relative Fluorescent Units (RFU).
There were no differences in the BMPs in the nonobese age and BMI matched cohort (Supplementary Table S1).
When stratified for BMI greater than 30 kg/m2 for both PCOS and controls (demographic data shown in Supplementary Table S2), there were no differences in BMI, CRP, insulin or Homeostasis model of assessment—insulin resistance (HOMA-IR), but the PCOS cohort had hyperandrogenemia with raised testosterone. There were no differences in the BMPs in the BMI > 30 kg/m2 PCOS and control cohort (Table 3).
Table 3.
Weight-stratified polycystic ovary syndrome (PCOS) (Body mass index (BMI) > 30 kg/m2) versus controls (BMI > 30 kg/m2) for bone marker proteins. Data presented as Mean ± 1 Standard Deviation of Relative Fluorescent Units (RFU).
When stratified for PCOS, BMI greater than 30 kg/m2 and BMI less than 26 kg/m2 (demographic data shown in Supplementary Table S3) there were no differences in CRP, insulin, HOMA-IR, or hyperandrogenemia, and only BMI differed significantly. Periostin, sphingosine kinase 2 and cathepsin L2 were higher in PCOS > 30 kg/m2 (p = 0.001, p = 0.01 and p = 0.001, respectively) (Table 4).
Table 4.
Weight stratified polycystic ovary syndrome (PCOS) (Body mass index (BMI) > 30 kg/m2) versus PCOS (BMI < 26 kg/m2) for bone marker proteins. Data presented as Mean ± 1 Standard Deviation of Relative Fluorescent Units (RFU).
When stratified for controls, BMI greater than 30 kg/m2 and BMI less than 26 kg/m2 (demographic data shown in Supplementary Table S4), there were no differences in CRP, insulin, HOMA-IR, or hyperandrogenemia, and only BMI differed significantly. Cathepsin Z (p = 0.02), sphingosine kinase 2 (p = 0.04) and lysosomal protective protein (p = 0.05) were higher in controls <26 kg/m2 (Table 5).
Table 5.
Weight-stratified controls (Body mass index (BMI) < 26 kg/m2) versus obese controls (BMI > 30 kg/m2) for bone marker proteins. Data presented as Mean ± 1 Standard Deviation of Relative Fluorescent Units (RFU).
In the adjusted linear regression models, for most biomarkers there was no evidence of a difference between groups. Cathepsin D was higher in the PCOS group (p = 0.02), and cathepsin L (p = 0.04) and osteocalcin (p = 0.05) were lower compared to controls. Periostin (p = 0.07) and cathepsin Z (p = 0.08) were no longer significant though suggested a trend (Table 6).
Table 6.
Bone marker proteins in women with and without polycystic ovary syndrome (PCOS)—additional regression analysis. Individual linear regression models were used to examine differences in bone marker protein (BMP) levels between women with PCOS and controls in the biobank cohort. Each model included group (PCOS vs. control) and was adjusted for age and body mass index (BMI). Least squares mean (LS-mean) differences (PCOS—control) with 95% confidence intervals (CIs) were estimated for each BMP.
3. Discussion
Bone marker proteins differed significantly between women with and without PCOS in the PCOS biobank cohort in whole-group analysis with changes in periostin, cathepsin L, osteocalcin and cathepsin D, but linear regression showed changes in cathepsins D and L and osteocalcin, with a trend for periostin and cathepsin Z. Tentatively this could suggest a shift to impaired bone formation and increased resorptive activity that would be in accord with reported studies suggesting that overall in PCOS, there is decreased BMD [9,13]. In this PCOS cohort, there was increased BMI, IR and systemic inflammation with increased CRP and hyperandrogenemia that may have worked in concert to negatively affect bone compared to that of the normal control population. This study is novel, as there is scant data on these BMPs in PCOS-related bone physiology and there is no study measuring all these BMPs at the same time, or synthesizing how all their potential activities may affect bone in PCOS.
Periostin is secreted by osteoblasts, promotes osteoblast differentiation and survival, enhances mechano-sensing in mechanical loading, enhances Wnt/β-catenin signaling, and contributes to collagen crosslinking and matrix organization [21,22]. Therefore, the lower levels seen in whole group analysis may suggest impaired bone formation, and a reduced adaptive response to mechanical stress is associated with low bone mass, fragility and poor bone quality, even when bone mineral density is not markedly reduced, and is seen in conditions of osteoporosis or reduced bone turnover states [23,24]; however, with linear regression, periostin did not significantly differ but rather may have shown a trend. Periostin has been reported to differ in PCOS compared to controls and to be positively correlated with BMI, IR and CRP, and it is suggested that it may be linked to ovarian function [25]; however, others have suggested that its levels do not differ in PCOS [26]. Its levels following weight stratification or linear regression have not previously been determined, nor has its role in PCOS bone physiology been defined.
Cathepsin L is a cysteine protease expressed in osteoclasts and some osteoblast lineage cells that contributes to degradation of bone matrix proteins [27,28], It is decreased in both whole group and linear regression analysis. If it is decreased this may suggest reduced proteolytic activity of osteoclasts, suggesting lower bone resorption capacity that may contribute to low bone turnover states or imbalance in bone remodeling [29]. Cathepsin L is not extensively studied in humans, but is found in human granulosa cells and may be increased by luteinizing hormone and may be involved in follicle rupture [30]. Its role in PCOS bone physiology has not been determined to date.
Osteocalcin is a non-collagenous protein secreted by osteoblasts during bone matrix synthesis and is reported to be a marker of bone formation and osteoblast activity [31]. It also may function as a hormone influencing insulin sensitivity and testosterone production [32]. Lower levels were seen in whole-group analysis and with linear regression. A decrease may reflect reduced osteoblast activity and bone formation [33]. Osteocalcin wasnoted to be markedly reduced in PCOS women with a BMI < 27 kg/m2, but did not differ in those with a BMI > 27 kg/m2 [34].
Increases in cathepsin D were seen for both whole-group and linear analysis. Cathepsin D is a lysosomal aspartyl protease expressed in multiple tissues, including osteoclasts. In bone, it is reported to degrade non-collagenous proteins and facilitates osteoclastic bone resorption [35]. Its increase may suggest enhanced osteoclastic activity and bone resorption, and elevated cathepsin D activity is associated with collagen breakdown and matrix degradation [35]. Cathepsin D expression has been noted to be down-regulated in ovaries and is found in the endometrium of PCOS patients [30,36,37], but its role in PCOS bone physiology has not been determined to date.
In the age- and nonobese-BMI-matched cohort with and without PCOS, these PCOS women did not have IR or systemic inflammation (as CRP was not elevated), but did have hyperandrogenemia. There were no differences in any of the BMPs, suggesting that there was no effect on BMPs by hyperandrogenemia alone. This would seem incongruous to the reports of a decrease in BMD in normal-weight PCOS [13,14,15]; however, this cohort was unusual in not having IR or systemic inflammation, both of which are associated with a decreased BMD [17,18,19].
When BMI stratification was undertaken for the PCOS (BMI > 30 kg/m2) versus controls (BMI > 30 kg/m2) there were no differences in BMI, IR or systemic inflammation, though the PCOS cohort remained hyperandrogenemic. There were no changes in BMPs suggesting that the changes in BMPs seen were due to obesity and its associated pathophysiological sequalae of increased IR and systemic inflammation and that hyperandrogenism alone in the presence of obesity did not affect the BMP levels, similarly to the result seen for the nonobese cohort detailed above.
Subgroup analysis with BMI stratification was undertaken for the PCOS (BMI > 30 kg/m2) and PCOS (BMI < 26 kg/m2) subjects the only differences were in BMI, with IR, systemic inflammation and hyperandrogenemia being no different. Periostin, sphingosine kinase 2 and cathepsin L were decreased in the cohort with a BMI less than 26 kg/m2. As detailed above both periostin and cathepsin L decreases could suggest a shift to impaired bone formation and increased resorptive activity. Sphingosine kinase 2 produces sphingosine-1-phosphate (S1P), a bioactive lipid mediator that is critical in cell survival, migration, angiogenesis, and bone remodeling [38], but has not been reported in PCOS patients to date. In bone, S1P regulates osteoblast–osteoclast coupling and bone turnover. If sphingosine kinase 2 is decreased, then hypothetically that may result in reduced S1P production leading to impaired bone cell signaling. In the osteoblast, there is reduced bone formation and mineralization capacity, whilst in the osteoclast there is potential dysregulation of osteoclast apoptosis, leading to prolonged resorptive activity [38]. Overall, this triad may potentially lead to bone remodeling toward bone fragility with low formation and relatively higher resorption, which would be in accord with the decrease in BMD reported in normal weight PCOS [13,14,15]. Conversely, it could be said that periostin, sphingosine kinase 2 and cathepsin L were increased in the cohort with a BMI more than 30 kg/m2, which may suggest that increased periostin could be associated with bone turnover and increased bone fragility [23]; an increase in sphingosine kinase 2 promotes osteoclast recruitment and potential bone resorption and is implicated in the osteolytic process [39]; an increase in cathepsin L may indicate active osteoclast-mediated bone resorption [40], thus the triad may hypothetically be detrimental to bone homeostasis. Thus, with IR, systemic inflammation and hyperandrogenemia being accounted for between cohorts, BMI appears to be the major factor leading to the change in the BMPs.
Subgroup analysis with BMI stratification was undertaken for the control (BMI > 30 kg/m2) and control (BMI < 26 kg/m2) subjects; the only difference was in BMI, with IR, systemic inflammation and hyperandrogenemia being no different. Sphingosine kinase 2, cathepsin Z and lysosomal protective protein (cathepsin A) were lower in those with a BMI greater than 30 kg/m2. Cathepsin Z is a cysteine protease with a unique RGD integrin-binding domain that may facilitate osteoclast adhesion, migration, matrix degradation and osteoblast precursor adhesion. Reduction results in osteoclasts that attach less effectively to bone surface, leading to impaired resorption [41]. However, in linear analysis of the PCOS biobank cohort, sphingosine kinase 2, cathepsin Z and lysosomal protective protein (cathepsin A) were not found to differ significantly.
PCOS is a complex condition that has inherent independent effects on clinical parameters as well as indirect effects, such as with concomitant obesity, resulting in multicollinearity that may distort linear analysis. In addition, regression analysis assumes a binary outcome, rather than the continuous data that is the case for each BMP, and regression analysis assumes that the data is linear, which is often not the case with real world data; this may have resulted in differences between the analyses. We believe that presenting both approaches, subgroup comparisons for clinical clarity and regression analyses for statistical robustness, offers the most complete picture of the data. Therefore, the changes in periostin cathepsin L, osteocalcin and cathepsin D are preliminary findings and need be treated with some caution until functional validation or direct correlation data with bone mass can be undertaken. Bone mineral density was not undertaken in either of the cohorts; therefore, it was not possible to correlate the BMPs with this important parameter. Additional limitations of this study include that it was performed on a Caucasian population and would need to be repeated to consider ethnic differences. PCOS phenotype A, which expresses all three of the diagnostic criteria (as for the PCOS biobank cohort), is reported to be at higher risk of adverse metabolic and cardiovascular outcomes compared to the other phenotypes, and phenotype D is the least severe. All the nonobese PCOS subjects had anovulatory infertility, but half were phenotype B (irregular menses with hyperandrogenism) and half were phenotype C (irregular menses and polycystic ovaries on transvaginal scanning).There were too few subjects to compare the groups. Thus, expression of BMP-related proteins needed to be clarified for the individual PCOS phenotypes. A strength of this study was the BMI stratification of obese and nonobese PCOS and controls, to account for BMI, IR, systemic inflammation and hyperandrogenemia, as adjusting for BMI and insulin resistance statistically is very difficult as both are so highly correlated with PCOS that regression adjustment for either or both may remove the PCOS effects. Future larger studies with this BMP panel, together with measures of BMD and bone strength, are needed to determine their utility as biomarkers for bone physiology in weight-stratified PCOS patients, and whether any of these BMPs may be of utility as bone fragility markers in PCOS.
In conclusion, in the biobank PCOS and control cohorts, BMPs showed an indicative shift to impaired bone formation and increased resorptive activity in PCOS. In the weight-matched and -stratified obese and nonobese PCOS, hyperandrogenemia alone had no effect on BMPs. When obese and nonobese PCOS were compared, changes in BMPs were indicative of bone remodeling, potentially toward bone fragility. When obese and nonobese controls were compared, indicative changes in BMPs towards suppressed bone remodeling in the obese control group were toward bone fragility, potentially with both formation and resorption being impaired.
4. Materials and Methods
4.1. Study Cohorts
4.1.1. Obese PCOS and Control Group [42]
Plasma levels of BMPs were measured in women diagnosed with polycystic ovary syndrome (PCOS; n = 137) and healthy controls (n = 97), all of whom were recruited from a UK-based PCOS Genetic Biobank (ISRCTN70196169). Written informed consent was obtained from all participants. The study was approved by the Newcastle & North Tyneside Research Ethics Committee.
All participants were of Caucasian ethnicity. PCOS was diagnosed based on at least two of the three Rotterdam criteria, as previously detailed [43]: (1) clinical and/or biochemical hyperandrogenism (Ferriman–Gallwey score > 8, free androgen index > 4, or total testosterone > 1.5 nmol/L), (2) oligo- or amenorrhea, and (3) polycystic ovarian morphology on transvaginal ultrasound. Alternative diagnoses including nonclassical 21-hydroxylase deficiency, hyperprolactinemia, Cushing’s syndrome, and androgen-secreting tumors were excluded through appropriate investigations. Baseline clinical measurements have been previously described [44]. Control participants, recruited via public advertisement, reported regular menstrual cycles (28 ± 4 days), showed no clinical or biochemical signs of hyperandrogenism, had normal ovarian morphology (i.e., had no features of PCOS), had no significant comorbidities and were not taking any prescription or over-the-counter medications, including hormonal contraceptives.
4.1.2. Nonobese PCOS and Control Group [45]
BMPs were also measured in a separate cohort of nonobese women with PCOS (n = 24) and BMI- and age-matched controls (n = 24) recruited from the Hull IVF clinic [46]. Inclusion criteria included age between 20 and 40 years and a body mass index (BMI) ≤ 30 kg/m2. Control women were undergoing IVF for male factor infertility or unexplained infertility. All eligible participants attending the clinic for a routine mock embryo transfer procedure were approached, and those who agreed provided written informed consent. This study received ethical approval from the Yorkshire and the Humber National Research Ethics Service (NRES), UK (approval number: 02/03/043).
4.1.3. Sample Processing and Biochemical Analysis
Fasting blood samples were centrifuged at 3500× g for 15 min, aliquoted, and stored at –80 °C until analysis. Measurements included C-reactive protein (CRP), sex hormone-binding globulin (SHBG), insulin (DPC Immulite 200 analyzer, Euro/DPC, Llanberis, UK), and plasma glucose (Synchron LX20 analyzer, Beckman-Coulter, High Wycombe, UK). Free androgen index (FAI) was calculated as: FAI = (Total Testosterone/SHBG) × 100. Insulin resistance was assessed using the homeostasis model assessment (HOMA-IR). Serum testosterone concentrations were measured using isotope-dilution liquid chromatography tandem mass spectrometry (LC-MS/MS)(TSQ Altis Plus Triple Quadrupole Mass Spectrometer, Thermofisher, Altrincham, UK) [46].
Circulating BMP levels were quantified using the SOMAscan proteomic platform (Version 3.1, Somalogic, Boulder, CO, USA), based on Slow Off-rate Modified Aptamer (SOMA) technology [47]. The SOMAscan assay version 3.1 was used, with normalization, hybridization, and calibration performed as per manufacturer’s specifications using internal standards on each plate. Details of the assay have been previously reported [48].
Targeted BMPs [41,49,50,51] included sclerostin, Dickkopf-1, glycogen synthase kinase-3α/β, periostin, tumor necrosis factor ligand superfamily member 11 (sRANKL), fibroblast growth factor 23, sphingosine kinases 1 and 2, multiple cathepsins (A, B, D, E, G, L2, S, Z), parathyroid hormone, osteocalcin, and interleukin-1β (refer to Figure 1 and Table 2 for detailed listings).
4.2. Statistical Analysis
A formal power analysis is the preferred approach in study design; however, the absence of prior data on expected effect sizes meant a reliable a priori calculation was not feasible. Therefore, we conducted this study as an exploratory pilot, with the primary aim of generating initial estimates of variability and effect sizes to guide future studies. Data distributions were visually and statistically assessed for normality using the Kolmogorov–Smirnov statistical test, because for all proteins the p value of the K-S test was greater than 0.05, indicating the likely normal distribution of the data; Student’s t-test was used to compare differences between groups. Parametric analyses (independent t-tests) were applied to normally distributed variables, while non-parametric comparisons (Mann–Whitney U tests) were used for variables that did not meet normality assumptions. A p value of 0.05 or less was taken to be statistically significant. For statistical analysis, Graphpad Prism v9.5.1 (San Diego, CA, USA) was utilized.
Individual linear regression models were used to examine differences in BMP levels between women with PCOS and controls in the biobank cohort. Each model included group (PCOS vs. control) and was adjusted for age and BMI. Least squares mean (LS-mean) differences (PCOS–control) with 95% confidence intervals (CIs) were estimated for each BMP. Additional models including group x BMI interaction were also tested, but none of the interactions were statistically significant, indicating that there was no evidence that the association between PCOS status and BMPs differed by BMI. These analyses were completed using SAS version 9.4 (SAS Institute Inc., Cary, NC, USA).
Supplementary Materials
The following supporting information can be downloaded at: https://www.mdpi.com/article/10.3390/ijms262110273/s1.
Author Contributions
B.M.L.A. and A.E.B. analyzed the data and wrote the manuscript. T.S. supervised clinical studies and edited the manuscript. L.D. performed statistical analysis and contributed to writing the manuscript. S.L.A. contributed to study design, data interpretation and the writing of the manuscript. A.E.B. is the guarantor of this work. All authors have read and agreed to the published version of the manuscript.
Funding
No funding was received to perform this study.
Institutional Review Board Statement
The study was conducted in accordance with the Declaration of Helsinki, and approved by the Institutional Review Board of the Yorkshire and The Humber NRES ethical committee, UK Committee (reference number 10/H0906/17 and date of approval 6 June 2014).
Informed Consent Statement
Informed consent was obtained from all subjects involved in the study.
Data Availability Statement
All the data for this study will be made available upon reasonable request to the corresponding author.
Conflicts of Interest
No authors have any conflict of interest or competing interests to declare.
References
- Norman, R.J.; Dewailly, D.; Legro, R.S.; Hickey, T.E. Polycystic ovary syndrome. Lancet 2007, 370, 685–697. [Google Scholar] [CrossRef]
- Ollila, M.-M.; Hoek, A.; Piltonen, T.T. The association between polycystic ovary syndrome and early cardiovascular disease morbidity strengthens. Eur. J. Endocrinol. 2023, 189, R4–R5. [Google Scholar] [CrossRef]
- Sathyapalan, T.; Atkin, S.L. Recent advances in cardiovascular aspects of polycystic ovary syndrome. Eur. J. Endocrinol. 2012, 166, 575–583. [Google Scholar] [CrossRef] [PubMed]
- Cena, H.; Chiovato, L.; Nappi, R.E. Obesity, Polycystic Ovary Syndrome, and Infertility: A New Avenue for GLP-1 Receptor Agonists. J. Clin. Endocrinol. Metab. 2020, 105, e2695–e2709. [Google Scholar] [CrossRef]
- Puder, J.J.; Varga, S.; Kraenzlin, M.; De Geyter, C.; Keller, U.; Müller, B. Central fat excess in polycystic ovary syndrome: Relation to low-grade inflammation and insulin resistance. J. Clin. Endocrinol. Metab. 2005, 90, 6014–6021. [Google Scholar] [CrossRef]
- Barber, T.M.; Hanson, P.; Weickert, M.O.; Franks, S. Obesity and Polycystic Ovary Syndrome: Implications for Pathogenesis and Novel Management Strategies. Clin. Med. Insights Reprod. Health 2019, 13, 1179558119874042. [Google Scholar] [CrossRef] [PubMed]
- Dargham, S.R.; Ahmed, L.; Kilpatrick, E.S.; Atkin, S.L. The prevalence and metabolic characteristics of polycystic ovary syndrome in the Qatari population. PLoS ONE 2017, 12, e0181467. [Google Scholar] [CrossRef] [PubMed]
- Good, C.; Tulchinsky, M.; Mauger, D.; Demers, L.M.; Legro, R.S. Bone mineral density and body composition in lean women with polycystic ovary syndrome. Fertil. Steril. 1999, 72, 21–25. [Google Scholar] [CrossRef]
- Mørch, N.F.; Aziz, M.; Svendsen, P.F. Bone mass density in lean and overweight women with polycystic ovary syndrome. Scand. J. Clin. Lab. Investig. 2022, 82, 210–217. [Google Scholar] [CrossRef]
- Schmidt, J.; Dahlgren, E.; Brännström, M.; Landin-Wilhelmsen, K. Body composition, bone mineral density and fractures in late postmenopausal women with polycystic ovary syndrome—A long-term follow-up study. Clin. Endocrinol. 2012, 77, 207–214. [Google Scholar] [CrossRef]
- Rubin, K.H.; Glintborg, D.; Nybo, M.; Andersen, M.; Abrahamsen, B. Fracture Risk Is Decreased in Women With Polycystic Ovary Syndrome: A Register-Based and Population-Based Cohort Study. J. Bone Miner. Res. 2016, 31, 709–717. [Google Scholar] [CrossRef]
- Yang, H.Y.; Lee, H.S.; Huang, W.T.; Chen, M.J.; Chen, S.C.; Hsu, Y.H. Increased risk of fractures in patients with polycystic ovary syndrome: A nationwide population-based retrospective cohort study. J. Bone Miner. Metab. 2018, 36, 741–748. [Google Scholar] [CrossRef]
- Katulski, K.; Slawek, S.; Czyzyk, A.; Podfigurna-Stopa, A.; Paczkowska, K.; Ignaszak, N.; Podkowa, N.; Meczekalski, B. Bone mineral density in women with polycystic ovary syndrome. J. Endocrinol. Investig. 2014, 37, 1219–1224. [Google Scholar] [CrossRef]
- Rissetti, G.; Piovezan, J.M.; Premaor, M.O.; Comim, F.V. Contrasting Bone Profiles in PCOS Are Related to BMI: A Systematic Review and Meta-analysis. J. Clin. Endocrinol. Metab. 2024, 109, e1911–e1921, Erratum in J. Clin. Endocrinol. Metab. 2024, 109, e1987. [Google Scholar] [CrossRef]
- Ganie, M.A.; Chakraborty, S.; Sehgal, A.; Sreejith, M.; Kandasamy, D.; Jana, M.; Rashid, A. Bone Mineral Density is Unaltered in Women with Polycystic Ovary Syndrome. Horm. Metab. Res. 2018, 50, 754–760. [Google Scholar] [CrossRef]
- Adami, S.; Zamberlan, N.; Castello, R.; Tosi, F.; Gatti, D.; Moghetti, P. Effect of hyperandrogenism and menstrual cycle abnormalities on bone mass and bone turnover in young women. Clin. Endocrinol. 1998, 48, 169–173. [Google Scholar] [CrossRef]
- Yüksel, O.; Dökmetaş, H.S.; Topcu, S.; Erselcan, T.; Sencan, M. Relationship between bone mineral density and insulin resistance in polycystic ovary syndrome. J. Bone Miner. Metab. 2001, 19, 257–262. [Google Scholar] [CrossRef] [PubMed]
- Armutcu, F.; McCloskey, E. Insulin resistance, bone health, and fracture risk. Osteoporos. Int. A J. Establ. Result Coop. Between Eur. Found. Osteoporos. Natl. Osteoporos. Found. USA 2024, 35, 1909–1917. [Google Scholar] [CrossRef] [PubMed]
- Kalyan, S.; Patel, M.S.; Kingwell, E.; Côté, H.C.F.; Liu, D.; Prior, J.C. Competing Factors Link to Bone Health in Polycystic Ovary Syndrome: Chronic Low-Grade Inflammation Takes a Toll. Sci. Rep. 2017, 7, 3432. [Google Scholar] [CrossRef] [PubMed]
- Sudhakaran, G.; Priya, P.S.; Jagan, K.; Haridevamuthu, B.; Meenatchi, R.; Arockiaraj, J. Osteoporosis in polycystic ovary syndrome (PCOS) and involved mechanisms. Life Sci. 2023, 335, 122280. [Google Scholar] [CrossRef]
- Kudo, A. Periostin in Bone Biology. Adv. Exp. Med. Biol. 2019, 1132, 43–47. [Google Scholar]
- Kuebart, T.; Oezel, L.; Gürsoy, B.; Maus, U.; Windolf, J.; Bittersohl, B.; Grotheer, V. Periostin Splice Variant Expression in Human Osteoblasts from Osteoporotic Patients and Its Effects on Interleukin-6 and Osteoprotegerin. Int. J. Mol. Sci. 2025, 26, 932. [Google Scholar] [CrossRef]
- Rousseau, J.C.; Sornay-Rendu, E.; Bertholon, C.; Chapurlat, R.; Garnero, P. Serum periostin is associated with fracture risk in postmenopausal women: A 7-year prospective analysis of the OFELY study. J. Clin. Endocrinol. Metab. 2014, 99, 2533–2539. [Google Scholar] [CrossRef] [PubMed]
- Pickering, M.E.; Oris, C.; Chapurlat, R. Periostin in Osteoporosis and Cardiovascular Disease. J. Endocr. Soc. 2023, 7, bvad081. [Google Scholar] [CrossRef] [PubMed]
- Chen, X.; Huo, L.; Ren, L.; Li, Y.; Sun, Y.; Li, Y.; Zhang, P.; Chen, S.; Song, G.-Y. Polycystic Ovary Syndrome Is Associated With Elevated Periostin Levels. Exp. Clin. Endocrinol. Diabetes 2018, 127, 571–577. [Google Scholar] [CrossRef] [PubMed]
- Gonulalan, G.; Guney, I.; Sackan, F.; Acar, S. The Relationship between Polycystic Ovary Syndrome and Serum Periostin Level. J. Coll. Physicians Surg. Pak. 2021, 31, 1291–1295. [Google Scholar] [CrossRef]
- Pečar Fonović, U.; Kos, J.; Mitrović, A. Compensational role between cathepsins. Biochimie 2024, 226, 62–76. [Google Scholar] [CrossRef]
- Kakegawa, H.; Nikawa, T.; Tagami, K.; Kamioka, H.; Sumitani, K.; Kawata, T.; Drobnic-Kosorok, M.; Lenarcic, B.; Turk, V.; Katunuma, N. Participation of cathepsin L on bone resorption. FEBS Lett. 1993, 321, 247–250. [Google Scholar] [CrossRef]
- Lang, T.; Willinger, U.; Holzer, G. Soluble cathepsin-L: A marker of bone resorption and bone density? J. Lab. Clin. Med. 2004, 144, 163–166. [Google Scholar] [CrossRef]
- Cookingham, L.M.; Voorhis, B.J.V.; Ascoli, M. Do Alterations in Follicular Fluid Proteases Contribute to Human Infertility? J. Assist. Reprod. Genet. 2015, 32, 737–745. [Google Scholar] [CrossRef][Green Version]
- Komori, T. What is the function of osteocalcin? J. Oral Biosci. 2020, 62, 223–227. [Google Scholar] [CrossRef]
- Mizokami, A.; Kawakubo-Yasukochi, T.; Hirata, M. Osteocalcin and its endocrine functions. Biochem. Pharmacol. 2017, 132, 1–8. [Google Scholar] [CrossRef]
- Rossi, M.; Battafarano, G.; Pepe, J.; Minisola, S.; Del Fattore, A. The endocrine function of osteocalcin regulated by bone resorption: A lesson from reduced and increased bone mass diseases. Int. J. Mol. Sci. 2019, 20, 4502. [Google Scholar] [CrossRef] [PubMed]
- Piovezan, J.M.; Premaor, M.O.; Comim, F.V. Negative impact of polycystic ovary syndrome on bone health: A systematic review and meta-analysis. Hum. Reprod. Update 2019, 25, 633–645. [Google Scholar] [CrossRef] [PubMed]
- Zhang, F.; Zhao, Y.; He, Q.; Schneider, L.; Zhang, J.; Wan, C. Lysosomal cathepsin D regulates bone turnover through distinct mode of actions of the autophagy pathways in osteoblasts and osteoclasts. bioRxiv 2025. bioRxiv:2025.04.09.645406. [Google Scholar] [CrossRef]
- Amjadi, F.; Mehdizadeh, M.; Ashrafi, M.; Nasrabadi, D.; Taleahmad, S.; Mirzaei, M.; Gupta, V.; Salekdeh, G.H.; Aflatoonian, R. Distinct changes in the proteome profile of endometrial tissues in polycystic ovary syndrome compared with healthy fertile women. Reprod. Biomed. Online 2018, 37, 184–200. [Google Scholar] [CrossRef]
- Jin, M.; Cai, J.; Hu, Y.J.; Lu, X.E.; Huang, H.F. Cathepsin D expression in ovaries from polycystic ovarian syndrome patients. Zhejiang Da Xue Xue Bao Yi Xue Ban 2007, 36, 429–432. [Google Scholar]
- Grewe, J.M.; Knapstein, P.-R.; Donat, A.; Jiang, S.; Smit, D.J.; Xie, W.; Keller, J. The role of sphingosine-1-phosphate in bone remodeling and osteoporosis. Bone Res. 2022, 10, 34. [Google Scholar] [CrossRef]
- Ishii, M.; Egen, J.G.; Klauschen, F.; Meier-Schellersheim, M.; Saeki, Y.; Vacher, J.; Proia, R.L.; Germain, R.N. Sphingosine-1-phosphate mobilizes osteoclast precursors and regulates bone homeostasis. Nature 2009, 458, 524–528, Erratum in Nature 2010, 465, 966. [Google Scholar] [CrossRef]
- Millest, A.; Breen, S.; Loveday, B.; Clarkson, P.; Simpson, C.; Waterton, J.; Johnstone, D. Effects of an inhibitor of cathepsin L on bone resorption in thyroparathyroidectomized and ovariectomized rats. Bone 1997, 20, 465–471. [Google Scholar] [CrossRef]
- Dera, A.A.; Ranganath, L.; Barraclough, R.; Vinjamuri, S.; Hamill, S.; Barraclough, D.L. Cathepsin Z as a novel potential biomarker for osteoporosis. Sci. Rep. 2019, 9, 9752. [Google Scholar] [CrossRef]
- Butler, A.E.; Moin, A.S.M.; Sathyapalan, T.; Atkin, S.L. Components of the Complement Cascade Differ in Polycystic Ovary Syndrome. Int. J. Mol. Sci. 2022, 23, 12232. [Google Scholar] [CrossRef]
- Sathyapalan, T.; Al-Qaissi, A.; Kilpatrick, E.S.; Dargham, S.R.; Atkin, S.L. Anti-Mullerian hormone measurement for the diagnosis of polycystic ovary syndrome. Clin. Endocrinol. 2017, 88, 258–262. [Google Scholar] [CrossRef]
- Sathyapalan, T.; Al-Qaissi, A.; Kilpatrick, E.S.; Dargham, S.R.; Adaway, J.; Keevil, B.; Atkin, S.L. Salivary testosterone measurement in women with and without polycystic ovary syndrome. Sci. Rep. 2017, 7, 3589. [Google Scholar] [CrossRef]
- Moin, A.S.M.; Sathyapalan, T.; Butler, A.E.; Atkin, S.L. Classical and alternate complement factor overexpression in non-obese weight matched women with polycystic ovary syndrome does not correlate with vitamin D. Front. Endocrinol. 2022, 13, 935750. [Google Scholar] [CrossRef]
- Cunningham, T.K.; Allgar, V.; Dargham, S.R.; Kilpatrick, E.; Sathyapalan, T.; Maguiness, S.; Rudin, H.R.M.; Ghani, N.M.A.; Latiff, A.; Atkin, S.L. Association of Vitamin D Metabolites with Embryo Development and Fertilization in Women with and Without PCOS Undergoing Subfertility Treatment. Front. Endocrinol. 2019, 10, 13. [Google Scholar] [CrossRef]
- Kahal, H.; Halama, A.; Aburima, A.; Bhagwat, A.M.; Butler, A.E.; Grauman, J.; Suhre, K.; Sathyapalan, T.; Atkin, S.L. Effect of induced hypoglycemia on inflammation and oxidative stress in type 2 diabetes and control subjects. Sci. Rep. 2020, 10, 10233, Erratum in Sci. Rep. 2020, 10, 4750. [Google Scholar] [CrossRef]
- Kraemer, S.; Vaught, J.D.; Bock, C.; Gold, L.; Katilius, E.; Keeney, T.R.; Kim, N.; A Saccomano, N.; Wilcox, S.K.; Zichi, D.; et al. From SOMAmer-based biomarker discovery to diagnostic and clinical applications: A SOMAmer-based, streamlined multiplex proteomic assay. PLoS ONE 2011, 6, e26332. [Google Scholar] [CrossRef]
- Dincel, A.S.; Jørgensen, N.R. New Emerging Biomarkers for Bone Disease: Sclerostin and Dickkopf-1 (DKK1). Calcif. Tissue Int. 2023, 112, 243–257. [Google Scholar] [CrossRef]
- Lingaiah, S.; Morin-Papunen, L.; Piltonen, T.; Puurunen, J.; Sundström-Poromaa, I.; Stener-Victorin, E.; Bloigu, R.; Risteli, J.; Tapanainen, J.S. Bone markers in polycystic ovary syndrome: A multicentre study. Clin. Endocrinol. 2017, 87, 673–679. [Google Scholar] [CrossRef]
- Fasanya, H.O.; Siemann, D.W. The role of cathepsins in the growth of primary and secondary neoplasia in the bone. Osteology 2020, 1, 3–28. [Google Scholar] [CrossRef]
Disclaimer/Publisher’s Note: The statements, opinions and data contained in all publications are solely those of the individual author(s) and contributor(s) and not of MDPI and/or the editor(s). MDPI and/or the editor(s) disclaim responsibility for any injury to people or property resulting from any ideas, methods, instructions or products referred to in the content. |
© 2025 by the authors. Licensee MDPI, Basel, Switzerland. This article is an open access article distributed under the terms and conditions of the Creative Commons Attribution (CC BY) license (https://creativecommons.org/licenses/by/4.0/).