Article

Jumping Translocation Breakpoint Expression in Midgestation Mouse Embryos

1
Department of Biology, Clarkson University, Potsdam, NY 13699, USA
2
Biochemistry & Proteomics Laboratories, Department of Chemistry & Biochemistry, Clarkson University, Potsdam, NY 13699, USA
3
Laboratory of Animal Histology, Faculty of Biology, “Alexandru Ioan Cuza” University of Iași, Carol I bvd. 20A, 700505 Iasi, Romania
*
Author to whom correspondence should be addressed.
These authors contributed equally to this work.
Int. J. Mol. Sci. 2025, 26(20), 9952; https://doi.org/10.3390/ijms26209952 (registering DOI)
Submission received: 7 September 2025 / Revised: 4 October 2025 / Accepted: 9 October 2025 / Published: 13 October 2025
(This article belongs to the Section Macromolecules)

Abstract

Jumping translocations (JTs) can lead to partial trisomies. A breakpoint within the gene known as Jumping Translocation Breakpoint (JTB) has previously been associated with JTs involving the long arm of human chromosome 1 (1q). These 1q+ amplifications are frequently observed in cancer. JTB was initially mapped to the Epidermal Differentiation Complex (EDC) at 1q21, and earlier studies primarily focused on its role in malignant or adult tissues. Using updated genomic data, we refined the mapping of JTB. We employed RNA in situ hybridization (RISH) to visualize Jtb expression with organ, tissue, and cell-level resolution. We demonstrate that human JTB and murine Jtb are located outside the EDC. In midgestational wild-type mouse embryos, Jtb is expressed in multiple tissues, including the developing heart and vertebral column, and shows partial overlap with the expression of early markers of the neural crest cell lineage. Our findings suggest that the oncogenic potential associated with human JTB translocations is likely unrelated to its previously assumed location within the EDC.

1. Introduction

Jumping translocations (JTs) are a type of aberrant genomic rearrangement. Chromosome 1 JTs have been found to fuse with the telomeric repeats of recipient chromosomes, potentially resulting in partial trisomies of the 1q arm (1q+). They are frequently observed in myeloma and various other cancers, including breast and prostate cancer, as thoroughly reviewed elsewhere [1,2,3]. A breakpoint was identified between exons 4 and 5 of the gene Jumping Translocation Breakpoint (JTB), located on human chromosome 1 [3,4]. JTB encodes a highly conserved 146 amino acid transmembrane protein, comprising a signal peptide, an extracellular portion and a cytoplasmic domain [1]. JTs involving the JTB gene can result in the production of a truncated JTB protein that lacks the transmembrane domain, possibly impacting its biological function and contributing to pathological processes [3]. Genomic alterations involving the gain or amplification of 1q21 (1q21+) were frequently linked to the dysregulation of oncogenes and associated with different cancers [3,5,6]. JTB is evolutionarily conserved across diverse eukaryotic species (UniProt ID: O76095) [3,7,8]. A conserved gene structure of JTB orthologs has been identified in several primate species (UniProt ID: O76095) [1]. However, despite JTB being discovered over 25 years ago [3], very little is known about its biological function.
JTB has been identified as a transforming growth factor beta-1 (TGFβ1)-inducible gene [9]. TGFβ1 is a cytokine known to suppress tumor formation in some contexts and promote tumor progression in others [10]. JTB’s exact roles in neoplastic mechanisms still requires further investigations, as it can be found either upregulated or downregulated depending on the type of malignancy [11]. JTB is functionally associated with the chromosomal passenger proteins/complex (CPP/CPC), key regulators of mitosis [1,12]. JTB, also known as the prostate androgen-regulated (PAR) gene, was previously identified as a target of the androgen receptor (AR) signaling pathway, based on physiological and functional evidence such as dihydrotestosterone-induced expression changes in androgen-sensitive human prostate adenocarcinoma cells (LNCaP) and the restoration of androgen responsiveness following AR reintroduction in the human androgen-independent prostate cancer cell line (PC3) [13]. However, the study did not provide direct molecular evidence of a physical interaction between PAR and AR, such as ligand binding, receptor mimicry, or AR binding to the PAR gene. Rather than functioning as an AR itself, the findings suggested that PAR acts as a downstream target of AR signaling. Currently, there is no indication that PAR binds androgens, mimics receptor activity, or shares structural similarities with the AR protein.
The genomic proximity of JTB to the gene encoding cyclic AMP-responsive element-binding protein 3-like protein 4 (CREB3L4) [14], another AR-regulated gene involved in cell proliferation and endoplasmic reticulum (ER) stress response [15], supports the hypothesis that CREB3L4 and JTB may be co-regulated by AR and potentially contribute to tumor progression. This is particularly relevant in androgen-responsive cancers, such as prostate cancer and the luminal androgen receptor (LAR) subtype of triple-negative breast cancer (TNBC) [15]. Given their shared regulation by AR, both JTB and CREB3L4 may represent potential molecular targets or biomarkers in AR-driven malignancies. In prostate cancer, CREB3L4 plays a critical role in promoting cell proliferation and is functionally linked to AR-regulated oncogenic pathways [14]. It belongs to the old astrocyte specifically induced substance (OASIS) transcription factor family and has been shown to be upregulated by androgen stimulation in prostate cancer cells [16]. Emerging evidence suggests that CREB3L4 contributes to prostate cancer progression not only by enhancing cell proliferation, but also by influencing differentiation and survival pathways. These findings underscore the relevance of CREB3L4 as a potential biomarker or therapeutic target, particularly in hormone-resistant prostate cancer, where AR signaling remains active despite hormonal therapy.
In parallel, the Bcl2 apoptosis regulator (Bcl-2) and Bcl-2-associated X protein (Bax), which, respectively, inhibit and promote apoptosis, regulate programmed cell death through their relative expression levels [17]. The Bax/Bcl-2 ratio is therefore a key determinant of cell survival versus cell death. Downregulation of PAR expression increased the Bax/Bcl-2 ratio and Bax levels, thereby inducing G2/M phase arrest and apoptosis in PC3 prostate cancer cells. This supports PAR’s role in promoting the malignant phenotype of androgen-independent prostate cancer cells [2,12,13]. Consequently, JTB may also impact cell proliferation and cell cycle regulation, thereby contributing to tumorigenicity [1]. JTB is currently investigated as a potential biomarker in several cancer types, including hematologic malignancies, breast cancer and prostate cancer [1,2,8,13].
Based on previous mapping using sequence-tagged sites derived from a yeast artificial chromosome (YAC) clone mapped to human chromosome 1q21, JTB was initially placed within a ~2 Mb region known as the epidermal differentiation complex (EDC) on human chromosome 1q21.3–23.3 [3]. The human EDC contains a cluster of 62 genes belonging primarily to three major gene families involved in epidermal differentiation, contributing to the formation of the stratum corneum and enabling the skin’s barrier function [4,18]. Gene arrangements within the EDC are conserved and play important roles in the regulation of gene expression [19]. For example, loricrin (LOR) is a single coding exon EDC (SEDC) gene located within the complex, while members of the S100A gene family form the outer borders of the EDC [19]. Aberrant epigenetic modifications and altered expression of EDC genes, particularly S100 genes, frequently contribute to various epithelial tumors [20,21]. Although YACs were valuable tools at the time, YAC chimerism could complicate genomic mapping. Advances in omics technologies have since improved physical maps and clarified synteny relationships between human and mouse chromosomes [22]. Here, we used updated genomic information provided by the National Center for Biotechnology Information (NCBI) and the National Institutes of Health (NIH) to determine the refined genomic location of JTB on human chromosome 1 and Mus musculus Jtb on mouse chromosome 3.
Developmental signaling pathways can be reactivated in cancer cells to promote their own survival, rapid proliferation, immune evasion, and cellular plasticity. Cancer cells can undergo an epithelial-to-mesenchymal transition (EMT), a process used by migratory cells during embryonic development, which enables cancer cells to metastasize. To date, JTB studies have largely focused on adult tissues, tumor samples and in vitro cell lines. Interestingly, Northern blot and proteomic analyses have shown JTB expression in multiple adult tissues, with upregulation sometimes observed in malignant compared to normal tissues [2,3,23,24]. The mouse embryo is a well-established model organism for studying early signaling events [25].
Based on updated genomic information, we designed probes and conducted RISH on sections of wild-type midgestation mouse embryos to complement earlier JTB Northern and dot blot studies of adult human tissues and cell lines [2,3]. Midgestation embryos (E11.5 to E13.5) were chosen because this developmental window provides a blueprint for all major organs while still involving significant embryonic growth, during which many tissues undergo further differentiation and maturation. We confirmed widespread Jtb expression observed in previous RNA blotting techniques, now with cellular resolution not previously reported, and mapped Jtb expression in the context of the EDC and migratory cell markers.

2. Results and Discussion

2.1. Revised Genomic Location of Human JTB and Murine Jtb in the Context of the EDC

The human JTB gene, also known as PAR, is located on human chromosome 1q21–23. Until now, JTB was reported to be situated within the EDC, and this EDC/JTB association was considered a potential contributor to tumorigenicity [3]. Our refined mapping, based on recent releases of the human (GRCh38.p14 (Build 37.2)) and murine (GRCm39 (Build 37.2)) reference genomes from NCBI, placed JTB/Jtb outside the EDC, which is delimited by S100A genes on both sides [3,19] (Figure 1A). Ideally, this revised mapping would be confirmed by super-resolution RNA fluorescence in situ hybridization (RNA-FISH) on human chromosome 1 and/or mouse chromosome 3; however, this is currently beyond our technical capabilities. The EDC plays a complex role in cell differentiation and epidermal development, requiring calcium-dependent protein cross-linking [19,21,26]. Genes within the EDC encode both structural and regulatory proteins crucial for the terminal differentiation of keratinocytes and for defining stratum corneum properties in mammals, reptiles, and birds [19]. S100A genes, which belong to the helix-loop-helix EF-hand motif gene family, encode proteins involved in calcium binding and facilitate crosslinking during the formation of the cornified envelope. They also participate in cell differentiation and cell cycle progression [19,27]. Loricrin (LOR, Lor), situated within the EDC, encodes a cornified envelope protein found in differentiated epidermal cells [3]. The new placement of JTB/Jtb outside the EDC requires a reassessment of the previously proposed correlation between the EDC, JTB, and cancer. We further used information from NCBI, combined with AlphaFold, to compare the predicted structures of human JTB and murine Jtb proteins. This analysis revealed several mostly conserved amino acid differences between the two species within the transmembrane domain (Figure 1B).
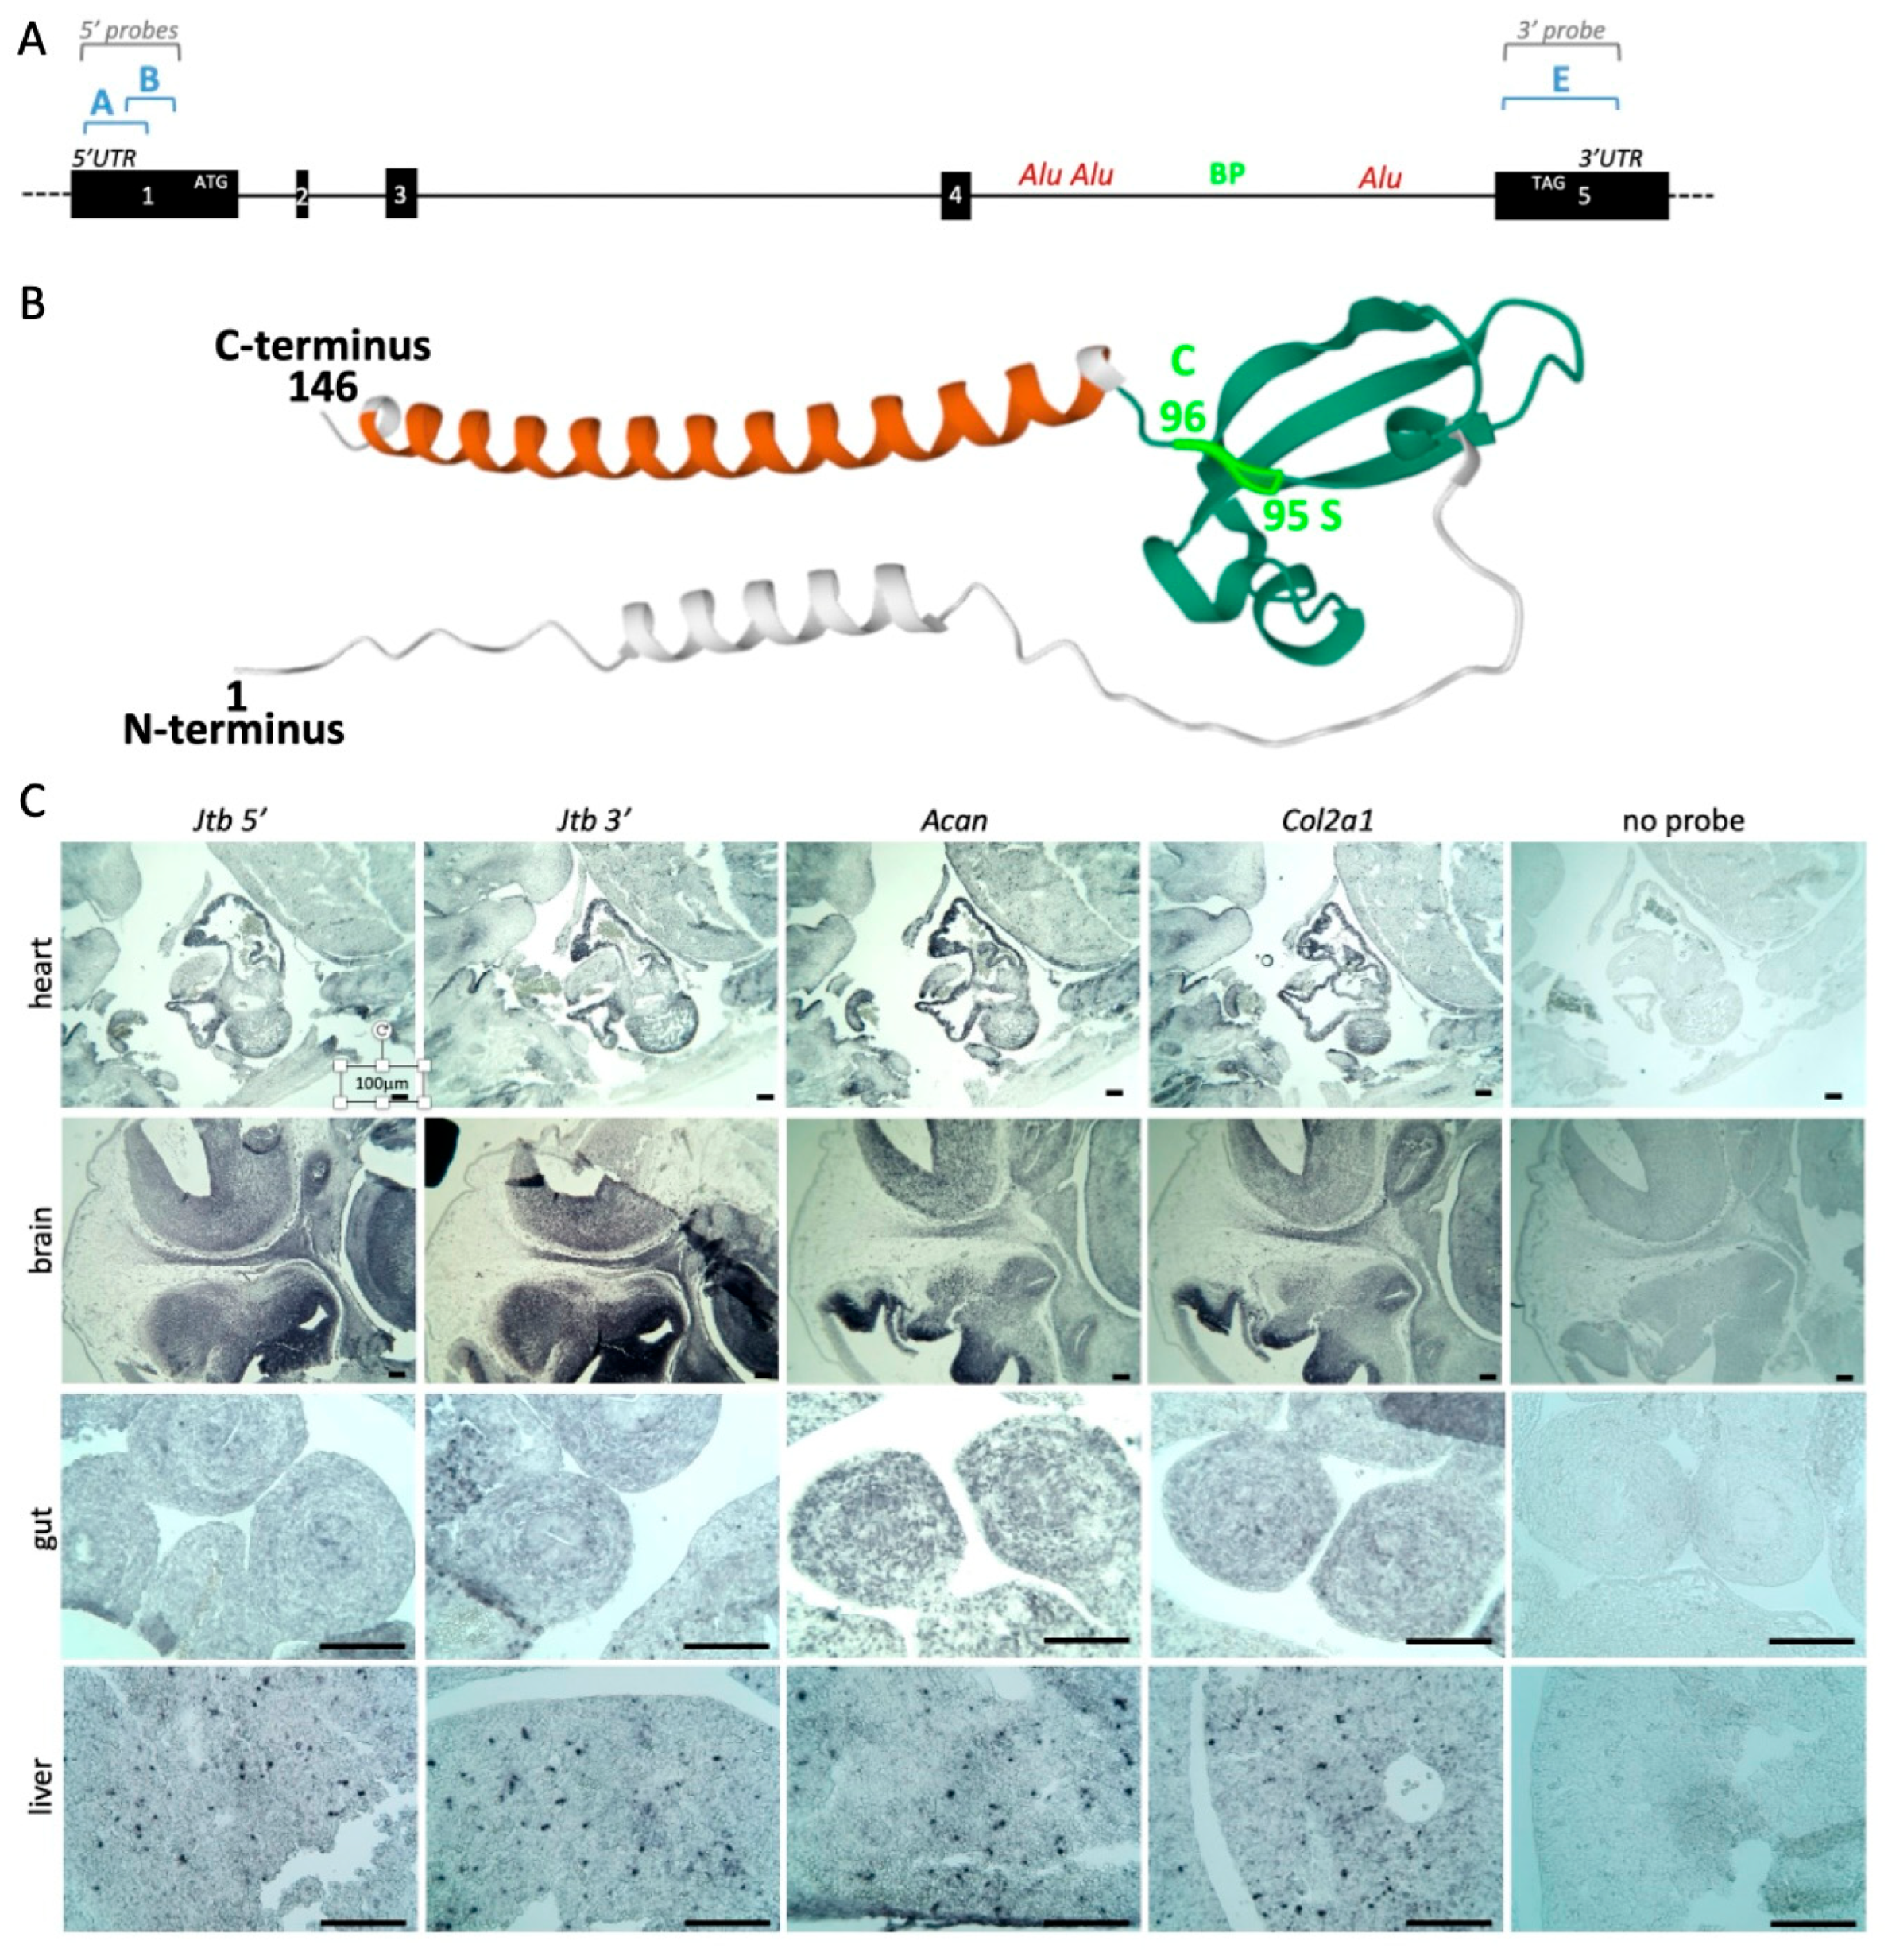
Advances in cancer and developmental biology have highlighted striking parallels between early embryonic development and tumorigenesis, including similarities in gene expression, proteomic profiles, and cell invasiveness [26]. Surprisingly, the role of Jtb in embryonic development has remained largely unexplored. Using the updated genomic data, we designed RISH probes to explore Jtb expression in embryonic tissues (Figure 2A, Table 1). Probes were designed to target regions upstream (5′) and downstream (3′) of the previously reported breakpoint located between Alu repeats in intron4 [3]. We also used information from AB016490.1 (NCBI) and structural predictions from AlphaFold to align this breakpoint with amino acid 95 serine (encoded by exon4) and amino acid 96 cysteine (encoded by exon5) (Figure 2B). Additionally, we generated probes for EDC genes and for Rab13, a member of the RAS oncogene family. RAB13 encodes a small GTPase involved in membrane trafficking and the regulation of epithelial apical junctions [28,29]. Despite multiple attempts, we were unable to define primers that would uniquely amplify Creb3l4 for RISH probe generation. EDC genes, together with CREB3L4 and RAB13, flank JTB on either side (Figure 1A). In humans, RAB13 is located telomeric to JTB (towards the q-arm end of chromosome 1), while in mice, Rab13 lies on the centromeric side of Jtb on acrocentric chromosome 3 (Figure 1). This positional difference could influence the outcome of a 1q+ jumping translocation, potentially leading to additional copies of RAS oncogene family member RAB13 in humans, but not in mice.
In an initial RISH screen on sagittal sections of E12.5 wild-type mouse embryos, we compared Jtb expression with that of extracellular matrix (ECM) markers such as aggrecan (Acan) and collagen type II alpha 1 (Col2a1) (Figure 2C). The ECM provides structural support and organization to all tissues, including tumors, and plays a crucial role in tumor development and progression [30]. We observed overlapping Jtb expression with these ECM markers in several tissues, including the heart and gut, as well as punctate cellular expression in the liver. In the E12.5 brain, Jtb expression was more widespread compared to the ECM markers. Alkaline phosphatase (AP) reporter activity was not detected in the no-probe control sections (Figure 2C). Expression of the 5′ and 3′ Jtb probes appeared similar at E12.5. While serial sections were used whenever possible, it should be noted that this is a qualitative expression analysis, and differences in staining intensity between probes are more likely due to differences in probe length and A/T content than in transcript abundance.

2.2. Jtb Is Present in Many Crucial Tissues During Mouse Embryonic Development

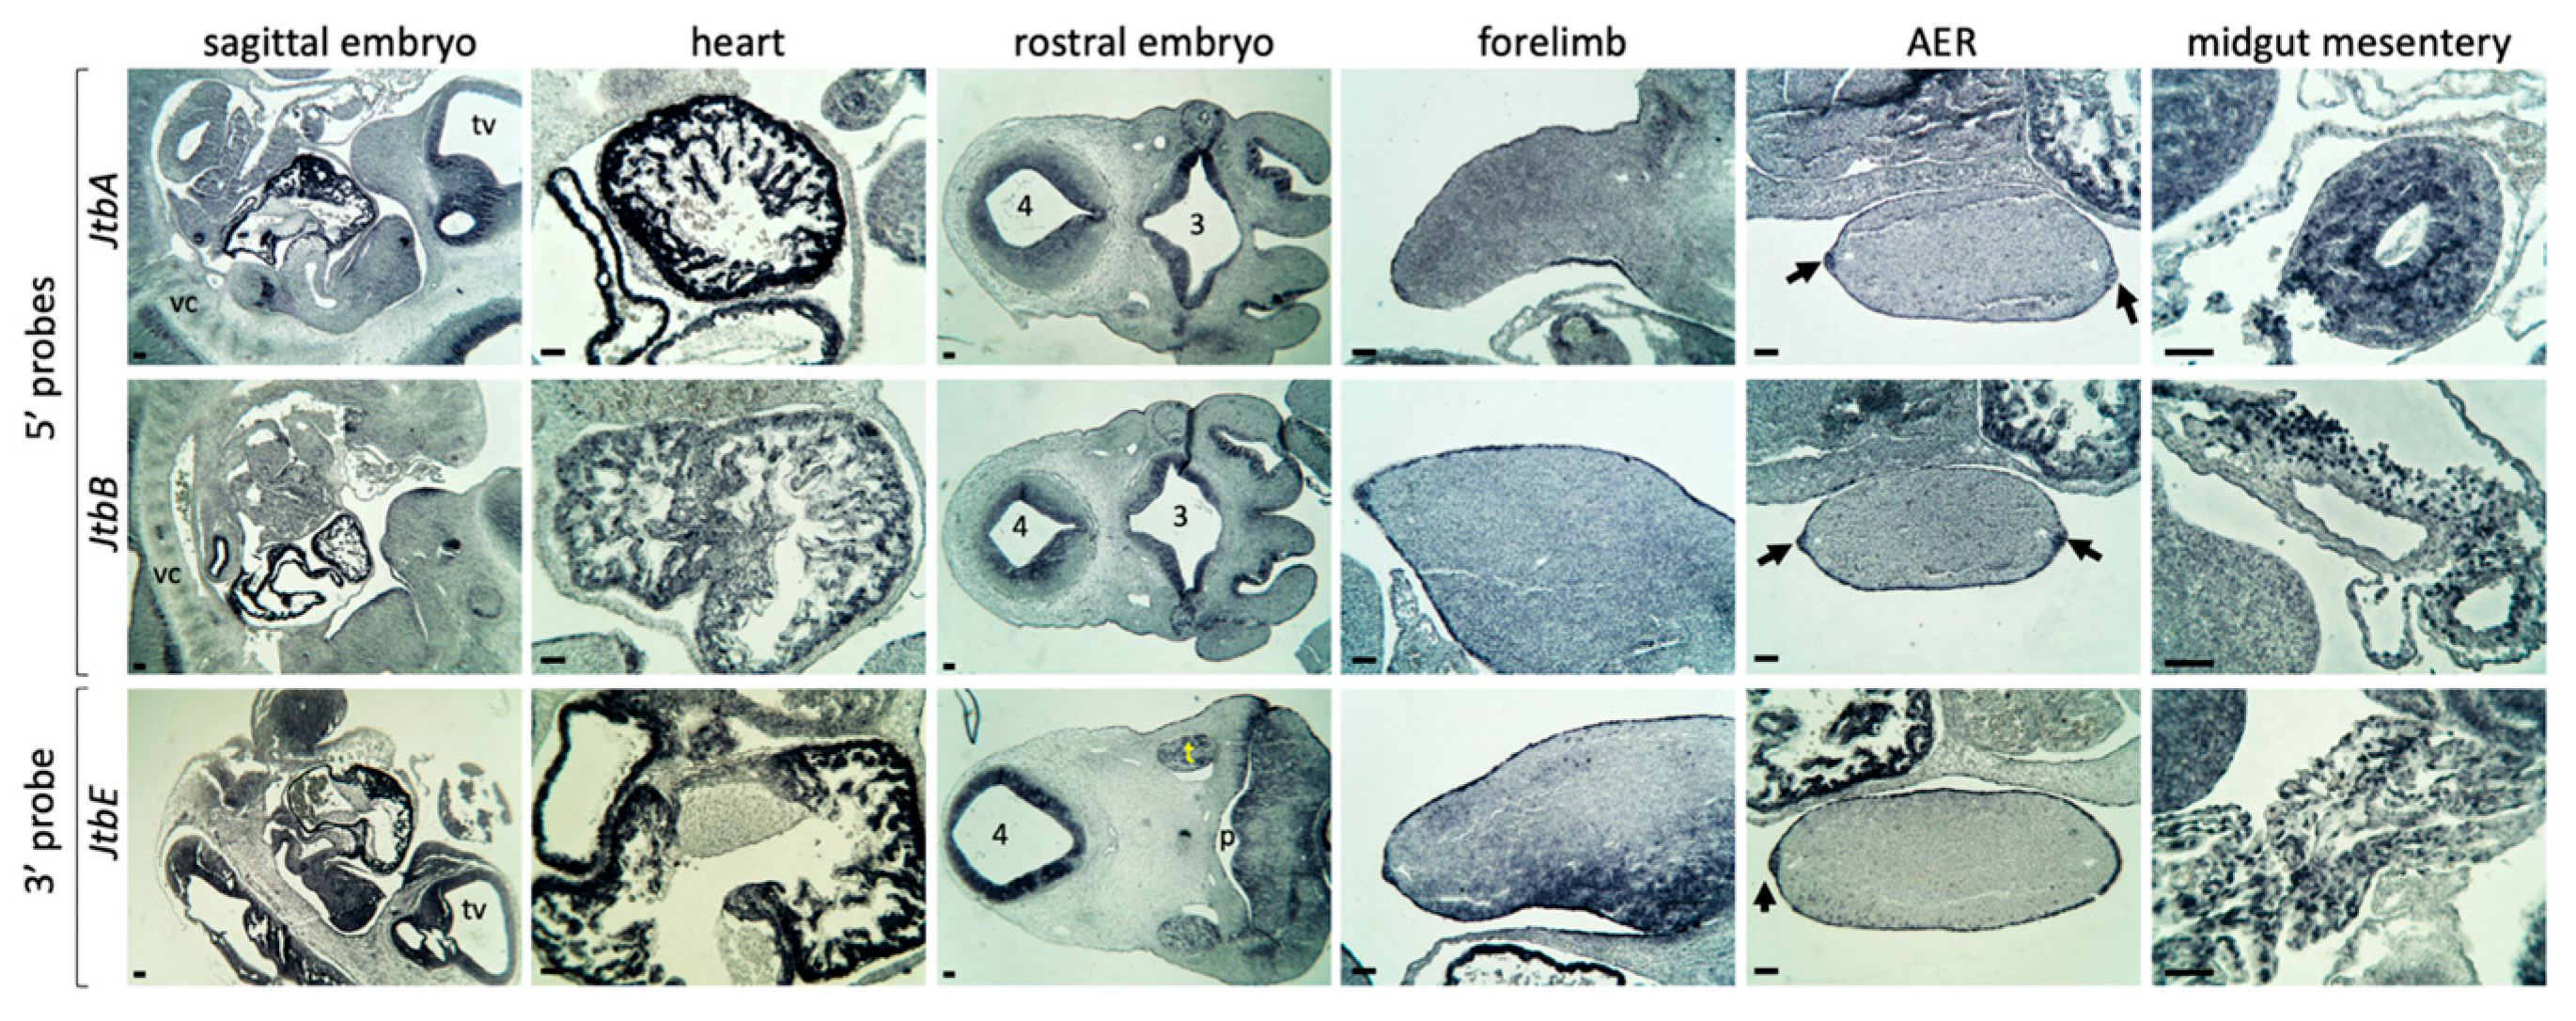
We extended our analysis to E11.5 wild-type embryos (Figure 3) and observed consistent Jtb expression in the heart wall and trabeculae carneae. Expression of JTB in heart tissue has previously been reported in adult samples by Northern blot [3]. We also noted Jtb expression in the developing nervous system, vertebral column and limb, particularly in the limb ectoderm and the apical ectodermal ridge (AER), a transient signaling center at this stage of embryonic development (indicated by arrows in Figure 3). In addition, we observed Jtb expression in cells of the developing lung, kidneys, and liver (Figure 3 and Figure 4). Expression was also seen in cross-sections of the midgut and in cells of the midgut mesentery at E11.5 (Figure 3).
The midgut mesentery, now considered an organ of mesodermal origin, is composed of connective tissue. Its associated cells include surface mesothelial cells, mesenchymal cells that give rise to connective tissue, and migrating enteric neural crest cells [31,32,33]. Our probe design enables detection of transcripts potentially affected by a Jtb jumping translocation (Figure 2 and Supplementary Material). However, the overall expression patterns of probes targeting upstream (5′) and downstream (3′) regions of the breakpoint in intron 4 appeared qualitatively similar, with comparable spatial distribution in the tissues examined. This suggests the absence of a jumping translocation in a wild-type mouse embryo. It is important to note that this assay does not allow for quantitative comparison between probes. The apparently stronger signal from JtbE probe likely reflects differences in probe length and A/T content, rather than actual transcript abundance. Future quantitative analysis, such as RT-PCR, could provide further insights.

2.3. Jtb Neighbors

We compared the expression of Jtb with that of its chromosomal neighbors using serial sagittal sections of E13.5 wild-type embryos, including genes within the EDC, such as S100a1, Lor and S100a10, as well as Rab13 (Figure 1A and Figure 4). All probes showed expression in the developing skin, as seen in the genital tubercle, tail region, and lower lip. While Jtb expression in cells of the midgut mesentery was less prominent than at E11.5, its expression in the heart remained strong. Among the EDC genes, expression in midgut mesentery cells was only evident for S100a1. This may be related to probe characteristics, although the probe length for S100a1 was similar to that of Lor, for which no obvious expression was observed (Figure 4). In the bronchi of the lungs and in the esophagus, Jtb expression was again the most prominent, though expression of S100 genes, Lor, and Rab13 was also detected. In the developing kidney, Jtb expression was strongest in the medullary region of the metanephros and the surrounding connective tissue, while S100a1 appeared most prominent in the kidney cortex. All probes showed punctuated expression in individual liver cells (Figure 4). Although overlaps in expression with Jtb and neighboring genes exist, Jtb also showed distinct expression features. RISH probes were specific for their targets, as confirmed by searches using the Basic Local Alignment Search Tool (BLAST) nucleotide suite (blastn) from NCBI (https://blast.ncbi.nlm.nih.gov/Blast.cgi?PAGE=Nucleotides, accessed on 30 September 2025) (Supplementary Material). Overlapping expression patterns may reflect broad regional epigenetic transcription control.
Also noteworthy is the previously mentioned genomic proximity between JTB/Jtb and RAB13/Rab13, particularly on human chromosome 1. Given the orientation of JTB, a jumping translocation involving its breakpoint in intron 4 could lead to amplification of the RAS oncogene family member RAB13. This may represent an additional contributor to the reported association between JTB and malignancy.

2.4. Jtb Expression in the Context of Migratory Cell Markers

Given the broad tissue and organ distribution of Jtb transcripts during midgestation embryonic development, a potential association with multipotent migratory cells is conceivable. Such an affiliation could offer valuable insights into the observed association between JTB and various human tumor types.
Mesenchymal-to-epithelial transition (MET) is a fundamental process during embryonic development and organogenesis, including somite and heart formation. Its reverse, the epithelial-to-mesenchymal transition (EMT), also plays critical roles in development and tumorigenesis by promoting cell migration and enhancing the invasive potential of malignant cells [34,35]. Neural crest (NC) cells, multipotent progenitors with pleiotropic roles and contributions to multiple tissues, undergo both EMT and MET during development [36]. Here, we explored a potential overlap between Jtb expression and that of markers associated with migratory cells of the NC cell lineage [37].
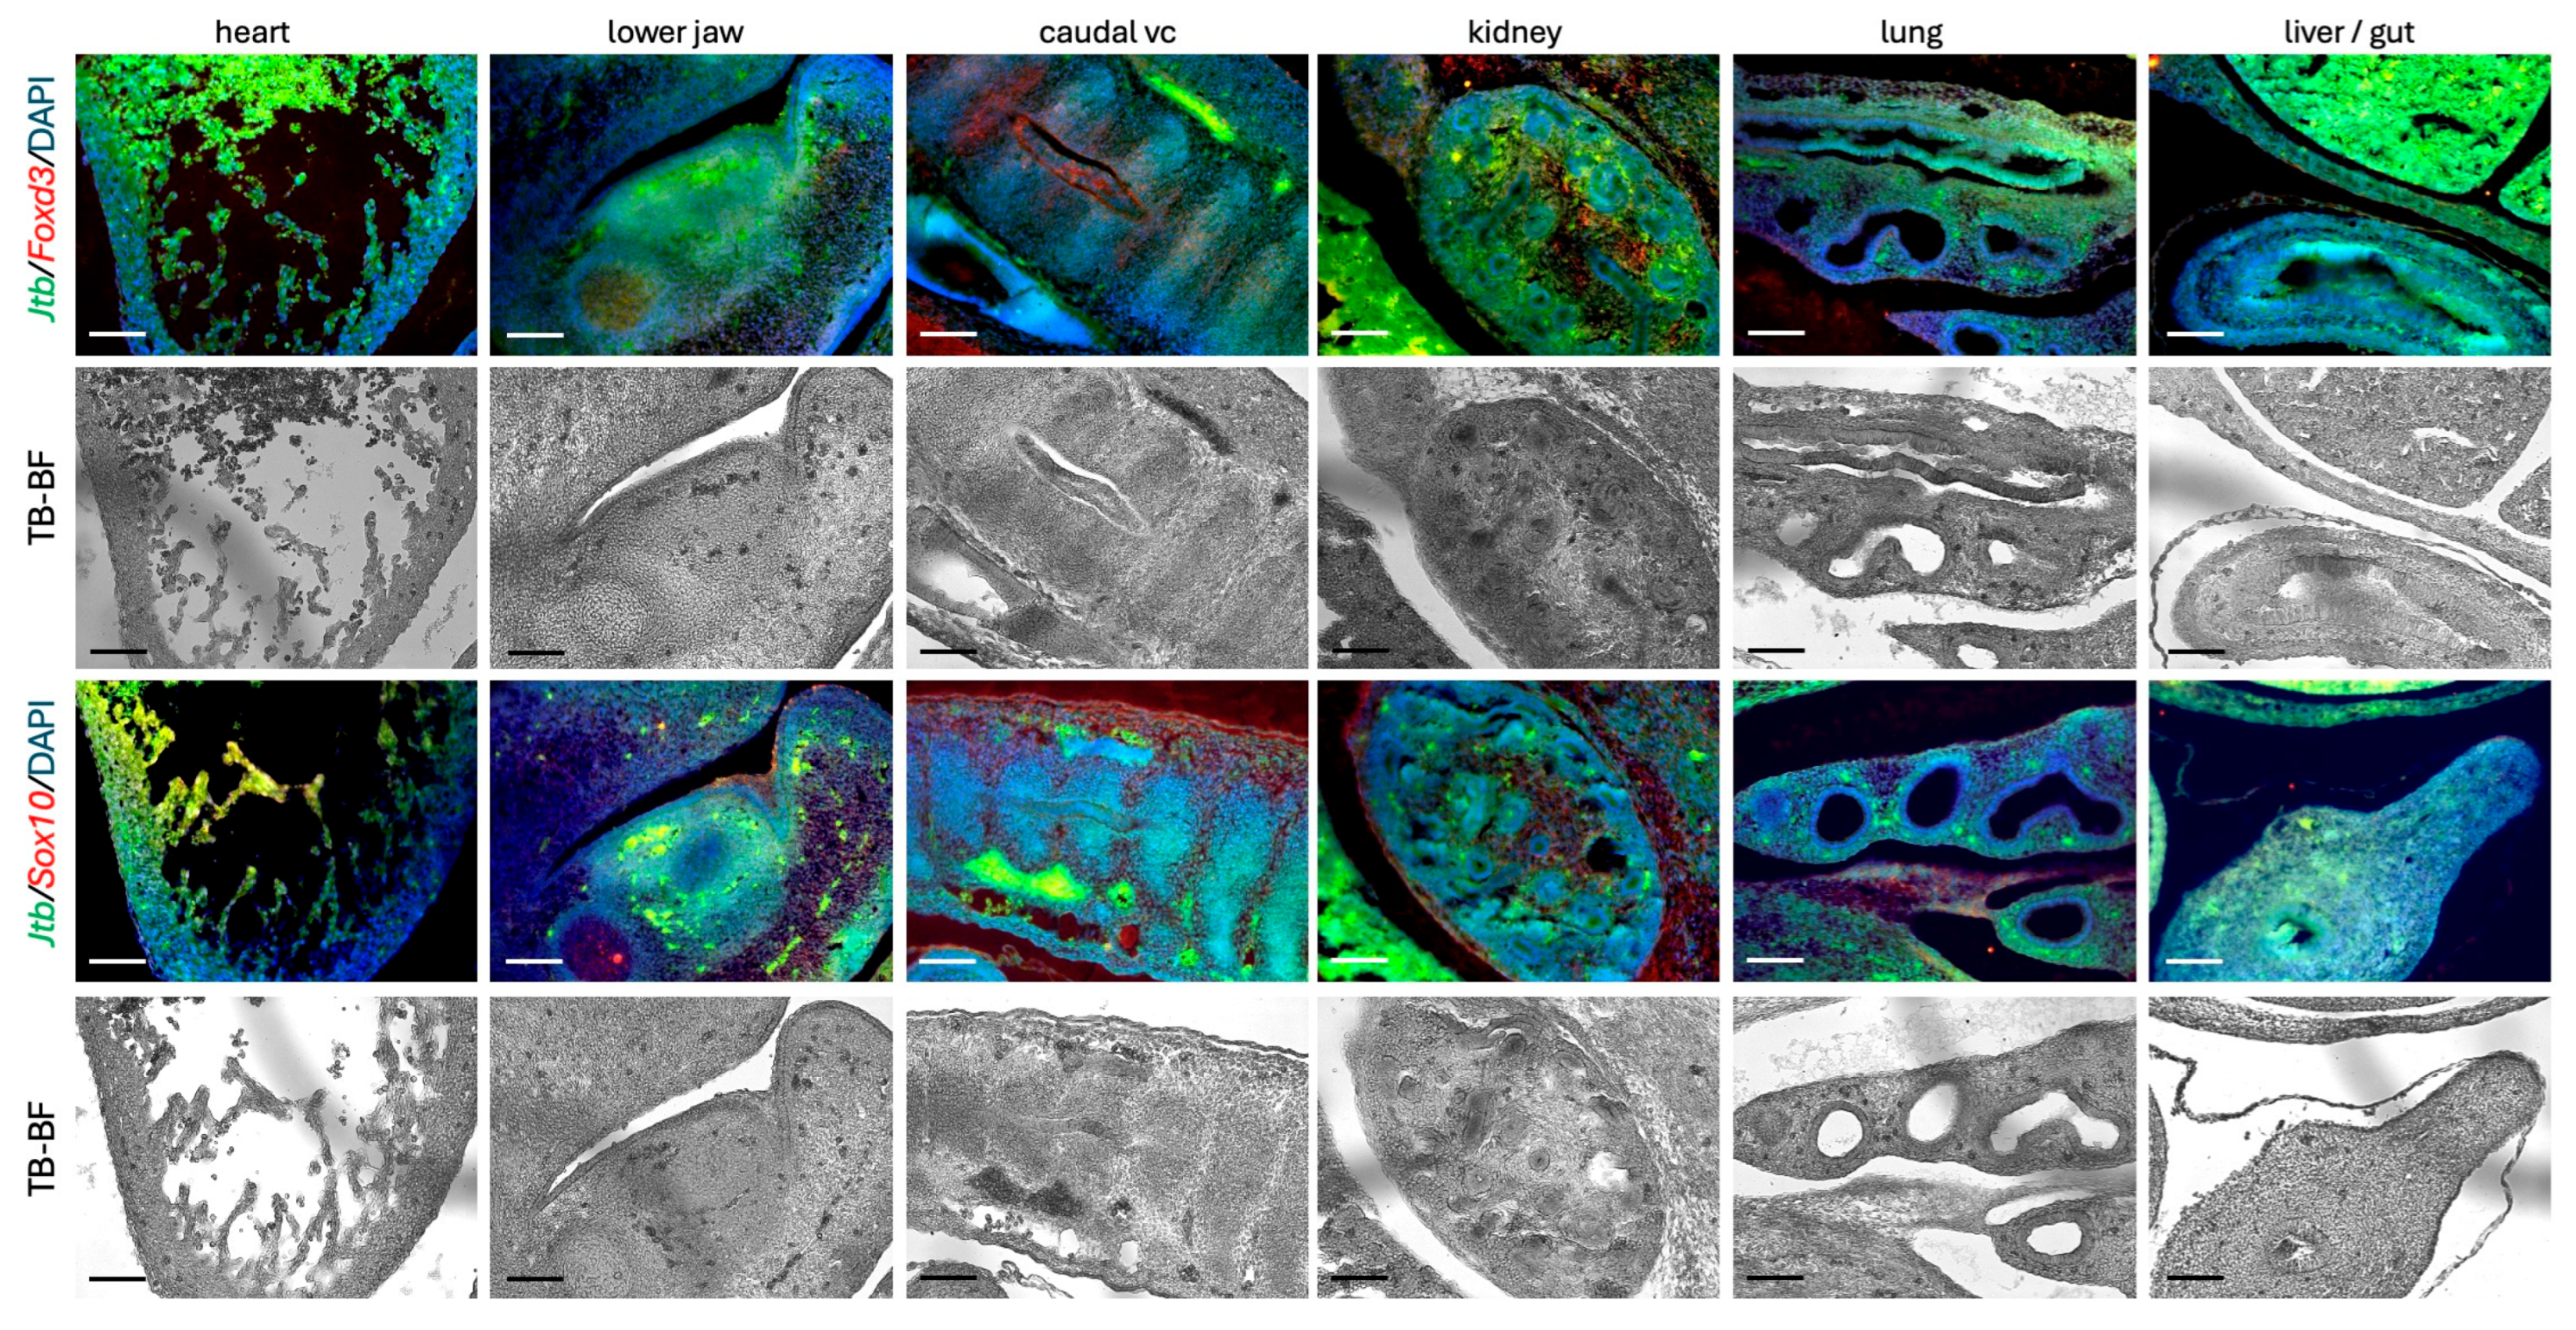
Two such NC lineage markers are the transcription factors Sox10, a SRY-box protein and NC tumor marker, and FoxD3, a forkhead-box protein and tumor suppressor. Both are key players within the NC gene regulatory network, controlling processes such as cell survival, migration, maintenance of pluripotency, EMT, and lineage commitment [37,38,39]. We also examined Nkx2.5, a homeobox-containing transcription factor (also known as Tinman in Drosophila), which is expressed in mesodermal and cardiac progenitor cells. While critical for heart development, it is not typically associated with the cardiac NC lineage [40,41]. In E13.5 wild-type embryos, we observed significant partial overlap between Jtb expression and these markers in several regions, including the heart, kidney, forming skin of the lower lip/jaw area, and neural tube. In the mesenchymal condensation and adjacent brain tissue in the embryonic head, the generally stronger Jtb 3′ probe signal most closely resembled the expression pattern of Nkx2.5. In contrast, NC markers were more strongly expressed in mesenchymal condensations, but less prominently in the adjacent neural tissue (Figure 5). Double RISH using fluorescent reporters suggested that Jtb is expressed in a subset of the NC-derived cells, as indicated by overlapping green and red fluorescence, producing white/yellow/lighter green signals in merged images, along with DAPI-stained nuclei (Figure 6). However, we also detected NC cells or derivatives without Jtb expression (red only), as well as Jtb-positive cells that did not co-express the NC lineage markers Foxd3 and Sox10 (green only) (Figure 6). Strong autofluorescence was noted in red blood cells despite quenching with True BlackTM. Notably, alkaline phosphatase (AP)-based detection appeared more sensitive than fluorescently tagged probes, likely due to the accumulation of AP reaction product over time.

2.5. Jtb Is Expressed in the Developing Vertebral Column

Interestingly, we found Jtb expressed in the developing vertebral column, specifically in notochord-derived cells of the nucleus pulposus (NP), the central component of the future intervertebral disc (IVD). The notochord, like the AER, is a transient signaling center in the developing embryo (Figure 7) [42]. We observed Jtb expression overlapping with that of ECM markers, such as Acan and Col2a1, as well as with the early NC markers (Figure 7). This overlap is expected, as NC markers act upstream of ECM markers in signaling cascades that guide neural, glial, and chondrogenic cell differentiation [37]. Among the EDC genes, we found S100a1 and S100a10 also expressed in notochordal cells of the future NP, while loricrin expression was not notably detected.

3. Materials and Methods

3.1. JTB/Jtb Mapping Refinement

To update the JTB/Jtb locus within its chromosomal neighborhood, we used publicly available data provided by NCBI/NIH for both the human (GRCh38.p14 (Build 37.2), https://www.ncbi.nlm.nih.gov/datasets/gene/10899, accessed on 1 October 2025) and murine (GRCm39 (Build 37.2), https://www.ncbi.nlm.nih.gov/datasets/gene/23922, accessed on 1 October 2025) reference genomes and compared nucleotide positions for each gene. Advances in omics technologies have refined chromosome maps in recent years. After aligning JTB information as originally supported by STS and YAC data [3] and the EDC [4] with the genomic location updates by NCBI, JTB no longer resided between the S100A genes delimiting the EDC. While genomic NCBI/NIH data is publicly available, a JTB/Jtb location in the EDC remained in the recent literature and continues to be considered in the context of JTB’s involvement in malignancies.

3.2. Mouse Embryos

Animal procedures were carried out following the Institutional Animal Care and Use Committee (IACUC) guidelines, as set by the National Advisory Committee for Laboratory Animal Research (NACLAR) under IACUC protocols No. 110689 and 110648. Embryonic day (E) 0.5 was defined as the morning on which a vaginal plug was observed in timed matings. Wild-type embryos of either C57BL6/J/129Sv background (Figure 2, Figure 4, Figure 5, and Figure 7) or CD1 background (Figure 3 and Figure 6) were harvested at E11.5–E13.5, fixed in freshly prepared 4% (w/v) paraformaldehyde (PFA), dehydrated, paraffin-embedded, and stored under dry conditions at room temperature until further use (Figure 8). Midgestation embryos E11.5–E13.5 were selected because all major organs were present at these stages. No obvious differences were noted between the strains.

3.3. RNA In Situ Hybridization (RISH) for Gene Expression Analysis

RISH was performed on sections of midgestational wild-type mouse embryos as previously described [43,44,45,46]. UTP-digoxigenin (DIG, Roche, Basel, Switzerland) or UTP-fluorescein isothiocyanate (FITC, Roche) labeled probes were generated through in vitro transcription from PCR-amplified murine genomic DNA or cDNA, using gene-specific primers. Reverse primers included a 5′ T3 or T7 promoter recognition site to enable the synthesis of antisense probes (Table 1, Table 2 and Table 3, Figure 8).
Alkaline phosphatase (AP)-conjugated anti-DIG antibodies (Roche), in combination with the nitro blue tetrazolium/5-bromo-4-chloro-3-indolyl phosphate (NBT/BCIP) substrate (Roche), enabled qualitative gene expression analysis on 7 μm sections of midgestation wild-type mouse embryos mounted on Histobond+ slides (VWR) (Figure 8, Table 1, Table 2 and Table 3). Slides were incubated for 24 h at 4 °C in the dark following NBT/BCIP substrate (Roche) addition, then fixed with PFA and mounted using glycerin jelly. Double RISH, including buffer compositions, was previously described in detail in Li et al. (2021) [47], and key steps are highlighted here (Figure 8 and Table 1, Table 2 and Table 3). The following primary antibodies were used for double RISH: rabbit anti-DIG (TFS) and rabbit anti-FITC (DFS). These were detected by secondary antibodies: goat anti-rabbit-Alexa Fluor 488 (TFS), representing JtbE transcripts, and goat anti-rabbit-Alexa Fluor 594 (TFS), reflecting Foxd3 or Sox10 expression (Table 1 and Table 3). TrueBlackTM (Biotium) was used to reduce autofluorescence from red blood cells. Notably, fluorescence from the UTP-FITC was not detectable; red fluorescence originated from the Alexa Fluor 594 fluorophore. A flow chart outlining RISH and double RISH procedures is provided in Figure 8. Results were documented on a Motic BA310 compound microscope with a Moticam A16 16 MP camera (Carolina Biological) or a Zeiss Axio Vert for fluorescent images. RISH was performed at least twice for all probes.

4. Conclusions

Refined mapping based on available updated genomic data now places human JTB and murine Jtb outside the EDC. The provided Jtb expression data for midgestation mouse embryos indicated similarities between Jtb expression and its chromosomal neighbors, which could suggest a more global gene expression regulation in this chromosomal region. Epigenetic gene regulatory mechanisms implicating DNA demethylation, chromatin decondensation, and telomere dysfunction were previously suggested [48]. We confirmed the previously described expression of Jtb in the heart, but also showed its otherwise widespread yet not ubiquitous expression in midgestational wild-type embryos. Some similarity and even co-expression with NC markers was noted at this stage of development, suggesting Jtb could be expressed in cells of the NC lineage or their descendants. If Jtb is expressed in migratory cells of the NC cell lineage, this could provide one explanation for its association with many different malignancies [1]. However, based on the present data, we cannot conclude that Jtb is part of the NC signaling cascade. In vivo lineage analysis could further clarify this. To better understand the role of JTB in cancer, it will be necessary to carefully dissect breakpoint effects on JTB as a truncated protein and 1q21+ effects. A comparison of mouse and human translocation models would be helpful in the future.

Supplementary Materials

The following supporting information can be downloaded at: https://www.mdpi.com/article/10.3390/ijms26209952/s1.

Author Contributions

Conceptualization, P.K.; methodology, P.K.; investigation, P.K., C.M., and T.M.J.; resources, P.K., T.L., and C.C.D.; writing—original draft preparation, P.K., T.L., C.C.D., and A.-N.N.; writing—review and editing, C.M., T.M.J., P.K., T.L., C.C.D., and A.-N.N.; visualization, P.K. and C.M.; funding acquisition, P.K., C.C.D., and T.L. All authors have read and agreed to the published version of the manuscript.

Funding

Research reported in this publication was supported by a Clarkson University Team Science Award to P.K. and C.C.D. and the Bayard and Virginia Clarkson Endowment Fund granted to T.L. The funders had no role in study design, data collection and analysis, decision to publish, or preparation of the manuscript.

Institutional Review Board Statement

The animal study protocol was approved by the Institutional Review Board of the Genome Institute Singapore. Animal procedures were carried out following the Institutional Animal Care and Use Committee (IACUC) guidelines as set by the National Advisory Committee for Laboratory Animal Research (NACLAR) under IACUC protocols No. 110689 and 110648.

Informed Consent Statement

Not applicable; the study did not involve humans.

Data Availability Statement

The original contributions presented in this study are included in the article. Further inquiries can be directed to the corresponding authors.

Acknowledgments

The authors also thank the members of the Biochemistry & Proteomics Laboratories for the pleasant working environment.

Conflicts of Interest

The authors declare no conflicts of interest. The funders had no role in the design of the study; in the collection, analyses, or interpretation of data; in the writing of the manuscript; or in the decision to publish the results.

Abbreviations

The following abbreviations are used in this manuscript:
JTBJumping Translocation Breakpoint
EDCEpidermal Differentiation Complex
CPP/CPCChromosomal Passenger Proteins/Complex
PARProstate Androgen-Regulated
ARAndrogen Receptor
APAlkaline Phosphatase
DAPI4′,6-diamidino-2-phenylindole
UTPUridine-Triphosphate Nucleotide
DIGDigoxigenin
FITCFluorescein Isothiocyanate
LORLoricrin
SEDCSingle Coding Exon EDC
CREB3L4cAMP-responsive Element-Binding Protein 3-Like Protein 4
LARLuminal Androgen Receptor subtype
TNBCTriple-Negative Breast Cancer
OASISOld Astrocyte Specifically Induced Substance
RISHRNA In Situ Hybridization
IACUCInstitutional Animal Care and Use Committee
NACLARNational Advisory Committee for Laboratory Animal Research
PBSPhosphate-Buffered Saline
PFAParaformaldehyde
NBT/BCIPNitro Blue Tetrazolium/5-bromo-4-chloro-3-indolyl phosphate substrate
TBTrueBlackTM
TFSThermo Fisher Scientific

References

  1. Jayaweera, T.M.; Jayathirtha, M.; Weraduwage, K.; Kraus, P.; Darie, C.C.; Neagu, A.N. From Jumping Gene to Cancer: Revisiting the Role of JTB Protein. Biomedicines 2025, 13, 1705. [Google Scholar] [CrossRef]
  2. Platica, O.; Chen, S.; Ivan, E.; Lopingco, M.C.; Holland, J.F.; Platica, M. PAR, a novel androgen regulated gene, ubiquitously expressed in normal and malignant cells. Int. J. Oncol. 2000, 16, 1055–1061. [Google Scholar] [CrossRef] [PubMed]
  3. Hatakeyama, S.; Osawa, M.; Omine, M.; Ishikawa, F. JTB: A novel membrane protein gene at 1q21 rearranged in a jumping translocation. Oncogene 1999, 18, 2085–2090. [Google Scholar] [CrossRef] [PubMed]
  4. Qin, D.; Ma, L.; Qin, L. Potential Role of the Epidermal Differentiation Complex in the Pathogenesis of Psoriasis. Front. Biosci. 2022, 27, 325. [Google Scholar] [CrossRef]
  5. Hatakeyama, S.; Fujita, K.; Mori, H.; Omine, M.; Ishikawa, F. Shortened telomeres involved in a case with a jumping translocation at 1q21. Blood 1998, 91, 1514–1519. [Google Scholar] [CrossRef]
  6. Solomon, E.; Borrow, J.; Goddard, A.D. Chromosome aberrations and cancer. Science 1991, 254, 1153–1160. [Google Scholar] [CrossRef]
  7. Platica, M.; Ivan, E.; Ionescu, A.; Holland, J.F.; Mora, G.; Tindall, D.J.; Mandeli, J.; Unger, P.D.; Platica, O. Transformation of NIH 3T3 cells by enhanced PAR expression. Biochem. Biophys. Res. Commun. 2004, 314, 891–896. [Google Scholar] [CrossRef]
  8. Rousseau, F.; Pan, B.; Fairbrother, W.J.; Bazan, J.F.; Lingel, A. The structure of the extracellular domain of the jumping translocation breakpoint protein reveals a variation of the midkine fold. J. Mol. Biol. 2012, 415, 22–28. [Google Scholar] [CrossRef] [PubMed]
  9. Kanome, T.; Itoh, N.; Ishikawa, F.; Mori, K.; Kim-Kaneyama, J.R.; Nose, K.; Shibanuma, M. Characterization of Jumping translocation breakpoint (JTB) gene product isolated as a TGF-β1-inducible clone involved in regulation of mitochondrial function, cell growth and cell death. Oncogene 2007, 26, 5991–6001. [Google Scholar] [CrossRef]
  10. Liu, S.; Chen, S.; Zeng, J. TGF-β signaling: A complex role in tumorigenesis (Review). Mol. Med. Rep. 2018, 17, 699–704. [Google Scholar] [CrossRef]
  11. Jayathirtha, M.; Jayaweera, T.; Whitham, D.; Petre, B.A.; Neagu, A.-N.; Darie, C.C. Two-Dimensional Polyacrylamide Gel Electrophoresis Coupled with Nanoliquid Chromatography–Tandem Mass Spectrometry-Based Identification of Differentially Expressed Proteins and Tumorigenic Pathways in the MCF7 Breast Cancer Cell Line Transfected for Jumping Translocation Breakpoint Protein Overexpression. Int. J. Mol. Sci. 2023, 24, 14714. [Google Scholar]
  12. Platica, M.; Ionescu, A.; Ivan, E.; Holland, J.F.; Mandeli, J.; Platica, O. PAR, a protein involved in the cell cycle, is functionally related to chromosomal passenger proteins. Int. J. Oncol. 2011, 38, 777–785. [Google Scholar] [CrossRef]
  13. Xu, X.F.; Zhou, S.W.; Zhang, X.; Ye, Z.Q.; Zhang, J.H.; Ma, X.; Zheng, T.; Li, H.Z. Prostate androgen-regulated gene: A novel potential target for androgen-independent prostate cancer therapy. Asian J. Androl. 2006, 8, 455–462. [Google Scholar] [CrossRef] [PubMed]
  14. Yuxiong, W.; Faping, L.; Bin, L.; Yanghe, Z.; Yao, L.; Yunkuo, L.; Yishu, W.; Honglan, Z. Regulatory mechanisms of the cAMP-responsive element binding protein 3 (CREB3) family in cancers. Biomed. Pharmacother. 2023, 166, 115335. [Google Scholar] [CrossRef] [PubMed]
  15. Ito, T.; Saito, A.; Kamikawa, Y.; Nakazawa, N.; Imaizumi, K. AIbZIP/CREB3L4 Promotes Cell Proliferation via the SKP2-p27 Axis in Luminal Androgen Receptor Subtype Triple-Negative Breast Cancer. Mol. Cancer Res. 2024, 22, 373–385. [Google Scholar] [CrossRef]
  16. Kim, T.H.; Park, J.M.; Kim, M.Y.; Ahn, Y.H. The role of CREB3L4 in the proliferation of prostate cancer cells. Sci. Rep. 2017, 7, 45300. [Google Scholar] [CrossRef]
  17. Pawlowski, J.; Kraft, A.S. Bax-induced apoptotic cell death. Proc. Natl. Acad. Sci. USA 2000, 97, 529–531. [Google Scholar] [CrossRef] [PubMed]
  18. Volz, A.; Korge, B.P.; Compton, J.G.; Ziegler, A.; Steinert, P.M.; Mischke, D. Physical mapping of a functional cluster of epidermal differentiation genes on chromosome 1q21. Genomics 1993, 18, 92–99. [Google Scholar] [CrossRef] [PubMed]
  19. Holthaus, K.B.; Eckhart, L. Development-Associated Genes of the Epidermal Differentiation Complex (EDC). J. Dev. Biol. 2024, 12, 4. [Google Scholar] [CrossRef]
  20. Tyszkiewicz, T.; Jarzab, M.; Szymczyk, C.; Kowal, M.; Krajewska, J.; Jaworska, M.; Fraczek, M.; Krajewska, A.; Hadas, E.; Swierniak, M.; et al. Epidermal differentiation complex (locus 1q21) gene expression in head and neck cancer and normal mucosa. Folia Histochem. Cytobiol. 2014, 52, 79–89. [Google Scholar] [CrossRef]
  21. Abhishek, S.; Palamadai Krishnan, S. Epidermal Differentiation Complex: A Review on Its Epigenetic Regulation and Potential Drug Targets. Cell J. 2016, 18, 1–6. [Google Scholar] [PubMed]
  22. Gregory, S.; Sekhon, M.; Schein, J.; Zhao, S.; Osoegawa, K.; Scott, C.; Evans, R.; Burridge, P.; Cox, T.; Fox, C.; et al. A physical map of the mouse genome. Nature 2002, 418, 743–750. [Google Scholar] [CrossRef] [PubMed]
  23. Jayathirtha, M.; Neagu, A.N.; Whitham, D.; Alwine, S.; Darie, C.C. Investigation of the effects of downregulation of jumping translocation breakpoint (JTB) protein expression in MCF7 cells for potential use as a biomarker in breast cancer. Am. J. Cancer Res. 2022, 12, 4373–4398. [Google Scholar]
  24. Jayathirtha, M.; Whitham, D.; Alwine, S.; Donnelly, M.; Neagu, A.N.; Darie, C.C. Investigating the Function of Human Jumping Translocation Breakpoint Protein (hJTB) and Its Interacting Partners through In-Solution Proteomics of MCF7 Cells. Molecules 2022, 27, 8301. [Google Scholar] [CrossRef]
  25. Kraus, P.; Sivakamasundari, V.; Xing, X.; Lufkin, T. Generating Mouse Lines for Lineage Tracing and Knockout Studies; Methods in Molecular Biology; Coppola, V., Singh, S.R., Eds.; Humana Press: Clifton, NJ, USA; New York, NY, USA, 2014; Volume 1194, pp. 37–62. [Google Scholar]
  26. Ma, Y.; Zhang, P.; Wang, F.; Yang, J.; Yang, Z.; Qin, H. The relationship between early embryo development and tumourigenesis. J. Cell Mol. Med. 2010, 14, 2697–2701. [Google Scholar] [CrossRef]
  27. Harder, T.; Kube, E.; Gerke, V. Cloning and characterization of the human gene encoding p11: Structural similarity to other members of the S-100 gene family. Gene 1992, 113, 269–274. [Google Scholar] [CrossRef]
  28. Nishimura, N.; Sasaki, T. Rab family small G proteins in regulation of epithelial apical junctions. Front. Biosci. 2009, 14, 2115–2129. [Google Scholar] [CrossRef]
  29. Ioannou, M.S.; McPherson, P.S. Regulation of Cancer Cell Behavior by the Small GTPase Rab13. J. Biol. Chem. 2016, 291, 9929–9937. [Google Scholar] [CrossRef]
  30. Sleeboom, J.J.F.; van Tienderen, G.S.; Schenke-Layland, K.; van der Laan, L.J.W.; Khalil, A.A.; Verstegen, M.M.A. The extracellular matrix as hallmark of cancer and metastasis: From biomechanics to therapeutic targets. Sci. Transl. Med. 2024, 16, eadg3840. [Google Scholar] [CrossRef] [PubMed]
  31. Coffey, J.C.; O’Leary, D.P. The mesentery: Structure, function, and role in disease. Lancet Gastroenterol. Hepatol. 2016, 1, 238–247. [Google Scholar] [CrossRef]
  32. Byrnes, K.G.; McDermott, K.; Coffey, J.C. Development of mesenteric tissues. Semin. Cell Dev. Biol. 2019, 92, 55–62. [Google Scholar] [CrossRef] [PubMed]
  33. Yu, Q.; Du, M.; Zhang, W.; Liu, L.; Gao, Z.; Chen, W.; Gu, Y.; Zhu, K.; Niu, X.; Sun, Q.; et al. Mesenteric Neural Crest Cells Are the Embryological Basis of Skip Segment Hirschsprung’s Disease. Cell Mol. Gastroenterol. Hepatol. 2021, 12, 1–24. [Google Scholar] [CrossRef] [PubMed]
  34. Celia-Terrassa, T.; Kang, Y. How important is EMT for cancer metastasis? PLoS Biol. 2024, 22, e3002487. [Google Scholar] [CrossRef] [PubMed]
  35. Huang, Z.; Zhang, Z.; Zhou, C.; Liu, L.; Huang, C. Epithelial-mesenchymal transition: The history, regulatory mechanism, and cancer therapeutic opportunities. MedComm 2022, 3, e144. [Google Scholar] [CrossRef]
  36. Bronner-Fraser, M. Neural crest cell migration in the developing embryo. Trends Cell Biol. 1993, 3, 392–397. [Google Scholar] [CrossRef]
  37. Simoes-Costa, M.; Bronner, M.E. Establishing neural crest identity: A gene regulatory recipe. Development 2015, 142, 242–257. [Google Scholar] [CrossRef]
  38. Wahlbuhl, M.; Reiprich, S.; Vogl, M.R.; Bosl, M.R.; Wegner, M. Transcription factor Sox10 orchestrates activity of a neural crest-specific enhancer in the vicinity of its gene. Nucleic Acids Res. 2012, 40, 88–101. [Google Scholar] [CrossRef]
  39. Wu, Z.; Li, Y.; Niu, Y.; Lu, J.; Yan, Z.; Xu, T.; Guo, Y.; Dong, Z.; Guo, W. FOXD3 suppresses epithelial-mesenchymal transition through direct transcriptional promotion of SMAD7 in esophageal squamous cell carcinoma. Mol. Carcinog. 2021, 60, 859–873. [Google Scholar] [CrossRef]
  40. Neeb, Z.; Lajiness, J.D.; Bolanis, E.; Conway, S.J. Cardiac outflow tract anomalies. Wiley Interdiscip. Rev. Dev. Biol. 2013, 2, 499–530. [Google Scholar] [CrossRef]
  41. Grow, M.W.; Krieg, P.A. Tinman function is essential for vertebrate heart development: Elimination of cardiac differentiation by dominant inhibitory mutants of the tinman-related genes, XNkx2-3 and XNkx2-5. Dev. Biol. 1998, 204, 187–196. [Google Scholar] [CrossRef]
  42. Murphy, K.; Lufkin, T.; Kraus, P. Development and Degeneration of the Intervertebral Disc-Insights from Across Species. Vet. Sci. 2023, 10, 540. [Google Scholar] [CrossRef]
  43. Kraus, P.; Sivakamasundari, V.; Olsen, V.; Villeneuve, V.; Hinds, A.; Lufkin, T. Klhl14 Antisense RNA is a Target of Key Skeletogenic Transcription Factors in the Developing Intervertebral Disc. Spine 2019, 44, E260–E268. [Google Scholar] [CrossRef]
  44. Kraus, P.; Sivakamasundari, V.; Yu, H.B.; Xing, X.; Lim, S.L.; Adler, T.; Pimentel, J.A.; Becker, L.; Bohla, A.; Garrett, L.; et al. Pleiotropic functions for transcription factor zscan10. PLoS ONE 2014, 9, e104568, Erratum in PLoS ONE 2015, 10, e0118766. [Google Scholar] [CrossRef] [PubMed]
  45. Kraus, P.; Sivakamasundari, V.; Lim, S.L.; Xing, X.; Lipovich, L.; Lufkin, T. Making sense of Dlx1 antisense RNA. Dev. Biol. 2013, 376, 224–235. [Google Scholar] [CrossRef] [PubMed]
  46. Kraus, P.; Yerden, R.; Sipes, D.; Sur, S.; Lufkin, T. A quantitative and qualitative RNA expression profiling assay for cell culture with single cell resolution. Cytotechnology 2018, 70, 185–192. [Google Scholar] [CrossRef]
  47. Li, K.; Varden, L.; Henderson, A.; Lufkin, T.; Kraus, P. Simultaneous detection of multiple mRNAs and proteins in bovine IVD cells and tissue with single cell resolution. Biotechnol. Lett. 2021, 43, 13–24. [Google Scholar] [CrossRef] [PubMed]
  48. Lema Fernandez, A.G.; Nardelli, C.; Pierini, V.; Crescenzi, B.; Pellanera, F.; Matteucci, C.; Crocioni, M.; Arniani, S.; Di Battista, V.; Quintini, M.; et al. Epigenetic Modeling of Jumping Translocations of 1q Heterochromatin in Acute Myeloid Leukemia After 5′-Azacytidine Treatment. Genes Chromosomes Cancer 2024, 63, e70013. [Google Scholar] [CrossRef]
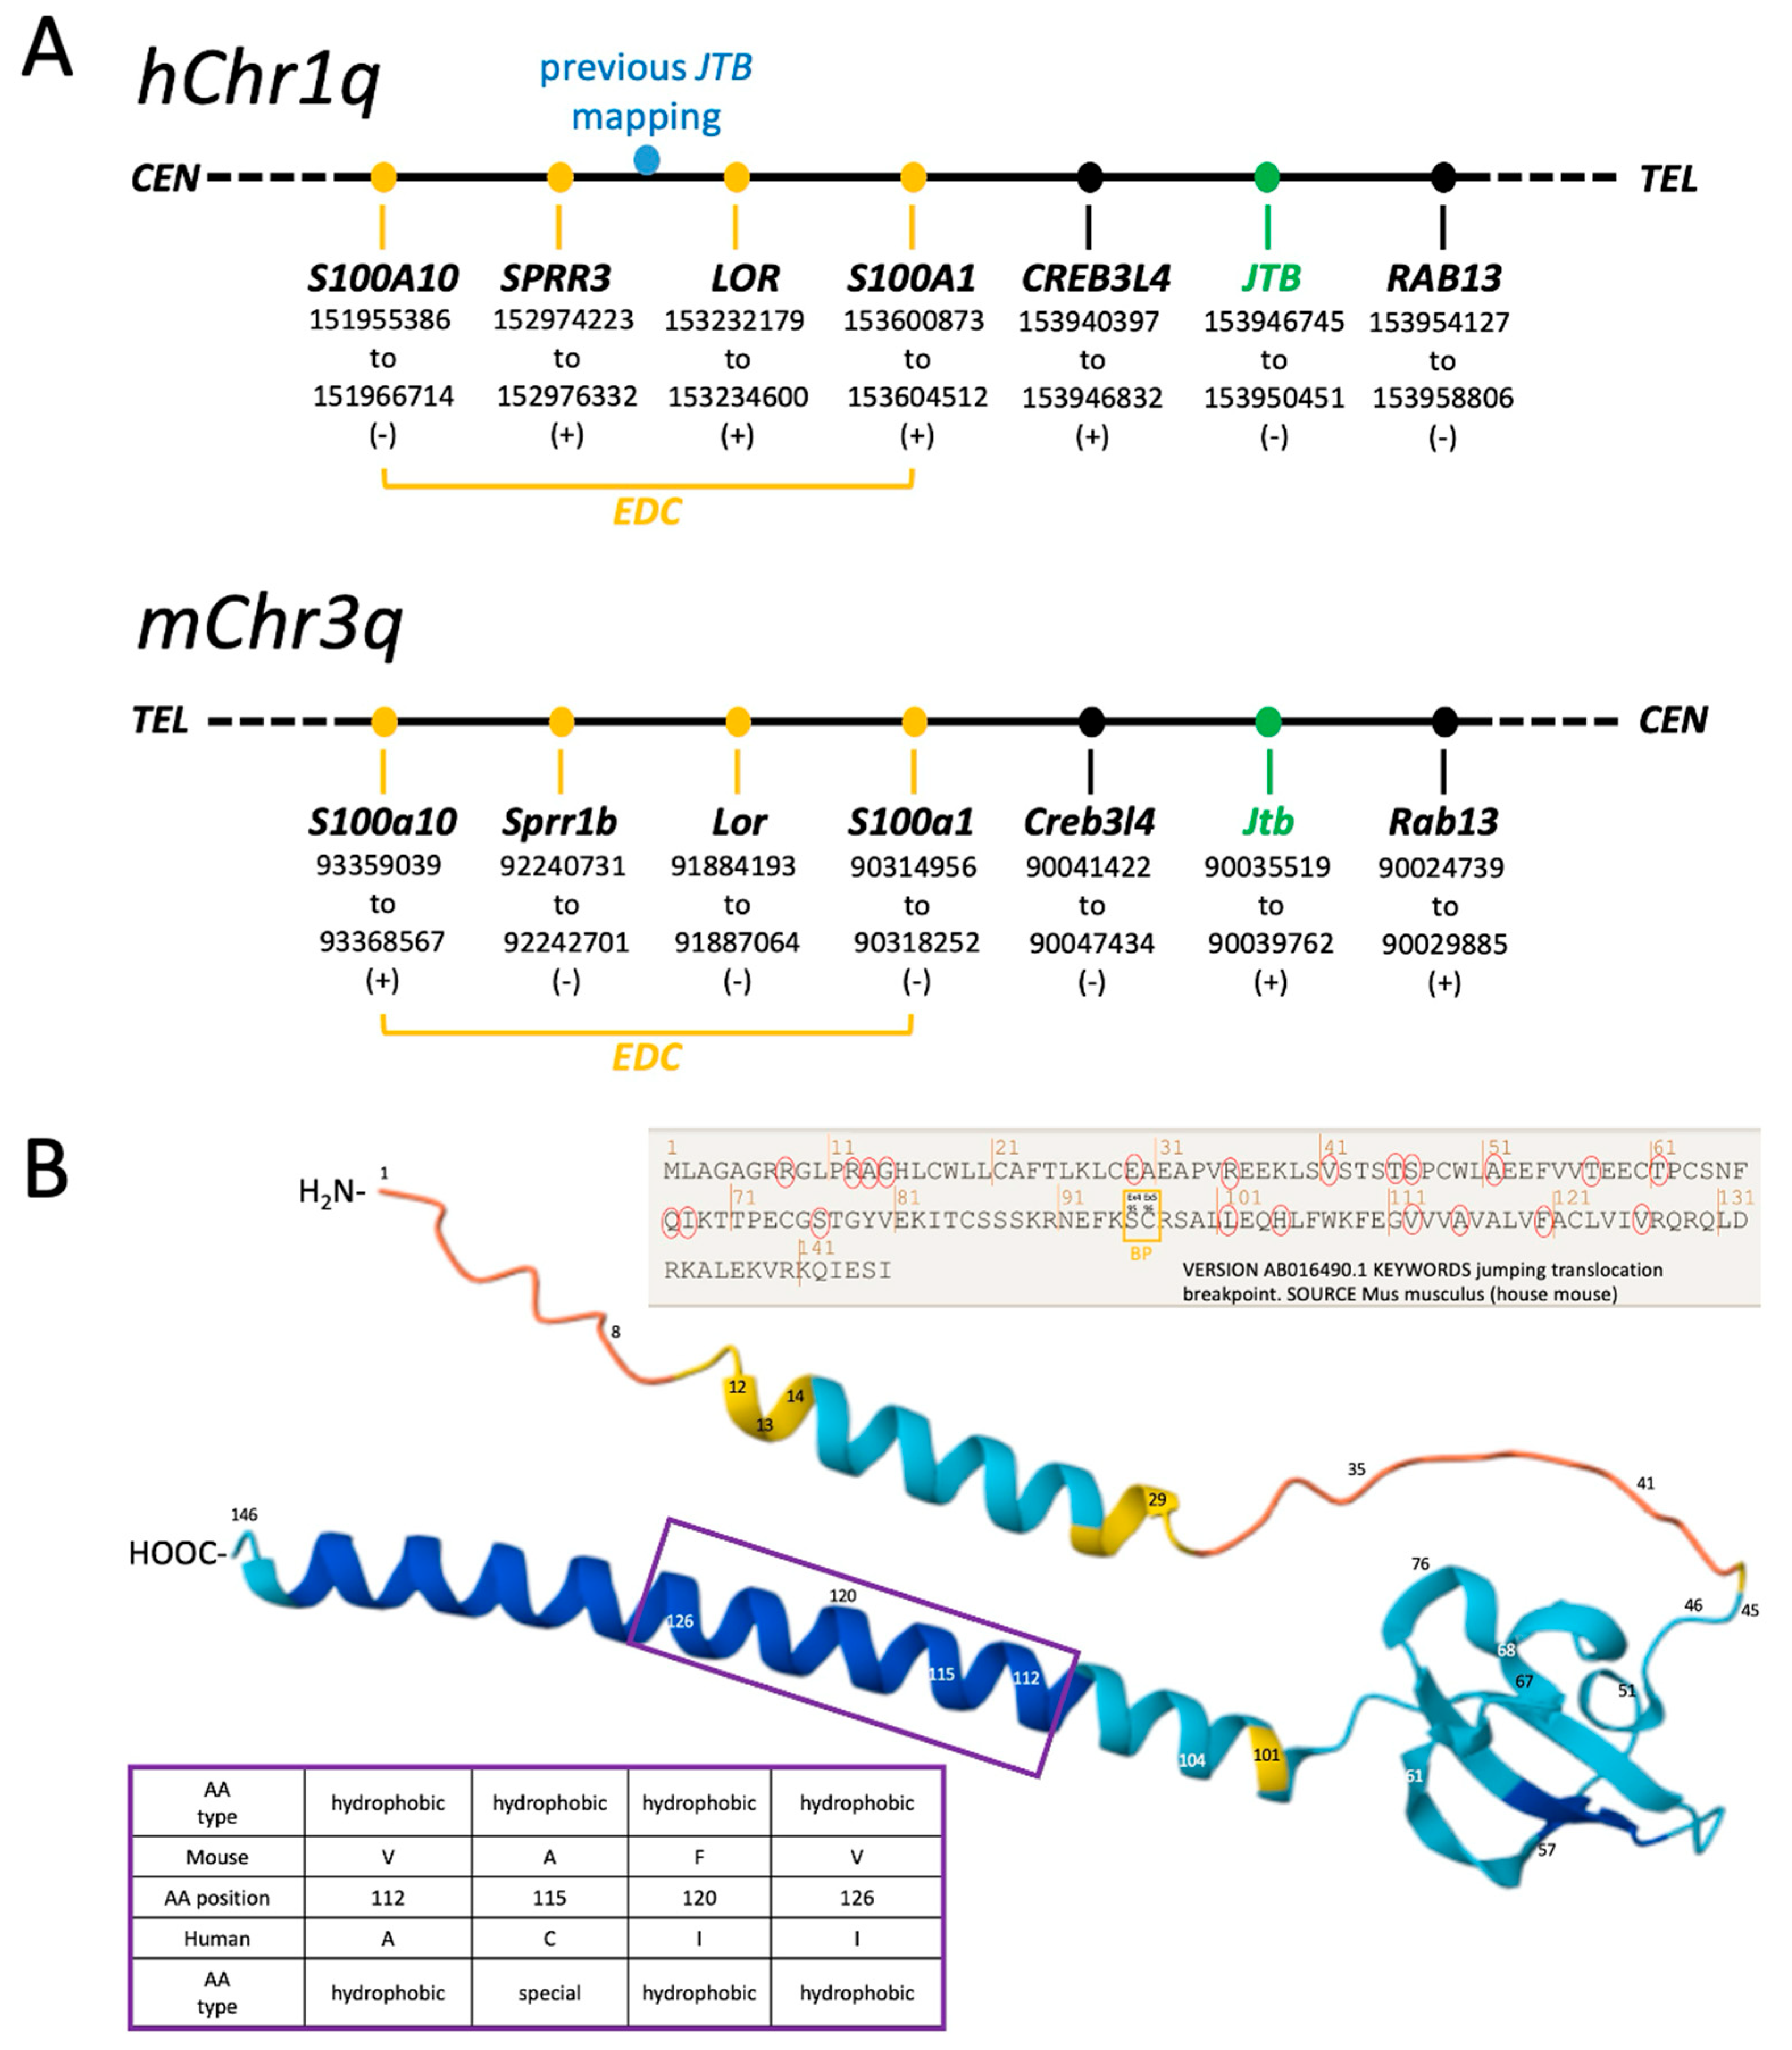
Figure 1. Location update. (A) Mapping of human JTB and murine Jtb based on NCBI data (not to scale). JTB/Jtb are located outside the EDC. (B) AlphaFold-based schematic showing differences in amino acid sequences between human JTB and murine Jtb proteins. Red circles refer to amino acid substitutions between mouse and human, the positions are indicated in the protein model. The purple box highlights several mostly conserved amino acid substitutions between mouse and human within the transmembrane domain.
Ijms 26 09952 g001
Figure 2. Murine Jtb expression in the context of extracellular matrix (ECM) markers. (A) Gene and probe locations drawn to scale. (B) AlphaFold model showing the location of the predicted breakpoint between serine (S95) and cysteine (C96). (C) Jtb probe A expression compared to that of ECM-related genes collagen type II alpha 1 (Col2a1) and aggrecan (Acan) in an E12.5 mouse embryo. Scale bar: 50 µm.
Ijms 26 09952 g002
Figure 3. Jtb expression in E11.5 mouse embryos. Arrows indicate the AER (apical ectodermal ridge). Abbreviations: tv—telencephalic vesicle; t—trigeminal ganglion; p—branchial pouch; 3—third ventricle; 4—fourth ventricle; vc—vertebral column. Scale bar: 50 μm.
Ijms 26 09952 g003
Figure 4. Jtb expression in relation to EDC genes and Rab13. RISH analysis on E13.5 mouse embryos using probes flanking Jtb on mouse chromosome 3 showed similar expression patterns. Abbreviations: EDC—epidermal differentiation complex; Lor—loricrin; Jtb—jumping translocation breakpoint, here, probe JtbA; Rab13—member of the RAS oncogene Rab family of small GTPases. Scale bar: 50 μm.
Ijms 26 09952 g004
Figure 5. Expression of Jtb in the context of neural crest (NC) cell lineage markers (Sox10, FoxD3) and heart lineage marker (Nkx2.5) in E13.5 wild-type mouse embryos. Scale bar: 50 µm.
Ijms 26 09952 g005
Figure 6. Double-RISH on E12.5 wild-type mouse embryos for the JtbE probe (Alexa Fluor 488, green) and neural crest cell markers, Foxd3 or Sox10 (Alexa Fluor 594, red). Co-expression ranged from white/yellow to light green in some, but not all, cells. Nuclei were counterstained with DAPI (blue). Corresponding bright-field (BF) images following TrueBlackTM (TB) treatment are shown below each RISH image. Scale bar: 50 µm.
Ijms 26 09952 g006
Figure 7. Jtb expression in the developing vertebral column of E13.5 mouse embryos. Scale bar: 50 µm.
Ijms 26 09952 g007
Figure 8. Workflow for chromogenic (AP) and fluorescent (Alexa Fluor 488/Alexa Fluor 594) RISH. While DIG- and FITC-labeled RNA antisense probes can be added simultaneously, primary and secondary antibodies must be added sequentially, as indicated. Abbreviations: AP—alkaline phosphatase; AS—antisense; PFA—paraformaldehyde; PCR—polymerase chain reaction; DIG—digoxigenin; FITC—fluorescein isothiocyanate; DAPI—4′,6-diamidino-2-phenylindole; NBT/BCIP—nitro blue tetrazolium/5-bromo-4-chloro-3-indolyl phosphate substrate; UTP—uridine triphosphate nucleotide.
Ijms 26 09952 g008
Table 1. Primers for RISH probes used in this study.
ProbeForward PrimerReverse PrimerReference
Sequence
PromoterProduct Length
[bp]
Label/Fluorochrome for Double RISH
Jtb AAGCCTCCGCGAGCAAGATGGCGCTATAGGAACGGCCTCGNM_206924.2T7174
Jtb BGACGCCTGCGTCCCACAAAGCAGCCAGATGCCAGAGTTCNM_206924.2T7130
Jtb ETGCCGTTCGGCTCTACTGGAGCCGCTGAACTTTCTCCATCTGANM_206924.2T7222DIG/Alexa Fluor 488
Col2a1CCATTGCGAACCCAAAGGAC CACCATTGTGTAGGACACGCNM_031163.4T3326
AcanTGAGAGAGGCGAATGGAACGCCAGTCCAGCCGAGAAATGANM_001361500.1T3998
S100a1TATGTTGTGCTGGTGGCTGCTCCTTGGTGCACGTCGAGACTAF368423.1T7288
S100a10CACCCACGGGGTCACTTGAGTGAGGGCAATGGGATGCAAACANM_009112.2T7171
LorTGGCAAGGGTGTGCCAGTCTGGGGGAAGGGGCGCTTAAAATNM_008508.3T7291
Rab13TGGCACCTCAAGGGGAGATGAGGCAAGGTTCCGTCCACTCTNM_026677.4T7519
Sox10TCCAGCCAGGGTGTTTGGTGCTCGTGAAGAGCCCAACGCCNM_011437.1T7217FITC/Alexa Fluor 594
Nkx2.5GTGACGCAGAACTGCCCGTTGGCGACGCAGGTTTCACAGAF083133.1T7251
FoxD3AACTCAACCCGTCCGCTGGATAAAACTGCGCAGAGTGAACCTTAF067421.2T7255FITC/Alexa Fluor 594
Table 2. RISH protocols used in this study.
RISH-TypeAP-RISHFL-Double-RISHComments
StepsRepeats/Timing/Temperature
Deparaffinization3 × 20 min at RTHistochoice
Rehydrationeach step 10 min at RTethanol gradient: 100%/100%/90%/70%/50%/30%/PBS
Fixation 4% (w/v) PFA in PBS
Wash3 × 5 min at RTPBS
Prehybridization 2–3 h at 62 °Cprehybridization solutionprevent dehydration
Hybridizationo/n at 62 °Cprehybridization solution with DIG-labeled probeprehybridization solution with DIG- and/or FITC labeled probe(s)
Post-hybridizationwashes3 × 20 min at 62 °Csolution I
3 × 5 min at RTTNT
10 min at RTTNT/solution II (1:1)
3 × 20 min at 58 °Csolution IIprevent dehydration
3 × 5 min at RTPBS
Blocking2 h at RTSuperBlockTM (PBS, TFS, Waltham, MA, USA)
Primary antibodyo/n at 4 °Canti-DIG-AP
(1:2000)
rabbit anti-DIG (1:100)
Wash3 × 10 min at RTPBS
6× hourly at RTPBSNA
3 × 10 min at RTNTMT
Color development24–48 h at 4 °C in the darkNBT/BCIP
Blocking2 h at RTNASuperBlockTM (PBS)prevent dehydration
Secondary antibody3 h at RT in the darkgoat anti-rabbit Alexa Fluor 488 (1:1000)
Wash3 × 10 min at RT away from lightPBS
Blocking2 h at RT away from lightSuperBlockTM (PBS)prevent dehydration
Primary antibody3 h at 4 °C in the darkrabbit anti-FITC (1:100)
Wash3 × 10 min at RT away from lightPBS
Blocking2 h at RT away from lightSuperBlockTM (PBS)prevent dehydration
Secondary antibodyo/n at 4 °C in the darkgoat anti-rabbit Alexa Fluor 594 (1:1000)
Counterstaining1 × 10 min at RT away from lightDAPI in PBS (1:1000)
Wash3 × 10 min at RT away from lightPBS
MountingAt RT away from lightglycerin jelly Shandon Immuno MountTM(TFS, Waltham, MA, USA)
Imaging Motic BA310Zeiss Axiovert
Table 3. Essential RISH chemicals/solutions used in this study.
TypeChemical/SolutionComposition/ConcentrationSupplier/
Order Number
Antibodiesanti-DIG-AP Fab fragments1:2000 in SuperBlockTM (PBS)Roche #11093274910
rabbit anti-DIG1:100 in SuperBlockTM (PBS)TFS #9H27L19
rabbit anti-FITC1:100 in SuperBlockTM (PBS)TFS #71-1900
goat anti-rabbit-Alexa Fluor 4881:1000 in SuperBlockTM (PBS)TFS #A11008
goat anti-rabbit-Alexa Fluor 5941:1000 in SuperBlockTM (PBS)TFS #A11012
Solutions and stainsDAPI1:1000 in waterTFS #62248
DEPC-water1:1000Agilent
glycerin jellyundilutedTed Paella
HistochoiceundilutedVWR
NBT/BCIP 1:50 in 100 mM Tris/HCl pH9.5, 100 mMNaClRoche/VWR
NTMT100 mM Tris/HCl pH9.5, 50 mM MgCl2, 100 mM NaCl, 0.1% Tween20VWR
phosphate-buffered saline (PBS)Gibco
prehybidization solution50% formamide
5× SSC (0.75 M sodium chloride/
0.075 M sodium citrate dehydrate),
1× Denhardt’s (0.02% (w/v) each
ficoll, polyvinylpyrrolidone, BSA),
0.1% (v/v) Tween 20 (Sigma),
0.1 mg/mL tRNA (Roche),
0.05 mg/mL Heparin
Amresco
VWR
VWR
VWR
Sigma
Roche
Alfa Aesar
Shandon Immuno MountTMundilutedTFS
solution I50% (v/v) formamide,
5× SSC (see above)
1% (v/v) sodium dodecylsulphate (SDS)
Amresco
VWR
VWR
solution II50% (v/v) formamide
2× SSC
0.2% (v/v) SDS
Amresco
SuperBlockTM (PBS)undilutedPBS
TNT0.5 M NaCl
0.01 M Tris/HCl pH 7.5
0.1% (v/v) Tween 20
VWR
VWR
Sigma
True BlackTM (DMF)1:20 in 70% EthanolBiotium
Probe generationin vitro transcriptionUTP-DIG labeling MixRoche #11277073910
UTP-FITC labeling mixRoche #11685619910
T7-RNA polymerase 40 U/reactionPromega
RNA Protector 40 U/reactionRoche
template PCRGoTaq Flexi 0.5 U/reactionPromega
dNTP mixPromega
Disclaimer/Publisher’s Note: The statements, opinions and data contained in all publications are solely those of the individual author(s) and contributor(s) and not of MDPI and/or the editor(s). MDPI and/or the editor(s) disclaim responsibility for any injury to people or property resulting from any ideas, methods, instructions or products referred to in the content.