Article

Synovial CXCL3+FOSL2+ Macrophages Mediate Inflammation via FOSL2/AP-1 in Rheumatoid Arthritis: A Single-Cell Transcriptome Analysis

1
Department of Rheumatology, Renji Hospital, Shanghai Jiao Tong University School of Medicine, Shanghai 200001, China
2
Department of Allergy, Renji Hospital, Shanghai Jiao Tong University School of Medicine, Shanghai 200001, China
*
Authors to whom correspondence should be addressed.
These authors contributed equally to this work.
Int. J. Mol. Sci. 2025, 26(19), 9718; https://doi.org/10.3390/ijms26199718
Submission received: 21 August 2025 / Revised: 27 September 2025 / Accepted: 3 October 2025 / Published: 6 October 2025
(This article belongs to the Special Issue Macrophages in Human Diseases and Their Treatment)

Abstract

Macrophages play a central role in joint inflammation and bone destruction in rheumatoid arthritis (RA). While activator protein-1 (AP-1) transcription factors have been implicated in RA pathogenesis, the specific roles of individual AP-1 members in regulating synovial macrophages remain unclear. To address this, two public single-cell transcriptomic datasets were first analyzed to profile synovial macrophages, and then to identify AP-1 family members and associated pathways via differential expression and gene set enrichment analyses. JUND, FOSL2, and FOSB were found to be highly enriched in the RA synovium, and a distinct CXCL3+FOSL2+ macrophage subset was identified, characterized by pro-inflammatory, metabolic, and differentiation-related pathways. Intercellular communication analysis further revealed that this CXCL3+FOSL2+ macrophage subset interacted with ACKR1+ endothelial cells within the synovial microenvironment. Validation in a large-cohort bulk transcriptomic dataset, together with functional assays using in vitro FOSL2 knockdown in U937 cell lines, further confirmed FOSL2’s role in promoting macrophage-driven inflammation. Collectively, these findings indicate that CXCL3+FOSL2+ macrophages drive RA synovitis via the FOSL2/AP-1 axis, highlighting a potential therapeutic target.

1. Introduction

Rheumatoid arthritis (RA) is a chronic inflammatory polyarthritis with a global incidence of approximately 1% [1]. It is characterized by immune dysregulation and pannus formation in the synovial microenvironment, leading to articular erosion, joint destruction, and extra-articular manifestations. The resulting joint deformities, functional disabilities, and workforce loss place a significant burden on both individuals and society [2]. Although targeted therapies have been developed against key pathogenic pathways—including the Janus kinase (JAK)-signal transducers and activators of transcription (STAT) signaling [3,4], tumor-necrosis factor-alpha (TNF-α) [5], interleukin (IL)-6 [6], and T cell co-stimulation [7]—a substantial proportion of patients presented inadequate responses or disease relapse during remission. These limitations underscore the need to further explore novel mechanisms and therapeutic targets.
One of the pathological features of RA synovitis is immune cell infiltration, involving both innate and adaptive immune populations [8]. Here, macrophages play a key role in the inflammation of the RA synovium [9,10]. Previous studies have shown that the activation and polarization of macrophages (M1/M2 pattern) are the vital factors in disrupting immune homeostasis and promoting articular inflammation, accompanied by the release of pro-inflammatory cytokines and chemokines, T cell activation, and remodeling by the extracellular matrix formation [11,12]. Recent single-cell analyses have revealed significant diversity among synovial macrophages, identifying distinct subsets defined by specific functional markers. For example, MerTK+CD206+ and MerTK+TREM2high macrophages are associated with efferocytosis and tissue repair, while macrophages in anti-citrullinated protein antibody-negative RA show increased expression of CCL13, CCL18, and MMP3, reflecting their roles in chemotaxis and matrix remodeling [8,13,14,15]. The findings suggest the synovial macrophage components may be more complex and multi-functional than previously recognized.
The complex functions and components of synovial macrophages are now acknowledged as a consequence of transcriptional regulation, environmental factors, and epigenetic induction, but the underlying mechanism is still unclear. The activator protein 1 (AP-1) family, a group of transcription factors involved in inflammation, proliferation, and apoptosis, has been implicated in RA pathogenesis. AP-1 consists of homo- and heterodimeric complexes formed by FOS and JUN proteins [16]. FOS proteins consist of FRA1 (coded by FOSL1), FRA2 (coded by FOSL2), FOSB (coded by FOSB), and c-FOS (coded by FOS), while the JUN family includes JUNB, JUN, and JUND [17]. FRA1 has been reported to be associated with the active phase of RA and to promote inflammatory responses in synovial macrophages [18]. Moreover, the higher expression of JUN with FRA1 can be observed in arthritic models and can be inhibited by a cyclin-dependent kinase inhibitor, suggesting the promotion of cellular growth by the AP-1 family [19]. However, it is unclear how the rest of the AP-1 family regulates the synovial macrophages in RA.
In the study, we integrated single-cell RNA sequencing (scRNA-seq) and bulk RNA-seq to construct a comprehensive cellular and transcriptomic landscape in the RA synovium, with a particular focus on macrophage heterogeneity at two aspects, primarily, the intrinsic functions, and secondly, the cellular interaction. We identified a distinct subset, CXCL3+FOSL2+ macrophage, which exhibited multifunctional properties and interacted with ACKR1+ endothelial cells. This specialized population reflects an immunophenotypic divergence within the synovial macrophage compartment and contributes to the inflammatory milieu of RA.

2. Results

2.1. Single-Cell Landscape of Synovial Tissue in RA

The scRNA-seq datasets of synovial tissues from RA (GSE200815) and OA (GSE248455) were combined to depict a single-cell landscape of the synovium. Based on the canonical markers (Figure S1A), a total of 47,672 high-quality single cells were clustered into nine distinct cell types, including T cells, B/plasma cells, monocyte-macrophage lineage, pDCs, mast cells, fibroblasts, ECs, mural cells, and proliferating cells (Figure 1A). Specifically, compared to OA, the proportions of T cells, endothelium, and mural cells were relatively higher in RA, while the proportion of monocyte-macrophage lineage of the RA group was lower than that of the OA group (Figure 1B and Figure S1B). No statistically significant differences were observed in B/plasma cells, pDCs, mast cells, fibroblasts, and proliferating cells between the two groups (Figure S1B). These results reflected a distinct immune microenvironment in the RA synovium, including T cell infiltration, pannus formation, and macrophage remodeling.

2.2. Elevated Expression of FOSL2 and JUND in RA Synovium

To further detect the AP-1 family, we performed differential gene expression analysis using the FindMarkers function. A sum of 272 up-regulated genes were expressed in the RA synovium, including JUND, FOSL2 and FOSB (JUND, avg.log2FC = 3.78, Padj < 0.001; FOSL2, avg.log2FC = 3.21, Padj < 0.001; FOSB, avg.log2FC = 1.98, Padj < 0.001) (Figure 1C and Table 1). However, JUN showed no significant difference in expression between the RA synovium and the OA synovium (avg.log2FC = 0.41) (Table 1). FOS, FOSL1, and JUNB were not reported owing to their low expression, less than 25% in either the whole RA tissues or OA ones.
Regarding the AP-1 family potentially differing among different cellular clusters, we applied the group-to-group comparisons by cell types. As shown in Figure 1D,E, JUND, FOSL2, and FOSB were consistently highly expressed in all cell types in RA synovium compared to those of OA, while FOSL1 was up-regulated only among fibroblasts, endothelium, mural cells, and proliferating cells. Interestingly, the expression of FOSL2 by RA monocyte-macrophage lineage was more remarkable; FOSL2-related pathways were also highly enriched in RA synovial macrophages, involving cell development, inflammation, and metabolism (Figure S2A,B).

2.3. Immunophenotype Divergence of Macrophages in RA

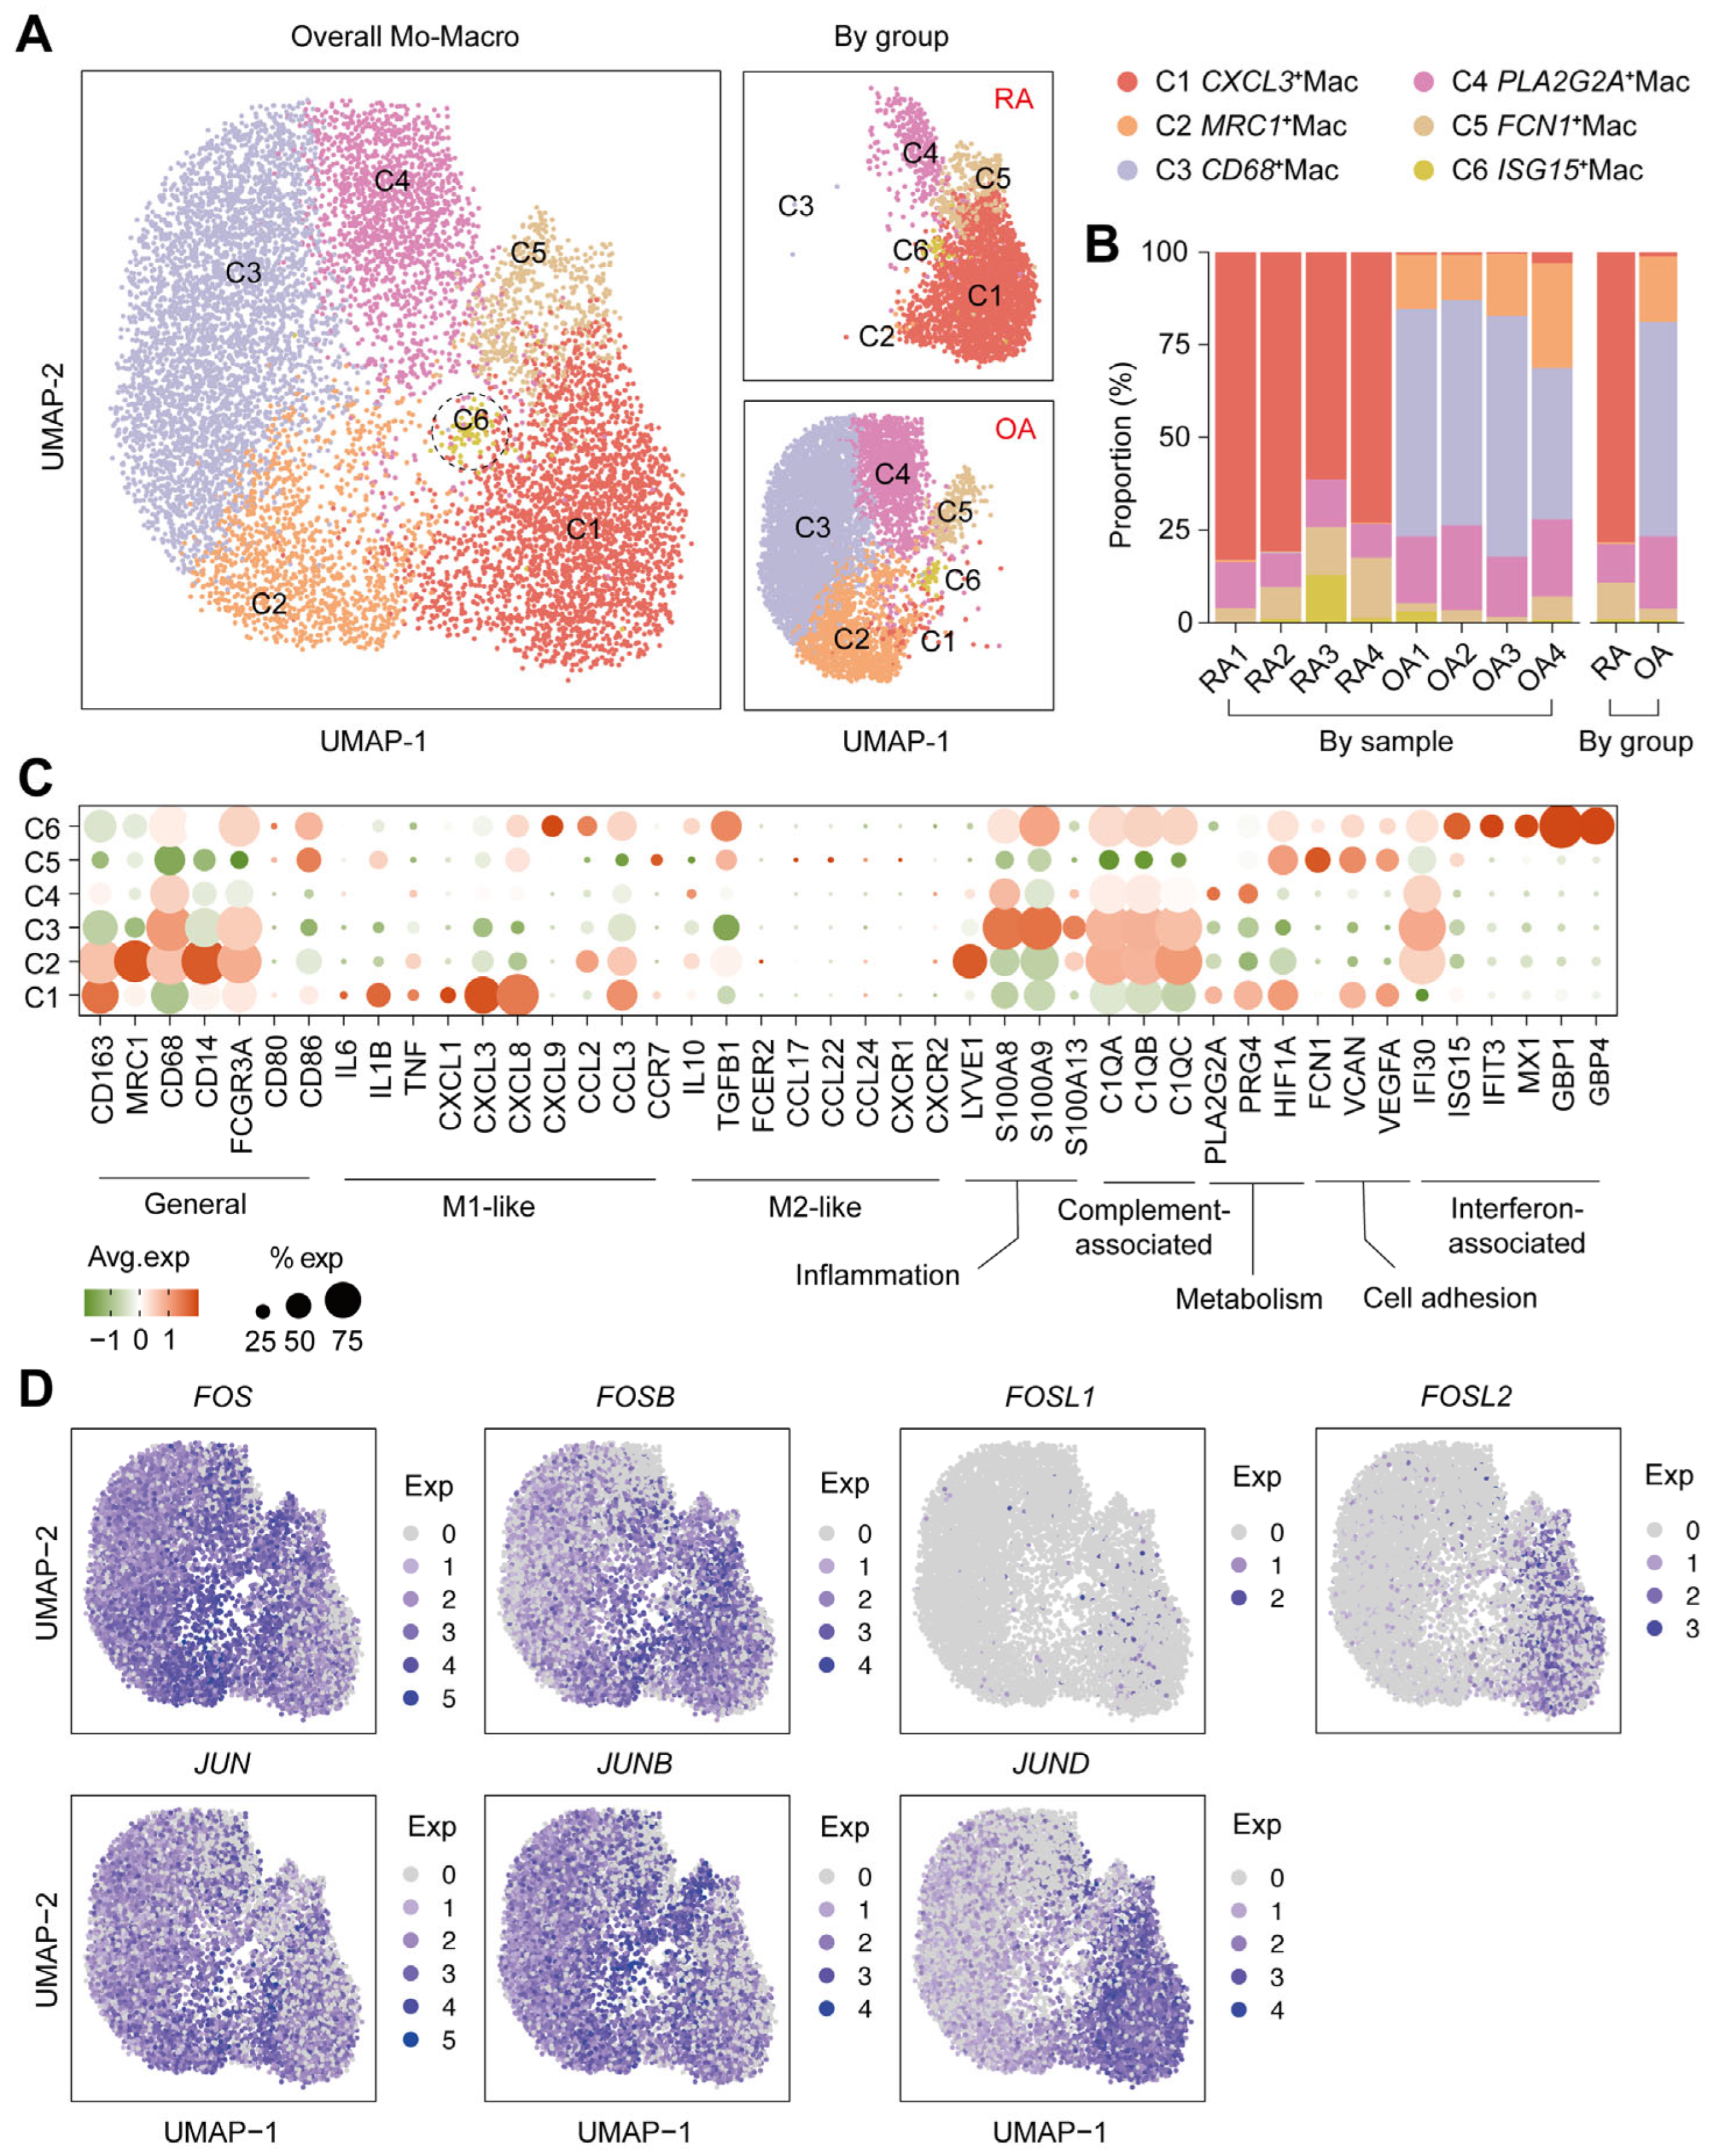
Since monocyte-macrophage lineage is closely associated with activity of RA synovitis [20], we further focused on the macrophage constitution and its expression of the AP-1 family. Thus, we selected the monocyte-macrophage lineage and further subdivided it into six sub-clusters, including CXCL3+Mac (C1), MRC1+Mac (C2), CD68+Mac (C3), PLA2G2A+Mac (C4), FCN1+Mac (C5), and ISG15+Mac (C6) (Figure 2A). Meanwhile, it showed significant divergence between RA and OA; specifically, CXCL3+Mac (C1) was the predominant cluster in the RA synovium, while OA was characterized by MRC1+Mac (C2) and CD68+Mac (C3) (Figure 2A,B). As for the functional genes, CXCL3+Mac (C1) highly expressed some of the M1-like markers (IL1B, IL6, TNF, CXCL1, CXCL3, CXCL8, and CCL3), together with metabolism-associated (PLA2G2A, PRG4, and HIF1A) and intercellular adhesion (VCAN and VEGFA) genes, which suggested that CXCL3+Mac had similar features to pro-inflammatory M1 macrophages. Whereas MRC1+Mac (C2) and CD68+Mac (C3), the predominant cluster of the OA synovium, mainly expressed the complement-associated genes (C1QA, C1QB, C1QC) and IFI30, an interferon-related gene (Figure 2C).
With regard to the expression of AP-1 members, FOSL2 was significantly expressed by the predominant cluster (C1) of RA, and JUND was mainly expressed in C1 and a minority of other clusters. However, FOS, FOSB, JUN, and JUNB were widely expressed in all macrophages, and FOSL1 was only expressed among a very small number of cells (Figure 2D).
To sum up, these findings indicate a significant immunophenotypic and functional divergence in the RA synovium, closely associated with elevated FOSL2 expression, particularly in the prominent CXCL3+Mac (C1) subset.

2.4. Multiple Functions of Synovial CXCL3+FOSL2+Mac on RA

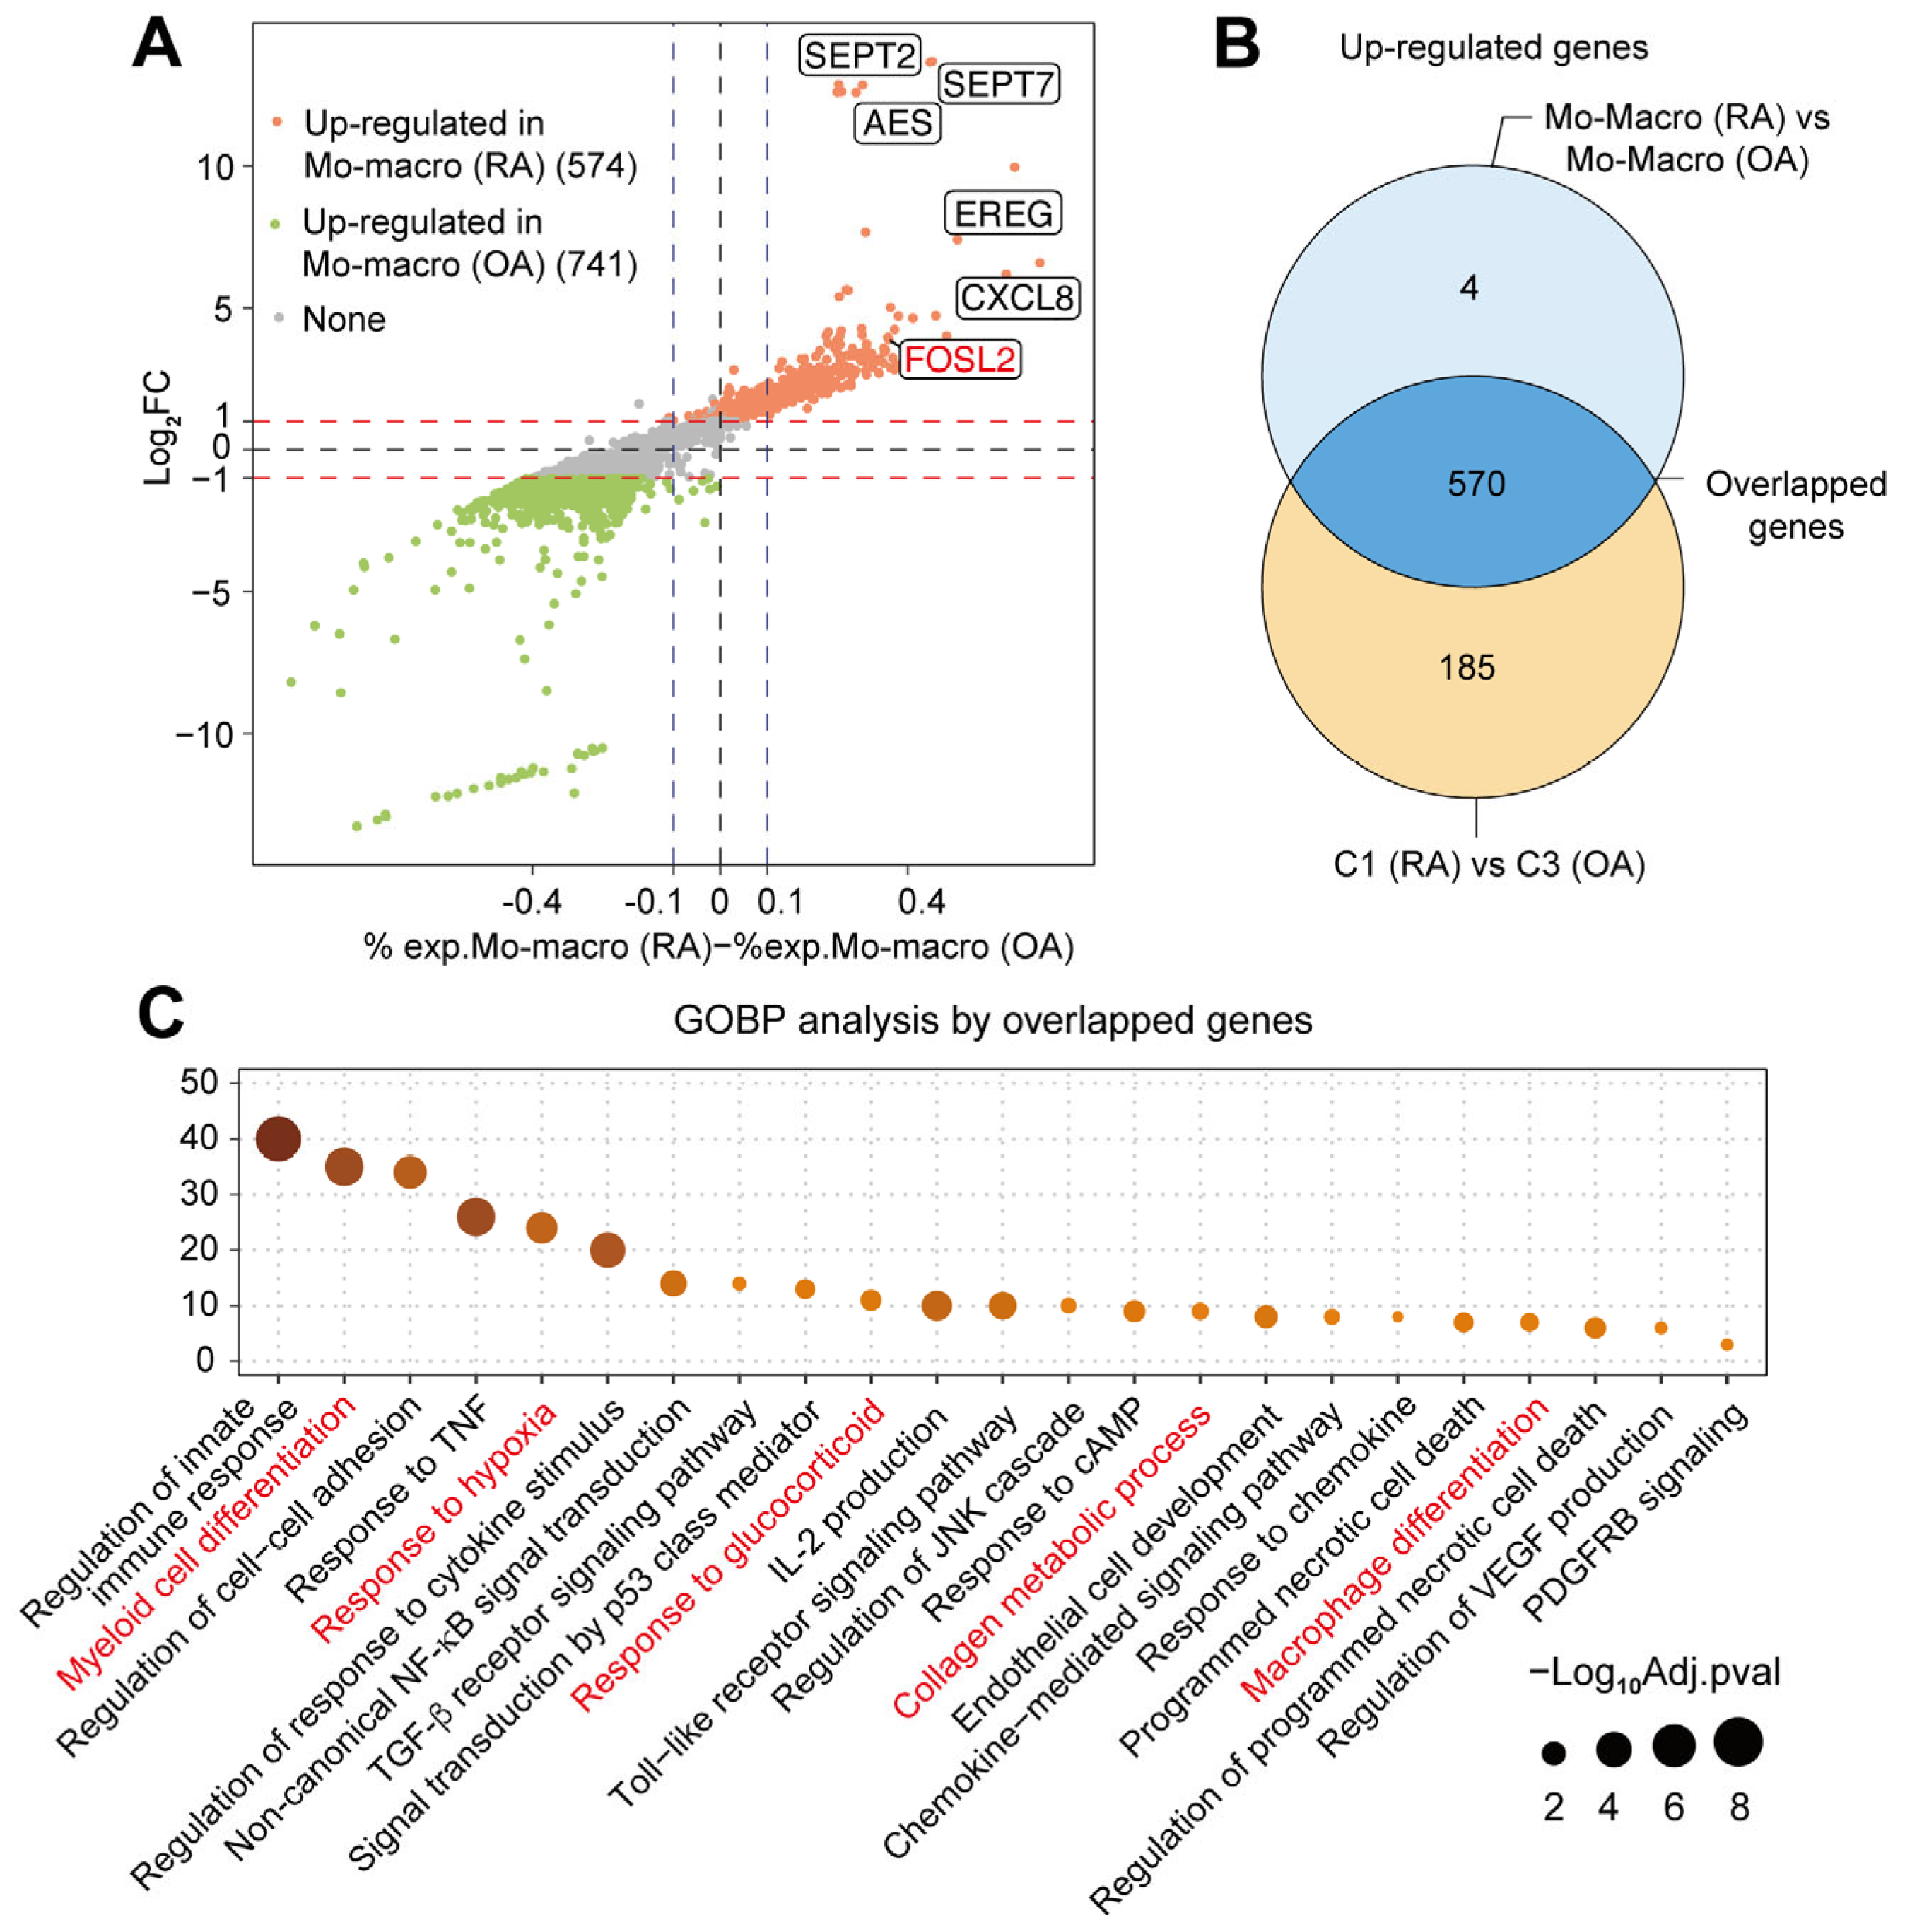
To quantify the contribution of the synovial C1 cluster to the overall transcriptional differences between RA and OA macrophages (as shown in Figure 3A), we compared C1 with the predominant OA cluster (C3). There were 755 up-regulated DEGs in C1, of which 570 overlapped with the 574 up-regulated DEGs identified between RA and OA macrophages, yielding an overlap rate of 99.30% (=570/574) (Figure 3B), suggesting that a large proportion of functional genes contributing to the overall genes of synovial RA macrophages were mainly from CXCL3+FOSL2+Mac (C1). These 570 overlapped genes were mainly enriched in the pathways related to inflammation, immunity, metabolism, tissue remodeling, and myeloid cell differentiation and development, with five of these pathways involving FOSL2 (Figure 3C). The enrichment of specific pathways suggests that CXCL3+FOSL2+Mac (C1) might contribute to the onset and progression of RA synovitis through multiple pathogenic mechanisms. Then, we merged the 570 up-regulated genes and defined them as the ‘CXCL3+FOSL2+Mac signature’ to represent the multiple functions of pro-inflammation, active metabolism, and cell differentiation of CXCL3+FOSL2+Mac.

2.5. CXCL3+FOSL2+Mac Signature Enrichment by a Bulk Level Validation

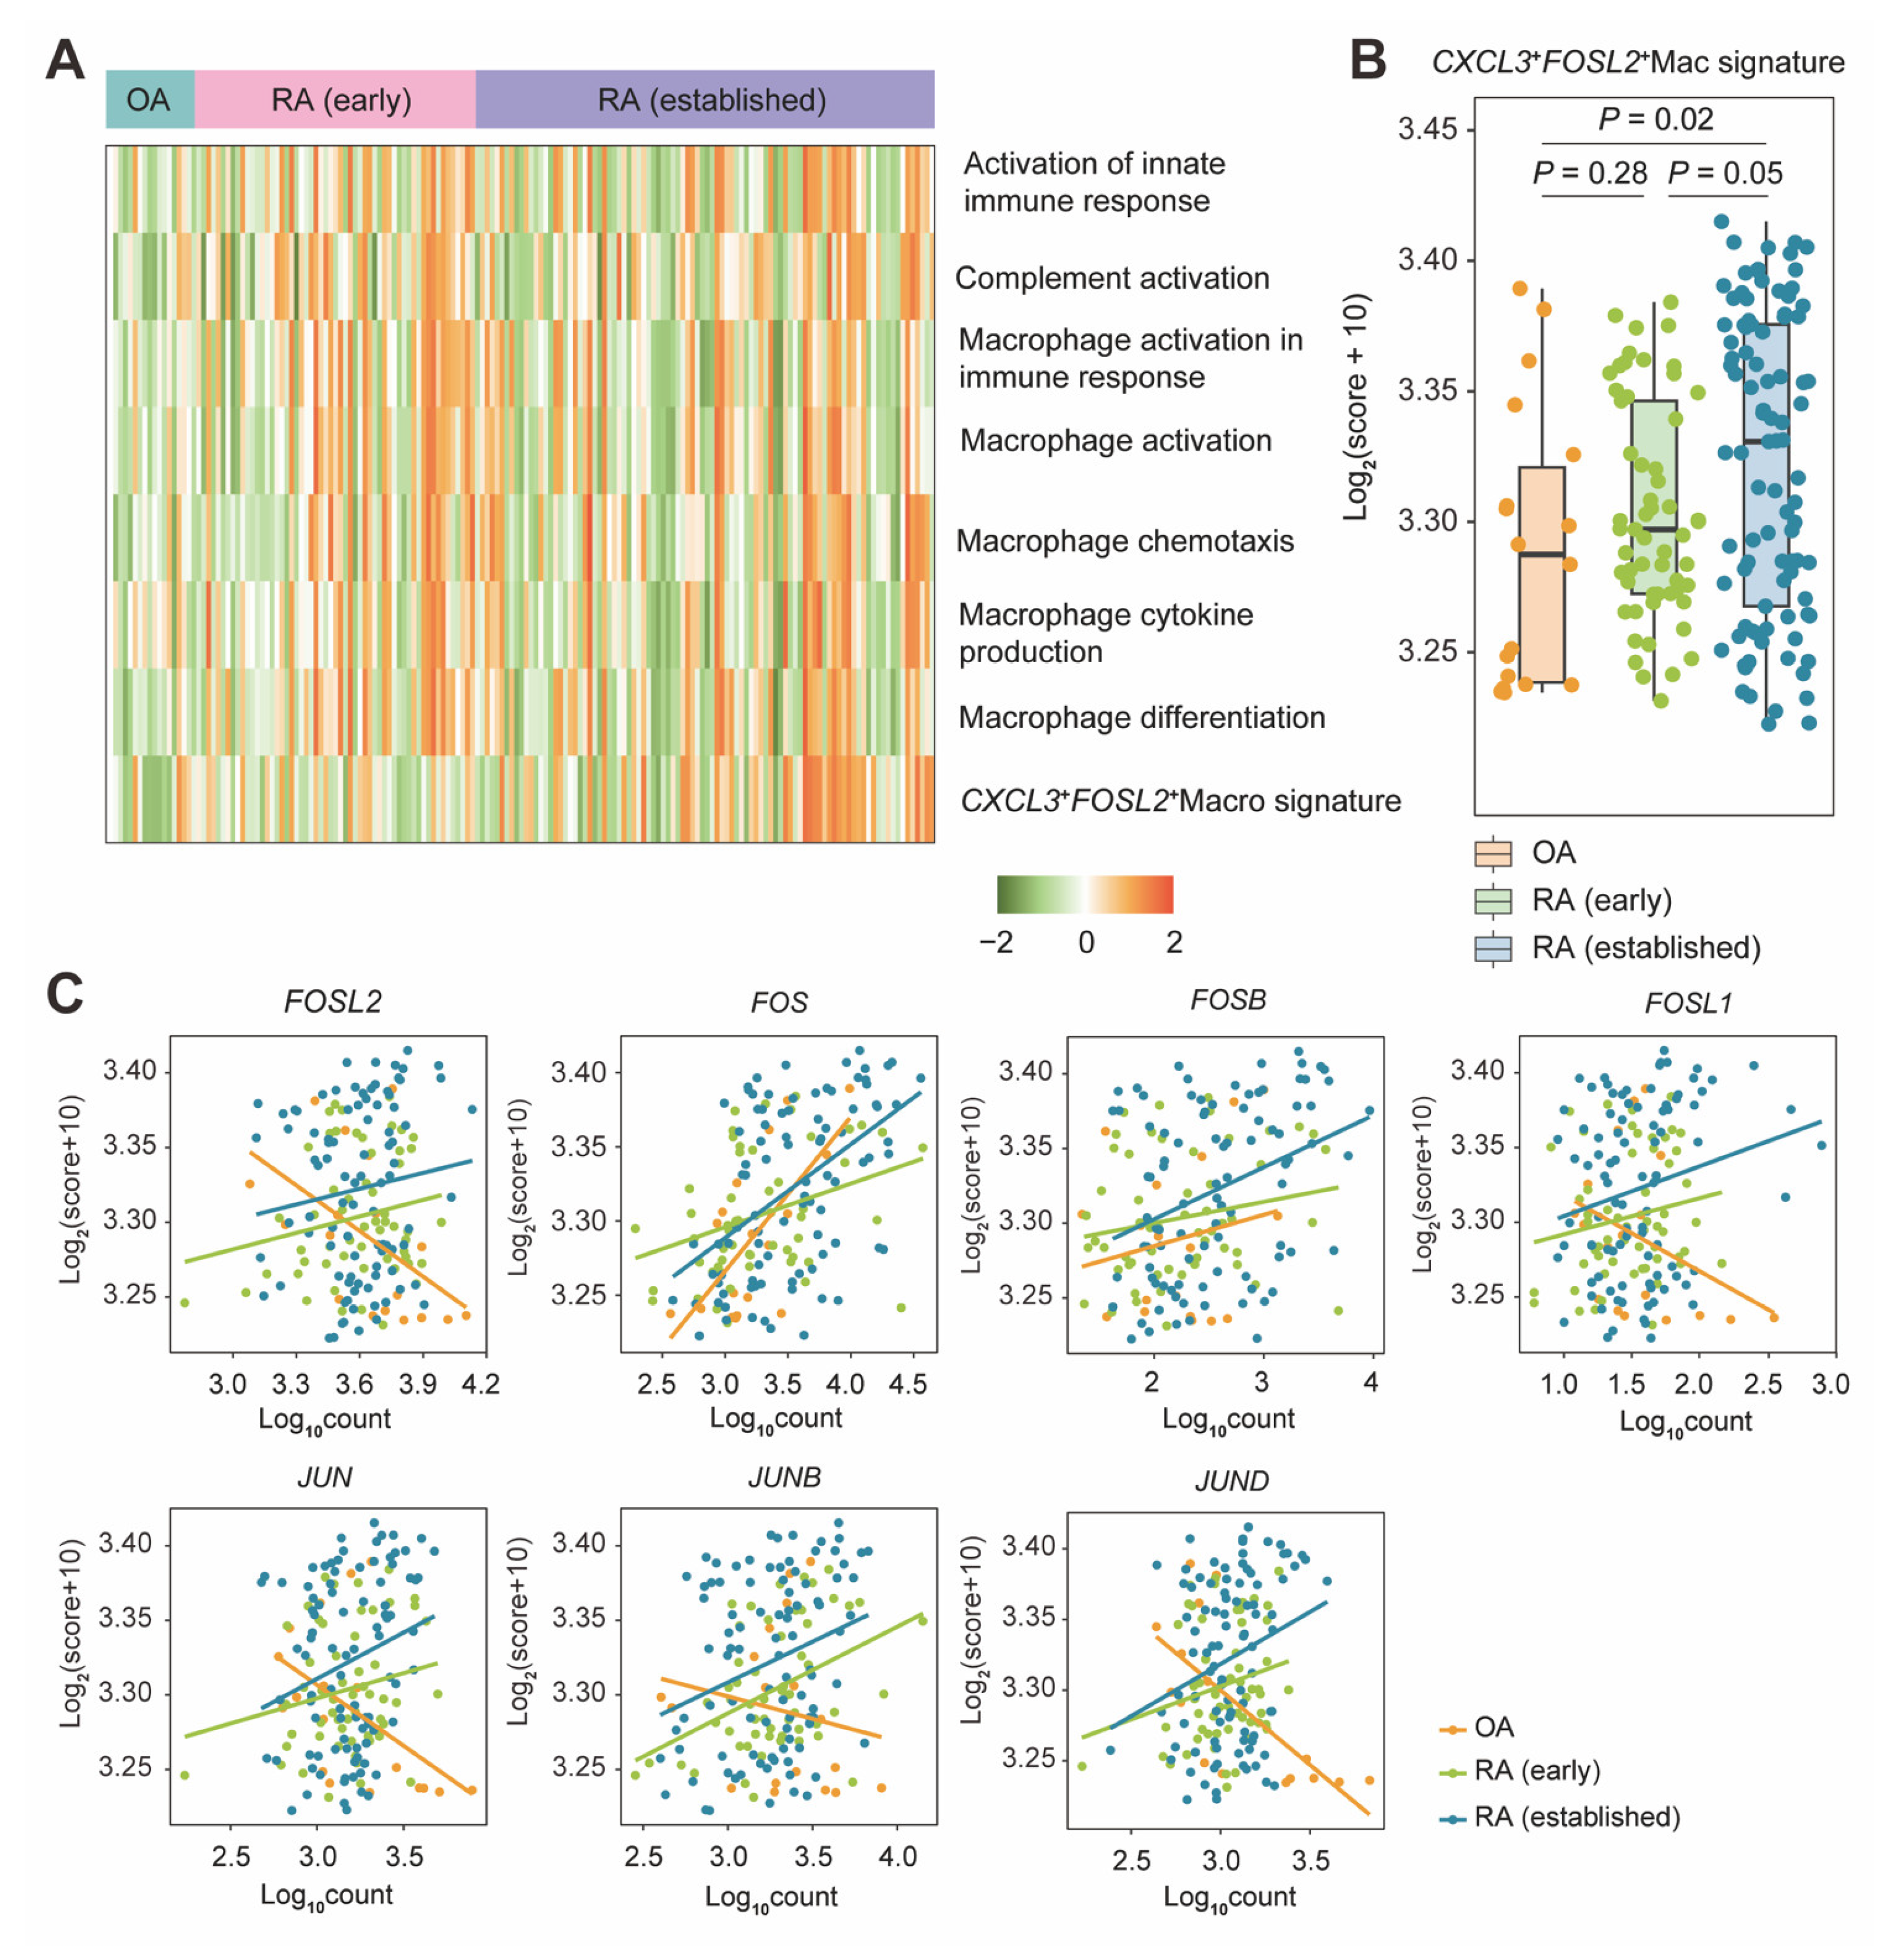
To further validate the pathway enrichment in a large sample and at a bulk level, the CXCL3+FOSL2+Mac signature and seven macrophage function-related pathways were applied on bulk counts of synovial tissues (GSE89408 in Table 2). Alongside macrophage function-related pathways, the CXCL3+FOSL2+Mac signature was more enriched in RA compared to OA (Figure 4A). Moreover, the enrichment score of the CXCL3+FOSL2+Mac signature in established RA was higher than those of RA in early status or OA (Figure 4B).
As for each AP-1 member, with the increasing expression count of FOSL2, FOSL1, JUN, JUNB, and JUND, the enrichment of the CXCL3+FOSL2+Mac signature was generally elevated in early RA and established RA, and OA conversely showed a negative association. But these three groups presented the same trend in the signature score when FOS and FOSB increased (Figure 4C). To sum up, the results suggest that the CXCL3+FOSL2+Mac signature was associated with the RA synovium of the late phase.

2.6. Validation by M1/M2 Pattern In Vitro

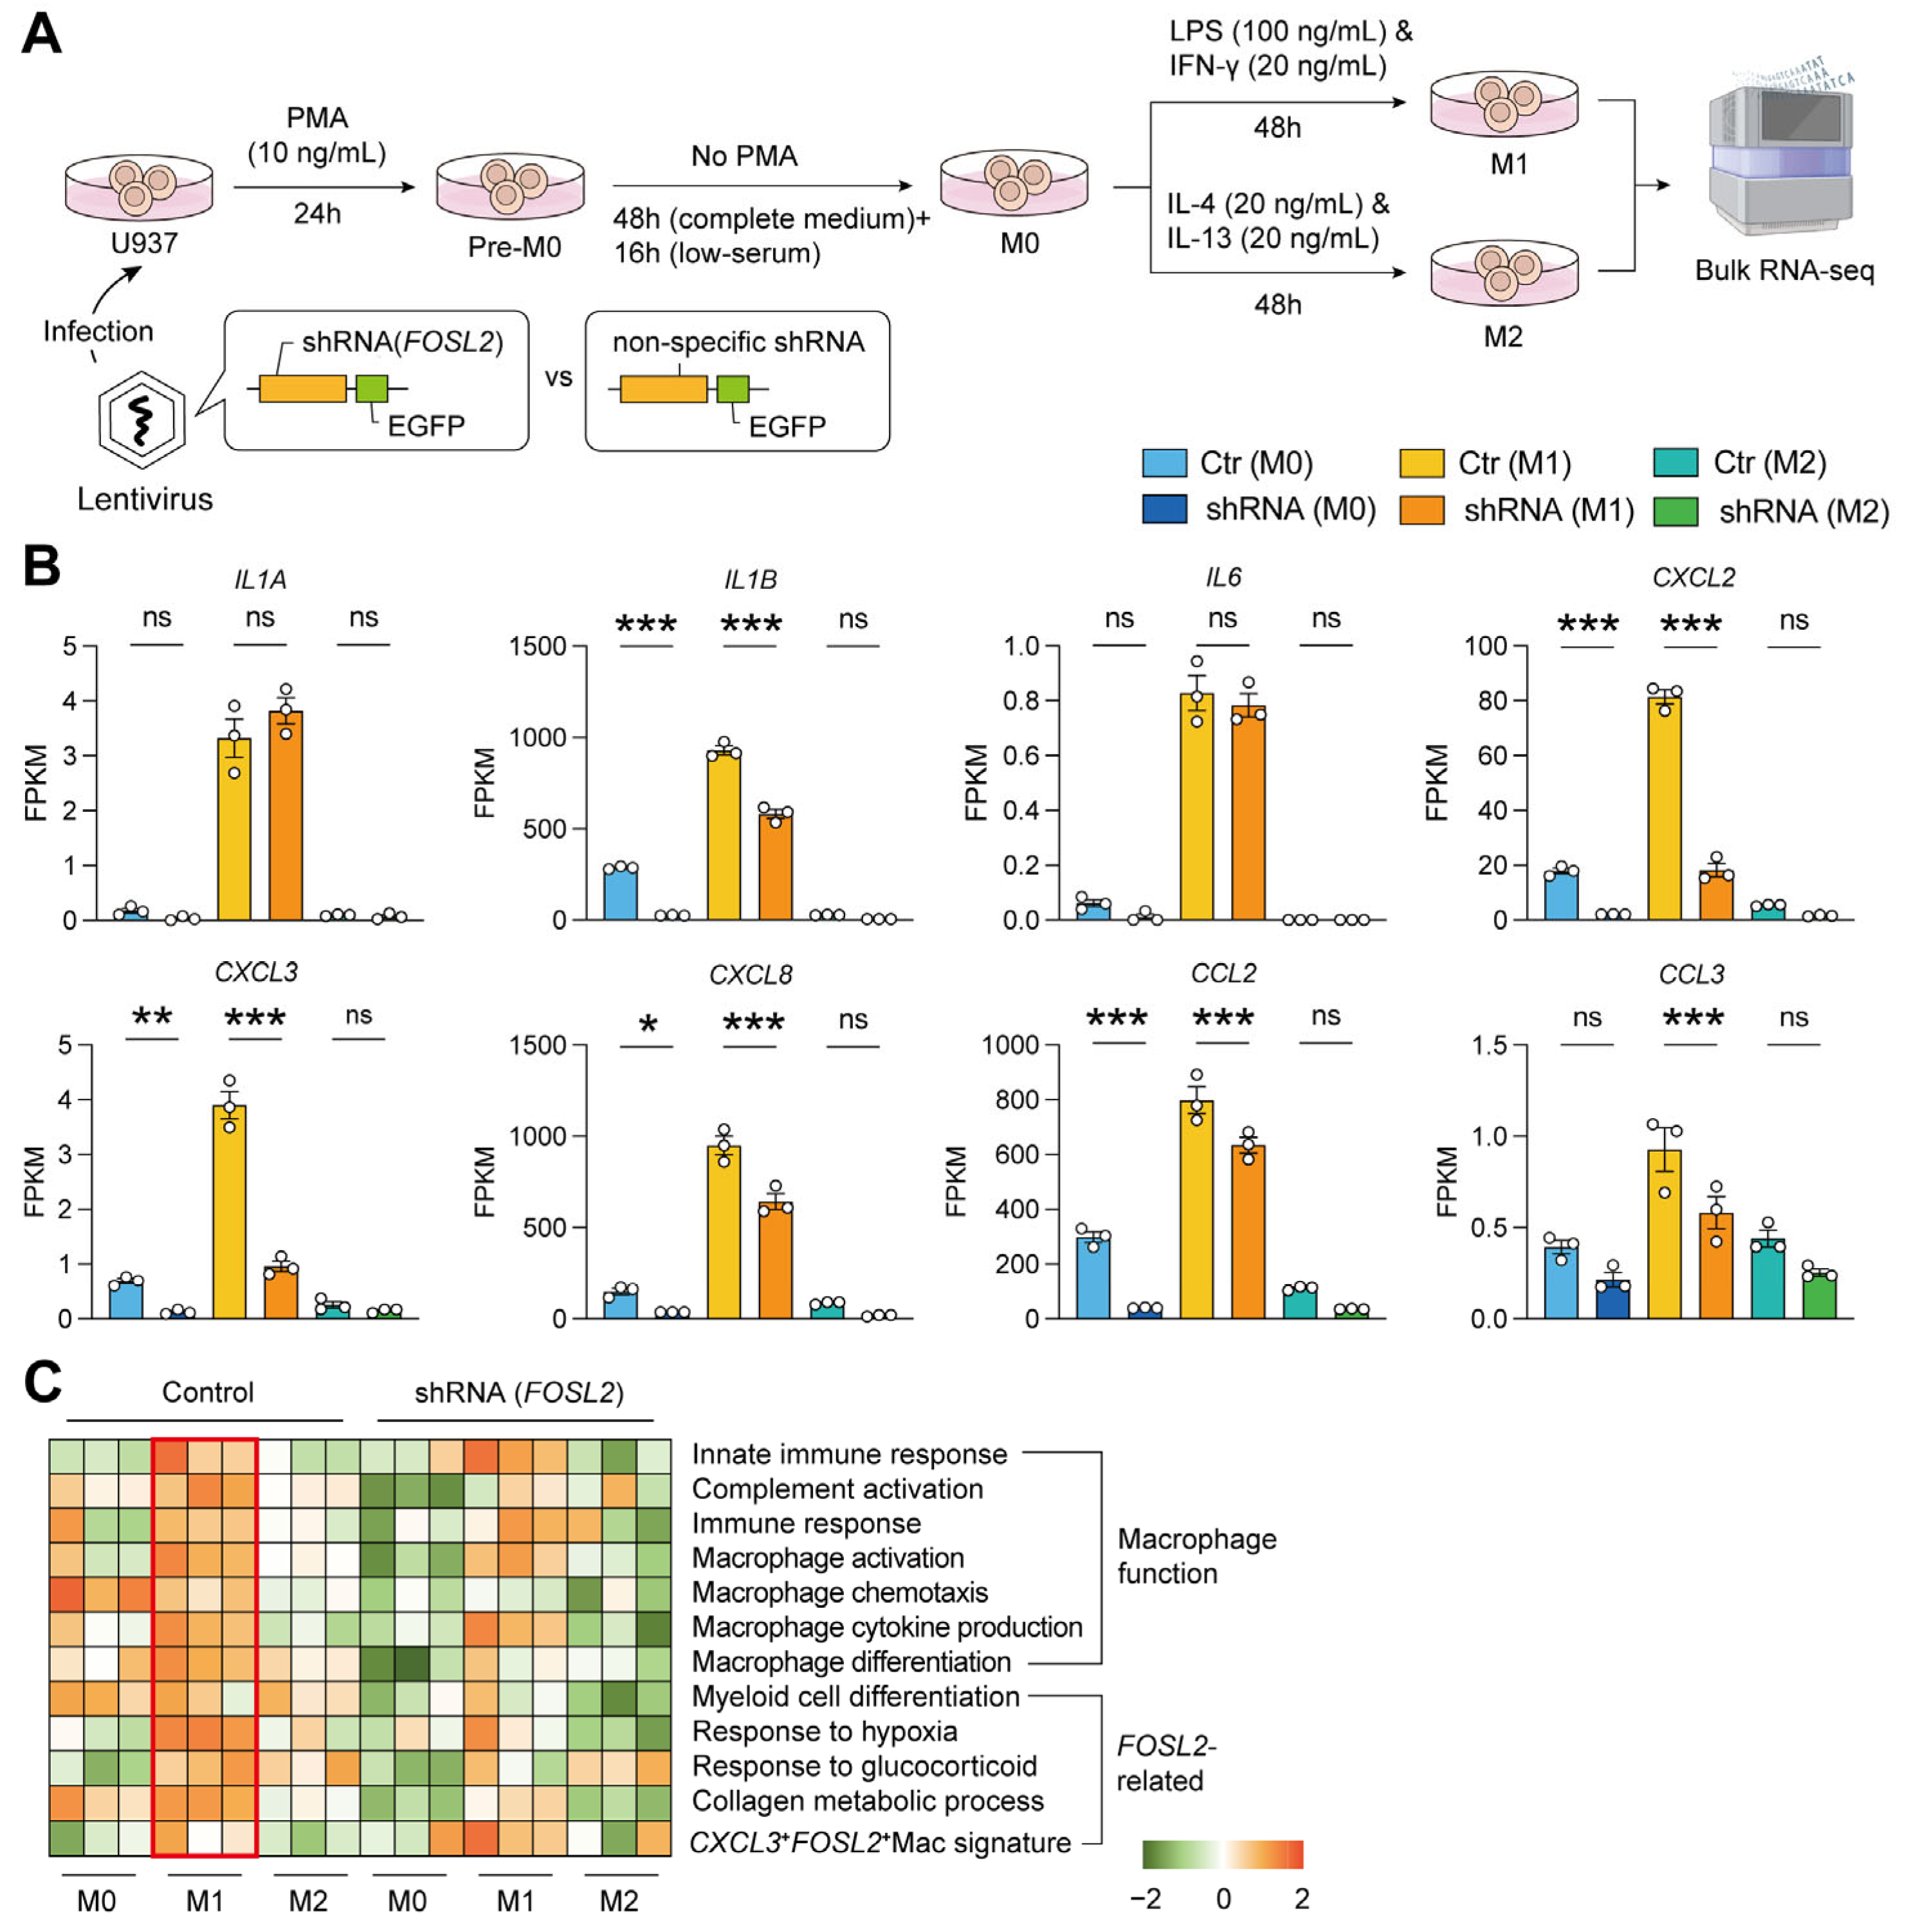
The above single-cell profile has shown that CXCL3+FOSL2+Mac was more similar to the pro-inflammatory macrophages (M1). Then, we knocked down FOSL2 in the U937 cell line and conducted macrophage polarization to explore the function of FOSL2 on the macrophages (Figure 5A). After the confirmation of M1/M2 phenotype by their characteristic markers (Figures S3 and S4) [21], we found that the expression of several M1 markers (IL1B, CXCL2, CXCL3, CXCL8, CCL2, and CCL3) significantly decreased in the M1 cells with the knockdown of FOSL2, while M2 showed a stably lower expression of these markers whether in non-treatment or knockdown of FOSL2 (Figure 5B). Within the M2 cells, the expression of some M2 markers (TGFB1, CXCR1, and CXCR2) similarly reduced but to a relatively small extent (Figure S5). In addition, after the knockdown of FOSL2, the expression of FOS and FOSB collaboratively decreased in the M1 (Figure S6).
To explore how the FOSL2-related pathways mentioned in Figure 3C changed after the knockdown of FOSL2, we compared the enrichment of functional gene sets among M0/M1/M2 cells with or without the knockdown of FOSL2. As shown in Figure 5C, the enrichment of certain FOSL2-related pathways (including myeloid cell differentiation, hypoxia response, and response to glucocorticoid) decreased in M1 cells alongside the knockdown of FOSL2, while most FOSL2-related pathways, as well as macrophage functions, were reserved or enriched in the M1 cells without FOSL2 knockdown. These results suggested that FOSL2 was closely associated with maintaining multiple functions of M1 cells.

2.7. CXCL3+FOSL2+Mac Interacted with ACKR1+Endothelium

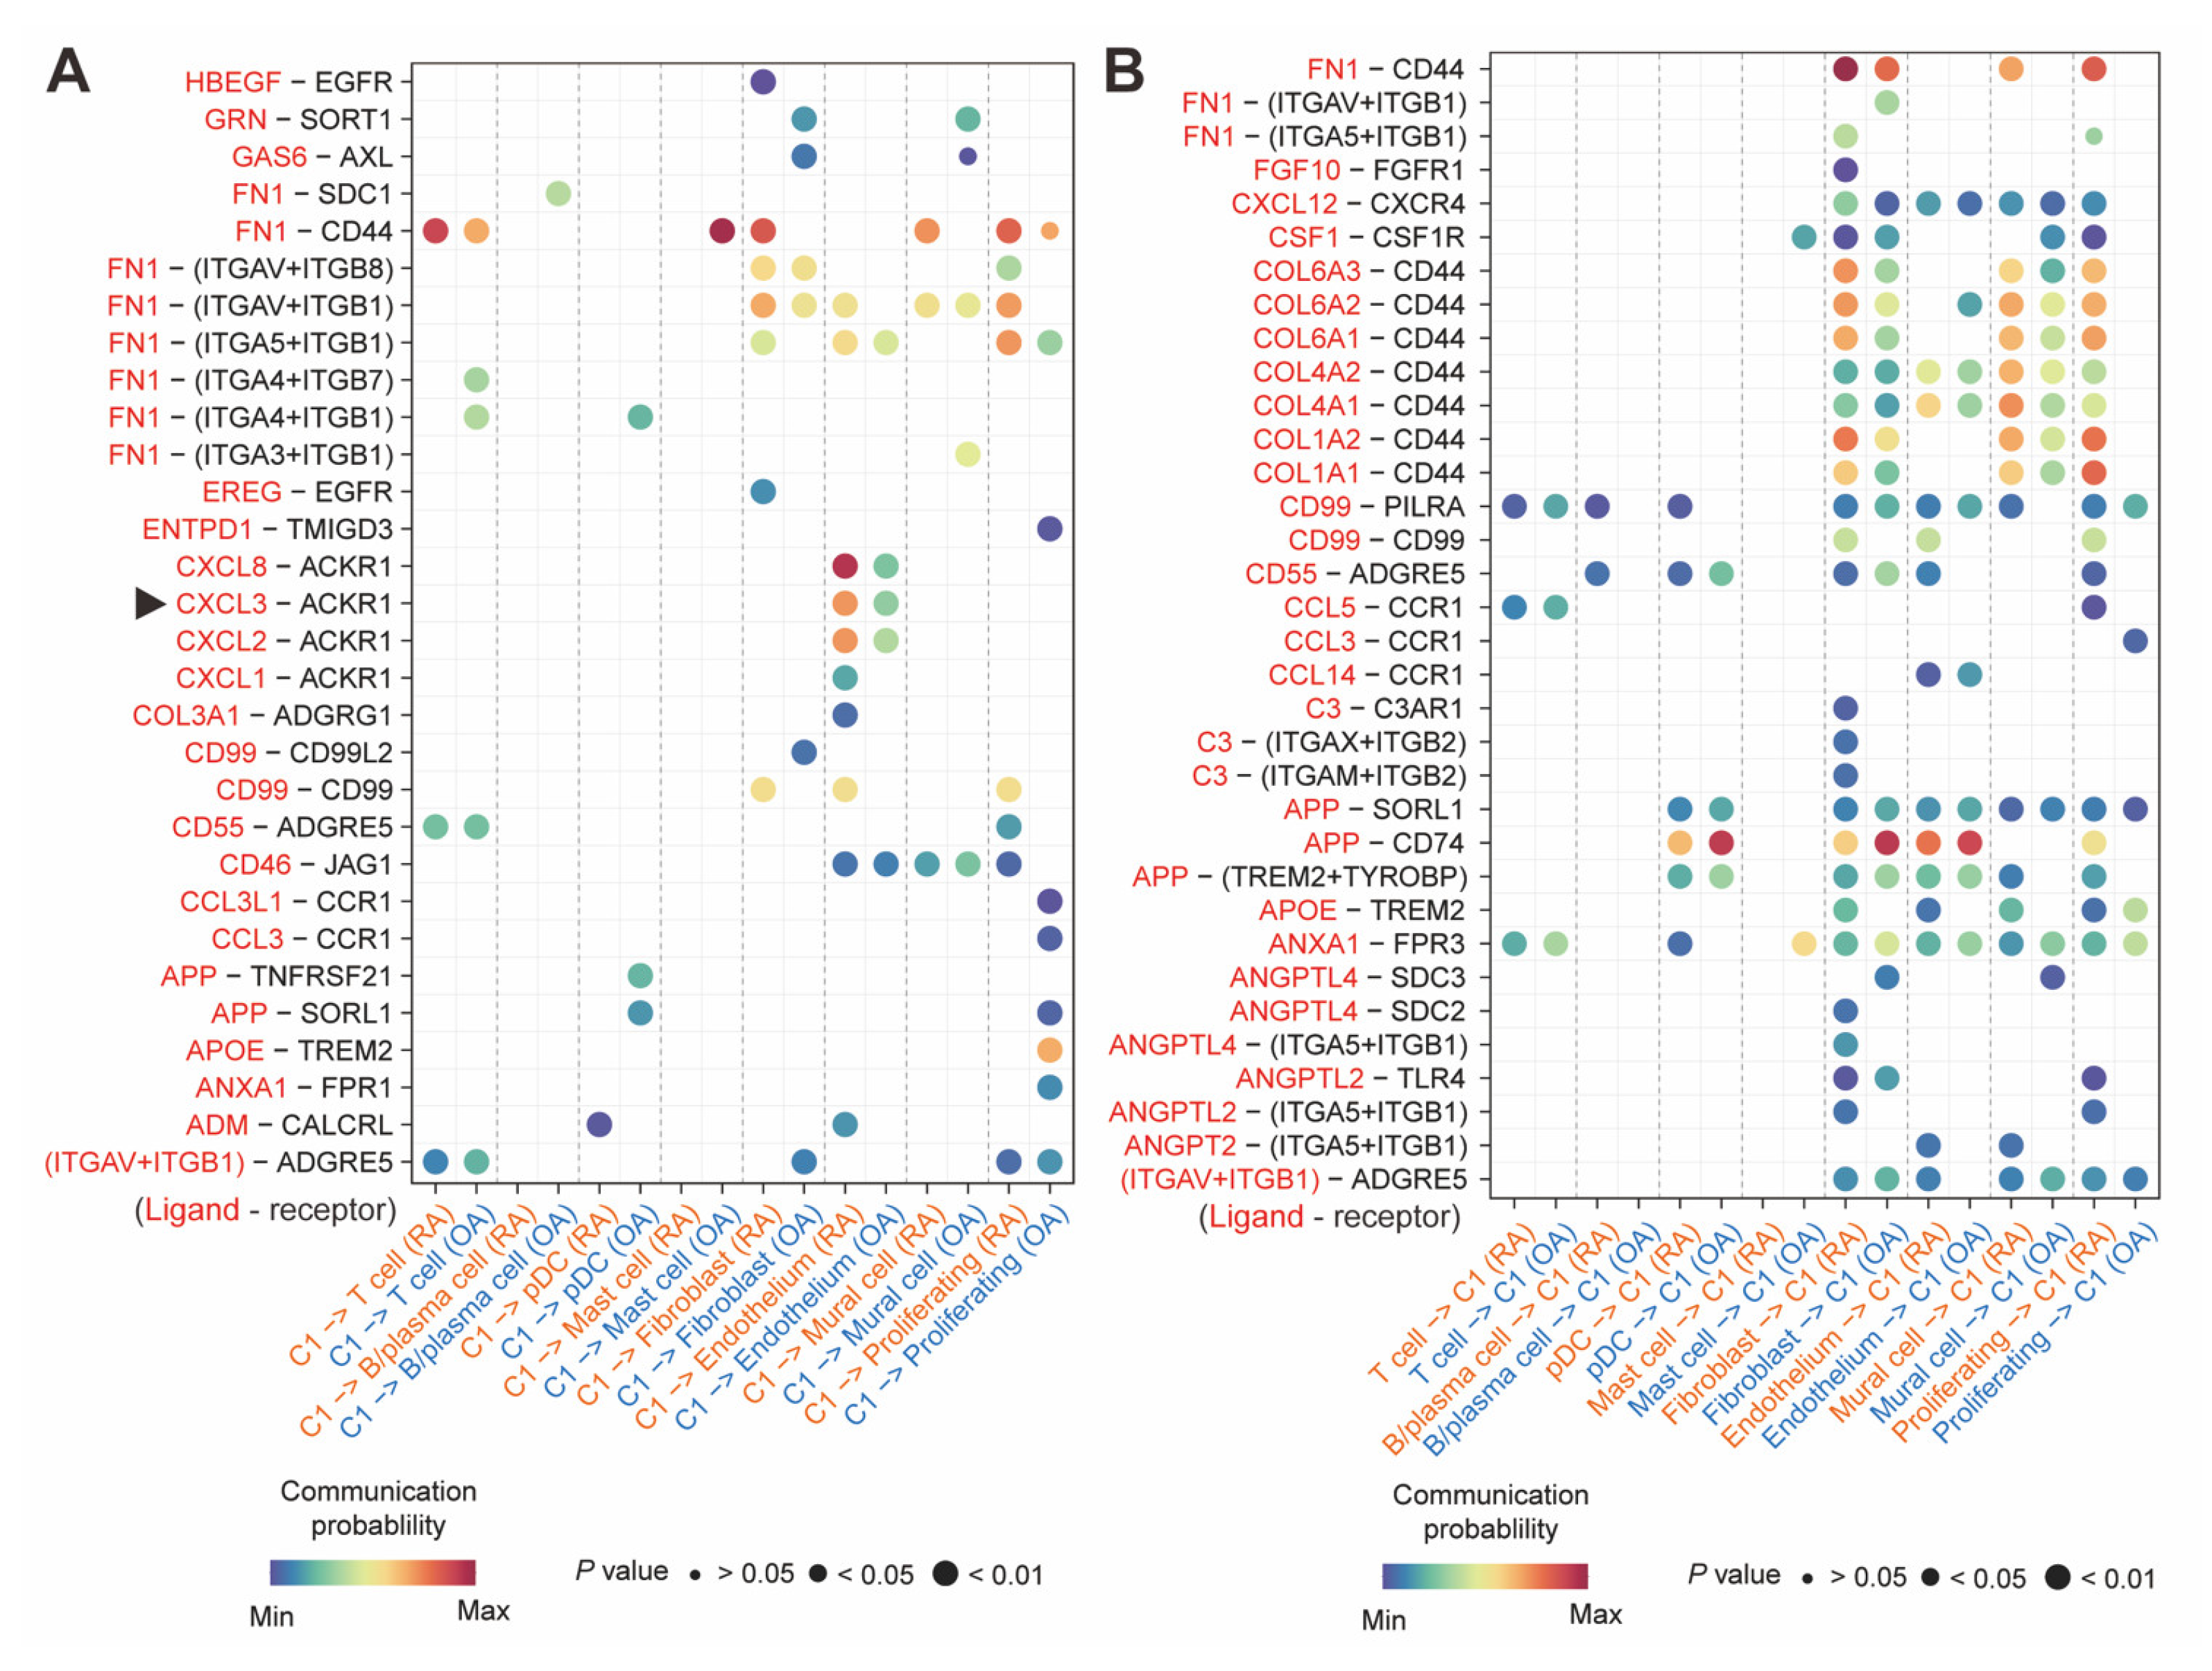
Apart from the intrinsic functions and signaling analysis, it was found that there were cellular interactions among CXCL3+FOSL2+Mac and other cell types in the inflammatory microenvironment. As shown in Figure 6A, compared to the OA, CXCL3+FOSL2+Mac (C1) of RA were more likely to interact with ECs via CXCL2, CXCL3, and CXCL8 as the ligands, and ACKR1 served as the receptors.
Conversely, when CXCL3+FOSL2+Mac (C1) served as the communication receivers, they exhibited enhanced ECM-receptor signaling from ECs, primarily involving communication pairs between collagen-related genes and CD44, such as COL4A1-CD44 and COL4A2-CD44 (Figure 6B). This mutual communication between CXCL3+FOSL2+Mac (C1) and ECs constituted the inflammatory microenvironment in the RA synovium. In addition, the ECM-receptor signaling involving collagen-related genes and CD44 was also manifested in the communications between CXCL3+FOSL2+Mac (C1) and fibroblasts, as well as mural cells and proliferating cells.

3. Discussion

In this study, we constructed a single-cell landscape of AP-1 expression across synovial cells from RA and observed that several AP-1 family members (including FOSL2, FOSB, and JUND) were highly enriched in the inflamed RA synovium. Of the synovial cells, we identified a distinct macrophage cluster characterized by elevated expression of CXCL3 and FOSL2, as well as several signatures related to M1-like pro-inflammation, active metabolism, and cell differentiation, further validated by bulk RNA-seq of a large-sample cohort. In vitro validation with FOSL2 knockdown in the monocyte cell line further demonstrated that the proinflammation by macrophages could be regulated by FOSL2. Moreover, this CXCL3+FOSL2+macrophage subset also exhibited interactions with ACKR1+ECs, which might facilitate the inflammation in the synovial microenvironment. These results suggest that synovial CXCL3+FOSL2+macrophages may be related to the inflammation in RA.
Consistent with the previous studies [22,23], a higher proportion of T cells, endothelial cells, and mural cells was observed in the RA synovium, reflecting T cell infiltration and pannus formation as characteristic pathological manifestations of RA. Interestingly, in spite of a relatively lower proportion of RA monocyte-macrophage lineage than that of OA, there remained an immunophenotypic divergence and macrophage heterogeneity within RA synovium; in particular, the pathways related to cell development, inflammation, and metabolism were significantly enriched in RA synovial macrophages. Similarly, Zhang et al. [14] found that pro-inflammatory phenotypes apparently occurred in the RA monocyte-macrophage lineage, even though there was no significant difference in monocyte counts between RA and OA. The study of Zheng [24] also showed an immunophenotypical bias toward pro-inflammatory macrophage subsets in active RA synovitis. Thus, there may exist an immunophenotypic divergence and macrophage diversity within the RA synovium, which suggests underlying special intrinsic gene expression profiles in RA synovial macrophages.
Indeed, the macrophages between RA and OA showed a significant difference in the gene expression profiles, especially some AP-1 family members, including FOSL2, FOSB, and JUND. Within the macrophage sub-clusters, FOSL2 and JUND—rather than FOSL1 or other AP-1 family members—were the predominant genes for distinguishing between RA and OA. Inconsistent with our study, Hannemann et al. [18] found that FRA1 (FOSL1) was an important transcription factor regulating metabolic activity in synovial macrophages among active RA. In contrast, our data demonstrated a higher expression of FOSL1 in fibroblasts and vasculatures but a sparse expression in certain macrophage sub-clusters in the RA synovium; while FOSL2 was predominantly expressed in the RA synovium, particularly in the distinct macrophage sub-cluster, CXCL3+Mac (C1). This subset highly expressed several M1 markers—demonstrating their potential for promoting inflammation—as well as FOSL2-related pathways related to immunity, metabolism, tissue remodeling, and myeloid cell differentiation. Previous studies have revealed that synovial macrophages are involved in pro-inflammation by cytokines or cell–cell interactions [15,25,26], metabolism regulations [27,28], differentiation [29], etc., but few have specifically linked FOSL2 to the functions of macrophages. Our findings emphasize that FOSL2 distinctively mediates the multiple pathogenic mechanisms of the synovial CXCL3+macrophage.
Meanwhile, the above results were further validated by the bulk RNA-seq transcriptome. In the large-sample cohort analysis, the gene signature linked to CXCL3+FOSL2+macrophages was closely associated with progressed RA synovitis, but not cases in an early-stage or healthy status. On the other hand, the pro-inflammatory activity of the CXCL3+FOSL2+macrophage subset was also confirmed to be related to FOSL2 by the experiments in vitro. We observed that expression of several M1 markers significantly decreased with FOSL2 knocked down. Gao and colleagues [30] similarly found that the inflammation by macrophages could be inhibited by FRA2 (FOSL2)-targeting medicine, and the latter had a therapeutic effect for RA-mimicking animal models. These findings support the notion that RA inflammation is primarily promoted by the M1-like pro-inflammation and multifunctional activity of the CXCL3+FOSL2+macrophage subset, which could be driven by FOSL2. Further experiments are needed to elucidate the precise mechanisms.
In addition to the intrinsic multifunction mediated by FOSL2, the CXCL3+FOSL2+Mac subset also exhibited potential interactions with the ACKR1+endothelium, with CXCL3 as the ligand. ACKR1 has been reported as a distinctive marker for ECs, especially the postcapillary veins [31], suggesting that the interaction between CXCL3+FOSL2+Mac and the ACKR1+endothelium concentrates in the postcapillary networks. This condition might facilitate the migration and spread of macrophages. A study by Girbl et al. [32] demonstrated that certain myeloid cells, such as neutrophils, relied on the conjunction between CXCL2 and ACKR1 to transmigrate through the vascular networks. Another study also found that rheumatoid synovial ECs could promote the trans-endothelial migration of monocytes [33]. Based on this, we hypothesize that synovial CXCL3+FOSL2+macrophages may similarly utilize the CXCL3-to-ACKR1 conjunction to migrate within the vascular pannus, thereby amplifying inflammation.
In addition, CXCL3+FOSL2+Mac and fibroblasts also presented strong communications in the RA synovitis. This close relationship mainly relied on the collagen-related ECM-receptor signaling. Previous studies have demonstrated that fibroblast-like synoviocyte (FLS) is a key effector of cells in RA synovitis and drives ECM remodeling via cytokines and proteases [34,35]. ECM formation by the fibroblasts might provide structural support for the adhesion and residence of the macrophages by CD44 [36]; meanwhile, some cytokines (such as tenascin-C, which activates TLR4 and sustains joint inflammation [37], and biglycan, which triggers TLR2/TLR4 signaling and TNF production [38]) presenting in the ECM might also promote the pro-inflammation of the macrophages. Thus, the relationship between CXCL3+FOSL2+Mac and fibroblasts, communicating via ECM-receptor signaling, is another possibility for RA synovitis.
There are some limitations in our study. First, healthy synovial tissues were not available due to the clinical restrictions in collecting samples from healthy donors and the unavailability of the shared data. As an alternative, we utilized synovial tissues from OA patients with mild knee pain, which are generally considered to present a low-inflammatory baseline. Second, our study primarily relied on bioinformatic analyses integrating scRNA-seq and bulk RNA-seq transcriptomic data. While these approaches provided valuable insights, further validation by multi-omics and animal experiments will be warranted to elucidate the underlying mechanisms via FOSL2 and the spatiotemporal dynamics of RA progression.

4. Materials and Methods

4.1. Single-Cell Transcriptome Data Processing

A public scRNA-seq dataset of synovial tissues was obtained, which included four patients with active RA under the accession number GSE200815 from the Gene Expression Omnibus (GEO) database [39]. Owing to the unavailability of synovial tissues of healthy donors, we selected four patients with osteoarthritis (OA) experiencing mild knee pain as the comparisons (GSE248455) [40] (Table 2).
Raw sequence data of these datasets were processed into gene expression matrices using Cellranger [v 8.0.1, 10x Genomics (Pleasanton, CA, USA)], with the human GRCh38 genome as the mapping reference. The gene expression matrices were analyzed using the Seurat R package (v5.2.1). The cells with a number of detected features between 200 and 5000 and a percentage of mitochondrial genes below 20% were retained; ultimately, a total number of 47,672 high-quality singlets were included. Normalization was performed to reduce the potential variance among all samples, and 5000 highly variable genes were generated. We scaled and dimensionally reduced the data by principal component analysis using the generated variable genes. Batch effects were minimized using the Harmony R package (v1.2.3). The top 50 significant principal components were selected for uniform manifold approximation and projection (UMAP), and the neighboring clusters were found by 50 principal components and a resolution of 0.3.

4.2. Cell Annotation

The FindMarkers function was used to compare each cluster to the resting state to find the differentially expressed genes (DEGs). We used the following canonical markers to identify the cell types: CD3E, CD3D, and CD3G for T cells; MS4A1, CD79A, and JCHAIN for B/plasma cells; CD163, MRC1, CD68, and CD14 for the monocyte-macrophage lineage; LILRA4, CLEC4C, and IL3RA for plasmacytoid dendritic cells (pDCs); MS4A2 and CPA3 for mast cells; PDGFRL, DCN, and PRG4 for fibroblasts; VWF and SELE for endothelial cells (ECs); MYH11, ACTA2 for mural cells; and MKI67 and TOP2A for proliferating cells.

4.3. Differentially Expressed Gene Detection

DEGs were detected using the FindMarkers function of the Seurat R package (v5.2.1), and the p values were calculated through the Wilcoxon rank sum test and adjusted using the Bonferroni correction. Logarithmical fold changes (FCs) of expression with two as the base for each gene showed the difference in gene expression of the specified groups compared to the comparisons, and each gene had an expression percentage in both the specified groups of cellular types and the compared ones. Genes were taken into the calculation when they were expressed in at least 25% of the dominant groups. Those genes with adjusted p-values of less than 0.01, average Log2FC of more than 1, and a difference in expression percentage of more than 0.1 were defined as the positive DEGs.

4.4. Gene Set Enrichment Analysis

The gene set enrichment analysis (GSEA) was performed using gseGO and gseKEGG functions [clusterProfiler R package (v4.10.1)] on the pathways from Biological Process of Gene Ontology (GOBP) and Kyoto Encyclopedia of Genes and Genomes (KEGG), respectively. Here, a list of genes was ranked according to their expression (namely, avg.log2FC), and the enrichment score would be calculated through the mapping of the gene sets onto the gene lists. The pathways inclined to enrich in RA if the values of the enrichment score were more than 1.0, while the values less than −1.0 showed that the pathways were enriched in OA. p values adjusted by Benjamini–Hochberg correction were considered statistically significant when they were less than 0.05.

4.5. GOBP Analysis

The DEGs for the clusters of interest were enriched using GOBP analysis, a way of analyzing the biological process of the genes to explore the functional genes. Here, we used the clusterProfiler (v4.10.1) based on the enrichGO function. p values were adjusted by the Benjamini–Hochberg correction.

4.6. Intercellular Communication

The intercellular communications between macrophage sub-clusters and other cell types were analyzed based on the Cellchat (v2.2.0) R package according to ligand-receptor pairs of three aspects, extracellular matrix (ECM)-receptor, secreted signaling, and cell–cell contact. Communication probability served as a measurement for evaluating the probability of communication signaling.

4.7. The Knockdown of FOSL2

We used U937 cells, a monocytic cell line, to conduct macrophage polarization in vitro, and knockdown FOSL2 to verify the function of the gene on macrophages. Briefly, lentiviral vectors carrying shRNA targeting FOSL2 (targeted sequencing, 5′-GCAGTGAGTATTGGAAGACTT-3′) and a non-specific shRNA control (target sequencing, 5′-CCTAAGGTTAAGTCGCCCTCG-3′) were constructed and provided by OBiO Technology (Shanghai, China). The recombinant vectors and the helper plasmids were co-transfected into 293T cells, and the lentiviral particles were prepared. The U937 cells in the logarithmic growth phase were infected by the lentiviral particles assembled with shRNA-FOSL2 and non-specific shRNA, with uninfected U937 cells as the control group. These three groups were all planted and amplified at the complete medium (RPMI 1640 supplemented with 10% FBS [Gibco, Thermo Fisher Scientific (Grand Island, NY, USA)] and 1% penicillin-streptomycin [Gibco, Thermo Fisher Scientific (Grand Island, NY, USA)], containing 1 μg/mL puromycin [InvivoGen (Toulouse, France)]). The cells were observed daily until the control group grew at an extremely low speed due to the screening by the puromycin. The shRNA-FOSL2 and non-specific shRNA groups were confirmed by the presence of green fluorescence and cultured in the puromycin-free medium. The U937 and 293T cell lines were obtained from Cell Bank of the Chinese Academy of Sciences (Shanghai, China).

4.8. Macrophage Polarization In Vitro (M1/M2 Pattern)

After the transfection, the transfected U937 cells in the shRNA-FOSL2 and non-specific shRNA groups were seeded at a density of 1 × 10⁶ cells/mL in complete medium. A quantity of 10 ng/mL phorbol-12-myristate-13-acetate (PMA) [MedChemExpress (Monmouth Junction, NJ, USA)] was added for stimulation for 24 h. After removing PMA, the cells in the pre-M0 status were cultured in PMA-free complete medium and low-serum medium for 48 h and 16 h in succession, after which the cells were induced into M0. M1 cells were induced from M0 by lipopolysaccharides (LPS) (100 ng/mL) [MedChemExpress (Monmouth Junction, NJ, USA)] and interferon-γ (20 ng/mL) [Peprotech (Rocky Hill, NJ, USA)] for 48 h. M2 were induced by IL-4 (20 ng/mL) [Peprotech (Rocky Hill, NJ, USA)] and IL-13 (20 ng/mL) [Peprotech (Rocky Hill, NJ, USA)] for 48 h. M0 treated by the same volume of phosphate-buffered saline (PBS) [Cytiva (Marlborough, MA, USA)] and for the same time was defined as the control group. Each group had three biological replicates.
The mRNAs of the M0/M1/M2 cells were extracted by TRIzol reagent [Invitrogen, Thermo Fisher Scientific (Carlsbad, CA, USA)] and were reverse-transcribed into cDNAs [Takara Bio Inc. (Kusatsu, Shiga, Japan)]. The cDNA libraries were sequenced with an Illumina NovaSeq 6000 (San Diego, CA, USA) with paired-end flow cells. Raw read quality was assessed using FastQC [41]. The raw sequencing data were transformed to fastq.gz format and were mapped into a matrix of expression counts using the human GRCh38 genome as the reference. Then, we used the non-redundant exon lengths as the lengths of the gene to calculate the fragments per kilobase of the transcript per million mapped reads (FPKM), which stand for the abundance level of the interested genes in the samples [42]. The FPKM of selected genes was used for the comparisons between different groups. The matrix of gene counts would be applied to the DEG comparison (by DESeq2 [v1.48.1] R package) and gene set variance analysis (by clusterProfiler [v4.10.1] R package).

4.9. The Analysis of Bulk Transcriptome Data

To validate gene expression and gene set enrichment of the scRNA transcriptome, we obtained a large-sample dataset of bulk transcriptome (GSE89408) from GEO [43]. We selected the raw gene counts matrix of synovial tissues from 18 patients diagnosed with OA, 57 with early RA, and 93 with established RA. We applied the CXCL3+FOSL2+macrophage signature and several macrophage-associated functional pathways (downloaded from the MsigDB database [44]) to the bulk gene count among three groups, using gene set variance analysis to explore the gene set enrichment at the level of individuals. The association between the enrichment score of specific pathways and the AP-1 count was calculated in order to explore the changed enrichment of the gene sets, along with AP-1 expression.

4.10. Statistical Analysis

All statistical analyses were conducted in R (v4.4.0). An independent samples t-test or one-way ANOVA was used to compare the difference between groups when the data type was in normal distributions; otherwise, the Mann–Whitney U test or the Kruskal–Wallis H test was used. A two-tailed p ≤ 0.05 was considered statistically significant.
Table 2. Accessibility of publicly shared datasets of synovial tissues enrolled in this study.
Dataset IDSequence TypesPlatformTissuesConstitution
GSE200815scRNA-seq (10x Genomics)Illumina NovaSeq 6000synovial tissuesFour RA with moderate to high disease activity *
GSE248455scRNA-seq (10x Genomics)Illumina NovaSeq 6000synovial tissuesFour OA with mild knee pain
GSE89408Bulk RNA-seqGPL11154 Illumina HiSeq 2000 (San Diego, CA, USA)synovial tissues18 OA, 57 early RA, and 93 established RA
* The RA patients naïve of treatment presented increased CRP and ESR levels and high DAS28 scores, suggesting moderate to high disease activity [39]. The OA patients with less pain presented advanced structural damage but with mild inflammatory changes. They were mainly treated with common analgesics [40]. Early RA: disease duration ≤ 12 months from diagnosis and DMARD-naïve. Established RA: disease duration > 12 months from diagnosis and prior DMARD or anti–TNF-α treatment [43]. Data-availability note: the original study reports 95 established RA cases, but the GEO gene-count matrix contains 93; therefore, n = 93 was used for bulk RNA-seq validation.

5. Conclusions

Our study uncovered a transcriptomic landscape of AP-1 expression by RA synovial cells, revealing that FOSL2, JUND, and FOSB were highly enriched in the inflamed synovium of RA. A unique macrophage cluster, CXCL3+FOSL2+macrophage, was related to pro-inflammation, active metabolism, and cell differentiation, as well as the interaction with the ACKR1+endothelium. These results suggested that synovial CXCL3+FOSL2+macrophage could mediate the immunophenotype divergence of RA synovitis. The findings provide insight into the understanding of the function of CXCL3+FOSL2+macrophages in how RA synovitis develops, which not only enhances our understanding of the cellular and transcriptional mechanisms underlying RA but also highlights FOSL2 as a potential therapeutic target for relieving synovial inflammation.

Supplementary Materials

The following supporting information can be downloaded at https://www.mdpi.com/article/10.3390/ijms26199718/s1.

Author Contributions

Y.W. and J.Y. contributed equally to this work. Conceptualization, Y.W., J.Y. and M.C.; Data curation, Y.W. and J.Y.; Formal analysis, Y.W. and J.Y.; Funding acquisition, X.C. and S.C.; Methodology, Y.W., J.Y. and M.C.; Project administration, X.C. and S.C.; Supervision, X.C. and S.C.; Validation, Y.W., J.Y. and M.C.; Writing—original draft, Y.W. and J.Y.; Writing—review and editing, M.C., X.C. and S.C. All authors have read and agreed to the published version of the manuscript.

Funding

This research was funded by the National Natural Science Foundation of China (81971534 for C.X.X., and No. 82402096 for C.S.), Shanghai Sailing Program (No. 24YF2725000 for C.S.), China Postdoctoral Science Foundation (No. 2024M762042 for C.S.), and Shanghai Pujiang Program (No. 24PJA073 for C.S.). The APC was funded by the National Natural Science Foundation of China (No. 82402096 for C.S.).

Institutional Review Board Statement

Not applicable.

Informed Consent Statement

Not applicable.

Data Availability Statement

The data analyzed in this study were mainly derived from publicly available resources: two single-cell RNA-seq datasets and one bulk RNA-seq dataset downloaded from the GEO database (accession numbers: GSE200815, GSE248455, and GSE89408). In addition, the bulk RNA-seq dataset generated from polarized U937 cells in this study has been deposited in the SRA database (accession number: PRJNA1309597).

Acknowledgments

We thank the GEO database for providing scRNA-seq and bulk RNA-seq data in this study.

Conflicts of Interest

The authors declare no conflicts of interest. The funders had no role in the design of the study; in the collection, analyses, or interpretation of data; in the writing of the manuscript; or in the decision to publish the results.

Abbreviations

The following abbreviations are used in this manuscript:
AP-1activator protein-1
DEGdifferentially expressed gene
ECendothelial cell
ECMextracellular matrix
FCfold change
FPKMfragments per kilobase of transcript per million mapped reads
GEOGene Expression Omnibus
GOBPBiological Process of Gene Ontology
GSEAgene set enrichment analysis
ILinterleukin
JAKJanus kinase
KEGGKyoto Encyclopedia of Genes and Genomes
OAosteoarthritis
pDCplasmacytoid dendritic cell
RArheumatoid arthritis
SMADsuppressor of mother against decapentaplegic
STATsignal transducers and activators of transcription
TNFtumor-necrosis factor
UMAPuniform manifold approximation and projection

References

  1. Smolen, J.S.; Aletaha, D.; McInnes, I.B. Rheumatoid arthritis. Lancet 2016, 388, 2023–2038. [Google Scholar] [CrossRef]
  2. Gravallese, E.M.; Firestein, G.S. Rheumatoid Arthritis—Common Origins, Divergent Mechanisms. N. Engl. J. Med. 2023, 388, 529–542. [Google Scholar] [CrossRef] [PubMed]
  3. Taylor, P.C.; Keystone, E.C.; van der Heijde, D.; Weinblatt, M.E.; Del Carmen Morales, L.; Reyes Gonzaga, J.; Yakushin, S.; Ishii, T.; Emoto, K.; Beattie, S.; et al. Baricitinib versus Placebo or Adalimumab in Rheumatoid Arthritis. N. Engl. J. Med. 2017, 376, 652–662. [Google Scholar] [CrossRef] [PubMed]
  4. Burmester, G.R.; Blanco, R.; Charles-Schoeman, C.; Wollenhaupt, J.; Zerbini, C.; Benda, B.; Gruben, D.; Wallenstein, G.; Krishnaswami, S.; Zwillich, S.H.; et al. Tofacitinib (CP-690,550) in combination with methotrexate in patients with active rheumatoid arthritis with an inadequate response to tumour necrosis factor inhibitors: A randomised phase 3 trial. Lancet 2013, 381, 451–460. [Google Scholar] [CrossRef]
  5. Elliott, M.J.; Maini, R.N.; Feldmann, M.; Kalden, J.R.; Antoni, C.; Smolen, J.S.; Leeb, B.; Breedveld, F.C.; Macfarlane, J.D.; Bijl, H.; et al. Randomised double-blind comparison of chimeric monoclonal antibody to tumour necrosis factor alpha (cA2) versus placebo in rheumatoid arthritis. Lancet 1994, 344, 1105–1110. [Google Scholar] [CrossRef]
  6. Emery, P.; Keystone, E.; Tony, H.P.; Cantagrel, A.; van Vollenhoven, R.; Sanchez, A.; Alecock, E.; Lee, J.; Kremer, J. IL-6 receptor inhibition with tocilizumab improves treatment outcomes in patients with rheumatoid arthritis refractory to anti-tumour necrosis factor biologicals: Results from a 24-week multicentre randomised placebo-controlled trial. Ann. Rheum. Dis. 2008, 67, 1516–1523. [Google Scholar] [CrossRef]
  7. Genovese, M.C.; Becker, J.C.; Schiff, M.; Luggen, M.; Sherrer, Y.; Kremer, J.; Birbara, C.; Box, J.; Natarajan, K.; Nuamah, I.; et al. Abatacept for rheumatoid arthritis refractory to tumor necrosis factor alpha inhibition. N. Engl. J. Med. 2005, 353, 1114–1123. [Google Scholar] [CrossRef]
  8. Zhang, F.; Jonsson, A.H.; Nathan, A.; Millard, N.; Curtis, M.; Xiao, Q.; Gutierrez-Arcelus, M.; Apruzzese, W.; Watts, G.F.M.; Weisenfeld, D.; et al. Deconstruction of rheumatoid arthritis synovium defines inflammatory subtypes. Nature 2023, 623, 616–624. [Google Scholar] [CrossRef]
  9. Wu, D.; Huang, Y.; Zhao, J.; Long, W.; Wang, B.; Wang, Y.; Chen, H.; Wu, R. Synovial macrophages drive severe joint destruction in established rheumatoid arthritis. Sci. Rep. 2025, 15, 12111. [Google Scholar] [CrossRef]
  10. Siouti, E.; Andreakos, E. The many facets of macrophages in rheumatoid arthritis. Biochem. Pharmacol. 2019, 165, 152–169. [Google Scholar] [CrossRef]
  11. Udalova, I.A.; Mantovani, A.; Feldmann, M. Macrophage heterogeneity in the context of rheumatoid arthritis. Nat. Rev. Rheumatol. 2016, 12, 472–485. [Google Scholar] [CrossRef]
  12. Hanlon, M.M.; Smith, C.M.; Canavan, M.; Neto, N.G.B.; Song, Q.; Lewis, M.J.; O’Rourke, A.M.; Tynan, O.; Barker, B.E.; Gallagher, P.; et al. Loss of synovial tissue macrophage homeostasis precedes rheumatoid arthritis clinical onset. Sci. Adv. 2024, 10, eadj1252. [Google Scholar] [CrossRef]
  13. Wu, X.; Liu, Y.; Jin, S.; Wang, M.; Jiao, Y.; Yang, B.; Lu, X.; Ji, X.; Fei, Y.; Yang, H.; et al. Single-cell sequencing of immune cells from anticitrullinated peptide antibody positive and negative rheumatoid arthritis. Nat. Commun. 2021, 12, 4977. [Google Scholar] [CrossRef]
  14. Zhang, F.; Wei, K.; Slowikowski, K.; Fonseka, C.Y.; Rao, D.A.; Kelly, S.; Goodman, S.M.; Tabechian, D.; Hughes, L.B.; Salomon-Escoto, K.; et al. Defining inflammatory cell states in rheumatoid arthritis joint synovial tissues by integrating single-cell transcriptomics and mass cytometry. Nat. Immunol. 2019, 20, 928–942. [Google Scholar] [CrossRef] [PubMed]
  15. Alivernini, S.; MacDonald, L.; Elmesmari, A.; Finlay, S.; Tolusso, B.; Gigante, M.R.; Petricca, L.; Di Mario, C.; Bui, L.; Perniola, S.; et al. Distinct synovial tissue macrophage subsets regulate inflammation and remission in rheumatoid arthritis. Nat. Med. 2020, 26, 1295–1306. [Google Scholar] [CrossRef] [PubMed]
  16. Wagner, E.F. AP-1--Introductory remarks. Oncogene 2001, 20, 2334–2335. [Google Scholar] [CrossRef] [PubMed]
  17. Chinenov, Y.; Kerppola, T.K. Close encounters of many kinds: Fos-Jun interactions that mediate transcription regulatory specificity. Oncogene 2001, 20, 2438–2452. [Google Scholar] [CrossRef]
  18. Hannemann, N.; Cao, S.; Eriksson, D.; Schnelzer, A.; Jordan, J.; Eberhardt, M.; Schleicher, U.; Rech, J.; Ramming, A.; Uebe, S.; et al. Transcription factor Fra-1 targets arginase-1 to enhance macrophage-mediated inflammation in arthritis. J. Clin. Investig. 2019, 129, 2669–2684. [Google Scholar] [CrossRef]
  19. Hosoya, T.; Saito, T.; Baba, H.; Tanaka, N.; Noda, S.; Komiya, Y.; Tagawa, Y.; Yamamoto, A.; Mizoguchi, F.; Kawahata, K.; et al. Chondroprotective effects of CDK4/6 inhibition via enhanced ubiquitin-dependent degradation of JUN in synovial fibroblasts. Rheumatology 2022, 61, 3427–3438. [Google Scholar] [CrossRef]
  20. Cai, M.; Li, Z.; Wen, X.; Jin, H.; Li, Y.; Wu, H.; Yang, C.; Chen, Z. C3a-C3aR1-mediated interactions between fibroblast-like synoviocytes and macrophages promote the progression of rheumatoid arthritis. Arthritis Rheumatol. 2025. Epub ahead of print. [Google Scholar] [CrossRef]
  21. Mantovani, A.; Sozzani, S.; Locati, M.; Allavena, P.; Sica, A. Macrophage polarization: Tumor-associated macrophages as a paradigm for polarized M2 mononuclear phagocytes. Trends Immunol. 2002, 23, 549–555. [Google Scholar] [CrossRef]
  22. Li, J.; Liu, P.; Huang, Y.; Wang, Y.; Zhao, J.; Xiong, Z.; Liu, M.; Wu, R. Immunophenotypic Landscape of synovial tissue in rheumatoid arthritis: Insights from ACPA status. Heliyon 2024, 10, e34088. [Google Scholar] [CrossRef]
  23. Jang, S.; Kwon, E.J.; Lee, J.J. Rheumatoid Arthritis: Pathogenic Roles of Diverse Immune Cells. Int. J. Mol. Sci. 2022, 23, 905. [Google Scholar] [CrossRef] [PubMed]
  24. Zheng, L.; Gu, M.; Li, X.; Hu, X.; Chen, C.; Kang, Y.; Pan, B.; Chen, W.; Xian, G.; Wu, X.; et al. ITGA5(+) synovial fibroblasts orchestrate proinflammatory niche formation by remodelling the local immune microenvironment in rheumatoid arthritis. Ann. Rheum. Dis. 2025, 84, 232–252. [Google Scholar] [CrossRef] [PubMed]
  25. Tak, P.P.; Smeets, T.J.; Daha, M.R.; Kluin, P.M.; Meijers, K.A.; Brand, R.; Meinders, A.E.; Breedveld, F.C. Analysis of the synovial cell infiltrate in early rheumatoid synovial tissue in relation to local disease activity. Arthritis Rheum. 1997, 40, 217–225. [Google Scholar] [CrossRef] [PubMed]
  26. Zec, K.; Schonfeldova, B.; Ai, Z.; Van Grinsven, E.; Pirgova, G.; Eames, H.L.; Berthold, D.L.; Attar, M.; Compeer, E.B.; Arnon, T.I.; et al. Macrophages in the synovial lining niche initiate neutrophil recruitment and articular inflammation. J. Exp. Med. 2023, 220, e20220595. [Google Scholar] [CrossRef]
  27. Fearon, U.; Canavan, M.; Biniecka, M.; Veale, D.J. Hypoxia, mitochondrial dysfunction and synovial invasiveness in rheumatoid arthritis. Nat. Rev. Rheumatol. 2016, 12, 385–397. [Google Scholar] [CrossRef]
  28. Saeki, N.; Imai, Y. Reprogramming of synovial macrophage metabolism by synovial fibroblasts under inflammatory conditions. Cell Commun. Signal 2020, 18, 188. [Google Scholar] [CrossRef]
  29. Danks, L.; Sabokbar, A.; Gundle, R.; Athanasou, N.A. Synovial macrophage-osteoclast differentiation in inflammatory arthritis. Ann. Rheum. Dis. 2002, 61, 916–921. [Google Scholar] [CrossRef]
  30. Gao, P.; Yuan, S.; Wang, Y.; Wang, Y.; Li, X.; Liu, T.; Zheng, Y.; Wang, J.; Liu, D.; Xu, L.; et al. Corydalis decumbens and tetrahydropalmatrubin inhibit macrophages inflammation to relieve rheumatoid arthritis by targeting Fosl2. J. Ethnopharmacol. 2025, 341, 119348. [Google Scholar] [CrossRef]
  31. Huang, M.; Tabib, T.; Khanna, D.; Assassi, S.; Domsic, R.; Lafyatis, R. Single-cell transcriptomes and chromatin accessibility of endothelial cells unravel transcription factors associated with dysregulated angiogenesis in systemic sclerosis. Ann. Rheum. Dis. 2024, 83, 1335–1344. [Google Scholar] [CrossRef]
  32. Girbl, T.; Lenn, T.; Perez, L.; Rolas, L.; Barkaway, A.; Thiriot, A.; Del Fresno, C.; Lynam, E.; Hub, E.; Thelen, M.; et al. Distinct Compartmentalization of the Chemokines CXCL1 and CXCL2 and the Atypical Receptor ACKR1 Determine Discrete Stages of Neutrophil Diapedesis. Immunity 2018, 49, 1062–1076.e1066. [Google Scholar] [CrossRef] [PubMed]
  33. Nakano, K.; Okada, Y.; Saito, K.; Tanikawa, R.; Sawamukai, N.; Sasaguri, Y.; Kohro, T.; Wada, Y.; Kodama, T.; Tanaka, Y. Rheumatoid synovial endothelial cells produce macrophage colony-stimulating factor leading to osteoclastogenesis in rheumatoid arthritis. Rheumatology 2007, 46, 597–603. [Google Scholar] [CrossRef] [PubMed]
  34. Bartok, B.; Firestein, G.S. Fibroblast-like synoviocytes: Key effector cells in rheumatoid arthritis. Immunol. Rev. 2010, 233, 233–255. [Google Scholar] [CrossRef] [PubMed]
  35. Nemeth, T.; Nagy, G.; Pap, T. Synovial fibroblasts as potential drug targets in rheumatoid arthritis, where do we stand and where shall we go? Ann. Rheum. Dis. 2022, 81, 1055–1064. [Google Scholar] [CrossRef]
  36. Sutherland, T.E.; Dyer, D.P.; Allen, J.E. The extracellular matrix and the immune system: A mutually dependent relationship. Science 2023, 379, eabp8964. [Google Scholar] [CrossRef]
  37. Midwood, K.; Sacre, S.; Piccinini, A.M.; Inglis, J.; Trebaul, A.; Chan, E.; Drexler, S.; Sofat, N.; Kashiwagi, M.; Orend, G.; et al. Tenascin-C is an endogenous activator of Toll-like receptor 4 that is essential for maintaining inflammation in arthritic joint disease. Nat. Med. 2009, 15, 774–780. [Google Scholar] [CrossRef]
  38. Schaefer, L.; Babelova, A.; Kiss, E.; Hausser, H.J.; Baliova, M.; Krzyzankova, M.; Marsche, G.; Young, M.F.; Mihalik, D.; Gotte, M.; et al. The matrix component biglycan is proinflammatory and signals through Toll-like receptors 4 and 2 in macrophages. J. Clin. Investig. 2005, 115, 2223–2233. [Google Scholar] [CrossRef]
  39. Floudas, A.; Smith, C.M.; Tynan, O.; Neto, N.; Krishna, V.; Wade, S.M.; Hanlon, M.; Cunningham, C.; Marzaioli, V.; Canavan, M.; et al. Distinct stromal and immune cell interactions shape the pathogenesis of rheumatoid and psoriatic arthritis. Ann. Rheum. Dis. 2022, 81, 1224–1242. [Google Scholar] [CrossRef]
  40. Philpott, H.T.; Birmingham, T.B.; Blackler, G.; Klapak, J.D.; Knights, A.J.; Farrell, E.C.; Fiset, B.; Walsh, L.A.; Giffin, J.R.; Vasarhelyi, E.M.; et al. Association of Synovial Innate Immune Exhaustion with Worse Pain in Knee Osteoarthritis. Arthritis Rheumatol. 2025, 77, 664–676. [Google Scholar] [CrossRef]
  41. Nascimento, C.R.; Rodrigues Fernandes, N.A.; Gonzalez Maldonado, L.A.; Junior, C.R. Comparison of monocytic cell lines U937 and THP-1 as macrophage models for in vitro studies. Biochem. Biophys. Rep. 2022, 32, 101383. [Google Scholar] [CrossRef]
  42. Trapnell, C.; Williams, B.A.; Pertea, G.; Mortazavi, A.; Kwan, G.; van Baren, M.J.; Salzberg, S.L.; Wold, B.J.; Pachter, L. Transcript assembly and quantification by RNA-Seq reveals unannotated transcripts and isoform switching during cell differentiation. Nat. Biotechnol. 2010, 28, 511–515. [Google Scholar] [CrossRef]
  43. Guo, Y.; Walsh, A.M.; Fearon, U.; Smith, M.D.; Wechalekar, M.D.; Yin, X.; Cole, S.; Orr, C.; McGarry, T.; Canavan, M.; et al. CD40L-Dependent Pathway Is Active at Various Stages of Rheumatoid Arthritis Disease Progression. J. Immunol. 2017, 198, 4490–4501. [Google Scholar] [CrossRef]
  44. Liberzon, A.; Subramanian, A.; Pinchback, R.; Thorvaldsdóttir, H.; Tamayo, P.; Mesirov, J.P. Molecular signatures database (MSigDB) 3.0. Bioinformatics 2011, 27, 1739–1740. [Google Scholar] [CrossRef]
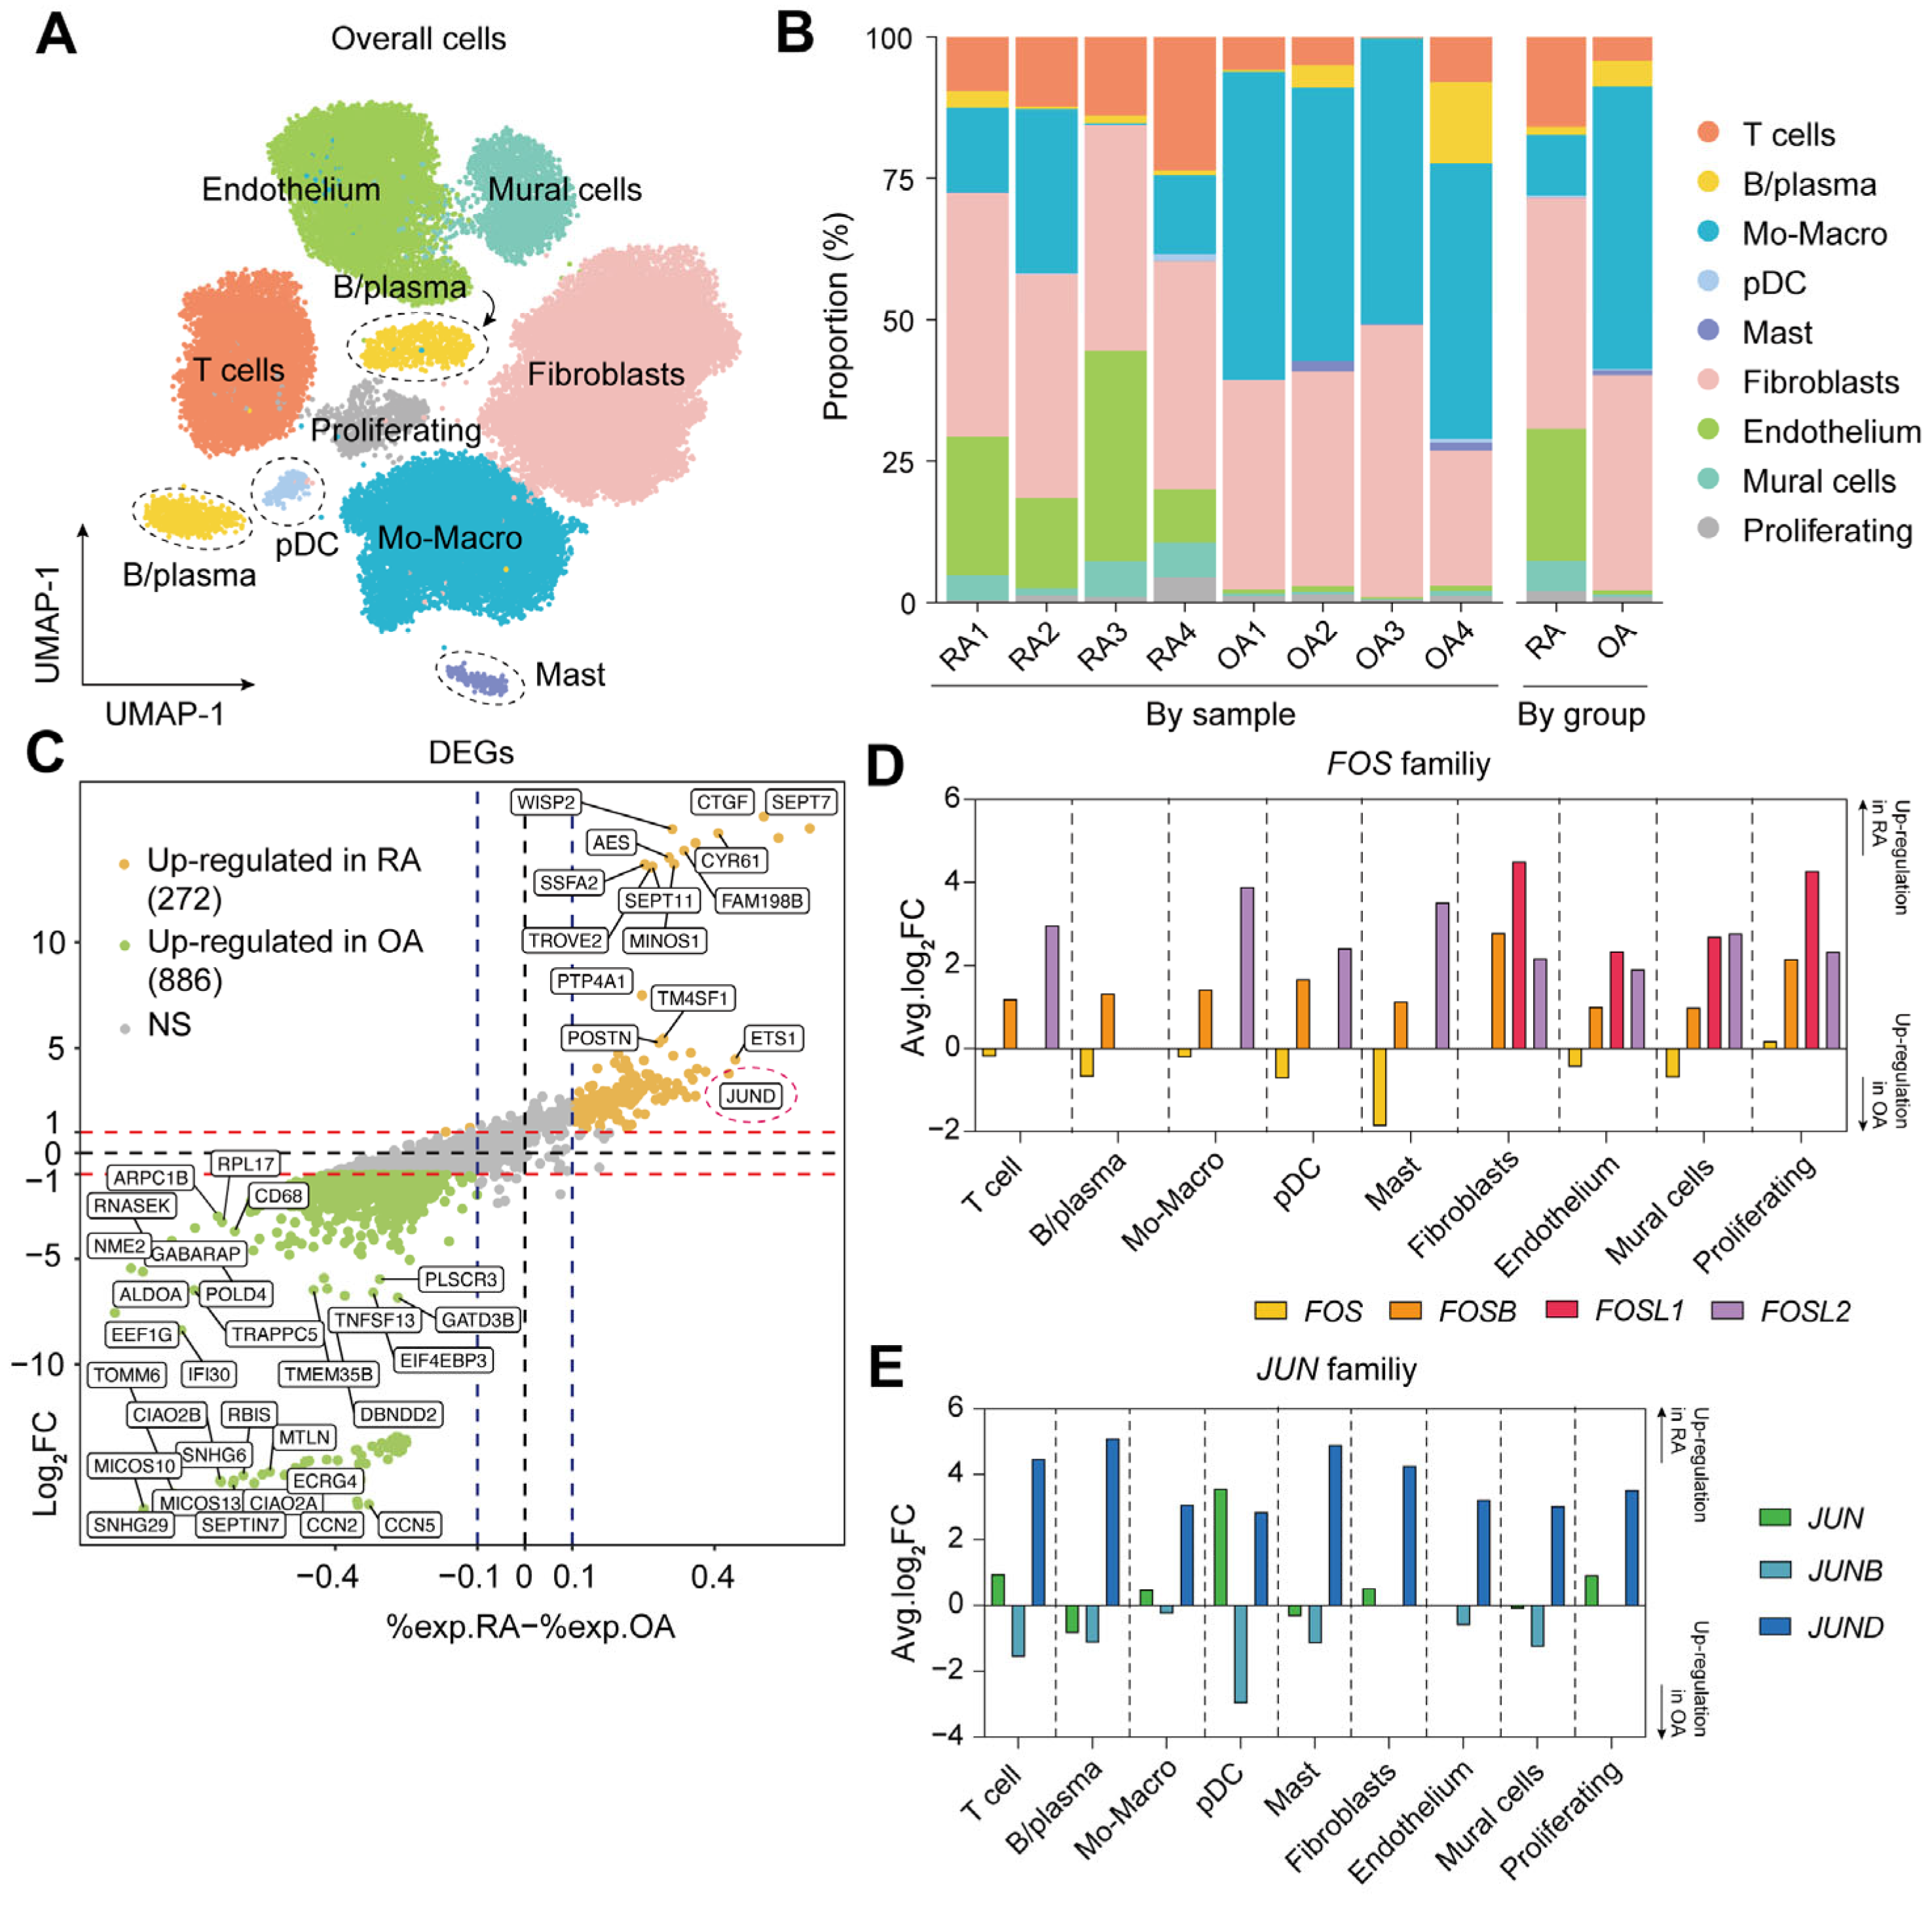
Figure 1. The single-cell landscape and gene expression profiles of the RA and OA synovium. (A) UMAP visualization of 47,672 cells from eight patients, colored by cell types. (B) Stacked bar chart for the proportion of cell types split by sample or by group. (C) Diagonal volcano plot for DEGs between RA and OA. (D) The expression of the FOS families by cell types between RA and OA. (E) The expression of the JUN families by cell types between RA and OA.
Ijms 26 09718 g001
Figure 2. The monocyte-macrophage subclusters and the AP-1 expression. (A) Sub-clustering division of monocyte-macrophage lineage into six sub-clusters and split by group. (B) Stacked bar chart for the proportion of macrophage sub-clusters split by sample or by group. (C) Functional genes expression by macrophage sub-clusters. (D) Regional visualization for the whole AP-1 family expressed by monocyte-macrophage lineage.
Ijms 26 09718 g002
Figure 3. The pathway enrichment of RA synovium. (A) Diagonal volcano plot for DEGs between RA and OA synovial macrophages. (B) Venn diagram showing the overlap between up-regulated DEGs of RA vs. OA macrophages (574) and up-regulated DEGs of C1 (RA) vs. C3 (OA) (755), with 570 overlapping genes. (C) The gene set enrichment of overlapped DEGs on GOBP pathways, with FOSL2-related ones colored in red. Abbreviations: cAMP, cyclic adenosine monophosphate; PDGF, platelet-derived growth factor; TGF-β, transforming growth factor-beta; TNF, tumor-necrosis factor; JNK, c-Jun N-terminal kinase; VEGF, vascular endothelial growth factor.
Ijms 26 09718 g003
Figure 4. The validation of bulk RNA-seq on FOSL2+Mac signature. (A) The enrichment of macrophage-associated pathways among the patients with OA, early RA, and established RA. (B) The enrichment and comparison of FOSL2+Mac signature among OA, early RA, and established RA; statistical significance was assessed using the Kruskal–Wallis H test. (C) The association between the enrichment of the FOSL2+Mac signature and the expression of the AP-1 family.
Ijms 26 09718 g004
Figure 5. M1/M2 polarization in vitro after knockdown of FOSL2. (A) The workflow of M1/M2 polarization in vitro using U937 cells infected by shRNA-FOSL2-containing lentivirus; (B) The comparisons of M1 markers after knockdown of FOSL2; Statistical significance was determined by one-way ANOVA, *, p < 0.05; **, p < 0.01; ***, p < 0.001; ns, non-significant. (C) The gene set enrichment among shRNA (M0/M1/M2) and control groups, with the red box highlighting the M1 cells without FOSL2 knockdown as the control.
Ijms 26 09718 g005
Figure 6. The intercellular communications of CXCL3+FOSL2+Mac (C1). (A) The communication with C1 as the signal transmitter. The arrows indicated CXCL3+FOSL2+Mac communicated with ECs via CXCL3-ACKR1 pair. (B) The communication with C1 as the signal receiver.
Ijms 26 09718 g006
Table 1. The expression of AP-1 members in RA synovium compared to OA.
GenesAvg.log2FC *% exp in RA % exp in OA Adjusted p Values §
JUND3.780.9070.4770
FOSL23.210.4270.1580
FOSB1.980.7920.6680
JUN0.410.7530.8056.5 × 10−52
* Avg.log2FC indicates the average expression of the genes in the RA synovium compared to the OA synovium, which was displayed as logarithmic fold change with 2 as the base. Item indicates the proportion of cells expressing the interested gene in RA synovium. Item indicates the proportion of cells expressing the relevant gene in the OA synovium. § Wilcoxon rank-sum test; Bonferroni adjusted p values.
Disclaimer/Publisher’s Note: The statements, opinions and data contained in all publications are solely those of the individual author(s) and contributor(s) and not of MDPI and/or the editor(s). MDPI and/or the editor(s) disclaim responsibility for any injury to people or property resulting from any ideas, methods, instructions or products referred to in the content.