Article

Genome-Wide Identification of the BXL Gene Family in Soybean and Expression Analysis Under Salt Stress

1
Guangdong Provincial Key Laboratory of Plant Adaptation and Molecular Design, Innovative Center of Molecular Genetics and Evolution, School of Life Sciences, Guangzhou University, Guangzhou 510006, China
2
School of Environmental Science and Engineering, Guangzhou University, Guangzhou 510006, China
*
Authors to whom correspondence should be addressed.
These authors contributed equally to this work.
Int. J. Mol. Sci. 2025, 26(19), 9534; https://doi.org/10.3390/ijms26199534
Submission received: 18 August 2025 / Revised: 18 September 2025 / Accepted: 25 September 2025 / Published: 29 September 2025
(This article belongs to the Special Issue Molecular Biology of Soybean)

Abstract

β-D-xylosidases (BXLs) are pivotal enzymes in xylan degradation, playing essential roles in plant development and stress responses. In this study, we identified 29 GmBXL genes in soybean through homolog alignment. Phylogenetic analysis classified these genes into three groups, with Group III being legume-specific. The GmBXLs are unevenly distributed across 15 chromosomes, with their expansion driven by both tandem and segmental duplications. Conserved motif and domain analyses revealed functional conservation, particularly in family 3 of glycoside hydrolase domains. Promoter regions of GmBXLs are enriched with hormone-responsive and stress-related cis-elements, indicating their involvement in diverse biological processes. Tissue-specific expression analysis revealed differential GmBXLs expression across leaves, roots, flowers, and seeds, with GmBXL13 and GmBXL26 exhibiting notably high transcript levels in pods and seeds. Under salt stress, 26 GmBXLs exhibited significant expression changes, with 20 genes up-regulated in both leaves and roots, highlighting their roles in salt tolerance. These findings enhance our understanding of the evolutionary and functional characteristics of GmBXLs, providing valuable insights for molecular breeding of salt-tolerant soybean varieties.

1. Introduction

The plant cell wall serves as a crucial interface for environmental signal perception and transduction, facilitating adaptive responses to external stimuli. This dynamic structure is primarily composed of three major polysaccharide components: cellulose, hemicellulose, and pectin [1,2]. Among these components, hemicellulose predominantly comprising xylan and xyloglucan polymers, represents the second most abundant carbohydrate fraction in the cell wall [3]. During the maturation of the cell wall, xylan undergoes hydrolysis under the action of a series of enzymes to form xylose. β-D-xylosidase (BXL; EC3.2.1.37) plays a pivotal role in this process as the key enzyme responsible for the terminal degradation of xylan [4]. Its activity is essential for completing the xylan catabolic pathway and facilitating subsequent metabolic utilization of the released xylose units.
Plant BXLs are predominantly classified into glycoside hydrolase family 3 (GH3) based on their substrate specificity, amino acid sequence conservation, three-dimensional structural features, and catalytic mechanisms [5,6]. These enzymes typically contain three characteristic domains: an N-terminal catalytic domain (PF00933), a C-terminal catalytic domain (PF01915), and a fibronectin type III domain (PF14310) whose biological function remains to be elucidated [7,8]. The N-terminal domain harbors two conserved substrate-binding motifs: a Tryptophan-Glycine-Arginine (WGR) motif and a Lysine-Histidine (KH) motif [3]. Mechanistically, BXLs employ an acid-base catalytic mechanism for xylan hydrolysis, with two essential catalytic residues at the active site: (i) a nucleophilic aspartate (Asp) residue and (ii) an acid-base glutamate (Glu) residue [9].
Currently, BXLs have been identified and functionally characterized in multiple plant species. In Arabidopsis thaliana, seven AtBXL genes have been identified, with AtBXL1 showing high stem-specific expression whose mutation results in shortened stems, reduced silique length and decreased seed production [10], while its expression is upregulated under darkness or sugar starvation conditions [11,12]. AtBXL4 accumulates in the apoplast during systemic acquired resistance (SAR) and serves as a key component in the SAR signaling pathway [13]. In fruit ripening, Pyrus pyrifolia JPRXYL is associated with senescence and accumulates in ripened fruits and old leaves [14], while peach PpXy1 functions as a molecular indicator for woolliness tolerance and helps fruits cope with chilling stress [15]. FaXyl1 exhibits down-regulated expression upon gibberellin A3 and 1-naphthaleneacetic acid treatment, with its promoter harboring multiple hormone-responsive elements in Fragaria ananassa [16]. Brassica juncea possesses 16 BjuBXL genes, among which BjuBXL1-1 and BjuBXL1-2 are crucial for stem swelling [17]. In Populus trichocarpa, the expressions of PtBXL4, PtBXL5, PtBXL9 are induced under low and high ammonium and nitrate treatment [18]. Importantly, crop BXLs participate in abiotic stress responses, such as OsBXL1 and OsBXL3 respond to salt-alkali stress in rice [19]. Overall, these studies underscore the multifaceted roles of BXL genes in plant development, stress adaptation, and hormone responses across diverse species. However, systematic identification and comprehensive functional analysis of the BXL gene family in soybean remain largely unexplored.
Soybean (Glycine max L.), a globally important legume crop, serves as a vital source of plant-based proteins and edible oils for human nutrition. However, increasing soil salinization has emerged as a major constraint significantly reducing soybean productivity worldwide. Salt stress induces multiple physiological damages in plants, including cellular dehydration, nutrient imbalance, and excessive accumulation of reactive oxygen species (ROS) that cause oxidative stress and tissue damage [20,21]. Soybean has evolved diverse regulatory mechanisms to adapt to salt stress. Ion transporters help remove excessive NaCl from the cell, thereby alleviating the effects of salt stress [22]. The cation/proton antiporter (CPA) gene, GmCHX1, which is highly expressed in the root vasculature, helps restrict Na+ loading into the shoot [23,24,25]. Another CPA gene, GmCHX20a contributes to enhanced salt tolerance during subsequent salt stresses [26]. GmSOS1 (Salt Overly Sensitive 1), which encodes a Na+/H+ exchanger, is salt-responsive and shows dosage-dependent expression in roots [27]. Members of the high-affinity K+ transporter (HKT) family reduce Na+ accumulation and improve K+ uptake under salt treatment [28,29]. The highly hydrophilic of the late embryogenesis abundant (LEA) proteins is an important characteristic for osmoregulation; for instance, GmLEA2-1 improves salt tolerance in soybean [30]. In addition, multiple genes underpinning the production of antioxidants and ROS scavenging pathways have been identified. Purple acid phosphatase 3 (GmPAP3) reduces ROS levels and enhances ascorbic acid-like antioxidation pathway activities [31,32]. Salt stress promotes the activation of numerous transcription factors, such as bHLH, bZIP, and AP2/ERF families, and initiates multiple signal transduction pathways, including those mediated by phytohormones and phosphatidylinositol signaling [33,34,35]. Furthermore, plants modulate the abundance, composition, and distribution of cell wall components to sustain growth under prolonged stress [36,37]. For example, a co-chaperone DNAJ protein, GmDNAJC7 upregulates genes related to cellulose biosynthesis [38].
Considering the crucial roles of BXL genes in plant cell walls and their demonstrated involvement in abiotic stress responses across species, we speculate that GmBXLs may participate in soybean salt stress response. Therefore, in this study, we performed genome-wide identification and characterization of the BXL gene family in soybean. Through systematic homology analysis, we identified 29 GmBXL genes and conducted comprehensive investigations of their physicochemical properties, phylogenetic relationships, conserved protein motifs, gene structures, and expression profiles. This study provides fundamental genomic resources for future functional studies of salt-tolerance genes and facilitates molecular breeding efforts to improve soybean adaptation to saline environments.

2. Results

2.1. Identification of the Soybean BXL Genes

To systematically identify members of the BXL gene family in soybean, we performed a comprehensive genome-wide analysis using seven well-characterized A. thaliana BXL protein sequences as queries for BLASTP searches. Candidate genes were further verified using both the Pfam database and Conserved Domain Database (CDD) to ensure accurate identification of functional domains. This rigorous screening process identified 29 high-confidence GmBXL genes in the soybean genome (Table S1). Detailed characterization of these GmBXL proteins revealed considerable variation in their physicochemical properties (Table S3). The proteins ranged in size from 502 to 802 amino acids, corresponding to molecular weights between 54.80 and 86.32 kDa. Theoretical isoelectric points (pI) varied from 5.26 to 9.26, suggesting potential functional diversity in different cellular environments. All proteins demonstrated good stability, with instability indices between 22.75 and 38.35, while aliphatic indices ranged from 84.63 to 95.68, indicating thermostability. Hydrophobicity analysis showed that most GmBXL proteins (24 out of 29) are hydrophilic (GRAVY < 0), with only GmBXL7, 15, 19, 20, and 26 exhibiting hydrophobic characteristics. Subcellular localization predictions revealed GmBXLs are distributed in different organelles: eighteen proteins were predicted to localize in mitochondria, six in chloroplasts, four in the cytoplasm, and one in peroxisomes. These diverse physicochemical characteristics and subcellular distributions strongly suggest that GmBXL family members have evolved specialized functional roles in various cellular processes.
To elucidate the evolutionary relationships among BXL proteins, we performed comprehensive phylogenetic analysis using 74 protein sequences from four plant species: A. thaliana, G. max, M. truncatula, and L. japonicus. The neighbor-joining phylogenetic tree constructed from multiple sequence alignments revealed clear clustering of BXL proteins into three distinct groups (Figure 1). Group I emerged as the largest clade, containing the majority of BXL members, while Group II represented the smallest group with only four conserved members. Notably, Group III appears to be a legume-specific clade, comprising 31 members exclusively from the three legume species, including 23 from M. truncatula and 15 from L. japonicus. This phylogenetic distribution suggests both functional conservation and diversification during the evolution of BXL genes, with the legume-specific Group III potentially representing lineage-specific functional specialization.

2.2. Chromosomal Distribution and Colinearity Analysis of Soybean BXL Genes

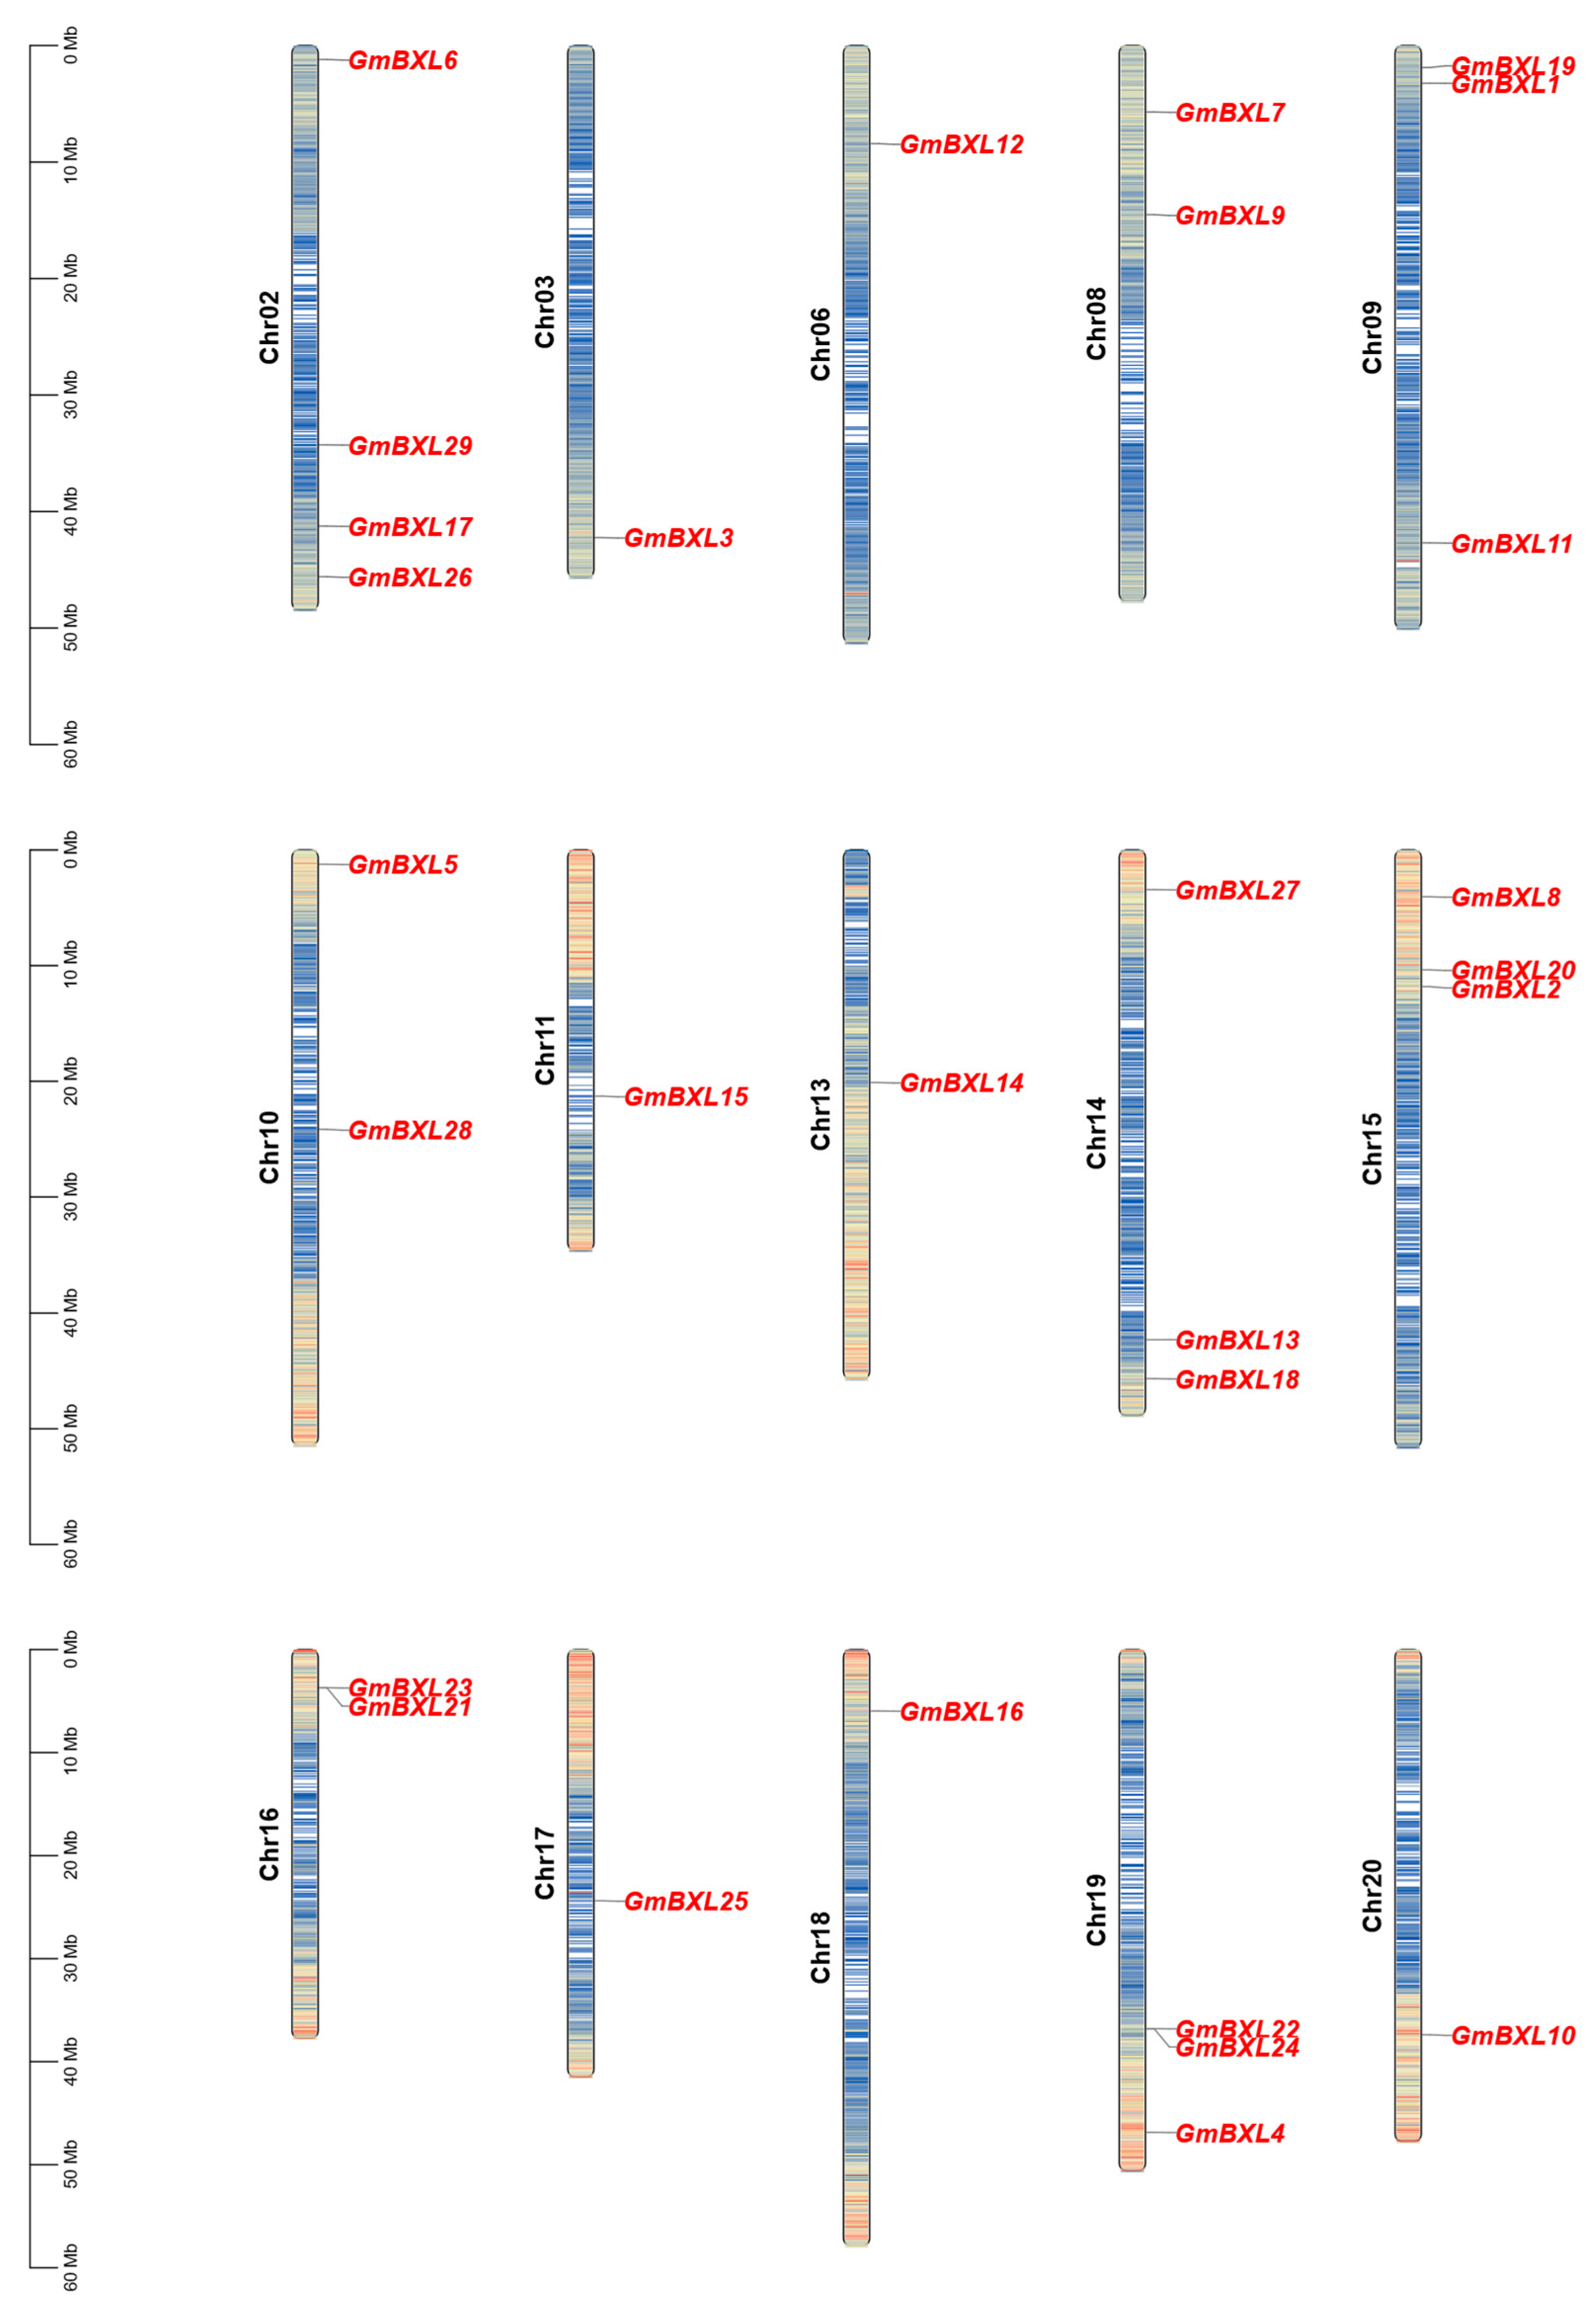
Chromosomal localization analysis revealed that the 29 identified GmBXL genes are distributed unevenly across 15 chromosomes (Figure 2), with the majority preferentially located in the end region of the chromosome while GmBXL14, GmBXL15, GmBXL25, and GmBXL28 were uniquely positioned near centromeric regions. The distribution pattern showed single gene occurrences on chromosomes Chr03, Chr06, Chr11, Chr13, Chr17, Chr18, and Chr20; two genes each on Chr08, Chr10, and Chr16; three genes on Chr09, Chr14, Chr15, and Chr19; and GmBXL6, GmBXL17, GmBXL26, and GmBXL29 on Chr02, demonstrating a non-random genomic organization that may reflect evolutionary and functional specialization within this gene family.
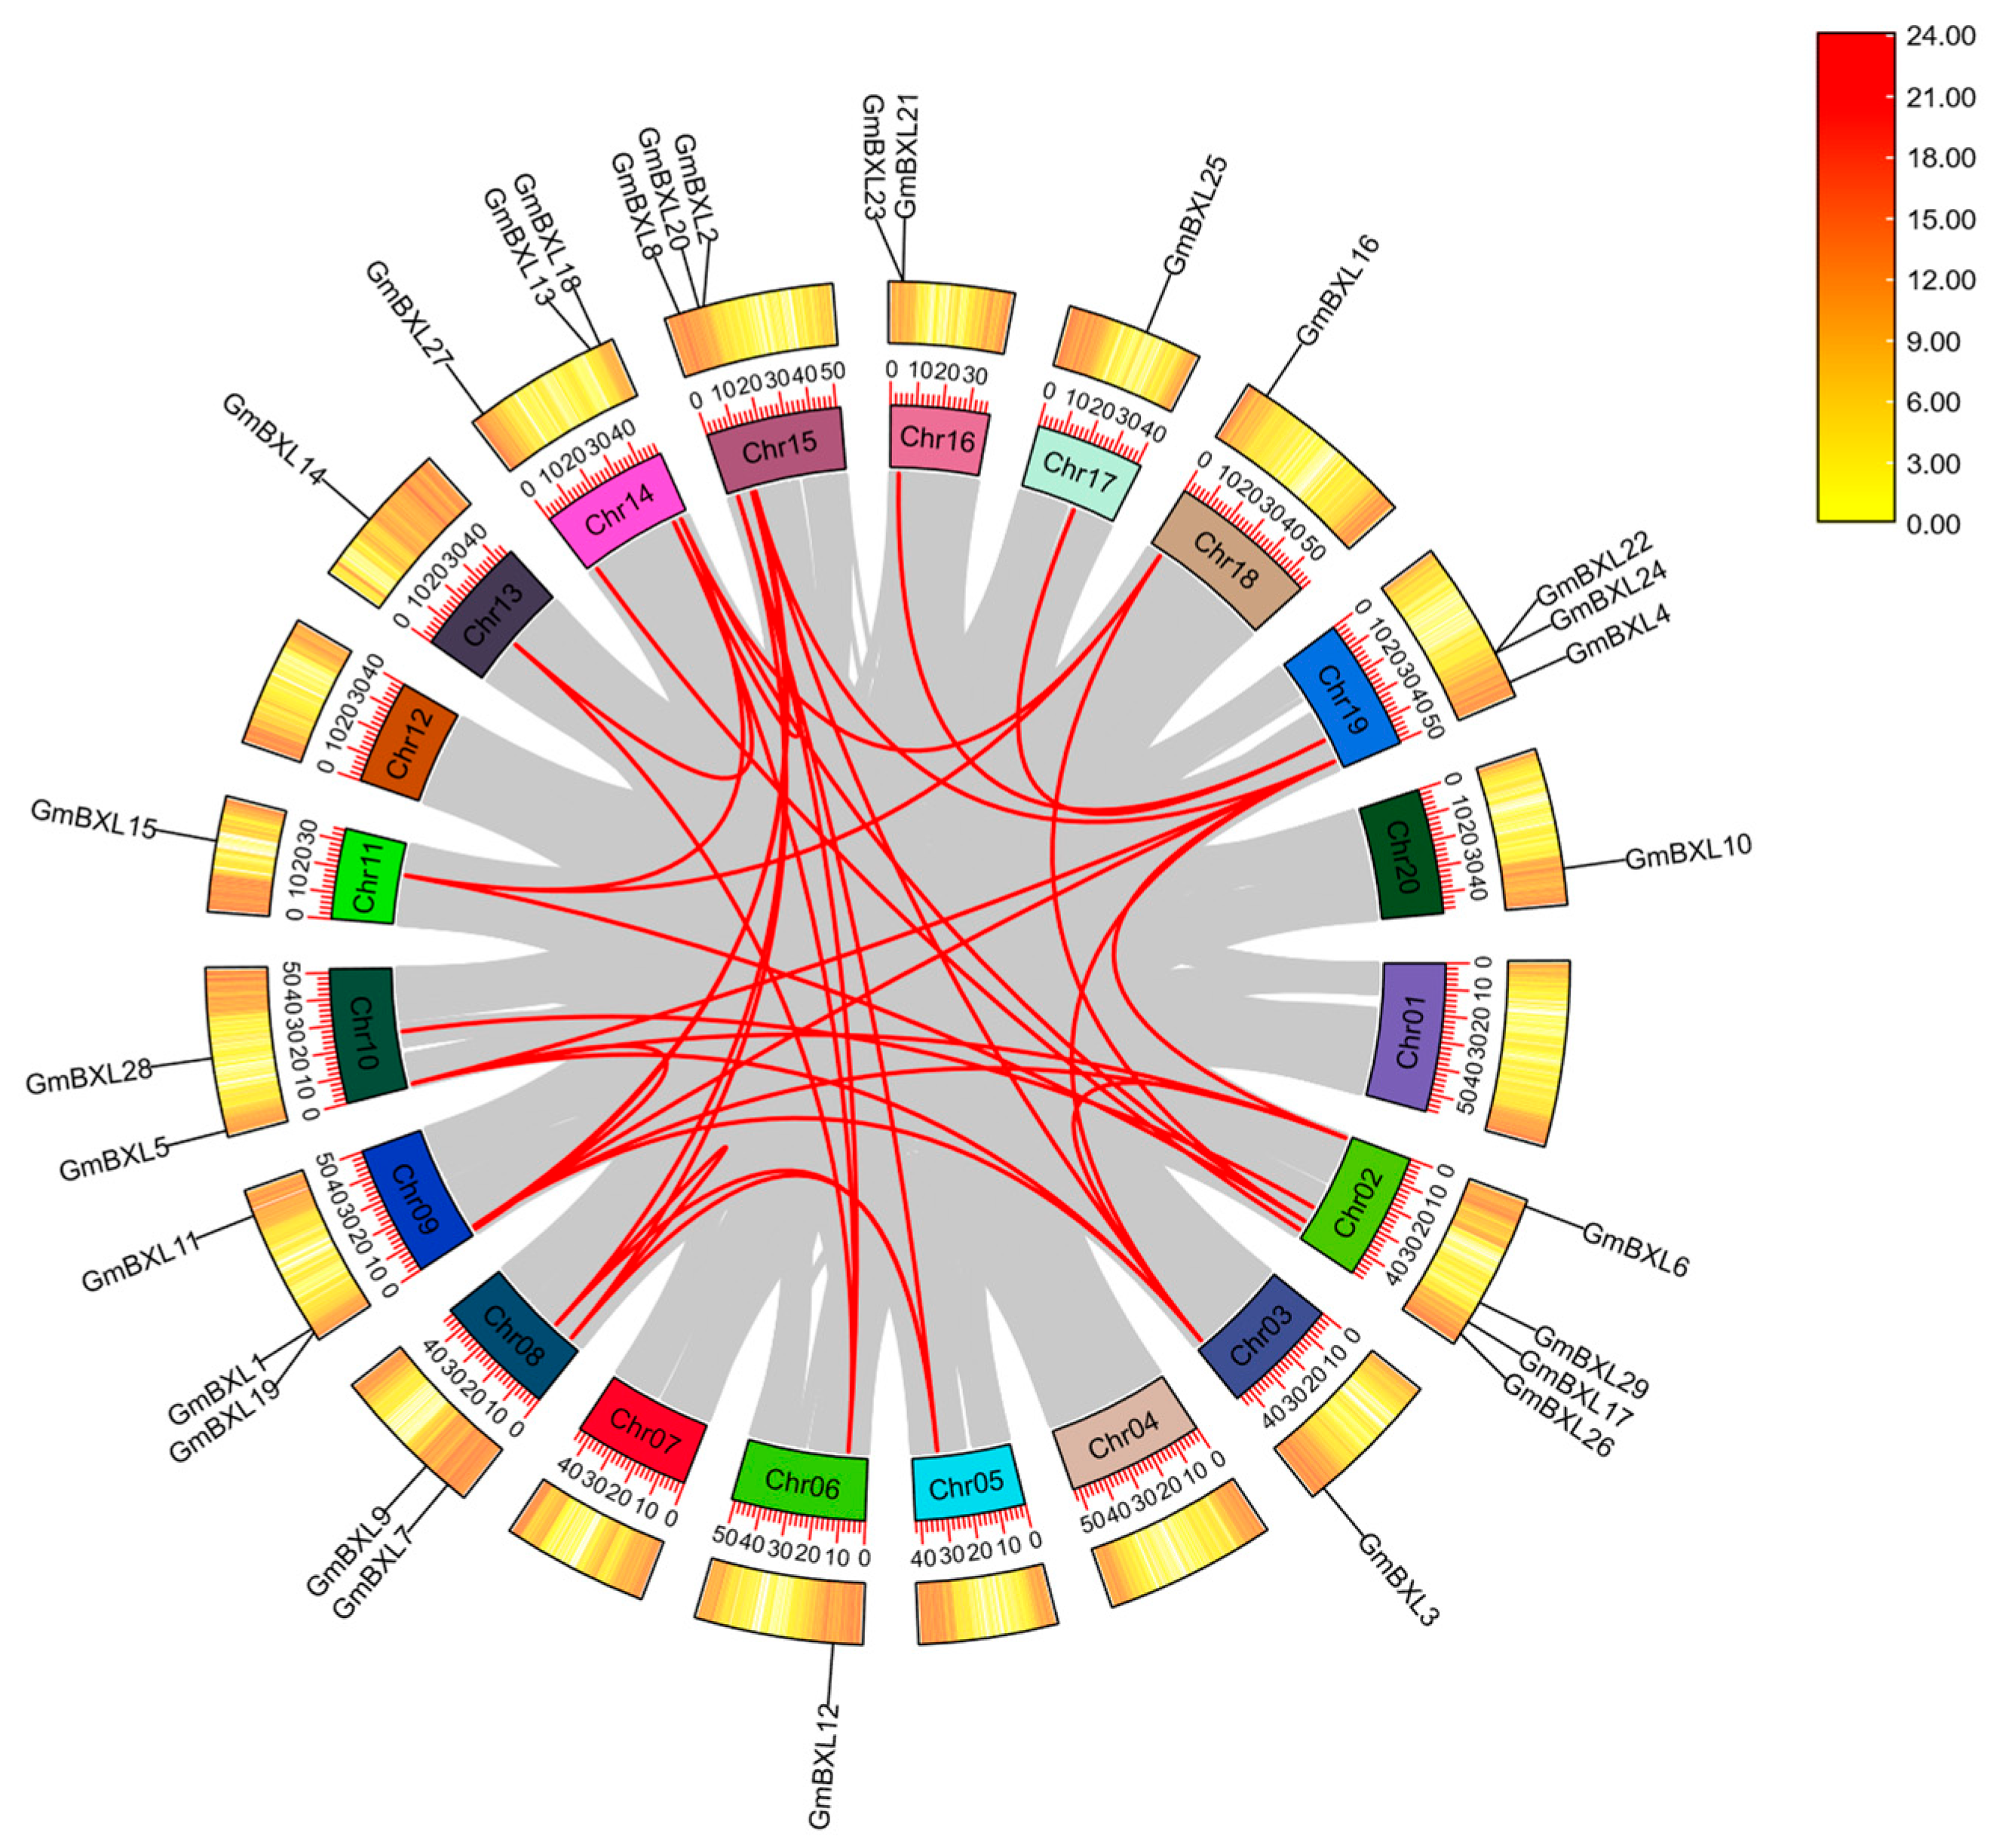
Gene duplication makes it possible to expand gene families, encompassing tandem and segmental duplications, which result from recombination or DNA replication and whole-genome duplications [43,44]. We noticed that GmBXL21/23 and GmBXL22/24 are tandem duplications on Chr16 and Chr19, respectively (Figure 2). Furthermore, colinearity analysis showed 36 segmental duplications involving in GmBXL genes across the soybean genome (Figure 3). These findings demonstrate that the evolutionary expansion of the BXL gene family in soybean has been driven by complementary mechanisms of both tandem and segmental duplication, contributing to the functional diversification of this important enzyme family.

2.3. Analysis of Gene Structures, Conserved Motifs, and Domains

Conserved protein motif analysis contributes to elucidating gene function. In the soybean BXL gene family, we identified 10 distinct protein motifs (Figure 4A and Figure S1). Comparative analysis revealed that Group I and Group II members share similar arranged order motifs and both contain the characteristic β-xylosidase superfamily domain (PLN03080) (Figure 4B,C) [45]. In contrast, Group III proteins exhibit a unique configuration comprising eight conserved motifs (1, 2, 3, 5, 6, 7, 8) along with Glyco_hydro_3 and Glyco_hydro_3_C domains. Notably, exon-intron structure analysis demonstrated considerable variation in gene structures across all GmBXL members, with no obvious rules found among the Groups (Figure 4C). These structural variations in conserved motifs and gene organization suggest functional diversification within the soybean BXL gene family, providing important clues for understanding their potential roles in various biological processes.

2.4. Analysis of Cis-Elements in BXL Gene Promoters

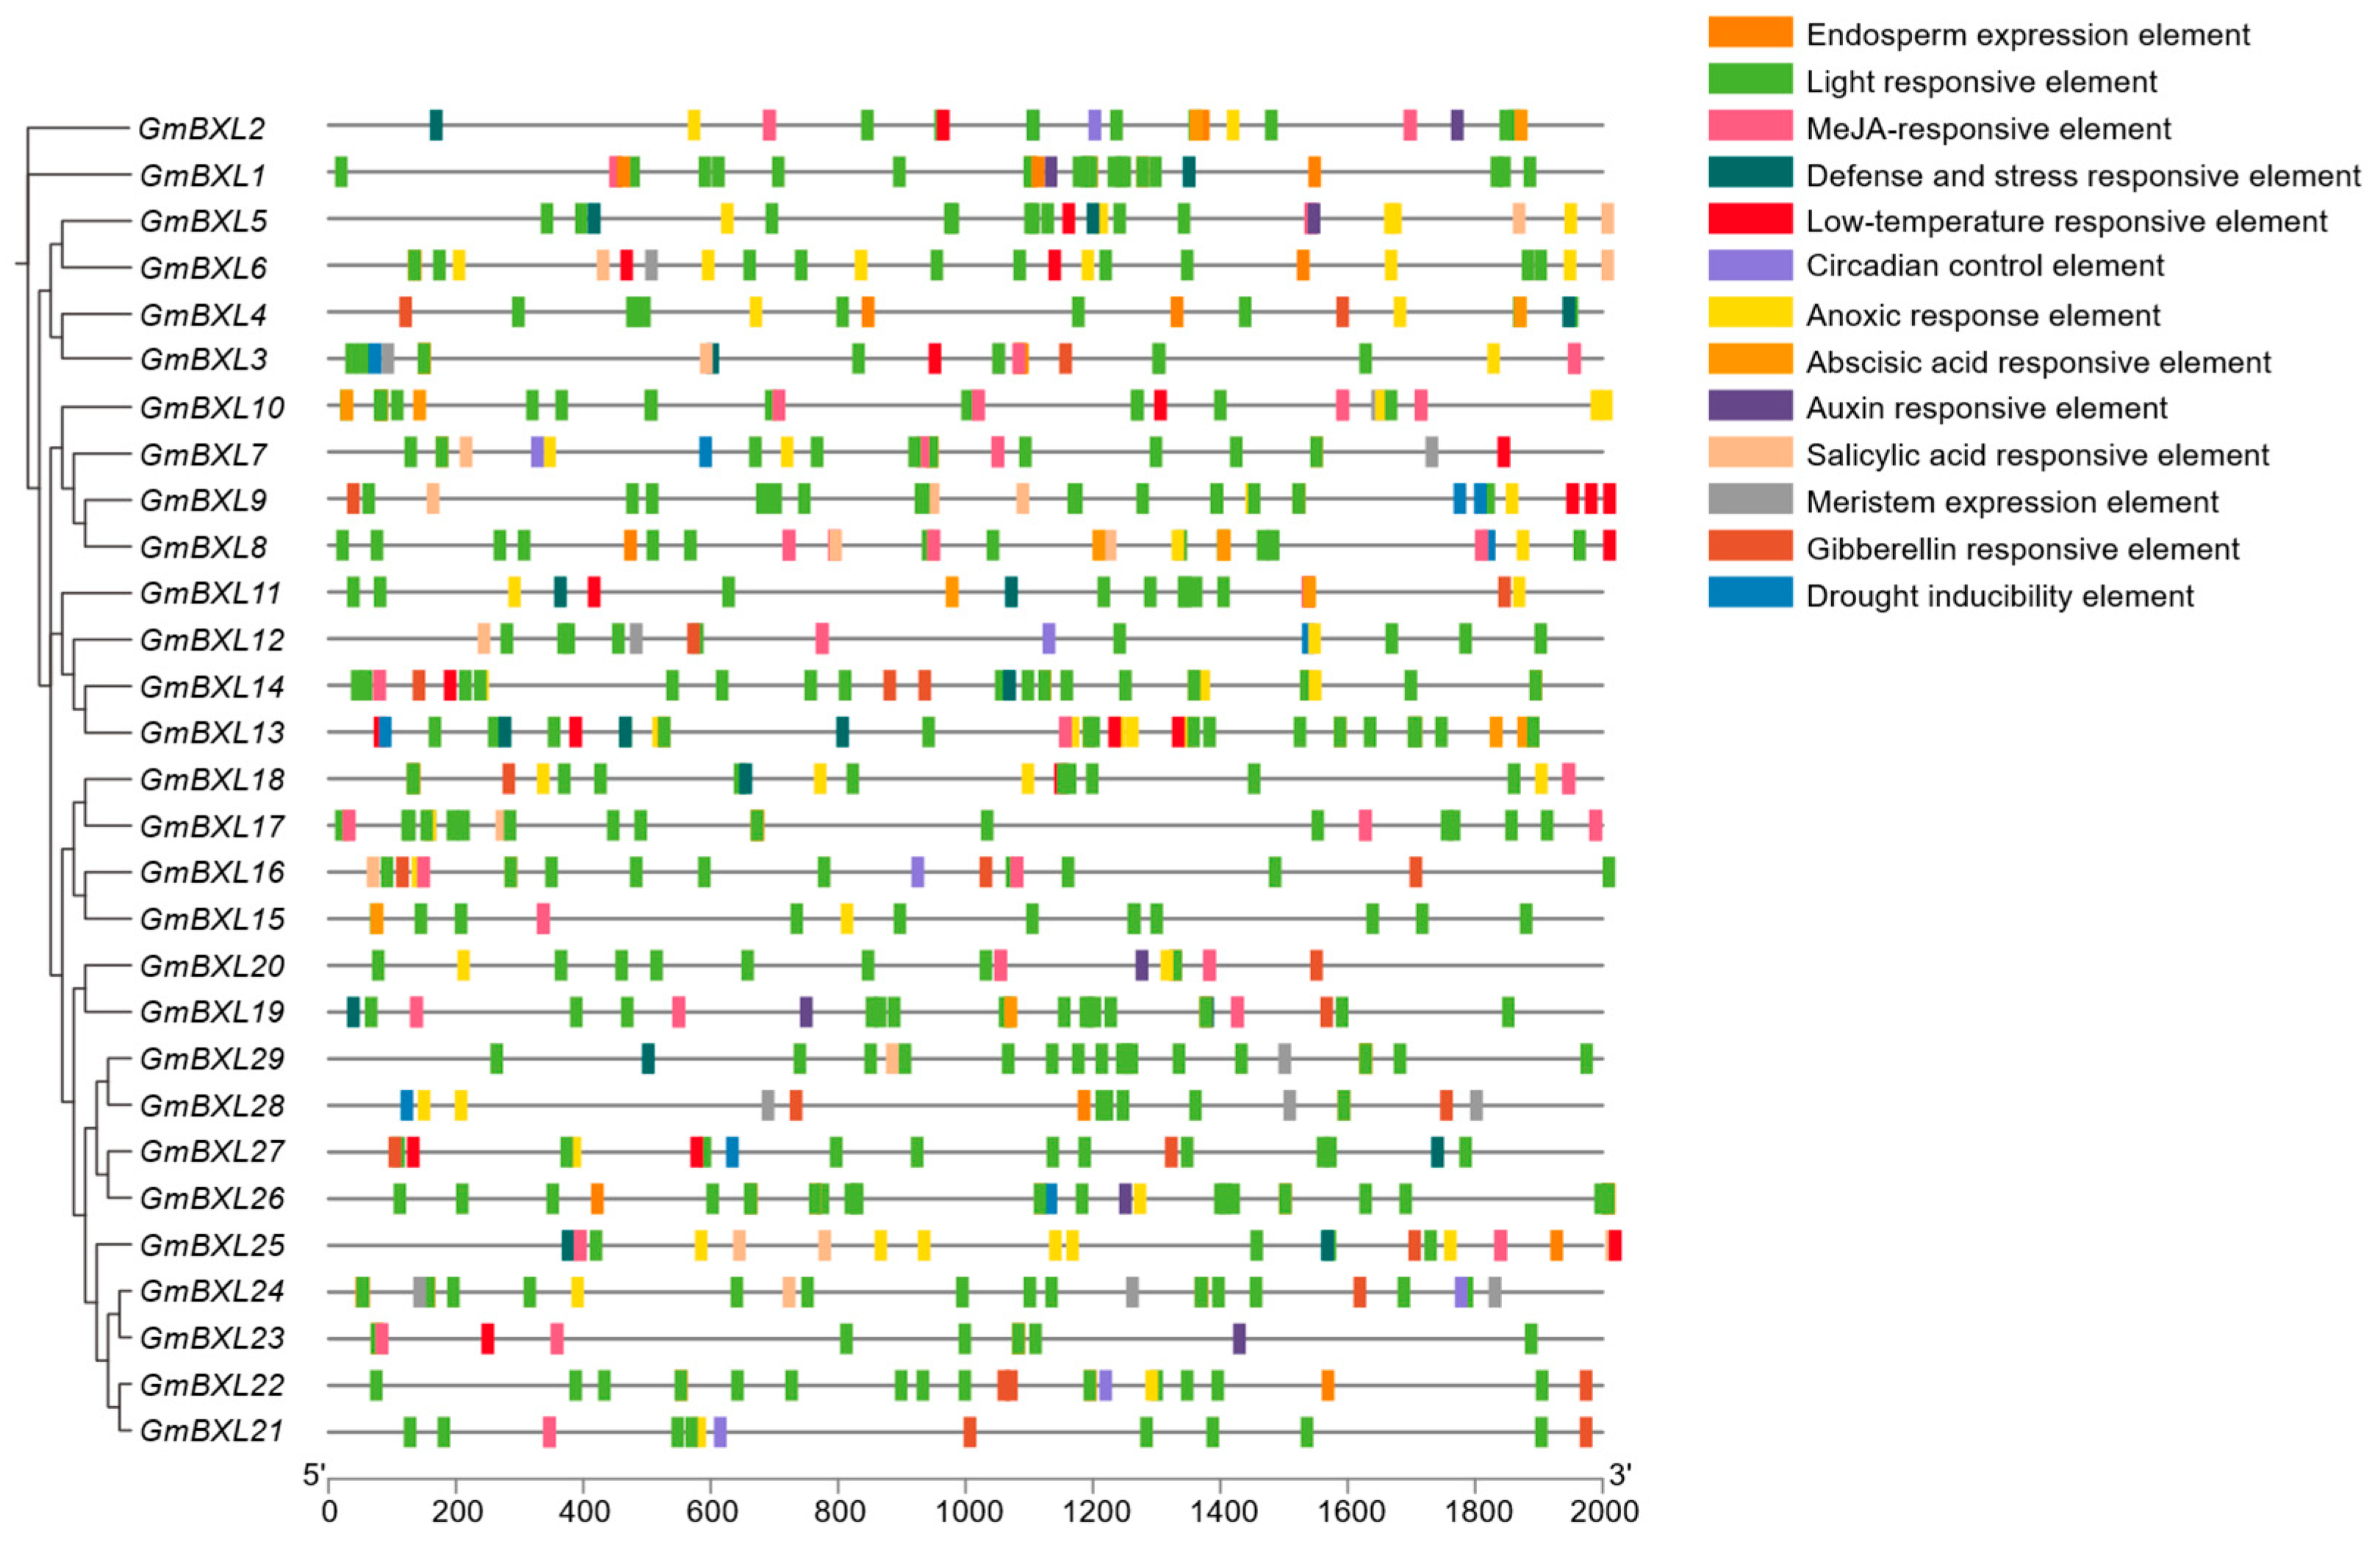
Cis-acting elements are important in the transcriptional regulation of gene expression. To investigate potential regulatory mechanisms of GmBXL genes, we analyzed 2 kb upstream sequences using PlantCARE, identifying 13 distinct cis-regulatory elements associated with abiotic and biotic stress responses (Figure 5). Light-responsive elements were the most abundant, present in all GmBXL promoters, with GmBXL26 containing a remarkable 22 such elements (Table S4). Hormone-responsive elements were also prevalent, including those for MeJA, abscisic acid, gibberellin, salicylic acid, and auxin signaling. Additionally, some anoxic response elements, as well as defense- and stress-responsive elements, and low-temperature responsive elements were found in the promoters of GmBXLs. In contrast, elements associated with circadian control, drought inducibility, meristem-specific expression, and endosperm expression were relatively rare, suggesting limited involvement of GmBXL genes in these particular biological processes. This comprehensive cis-element profiling indicates that GmBXL family members likely participate in diverse physiological processes critical for soybean growth and environmental adaptation, particularly those related to light signaling and hormonal regulation.

2.5. Response of BXL Genes Under Salt Stress

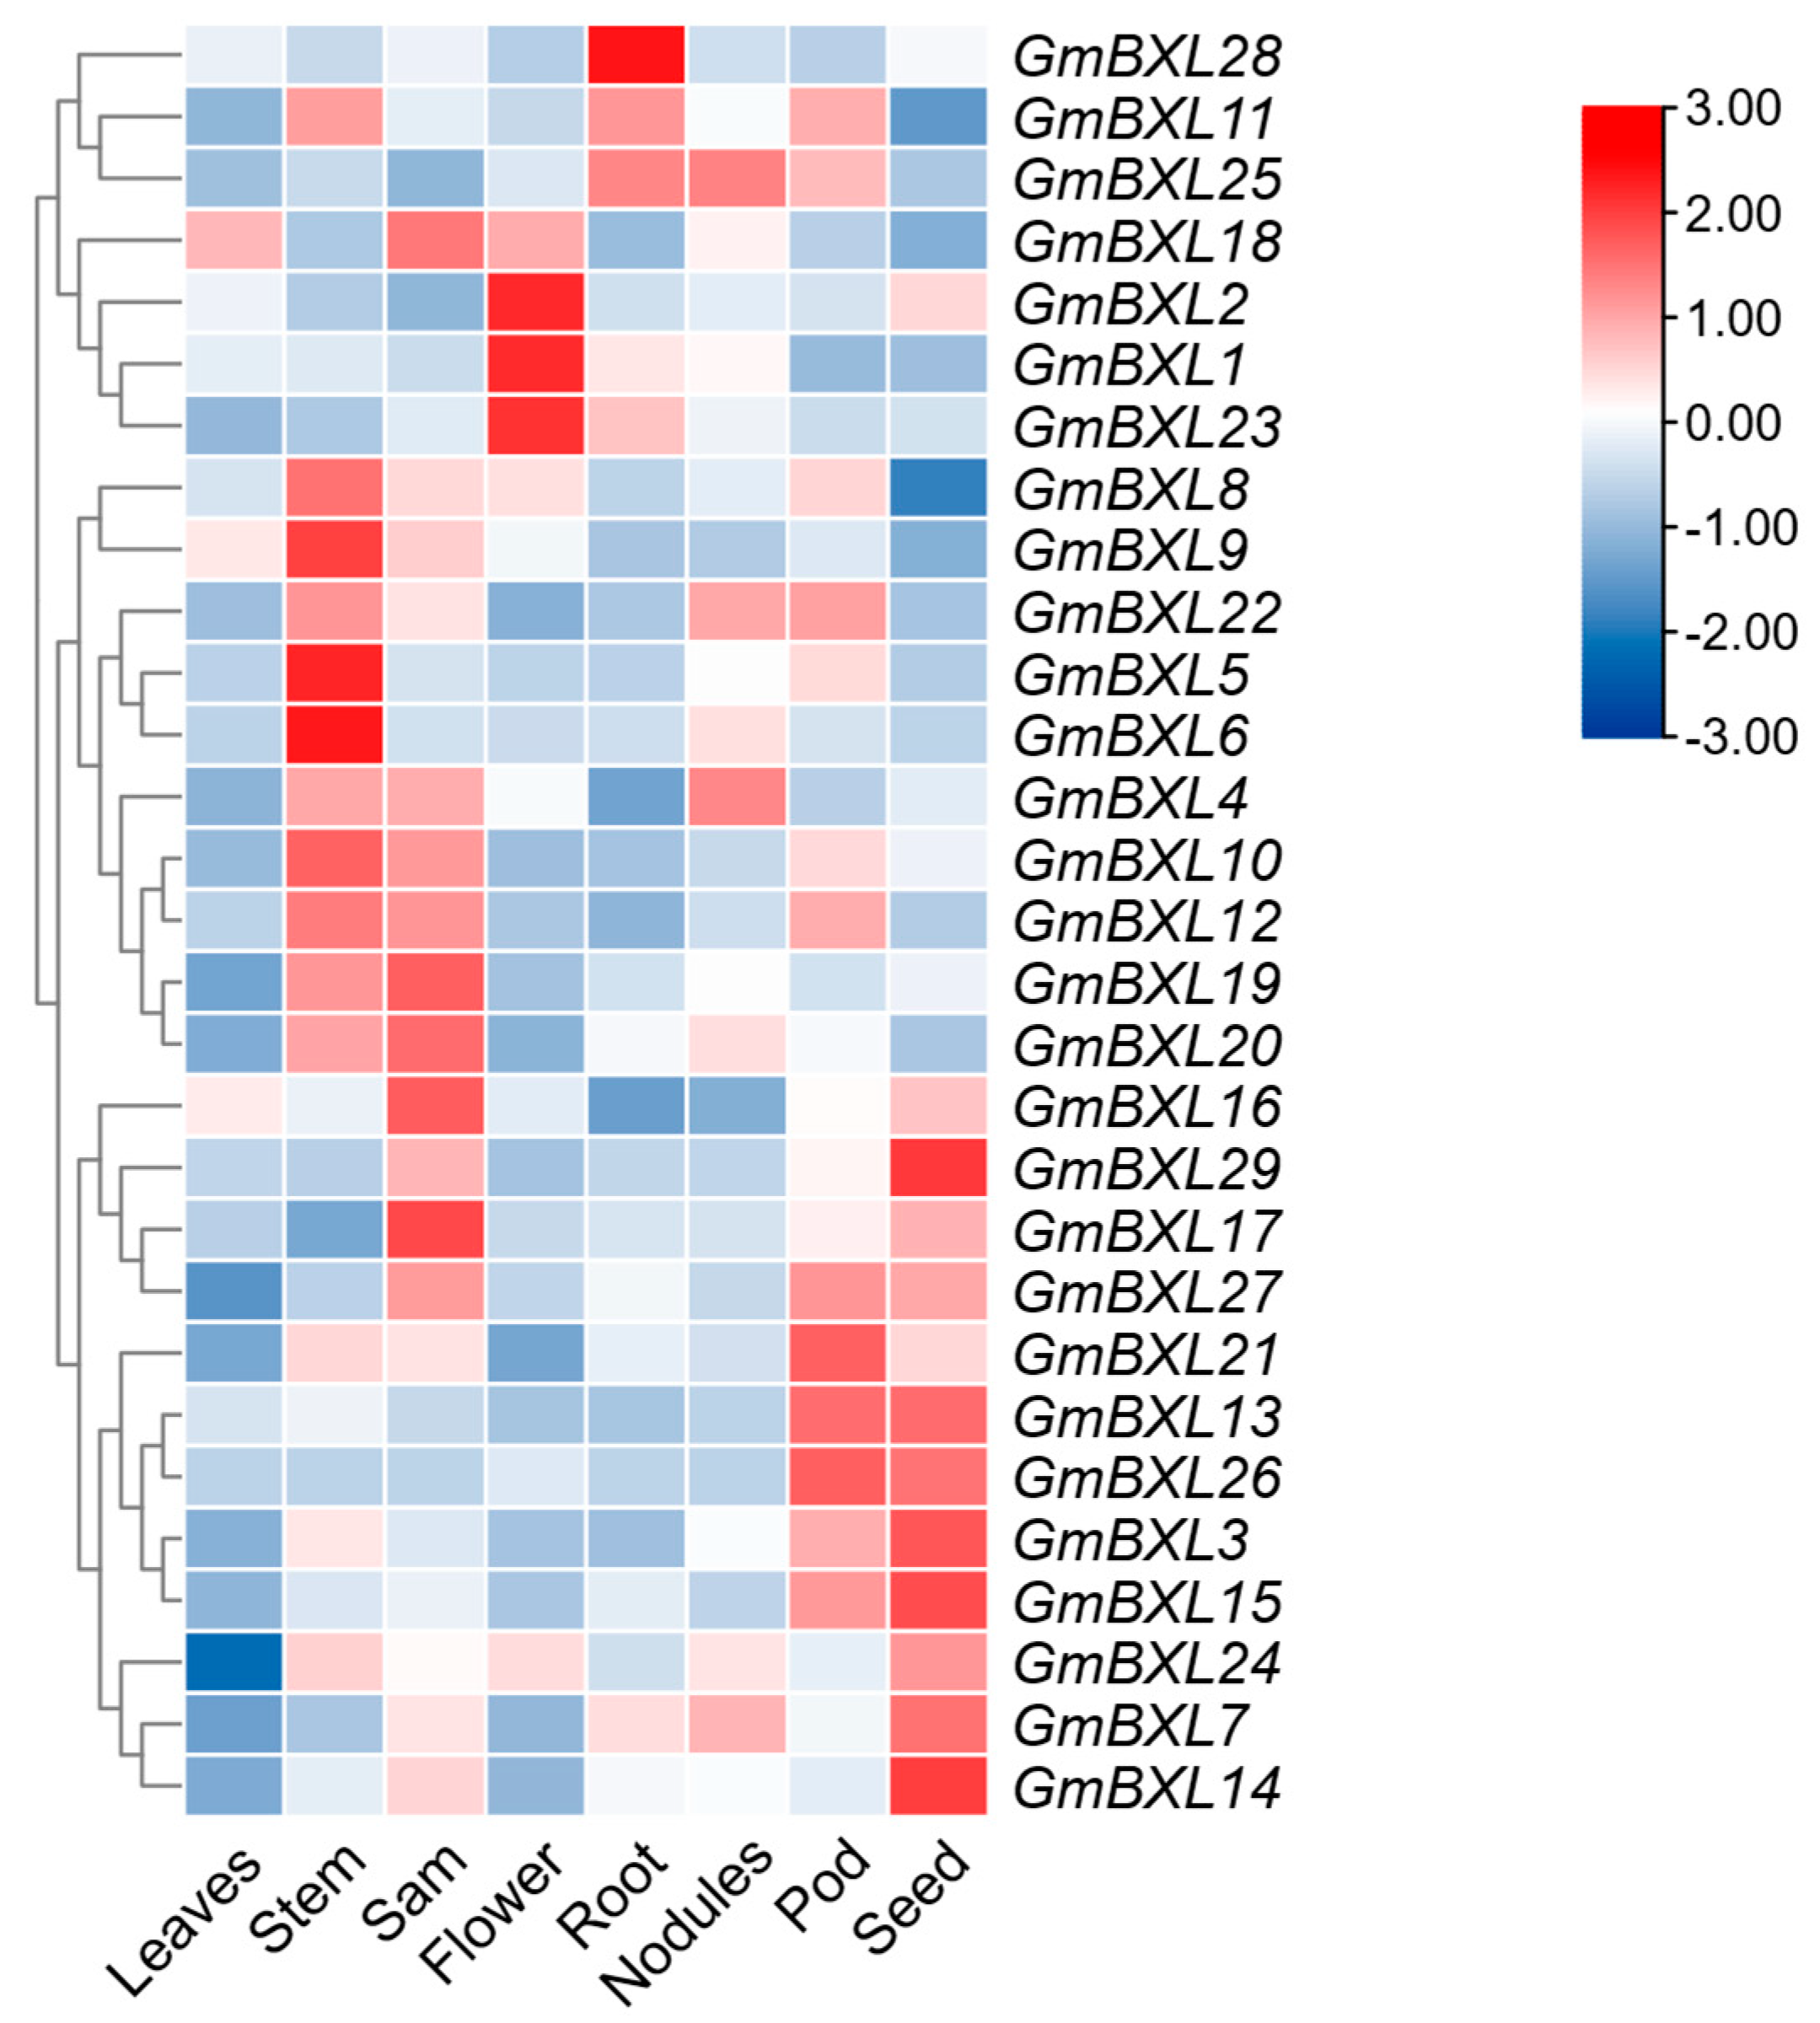
To investigate the spatial expression profiles of GmBXL genes, we analyzed transcriptome data obtained from the Phytozome database originally generated by the Gary Stacey laboratory across eight soybean tissues: leaves, stems, shoot apical meristems (sam), flowers, roots, nodules, pods, and seeds (Figure 6). The analysis revealed distinct tissue-specific expression patterns among GmBXL family members. Notably, GmBXL1, GmBXL2, and GmBXL23 showed predominant expression in flowers, while GmBXL5, GmBXL6, and GmBXL8 exhibited particularly high expression in stems. GmBXL13 and GmBXL26 displayed strong preferential expression in pods and seeds, suggesting their potential functional specialization in seed development processes. The majority of GmBXL genes demonstrated relatively high expression levels in both roots and leaves, with GmBXL28 in particular showing extremely high expression levels in roots and leaves. These diverse expression patterns indicate functional diversification within the GmBXL gene family, with different members potentially playing specialized roles in various plant organs and developmental processes.
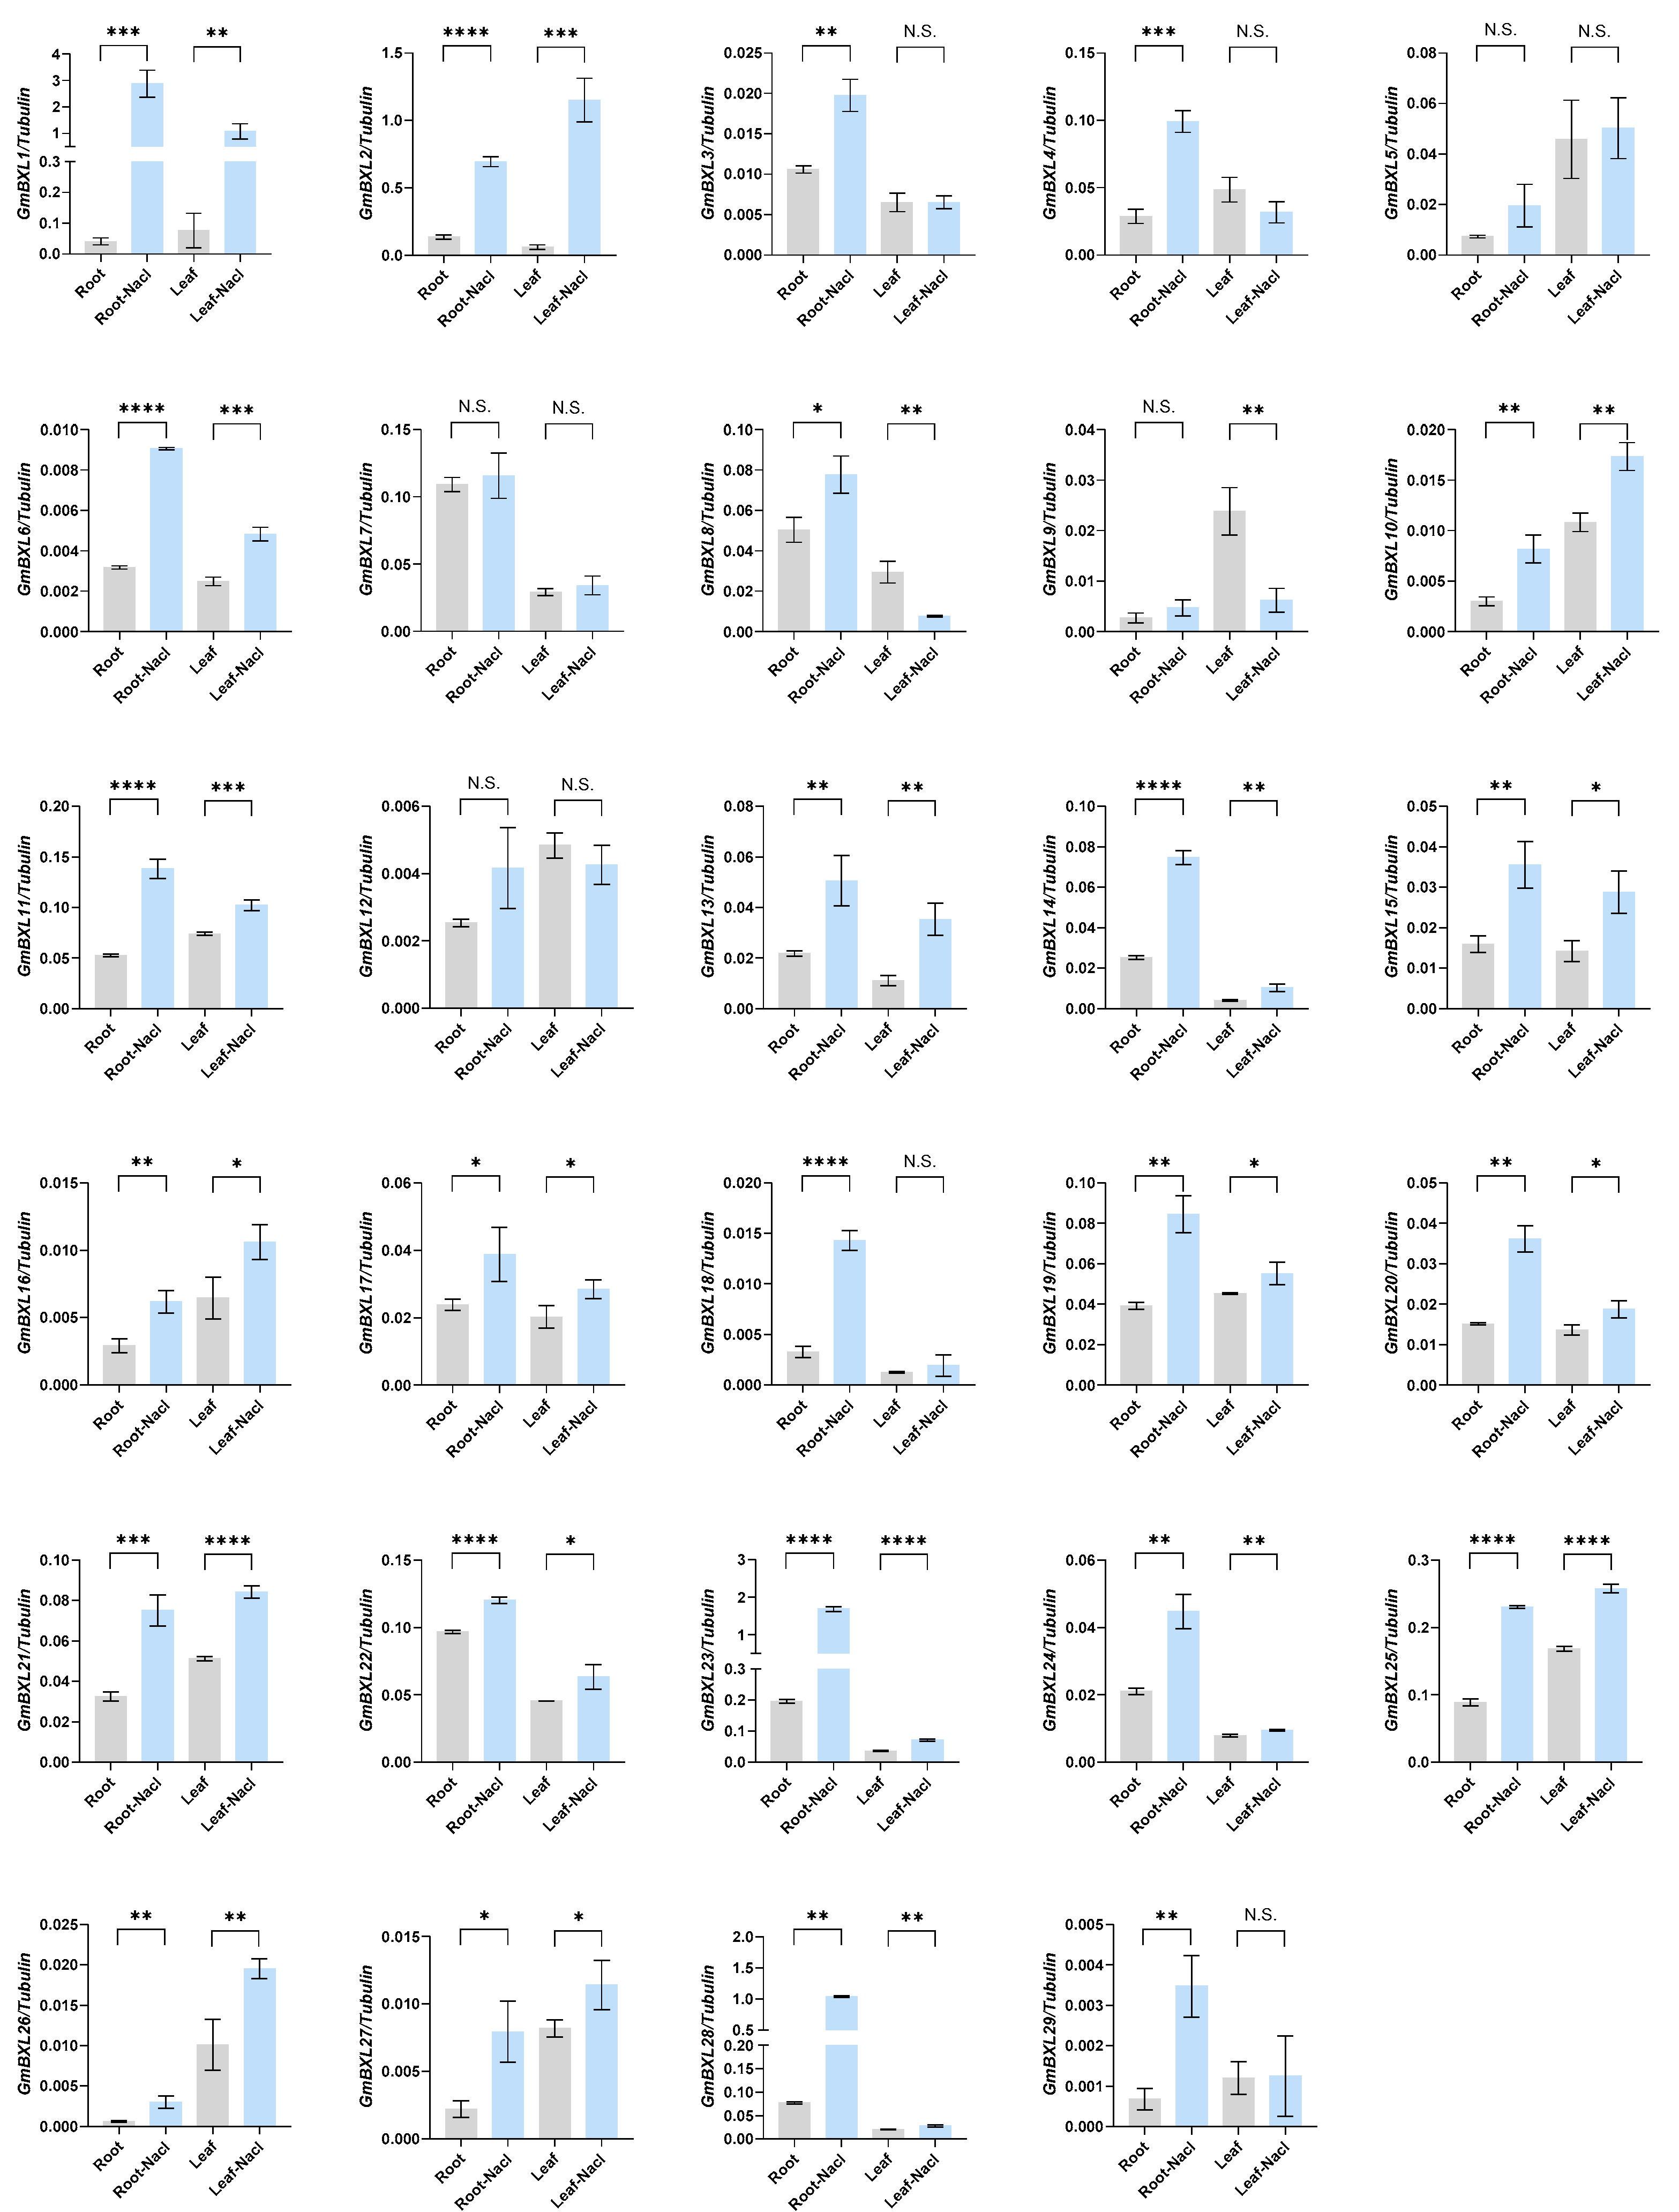
Soil salinity is a major yield-limiting factor in soybean production [46], prompting our investigation of GmBXL gene responses to salt stress. We treated plants at the V1 development stage with either 200 mM/L NaCl or a NaCl-free nutrient solution (control). Samples were collected after four hours of treatment and expression changes in GmBXLs were analyzed through RT-qPCR. Our results demonstrate that 26 of 29 GmBXL genes exhibited significant expression changes under salt stress (Figure 7), with GmBXL1, GmBXL2, GmBXL6, GmBXL10, GmBXL11, GmBXL13, GmBXL14, GmBXL15, GmBXL16, GmBXL17, GmBXL19, GmBXL20, GmBXL21, GmBXL22, GmBXL23, GmBXL24, GmBXL25, GmBXL26, GmBXL27, and GmBXL28 showing coordinated up-regulation in both leaves and roots, suggesting conserved roles in systemic salt tolerance through potentially shared regulatory pathways. Notably, GmBXL3, GmBXL4, GmBXL18, and GmBXL29 displayed root-specific induction, implicating their specialized function in root-based stress adaptation, while GmBXL8 and GmBXL9 showed marked leaf-specific down-regulation, indicating distinct regulatory mechanisms in aerial tissues compared to other family members. These differential expression patterns reveal both coordinated and tissue-specific regulation of GmBXL genes in soybean salt stress response, highlighting their functional diversification in abiotic stress adaptation.

3. Discussion

Salt stress adaptation is a critical ecological trait enabling plants to survive in saline-alkali environments. BXLs plays a pivotal role in xylan degradation and have been implicated in plant stress responses, particularly salt tolerance. In this study, 29 GmBXL genes were identified in the soybean genome and classified into three groups. Motif analysis reveals that members of Group I and Group II exhibit similar motif compositions (Figure 4), whereas Group Ⅲ possesses distinct motifs containing both Glyco_hydro_3 and Glyco_hydro_3_C domains. Furthermore, the promoters of most GmBXL genes are enriched with hormone-responsive cis-elements (Figure 5). Under salt stress, 26 GmBXL genes showed significant expression changes, displaying coordinated or antagonistic regulatory patterns, which supports their functions involvement in soybean salt response.
Gene duplication is a fundamental evolutionary mechanism that generates genetic novelty across all life forms [47,48,49,50]. This process occurs through various mechanisms including tandem and segmental duplications arising from recombination or DNA replication and the whole-genome duplications [44]. Our analysis reveals that the BXL gene family in soybean has expanded through both tandem and segmental duplications (Figure 2 and Figure 3). By comparing the functional characteristics of evolutionarily young and old duplicated gene pairs, we gained insights into the patterns of functional conservation and divergence within this gene family.
In evolutionary analysis, members belonging to the same evolutionary branch usually exhibit functional similarity. AtBXL1 shows stem-specific expression, the mutation of whose results in reduced stem and silique length [10]. In soybean, the evolutionarily closest homologs GmBXL1 and GmBXL2 display predominant expression in flowers with relatively high expression in stems (Figure 6), suggesting potential functional conservation in stem development while acquiring specialized roles in floral biology. Functional predictions based on phylogenetic relationships further reveal that GmBXL7, GmBXL8, and GmBXL9—orthologs of AtBXL4—likely participate in cell wall polysaccharide metabolism. These enzymes may influence plant–pathogen interactions by modulating cell wall properties including thickness, rigidity, and structural integrity. Notably, we identified a legume-specific clade (Group III) in our phylogenetic analysis (Figure 1). Despite possessing conserved Glyco_hydro_3 and Glyco_hydro_3_C domains characteristic of xylan-hydrolyzing activity (Figure 4), the biological functions of these genes remain unexplored. Given the critical role of nodules in legume-specific symbiosis and their extreme sensitivity to salt stress, it is tempting to speculate that Group III GmBXL genes may play a role in nodule development or stress adaptation. For instance, these genes could be involved in modifying cell wall architecture during nodule formation or in mediating polysaccharide-derived signaling under stress conditions. Although further functional validation is needed, this hypothesis offers a compelling direction for future research aimed at understanding the mechanisms underlying nodule sensitivity to salt and the potential involvement of BXL-mediated cell wall remodeling in this process. As key rate-limiting enzymes in hemicellulose degradation, BXLs play crucial roles not only in cell wall remodeling but also in developmental processes. Previous studies have demonstrated BXL accumulation during fruit development, where they contribute significantly to fruit expansion [14,17]. Our findings reveal that in soybean, GmBXL13 and GmBXL26 exhibit strong high expression specificity in pods and seeds (Figure 6). Notably, GmBXL26 shows nearly negligible expression in other tissues (Figure 6). These results suggest that GmBXL13 and GmBXL26 may serve specialized functions in seed development and potentially influence yield-related traits.
Salt stress represents a major environmental constraint that significantly impairs soybean yield and quality. This abiotic stress induces ROS accumulation, triggering oxidative stress that leads to cellular damage. To counteract these detrimental effects, soybean has evolved multiple defense mechanisms to mitigate ROS-induced oxidative stress. E2, the homolog of A. thaliana GIGANTEA, positively up-regulates the expressions of ROS-scavenging genes, thereby enhancing the salt tolerance of soybean [51]. GmCONSTANS-like 1a improves the salt tolerance by inhibiting the producing of ROS [46]. miR160a promotes salt tolerance by cleaving the transcript of the auxin response factor 16 (GmARF16) [52]. In turn, GmARF16 activates GmMYC2, which encodes a bHLH transcription factor, thereby regulating the biosynthesis of proline and reducing the adaptability to salt stress [52]. Our study reveals that 26 GmBXL genes exhibit significant salt-responsive expression patterns in both leaves and roots (Figure 7). Notably, 24 genes showed marked up-regulation under salt stress, while GmBXL8 and GmBXL9 displayed leaf-specific down-regulation. These differential expression patterns strongly suggest that GmBXL genes participate in salt stress adaptation through cell wall component remodeling. Further investigation should focus on elucidating: (1) the precise regulatory mechanisms of GmBXL genes under salt stress, and (2) their specific roles in cell wall modification. These studies will provide crucial theoretical foundations for developing salt-tolerant soybean cultivars through molecular breeding approaches.

4. Materials and Methods

4.1. Plant Materials and Growth Conditions

The soybean reference cultivar Williams 82 (Wm82) was used for gene expression analyses. Plants were grown under long-day (16 h light/8 h dark) photoperiod in growth chambers (Conviron, Pembina, ND, USA/Winnipeg, MB, Canada) with 60% relative humidity at a constant temperature of 25 °C with a light intensity of 500 μmol m−2 s−1. Well-developed soybean seeds were germinated in vermiculite for 5 days, and then transferred to culture tanks containing Hoagland nutrient solution. When the plants reached V1 developmental stage, the treatment group was given 200 mM/L NaCl, and the control group was kept in NaCl-free nutrient solution. The roots and leaves were collected at the 4th hour after NaCl treatment. An air pump was used to maintain continuous aeration throughout the cultivation process, ensuring sufficient oxygen supply to the solution and promoting efficient root respiration.

4.2. Identification and Annotation of BXL Genes in Soybean

To obtain the BXL protein sequences in soybean, BLASTP was employed on the Phytozome 13 (https://phytozome-next.jgi.doe.gov/, accessed on 15 July 2025) [39], using the A. thaliana BXL protein sequences as a reference. Strict criteria were set for sequence alignment, requiring a minimum sequence homology of 60% and an E-value ≤ 1.0 × 10⁻²⁰. Subsequently, the Hidden Markov Model (HMM) files of the BXL family (Glyco_hydro_3: PF00933, Glyco_hydro_3_C: PF01915, and Fn3-like: PF14310) were downloaded from the Pfam database (http://pfam.xfam.org/search, accessed on 15 July 2025). The HMM search plugin within TBtools software v2.337 was used to retrieve high-confidence genes in G. max, M. truncatula and L. japonicus [53]. All candidates for BXL proteins were confirmed using the CDD (https://www.ncbi.nlm.nih.gov/Structure/cdd/wrpsb.cgi, accessed on 15 July 2025) to filter out incomplete or divergent sequences. All gene names and sequences are listed in Tables S1 and S2.

4.3. Prediction of Physicochemical Properties of Soybean BXL Proteins

The number of amino acids, molecular weight, isoelectric point, instability index, aliphatic index and average hydrophobicity index of all identified soybean BXL proteins were analyzed by Prot Param in the online software ExPASy (https://web.expasy.org/protparam/, accessed on 15 July 2025) [54]. Plant-mPLoc (http://www.csbio.sjtu.edu.cn/bioinf/plant-multi/, accessed on 15 July 2025) was used to predict subcellular localization.

4.4. Phylogenetic Analysis of the BXL Proteins

The corresponding amino-acid sequences of the BXL proteins in G. max, A. thaliana, M. truncatula and L. japinicus were aligned using CLUSTALW to create multiple alignments on MEGA11 [40]. The phylogenetic tree was constructed using IQ-TREE version 2 [41] under the best-fit substitution model Q.plant + R5, as determined by ModelFinder [42]. Branch support was assessed using 1000 ultrafast bootstrap replicates. To further resolve the evolutionary relationships among soybean-specific BXL genes, a separate phylogenetic analysis was conducted using the protein sequences of all identified BXLs in G. max. Multiple sequence alignment was performed as described above, and the phylogenetic tree was reconstructed in IQ-TREE under the WAG + G4 model, which was determined to be optimal for this dataset. The resulting trees were visualized and annotated using the Interactive Tree of Life (https://itol.embl.de, accessed on 15 July 2025).

4.5. Chromosomal Localization and Collinearity Analysis

The chromosomal physical positions of GmBXL genes obtained from Phytozome database were visualized by importing the genome and gene position files into TBtools [53]. The chromosome distribution module in TBtools was also used to plot the gene positions for showing the respective chromosomes and relative positions and distances [55]. The soybean genome fasta file and corresponding GFF annotation file were downloaded from the Phytozome database. The One Step MCScanX plugin in TBtools was employed to analyze these files [56]. The results were visualized using the Circos visualization tool (https://circos.ca/) [57].

4.6. Gene Structure and Conserved Motifs and Domains of BXL Genes

According to the soybean gene feature format (GFF) file, the gene structure diagrams of the 29 members of GmBXL genes in soybean were constructed by TBtools software. The CDD platform was used to predict conserved domains of soybean BXL members. The MEME (https://meme-suite.org/meme/tools/meme, accessed on 15 July 2025) online tool was used to predict and analyze the conserved motifs [58]. The maximum number of motifs was set to 10, with other parameters set to their default values. Finally, the TBtools software was used to visualize the conserved motifs, and conserved domains [53].

4.7. Analysis of Cis-Acting Elements

The upstream sequences (2 Kb) of each GmBXL gene were obtained from the genome database. The PlantCARE program (http://bioinformatics.psb.ugent.be/webtools/plantcare/html/, accessed on 15 July 2025) was employed to identify putative cis-regulatory elements and visualized the types of elements and distribution within the upstream regions by TBtools [53,59]. The details of the cis-elements are listed in Table S4.

4.8. RNA-Seq Data Source and Expression Pattern Analysis of Soybean BXL Genes

According to Phytozome 13 (https://phytozome-next.jgi.doe.gov/, accessed on 15 July 2025), we selected FPKM (Fragments Per Kilobase of transcript per Million mapped reads) data for leaves, stem, shoot apex meristem (sam), flower, root, nodules, pod and seed. These RNA-seq data were originally generated by the Gary Stacey laboratory at the University of Missouri (http://staceylab.missouri.edu/, accessed on 15 July 2025) from the aforementioned tissues. A heatmap showed the expression patterns of soybean BXL genes using TBtools [53]. The FPKM values for GmBXL genes in different tissues are listed in Table S5.

4.9. RNA Extraction and Quantitative Real-Time PCR

Total RNA was extracted by an Ultrapure RNA Kit (CWBIO, Taizhou, China). cDNA was synthesized from 500 μg of RNA using a PrimeScript RT Reagent Kit with gDNA Eraser (Takara, Shiga, Japan). RT–qPCR was performed using a real-time PCR kit (cat. no. RR430; Takara) on a Roche Light Cycler 480 instrument II (Roche Molecular Biochemicals, Rotkreuz, Switzerland). Each 10 μL reaction contained 1 μL of 1:5 diluted cDNA with 0.2 μL of each primer (10 μM), 5 μL SYBR Green Master Mix, and water to a final volume of 10 μL. Each sample was assayed in triplicate with three biological replicates. The expression levels of target genes were normalized using Tubulin as the reference gene. The primers used in this experiment are listed in Table S6.

5. Conclusions

Salt stress represents a major abiotic constraint that severely limits soybean productivity. The identification of salt-responsive genes and elucidation of their molecular mechanisms are crucial for developing stress-resilient soybean cultivars. In this study, we systematically identified 29 BXL genes in soybean, whose genomic expansion was driven by both tandem and segmental duplications. Phylogenetic analysis categorized these genes into three distinct clades. Notably, promoter analysis revealed that most GmBXL genes contain abundant hormone-responsive cis-regulatory elements. Importantly, expression profiling demonstrated that 26 GmBXLs respond to salt stress, strongly implicating their functional involvement in salt stress adaptation. These findings provide valuable genetic resources and molecular insights for future investigations of GmBXL functions and significantly advance our understanding of soybean salt stress response mechanisms.

Supplementary Materials

The following supporting information can be downloaded at: https://www.mdpi.com/article/10.3390/ijms26199534/s1.

Author Contributions

T.S. and L.W. designed the experiments. Y.W., B.L. and W.H. carried out the experiments. Y.W. and M.Y. analyzed the data, and T.S. wrote the paper. All authors have read and agreed to the published version of the manuscript.

Funding

This work was supported by the National Natural Science Foundation of China (grant no. 32301825 to T.S.).

Institutional Review Board Statement

Not applicable.

Informed Consent Statement

Not applicable.

Data Availability Statement

All data generated or analyzed in this study are included in the main text and Supplementary Materials.

Conflicts of Interest

The authors declare no competing interests.

References

  1. Zhang, B.; Gao, Y.; Zhang, L.; Zhou, Y. The plant cell wall: Biosynthesis, construction, and functions. J. Integr. Plant Biol. 2021, 63, 251–272. [Google Scholar] [PubMed]
  2. Shtein, I.; Bar-On, B.; Popper, Z. Plant and algal structure: From cell walls to biomechanical function. Plant Physiol. 2018, 164, 56–66. [Google Scholar] [CrossRef]
  3. Carolina Di Santo, M.; Ilina, N.; Pagano, E.; Sozzi, G. A Japanese plum α-l-arabinofuranosidase/β-D-xylosidase gene is developmentally regulated by alternative splicing. Plant Sci. 2015, 231, 173–183. [Google Scholar] [CrossRef]
  4. Cleemuput, G.; Hessing, M.; Van Oort, M.; Deconynck, M.; Delcour, J. Purification and characterization of a [bata]-D-xylosidase and an endo-xylanase from wheat flour. Plant Physiol. 1997, 113, 377–386. [Google Scholar] [CrossRef] [PubMed]
  5. Knob, A.; Terrasan, C.; Carmona, E. β-xylosidases from filamentous fungi: An overview. World J. Microbiol. Biotechnol. 2010, 26, 389–407. [Google Scholar] [CrossRef]
  6. Sinnott, M. Catalytic mechanism of enzymic glycosyl transfer. Chem. Rev. 1990, 90, 1171–1202. [Google Scholar] [CrossRef]
  7. Minic, Z.; Rihouey, C.; Trung Do, C.; Lerouge, P.; Jouanin, L. Purification and characterization of enzymes exhibiting beta-D-xylosidase activities in stem tissues of Arabidopsis. Plant Physiol. 2004, 135, 867–878. [Google Scholar] [CrossRef]
  8. Henrissat, B. A classification of glycosyl hydrolases based on amino acid sequence similarities. Biochem. J. 1991, 280, 309–316. [Google Scholar] [CrossRef]
  9. Collins, T.; Gerday, C.; Feller, G. Xylanases, xylanase families and extremophilic xylanases. FEMS Microbiol. Rev. 2005, 29, 3–23. [Google Scholar] [CrossRef]
  10. Goujon, T.; Minic, Z.; El Amrani, A.; Lerouxel, O.; Aletti, E.; Lapierre, C.; Joseleau, J.; Jouanin, L. AtBXL1, a novel higher plant (Arabidopsis thaliana) putative beta-xylosidase gene, is involved in secondary cell wall metabolism and plant development. Plant J. 2003, 33, 677–690. [Google Scholar] [CrossRef]
  11. Lee, E.; Koizumi, N.; Sano, H. Identification of genes that are up-regulated in concert during sugar depletion in Arabidopsis. Plant Cell Environ. 2004, 27, 337–345. [Google Scholar] [CrossRef]
  12. Lee, E.; Matsumura, Y.; Soga, K.; Hoson, T.; Koizumi, N. Glycosyl hydrolases of cell wall are induced by sugar starvation in Arabidopsis. Plant Cell Physiol. 2007, 48, 405–413. [Google Scholar] [CrossRef]
  13. Bauer, K.; Nayem, S.; Lehmann, M.; Wenig, M.; Shu, L.; Ranf, S.; Geigenberger, P.; Vlotr, A. β-D-XYLOSIDASE 4 modulates systemic immune signaling in Arabidopsis thaliana. Front. Plant Sci. 2023, 13, 1096800. [Google Scholar] [CrossRef]
  14. Itai, A.; Yoshida, K.; Tanabe, K.; Tamura, F. A β-D-xylosidase-like gene is expressed during fruit ripening in Japanese pear (Pyrus pyrifolia Nakai). J. Exp. Bot. 1999, 50, 877–878. [Google Scholar] [CrossRef]
  15. Genero, M.; Gismondi, M.; Monti, L.; Gabilondo, J.; Budde, C.; Andreo, C.; Lara, M.; Drincovich, M.; Bustamante, C. Cell wall-related genes studies on peach cultivars with differential susceptibility to woolliness: Looking for candidates as indicators of chilling tolerance. Plant Cell Rep. 2016, 35, 1235–1246. [Google Scholar] [CrossRef]
  16. Bustamante, C.; Civello, P.; Martinez, G. Cloning of the promoter region of β-xylosidase (FaXyl1) gene and effect of plant growth regulators on the expression of FaXyl1 in strawberry fruit. Plant Sci. 2009, 177, 49–56. [Google Scholar] [CrossRef]
  17. Lai, B.; Chen, C.; Liu, C.; Zhu, C.; Du, L. Genome-wide identification of BXL family genes in Brassica juncea var. tumida and their expression during swelling of stem. J. Huazhong Agric. Univ. 2020, 39, 155–163. [Google Scholar]
  18. Chen, J.; Qu, C.; Chang, R.; Suo, J.; Yu, J.; Sun, X.; Liu, G.; Xu, Z. Genome-wide identification of BXL genes in Populus trichocarpa and their expression under different nitrogen treatments. Biotech 2020, 10, 57. [Google Scholar] [CrossRef]
  19. Wu, H.; Dong, W.; He, Z.; Li, Y.; Xie, H.; Sun, M.; Shen, Y.; Sun, X. Genome-wide identification and expression analysis of the rice BXL gene family. Biotechnol. Bull. 2025, 41, 87–98. [Google Scholar]
  20. Papiernik, S.; Grieve, C.; Lesch, S.; Yates, S. Effects of salinity, imazethapyr, and chlorimuron application on soybean growth and yield. Commun. Soil Sci. Plant Anal. 2005, 36, 951–967. [Google Scholar] [CrossRef]
  21. Munns, R.; Tester, M. Mechanisms of salinity tolerance. Annu. Rev. Plant Biol. 2008, 59, 651–681. [Google Scholar] [CrossRef] [PubMed]
  22. Leung, H.; Chan, L.; Law, C.; Li, M.; Lam, H. Twenty years of mining salt tolerance genes in soybean. Mol. Breed. 2023, 43, 45. [Google Scholar] [CrossRef] [PubMed]
  23. Guan, R.; Qu, Y.; Guo, Y.; Yu, L.; Liu, Y.; Jiang, J.; Chen, J.; Ren, Y.; Liu, G.; Tian, L.; et al. Salinity tolerance in soybean is modulated by natural variation in GmSALT3. Plant J. 2014, 80, 937–950. [Google Scholar] [CrossRef] [PubMed]
  24. Qi, X.; Li, M.; Xie, M.; Liu, X.; Ni, M.; Shao, G.; Song, C.; Yim, A.; Tao, Y.; Wong, F.; et al. Identification of a novel salt tolerance gene in wild soybean by whole-genome sequencing. Nat. Commun. 2014, 5, 4340. [Google Scholar] [CrossRef]
  25. Qu, Y.; Guan, R.; Bose, J.; Henderson, S.; Wege, S.; Qiu, L.; Gilliham, M. Soybean CHX-type ion transport protein GmSALT3 confers leaf Na+ exclusion via a root derived mechanism, and Cl-exclusion via a shoot derived process. Plant Cell Environ. 2021, 44, 856–869. [Google Scholar] [CrossRef]
  26. Yung, W.; Wang, Q.; Huang, M.; Wong, F.; Liu, A.; Ng, M.; Li, K.; Sze, C.; Li, M.; Lam, H. Priminginduced alterations in histone modifications modulate transcriptional responses in soybean under salt stress. Plant J. 2022, 109, 1575–1590. [Google Scholar] [CrossRef]
  27. Zhang, M.; Cao, J.; Zhang, T.; Xu, T.; Yang, L.; Li, X.; Ji, F.; Gao, Y.; Ali, S.; Zhang, Q.; et al. A putative plasma membrane Na+/H+ antiporter GmSOS1 is critical for salt stress tolerance in Glycine max. Front. Plant Sci. 2022, 13, 870695. [Google Scholar] [CrossRef]
  28. Chen, H.; Chen, X.; Gu, H.; Wu, B.; Zhang, H.; Yuan, X.; Cui, X. GmHKT1;4, a novel soybean gene regulating Na+/K+ ratio in roots enhances salt tolerance in transgenic plants. Plant Growth Regul. 2014, 73, 299–308. [Google Scholar] [CrossRef]
  29. Chen, H.; He, H.; Yu, D. Overexpression of a novel soybean gene modulating Na+ and K+ transport enhances salt tolerance in transgenic tobacco plants. Physiol. Plant 2011, 141, 11–18. [Google Scholar] [CrossRef]
  30. Wang, Z.; Yang, Q.; Shao, Y.; Zhang, B.; Feng, A.; Meng, F.; Li, W. GmLEA2–1, a late embryogenesis abundant protein gene isolated from soybean (Glycine Max (L.) Merr.), confers tolerance to abiotic stress. Acta Biol. Hung. 2018, 69, 270–282. [Google Scholar] [CrossRef]
  31. Liao, H.; Wong, F.; Phang, T.; Cheung, M.; Li, W.; Shao, G.; Yan, X.; Lam, H. GmPAP3, a novel purple acid phosphatase-like gene in soybean induced by NaCl stress but not phosphorus deficiency. Gene 2003, 318, 103–111. [Google Scholar] [CrossRef]
  32. Li, W.; Shao, G.; Lam, H. Ectopic expression of GmPAP3 alleviates oxidative damage caused by salinity and osmotic stresses. New Phytol. 2008, 178, 80–91. [Google Scholar] [CrossRef]
  33. Golldack, D.; Luking, I.; Yang, O. Plant tolerance to drought and salinity: Stress regulating transcription factors and their functional significance in the cellular transcriptional network. Plant Cell Rep. 2011, 30, 1383–1391. [Google Scholar] [CrossRef]
  34. Khan, S.; Li, M.; Wang, S.; Yin, H. Revisiting the role of plant transcription factors in the battle against abiotic stress. Int. J. Mol. Sci. 2018, 19, 1634. [Google Scholar] [CrossRef]
  35. Liu, A.; Xiao, Z.; Li, M.; Wong, F.; Yung, W.; Ku, Y.; Wang, Q.; Wang, X.; Xie, M.; Yim, A.; et al. Transcriptomic reprogramming in soybean seedlings under salt stress. Plant Cell Environ. 2019, 42, 98–114. [Google Scholar] [CrossRef]
  36. Liu, J.; Zhang, W.; Long, S.; Zhao, C. Maintenance of cell wall integrity under high salinity. Int. J. Mol. Sci. 2021, 22, 3260. [Google Scholar] [CrossRef] [PubMed]
  37. Muhammad, A.; Hafiz, M.; Muhammda, I.; Faheem, S.; Jeong, D.; Seung, H.; Soo, I.; Gyuhwa, C. Systems identification and characterization of cell wall reassembly and degradation related geges in Glycine max (L.) Merill, a bioenergy legume. Sci. Rep. 2017, 7, 10862. [Google Scholar]
  38. Jin, T.; Shan, Z.; Zhou, S.; Yang, Q.; Gai, J.; Li, Y. GmDNAJC7 from soybean is involved in plant tolerance to alkaline-salt, salt, and drought stresses. Agronomy 2022, 12, 1419. [Google Scholar] [CrossRef]
  39. Goodstein, D.; Shu, S.; Howson, R.; Neupane, R.; Hayes, R.; Fazo, J.; Mitros, T.; Dirks, W.; Hellsten, U.; Putnam, N.; et al. Phytozome: A comparative platform for green plant genomics. Nucleic Acids Res. 2012, 40, D1178–D1186. [Google Scholar] [CrossRef]
  40. Tamura, K.; Stecher, G.; Kumar, S. MEGA11, Molecular evolutionary genetics analysis version 11. Mol. Biol. Evol. 2021, 38, 3022–3027. [Google Scholar] [CrossRef] [PubMed]
  41. Minh, B.Q.; Schmidt, H.A.; Chernomor, O.; Schrempf, D.; Woodhams, M.D.; von Haeseler, A.; Lanfear, R. IQ-TREE 2, New Models and Efficient Methods for Phylogenetic Inference in the Genomic Era. Mol. Biol. Evol. 2022, 37, 1530–1534. [Google Scholar] [CrossRef]
  42. Kalyaanamoorthy, S.; Minh, B.Q.; Wong, T.K.; Von Haeseler, A.; Jermiin, L.S. ModelFinder: Fast model selection for accurate phylogenetic estimates. Nat. Methods 2017, 14, 587–589. [Google Scholar] [CrossRef] [PubMed]
  43. Cannon, S.; Mitra, A.; Baumgarten, A.; Young, N.; May, G. The roles of segmental and tandem gene duplication in the evolution of large gen families in Arabidopsis thaliana . BMC Plant Biol. 2004, 4, 10. [Google Scholar] [CrossRef]
  44. Ramsey, J.; Schemske, D. Pathways, mechanisms, and rates of polyploid formation in flowering plants. Resil. Stab. Ecol. Syst. 1998, 29, 467–501. [Google Scholar] [CrossRef]
  45. Hruba, P.; Honys, D.; Twell, D.; Capkova, V.; Tupy, J. Expression of beta-galactosidase and beta-xylosidase genes during microspore and pollen development. Planta 2005, 220, 931–940. [Google Scholar] [CrossRef]
  46. Xu, C.; Shan, J.; Liu, T.; Wang, Q.; Ji, Y.; Zhang, Y.; Wang, M.; Xia, N.; Zhao, L. CONSTANS-LIKE 1a positively regulates salt and drought tolerance in soybean. Plant Physiol. 2023, 191, 2427–2446. [Google Scholar] [CrossRef] [PubMed]
  47. Wang, Z.; Zhou, Z.; Liu, Y.; Liu, T.; Li, Q.; Ji, Y.; Li, C.; Fang, C.; Wang, M.; Wu, M.; et al. Functional Evolution of Phosphatidylethanolamine Binding Proteins in Soybean and Arabidopsis. Plant Cell 2015, 27, 323–336. [Google Scholar] [CrossRef]
  48. Wendel, J. Genome evolution in polyploids. Plant Mol. Biol. 2000, 42, 225–249. [Google Scholar] [CrossRef]
  49. Kondrashov, F.; Rogozin, I.; Wolf, Y.; Koonin, E. Selection in the evolution of gene duplications. Genome Biol. 2002, 3, RESEARCH0008. [Google Scholar] [CrossRef]
  50. Conant, G.; Wolfe, K. Turning a hobby into a job: How duplicated genes find new functions. Nat. Rev. Genet. 2008, 9, 938–950. [Google Scholar] [CrossRef] [PubMed]
  51. Dong, L.; Hou, Z.; Li, H.; Li, Z.; Fang, C.; Kong, L.; Li, Y.; Du, H.; Li, T.; Wang, L.; et al. Agronomical selection on loss-of-function of GIGANTEA simultaneously facilitates soybean salt tolerance and early maturity. J. Integr. Plant Biol. 2022, 64, 1866–1882. [Google Scholar] [CrossRef]
  52. Wang, C.; Li, X.; Zhuang, Y.; Sun, W.; Cao, H.; Xu, R.; Kong, F.; Zhang, D. A novel miR160a-GmARF16-GmMYC2 module determines soybean salt tolerance and adaptation. New Phytol. 2024, 241, 2176–2192. [Google Scholar] [CrossRef] [PubMed]
  53. Chen, C.; Wu, Y.; Li, J.; Wang, X.; Zeng, Z.; Xu, J.; Liu, Y.; Feng, J.; Chen, H.; He, Y.; et al. TBtools-II: A “one for all, all for one” bioinformatics platform for biological big-data mining. Mol. Plant 2023, 16, 1733–1742. [Google Scholar] [CrossRef] [PubMed]
  54. Wilkins, M.; Gasteiger, E.; Bairoch, A.; Sanchez, J.; Williams, K.; Appel, R.; Hochstrasser, D. Protein identification and analysis tools in the ExPASy server. Methods Mol. Biol. 1999, 112, 531–532. [Google Scholar]
  55. Pei, X.; Wang, F.; Du, H.; He, M.; Li, L.; Gou, C.; Chen, Z.; Wang, Y.; Kong, F.; Zhao, L. Genome-wide identification and functional prediction of BYPASS1-related (BPS1) homologs in soybean. Mol. Breed. 2023, 43, 59. [Google Scholar] [CrossRef]
  56. Wang, Y.; Tang, H.; Debarry, D.; Tan, X.; Li, J.; Wang, X.; Lee, T.; Jin, H.; Marler, B.; Guo, H. MCScanX: A toolkit for detection and evolutionary analysis of gene synteny and collinearity. Nucleic Acids Res. 2012, 40, e49. [Google Scholar] [CrossRef] [PubMed]
  57. Krzywinski, M.; Schein, J.; Birol, I.; Connors, J.; Gascoyne, R.; Horsman, D.; Jones, S.; Marra, M. Circos: An information aesthetic for comparative genomics. Genome Res. 2009, 19, 1639–1645. [Google Scholar] [CrossRef]
  58. Bailey, T.; Boden, M.; Buske, F.; Frith, M.; Grant, C.; Clementi, L.; Ren, J.; Li, W.; Noble, W. MEME SUITE: Tools for motif discovery and searching. Nucleic Acids Res. 2009, 37, 202–208. [Google Scholar] [CrossRef]
  59. Kelley, L.; Mezulis, S.; Yates, C.; Wass, M.; Sternberg, M. The Phyre2 web portal for protein modeling, prediction and analysis. Nature 2015, 10, 845–858. [Google Scholar] [CrossRef]
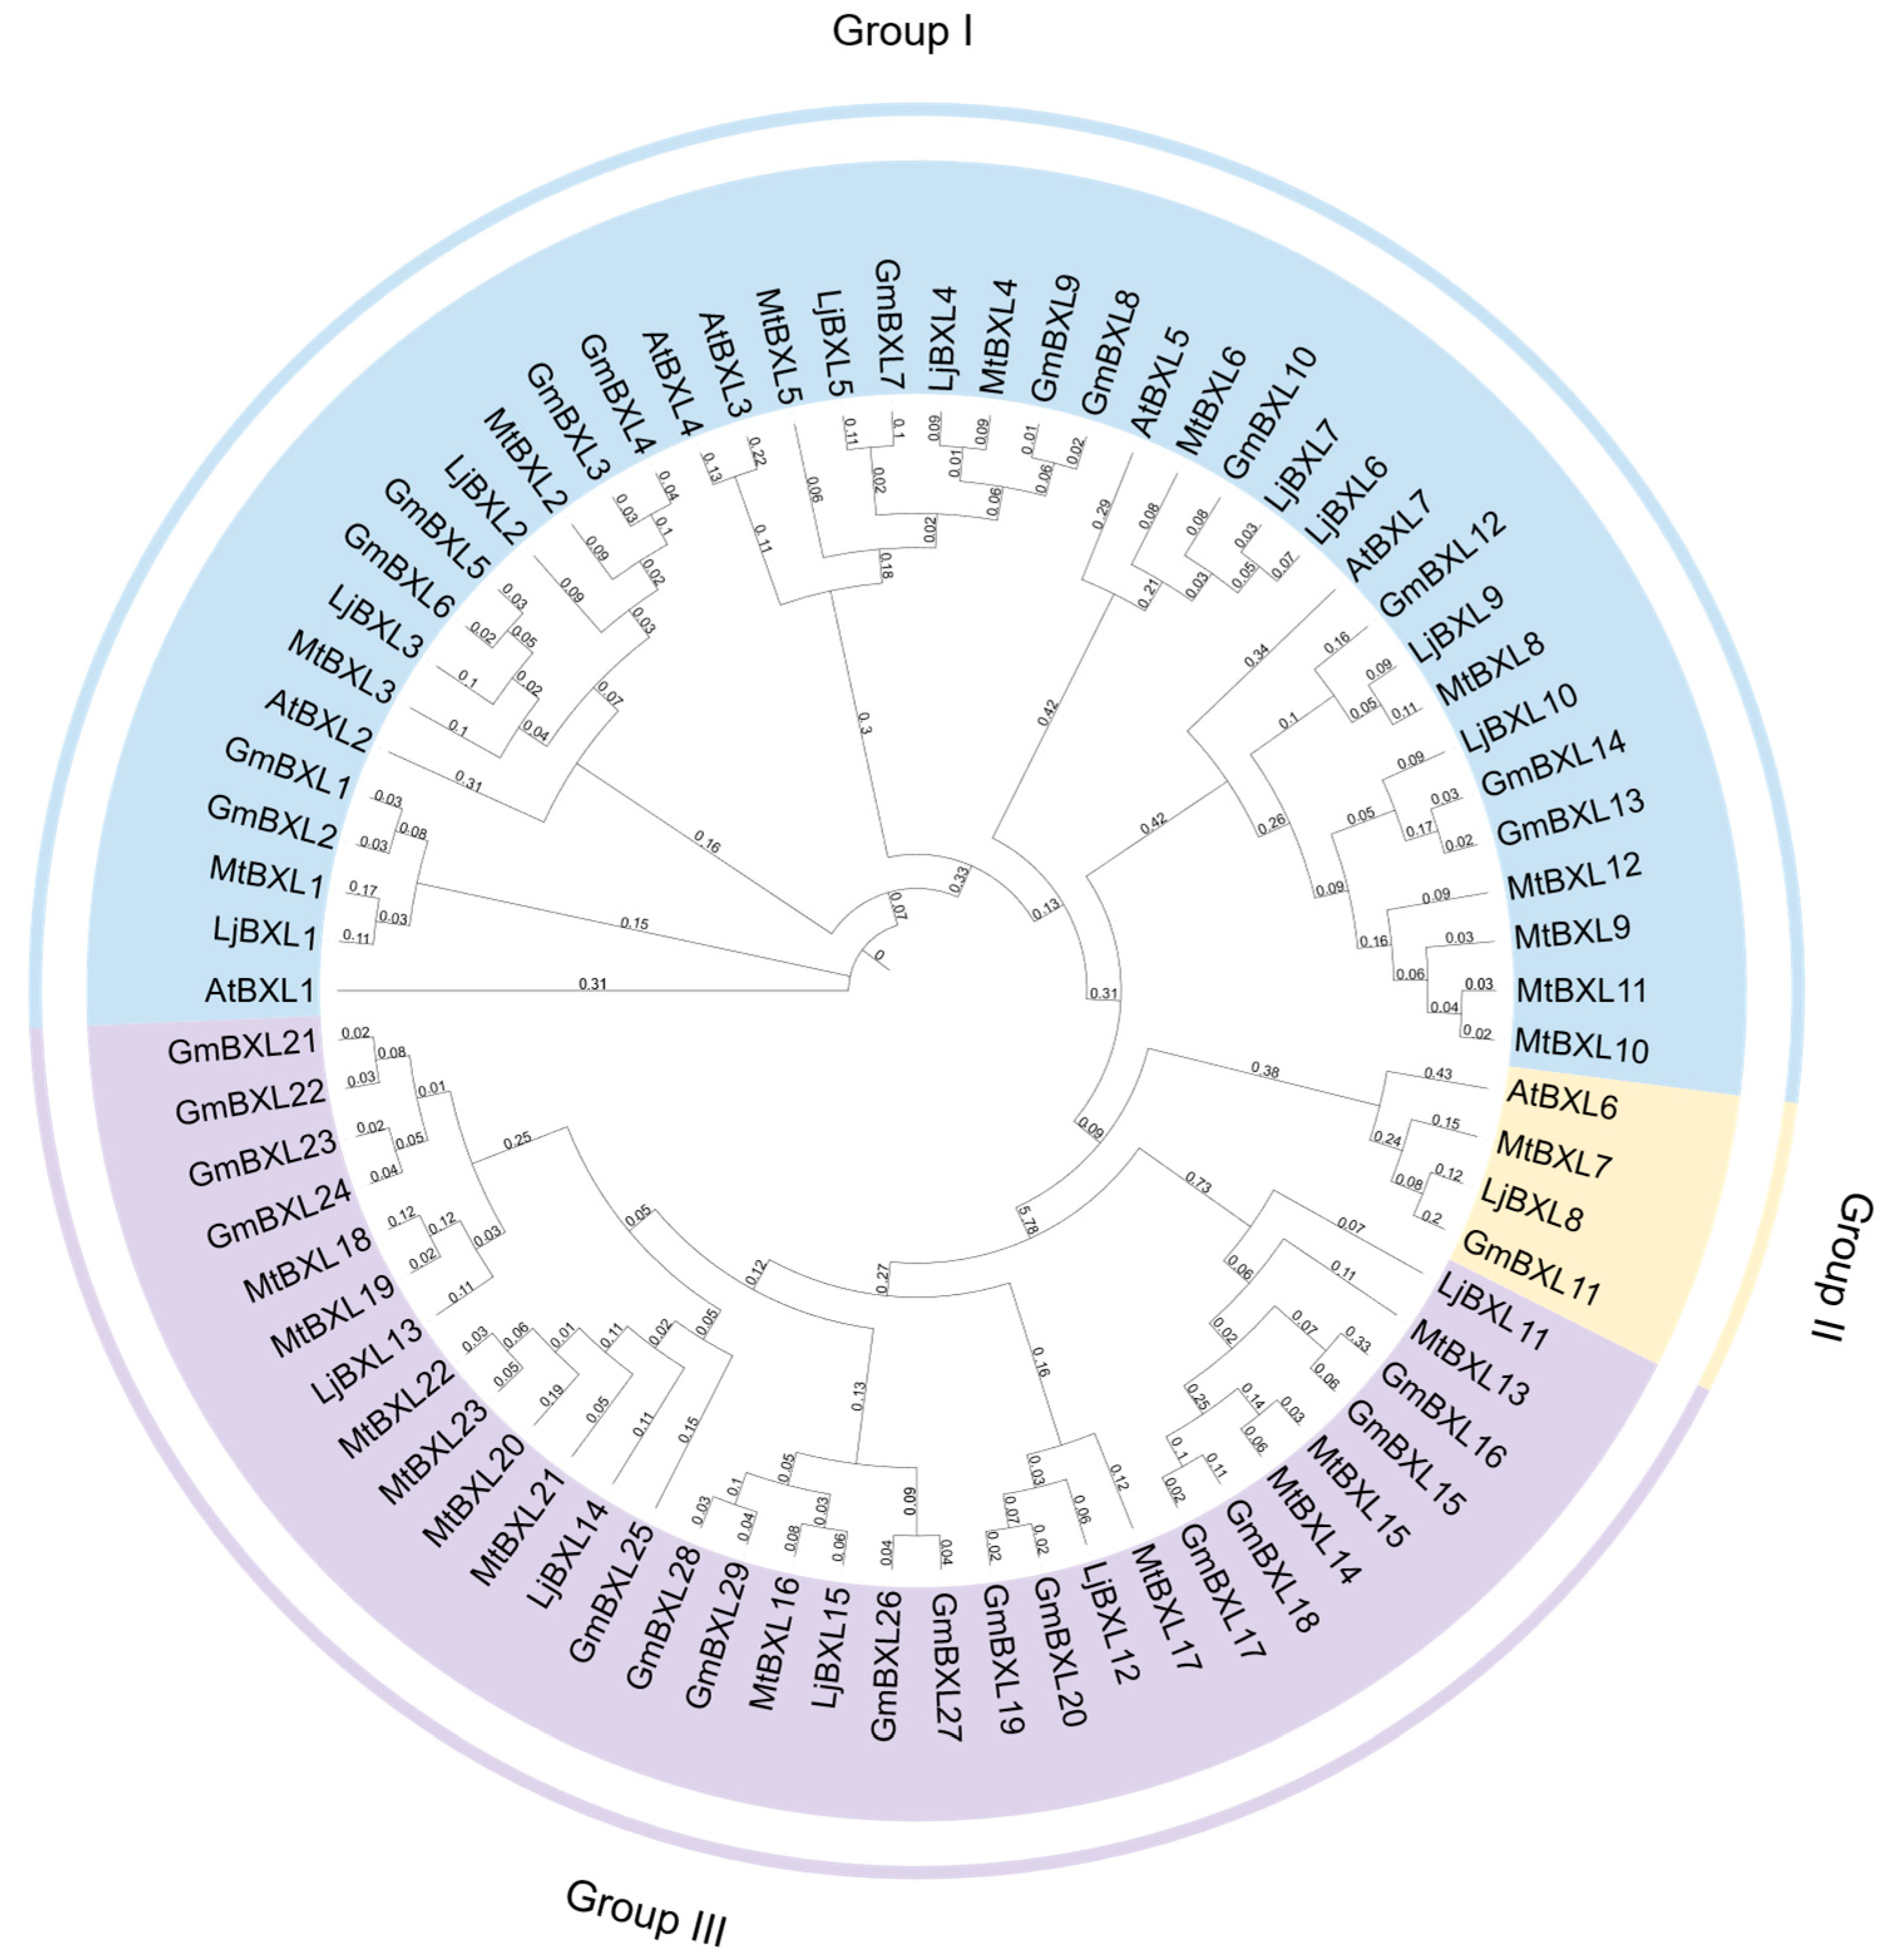
Figure 1. Phylogenetic tree of Arabidopsis and legumes BXLs. The sequences of published BXLs in Arabidopsis thaliana, Glycine max, Medicago truncatula, and Lotus japonicus were obtained from Phytozome 13 (https://phytozome-next.jgi.doe.gov/, accessed on 15 July 2025) [39]. The corresponding amino-acid sequences were aligned using CLUSTALW to create multiple alignments on MEGA11 [40]. The phylogenetic tree was constructed using IQ-TREE [41] under the best-fit substitution model Q.plant + R5 [42]. Log-likelihood of the tree: −39,608.0998 (s.e. 821.0322). Unconstrained log-likelihood (without tree): −5860.0545. Number of free parameters (#branches + #model parameters): 153. Akaike information criterion (AIC) score: 79,522.1996; Corrected Akaike information criterion (AICc) score: 79,588.1996. Bayesian information criterion (BIC) score: 80,251.4269. Total tree length (sum of branch lengths): 21.2530. Sum of internal branch lengths: 14.2670 (67.1291% of tree length). All proteins were categorized into three clades; the accession numbers of these genes are listed in Table S1.
Ijms 26 09534 g001
Figure 2. The distribution of soybean BXL genes across the chromosomes. The positions of GmBXL genes are mapped on their corresponding chromosomes. The vertical scale (left) indicates chromosomal length in millions of base pairs (Mb). The color on the chromosomes indicates the density of genes.
Ijms 26 09534 g002
Figure 3. Chromosomal distribution and inter-chromosomal relationships of GmBXL genes in soybean. Gray lines represent the gene pairs in the whole genome. The numerical scale along each chromosome indicates the position in megabases (Mb), providing a reference for gene localization. The heatmaps adjacent to each chromosome illustrate the density or intensity of a particular genomic feature. The color gradient in the heatmap, ranging from yellow to red, corresponds to the legend on the top right corner, where yellow represents lower values and red indicates higher values. The red lines highlight collinear relationships (syntenic gene pairs) within the GmBXL gene family.
Ijms 26 09534 g003
Figure 4. Analysis of conserved motifs, protein domains and gene structures of GmBXL genes. (A) The phylogenetic tree was constructed using IQ-TREE [41] under the best-fit substitution model WAG + G4 [42]. Log-likelihood of the tree: −19,185.8304 (s.e. 352.6312). Unconstrained log-likelihood (without tree): −5704.1245. Number of free parameters (#branches + #model parameters): 56. Akaike information criterion (AIC) score: 38,483.6608; Corrected Akaike information criterion (AICc) score: 38,491.7011. Bayesian information criterion (BIC) score: 38,749.4599. Total tree length (sum of branch lengths): 9.5957. Sum of internal branch lengths: 7.3326 (76.4156% of tree length). (B) The phylogenetic relationship among GmBXL members, along with 10 identified conserved protein motifs. (C) Three conserved protein domains of GmBXLs were identified using CDD, with each domain represented in different colors. The scale bars at the bottom indicate protein length. (D) The gene structures of GmBXL genes with yellow boxes representing coding sequences (CDS), black lines indicating introns, and green boxes representing untranslated regions (UTRs). The scale bar indicates the genomic sequences lengths.
Ijms 26 09534 g004
Figure 5. Cis-element analysis of GmBXL promoters in soybean. Color-coded boxes denote distinct cis-element types, as identified on the right. The scale bar at the bottom indicates promoter sequence length (base pairs).
Ijms 26 09534 g005
Figure 6. Expression analysis of GmBXL genes across soybean tissues. The expression level of GmBXL genes were normalized as log2FPKM+1 and visualized in a heatmap. A color gradient from blue to red represents expression levels, with blue indicating low expression and red indicting high expression. A dendrogram on the left side of the heatmap illustrates the hierarchical clustering of GmBXL genes based on their expression patterns across different tissues.
Ijms 26 09534 g006
Figure 7. RT-qPCR validation of GmBXL genes under salt stress. Plants at the V1 developmental stage were treated with either 200 mM NaCl or a NaCl-free nutrient solution (control). Following four hours of treatment, samples were collected and expression changes in GmBXL genes were analyzed using RT-qPCR. Transcript levels of GmBXL genes were determined in roots and leaves. The differential expression analysis was conducted based on the 2−∆∆ct method. Relative expression was normalized to Tubulin and data are the mean ± SD of three biological replicates. Student’s t tests were used to determine statistical significance (* p < 0.05; ** p < 0.01; *** p < 0.001; **** p < 0.0001; N.S. indicates no significant difference).
Ijms 26 09534 g007
Disclaimer/Publisher’s Note: The statements, opinions and data contained in all publications are solely those of the individual author(s) and contributor(s) and not of MDPI and/or the editor(s). MDPI and/or the editor(s) disclaim responsibility for any injury to people or property resulting from any ideas, methods, instructions or products referred to in the content.