Article

Anandamide Alters Glycolytic Activity in Streptococcus mutans: Metabolomics and Stable Isotope Labeling Study

by
Goldie Wolfson
1,2,
Doron Steinberg
1,*,
Alexandra Eliassaf
3,
Anna Morshina
3,
César Jessé Enríquez-Rodríguez
3,4,5,6,
Itzhack Polacheck
2,
Maya Korem
2 and
Ori Shalev
3,*
1
Institute of Biomedical and Oral Research (IBOR), Faculty of Dental Medicine, The Hebrew University of Jerusalem, Jerusalem 9112102, Israel
2
Department of Clinical Microbiology and Infectious Diseases, Hadassah-Hebrew University Medical Center, Jerusalem 9112001, Israel
3
The Metabolic Profiling Unit, The Core Research Facility, Faculty of Medicine, The Hebrew University of Jerusalem, Jerusalem 9112102, Israel
4
Respiratory Medicine Department, Hospital del Mar Research Institute-Hospital del Mar-BRN, 08003 Barcelona, Spain
5
Medicine and Life Sciences Department, Universitat Pompeu Fabra (UPF), 08003 Barcelona, Spain
6
Centro de Investigación Biomédica en Red, Área de Enfermedades Respiratorias (CIBERES), Instituto de Salud Carlos III, 28029 Madrid, Spain
*
Authors to whom correspondence should be addressed.
Int. J. Mol. Sci. 2025, 26(17), 8401; https://doi.org/10.3390/ijms26178401
Submission received: 31 July 2025 / Revised: 25 August 2025 / Accepted: 26 August 2025 / Published: 29 August 2025
(This article belongs to the Special Issue Antimicrobial Materials: Molecular Developments and Applications)

Abstract

Streptococcus mutans (S. mutans) is a cariogenic bacterium in the oral cavity that plays a significant role in plaque formation and dental caries. In previous research by our group, we showed that the endocannabinoid anandamide (AEA) has anti-bacterial and anti-biofilm activities against S. mutans. Here, we aimed to investigate its effects on S. mutans through metabolomics analyses. S. mutans was cultivated in the absence or presence of AEA at a sub-minimum inhibitory concentration (MIC), and changes in metabolites and metabolic pathways were assessed through liquid chromatography–mass spectrometry (LC-MS). Treatment of S. mutans using AEA at 10 µg/mL significantly disturbed the glycolytic flux in the bacteria, which was indicated by a reduced glucose uptake into the cell, suppression of key glycolytic intermediates, reduced acid production into the media, imbalance of NAD+/NADH, and decreased adenosine triphosphate (ATP) production. The disruption of carbohydrate metabolism impacts critical cellular processes, including energy production, redox balance, and biosynthetic pathways, leading to metabolic stress and impaired cellular function. These results highlight the mode of action of AEA as an antimicrobial agent. Altogether, these findings suggest that AEA has potential as a novel antimicrobial agent in the development of therapeutics against S. mutans.

1. Introduction

The endocannabinoid system, an endogenous system in humans, is composed of (1) the lipid active endogenous ligands N-arachidonoylethanolamine (anandamide; AEA) and 2-arachidonoylglycerol (2-AG); (2) biosynthetic enzymes; (3) degradative enzymes; and (4) the CB1 and CB2 cannabinoid receptors (2). The precursors of endocannabinoids (e.g., N-acyl-phosphatidylethanolamine (NAPE) and phosphatidylinositol-4,5-bisphosphate (PIP2)) are present in the lipid membranes. Endocannabinoids are produced upon demand, usually after activation of certain G-protein-coupled receptors (GPCRs) and in response to an increase in the intracellular calcium levels [1].
AEA, the first endocannabinoid discovered by R. Mechoulam in 1992 [2], has been extensively studied. Its roles in neural signaling, immune modulation, and physiological regulation are well documented [1,3,4,5]. In vivo studies of AEA have shown its ability to influence cellular processes and metabolic pathways, including appetite control, pain modulation, and cardiovascular and gastrointestinal system functions [1,6,7,8]. Importantly, AEA has not been found to cause mortality in in vivo studies where mice were treated with AEA, even at considerably high concentrations (50 mg/kg) [9]. In contrast to research in humans and mice, AEA’s effects on microorganisms have not been thoroughly investigated. A few studies in recent years have investigated the antimicrobial properties of AEA on several microbes. These studies have observed its activity against pathogens such as methicillin-resistant Staphylococcus aureus (MRSA) [1,6,7,8], Streptococcus salivarius [10], Candida albicans [11], and, recently, Streptococcus mutans [12]. These antimicrobial effects may be linked to AEA’s ability to disrupt key metabolic pathways essential for energy production and survival in many microorganisms. However, investigations into AEA’s effects on microbial glycolysis and survival mechanisms remain largely unexplored.
Streptococcus mutans (S. mutans) is a cariogenic bacterium in the oral cavity that plays a significant role in plaque formation and dental caries. Dental caries caused by S. mutans is a prevalent, widespread disease with a tremendous economic burden [13]. The development of dental caries is initiated by the generation of organic acids from plaque bacteria that lower the pH of the tooth’s surface, which causes demineralization of the tooth enamel [14]. Despite the numerous interspecies interactions and battle for dominance in the plaque biofilms, S. mutans is the organism most implicated for dental caries [13]. In reducing or eliminating the disease, much research is focused on targeting S. mutans and reducing its presence in dental plaque [13]. Several factors that contribute to its dominance in dental plaque and pathogenicity include (1) its acidogenicity, i.e., ability to ferment sugar to lactic acid rapidly and under considerably low pH conditions which are needed to initiate caries, (2) its aciduricity, i.e., its ability to survive in acidic environments, (3) its strong adherence to tooth surfaces, and (4) its production of extracellular polysaccharides (EPSs) that enhance biofilm formation [13,14,15].
S. mutans is able to metabolize a wide variety of carbohydrates through glycolysis—its primary and only energy-generating pathway [15]. Between numerous phosphoenolpyruvate-dependent sugars, phosphotransferase systems (PTSs), and a few ATP-binding cassette (ABC) transporters, various mono-, di-, and oligosaccharides can be internalized, phosphorylated, and processed to fructose-6-phosphate (F6P) and then fermented by glycolysis, where the end results are the production of organic acids—primarily lactic acid [15]. The ability of S. mutans to catabolize glucose, fructose, sucrose, and other dietary carbohydrates is a key driver of its pathogenicity, making glycolysis and glucose uptake attractive targets for drug development for therapeutic intervention [16].
Efforts to target S. mutans metabolism have highlighted various compounds with potential inhibitory properties. For example, xylitol, fluoride, and trans-cinnamaldehyde have been shown to disrupt carbohydrate metabolism by either interfering with glucose uptake or inhibiting specific enzymatic steps in glycolysis [17,18,19,20]. Our previous work demonstrated the anti-bacterial effects of AEA on S. mutans [12], but the underlying mechanisms, particularly any distinct effects on glucose uptake and glycolytic flux, remain unclear.
In this study, we examine the metabolic effects of AEA on S. mutans, focusing on its dual inhibition of glucose uptake and glycolysis. Using metabolomics and isotopic tracing, we reveal that AEA disrupts bacterial energy production and metabolic homeostasis.

2. Results

2.1. Metabolic Profiling of S. mutans Treated with AEA

Metabolic profiling was conducted on S. mutans treated with AEA (10 µg/mL, below the minimum inhibitory concentration (MIC); Supplementary Materials Figure S1). Samples were taken at two time points (1 and 6 h) and analyzed using liquid chromatography–mass spectrometry (LC-MS)-based metabolomics to analyze alterations in metabolic pathways. Overall, 208 metabolites were identified. Table S1 lists all 208 identified metabolites, including their classifications and pathway associations. The principal component analysis (PCA) score plot (Figure 1A,C) illustrates the unbiased groupings between the control samples (green) and the AEA-treated samples at both time points. At both 1 h (Figure 1A) and 6 h (Figure 1C), there is a clear separation between the control and treated groups with a complete lack of overlap in the ellipses of each group, indicating a strong difference in the treatment effect.
On a volcano plot, of the 208 metabolites identified in the study, 155 were downregulated in AEA-treated samples after 1 h, with 96 calculated to be statistically significant (Figure 1B). After 6 h, 164 were downregulated, with 151 being identified as statistically significant (Figure 1D) compared to controls. Furthermore, analysis of the downregulated metabolites revealed that a subset of statistically significant changes at both the 1 and 6 h time points was associated with glycolysis. This suggests a targeted disruption of glucose metabolism after just 1 h of incubation, which is still maintained after 6 h. p-values for the metabolites are listed in Table S2 for 1 h and Table S3 for 6 h.

2.2. Key Glycolytic Intermediates Are Suppressed

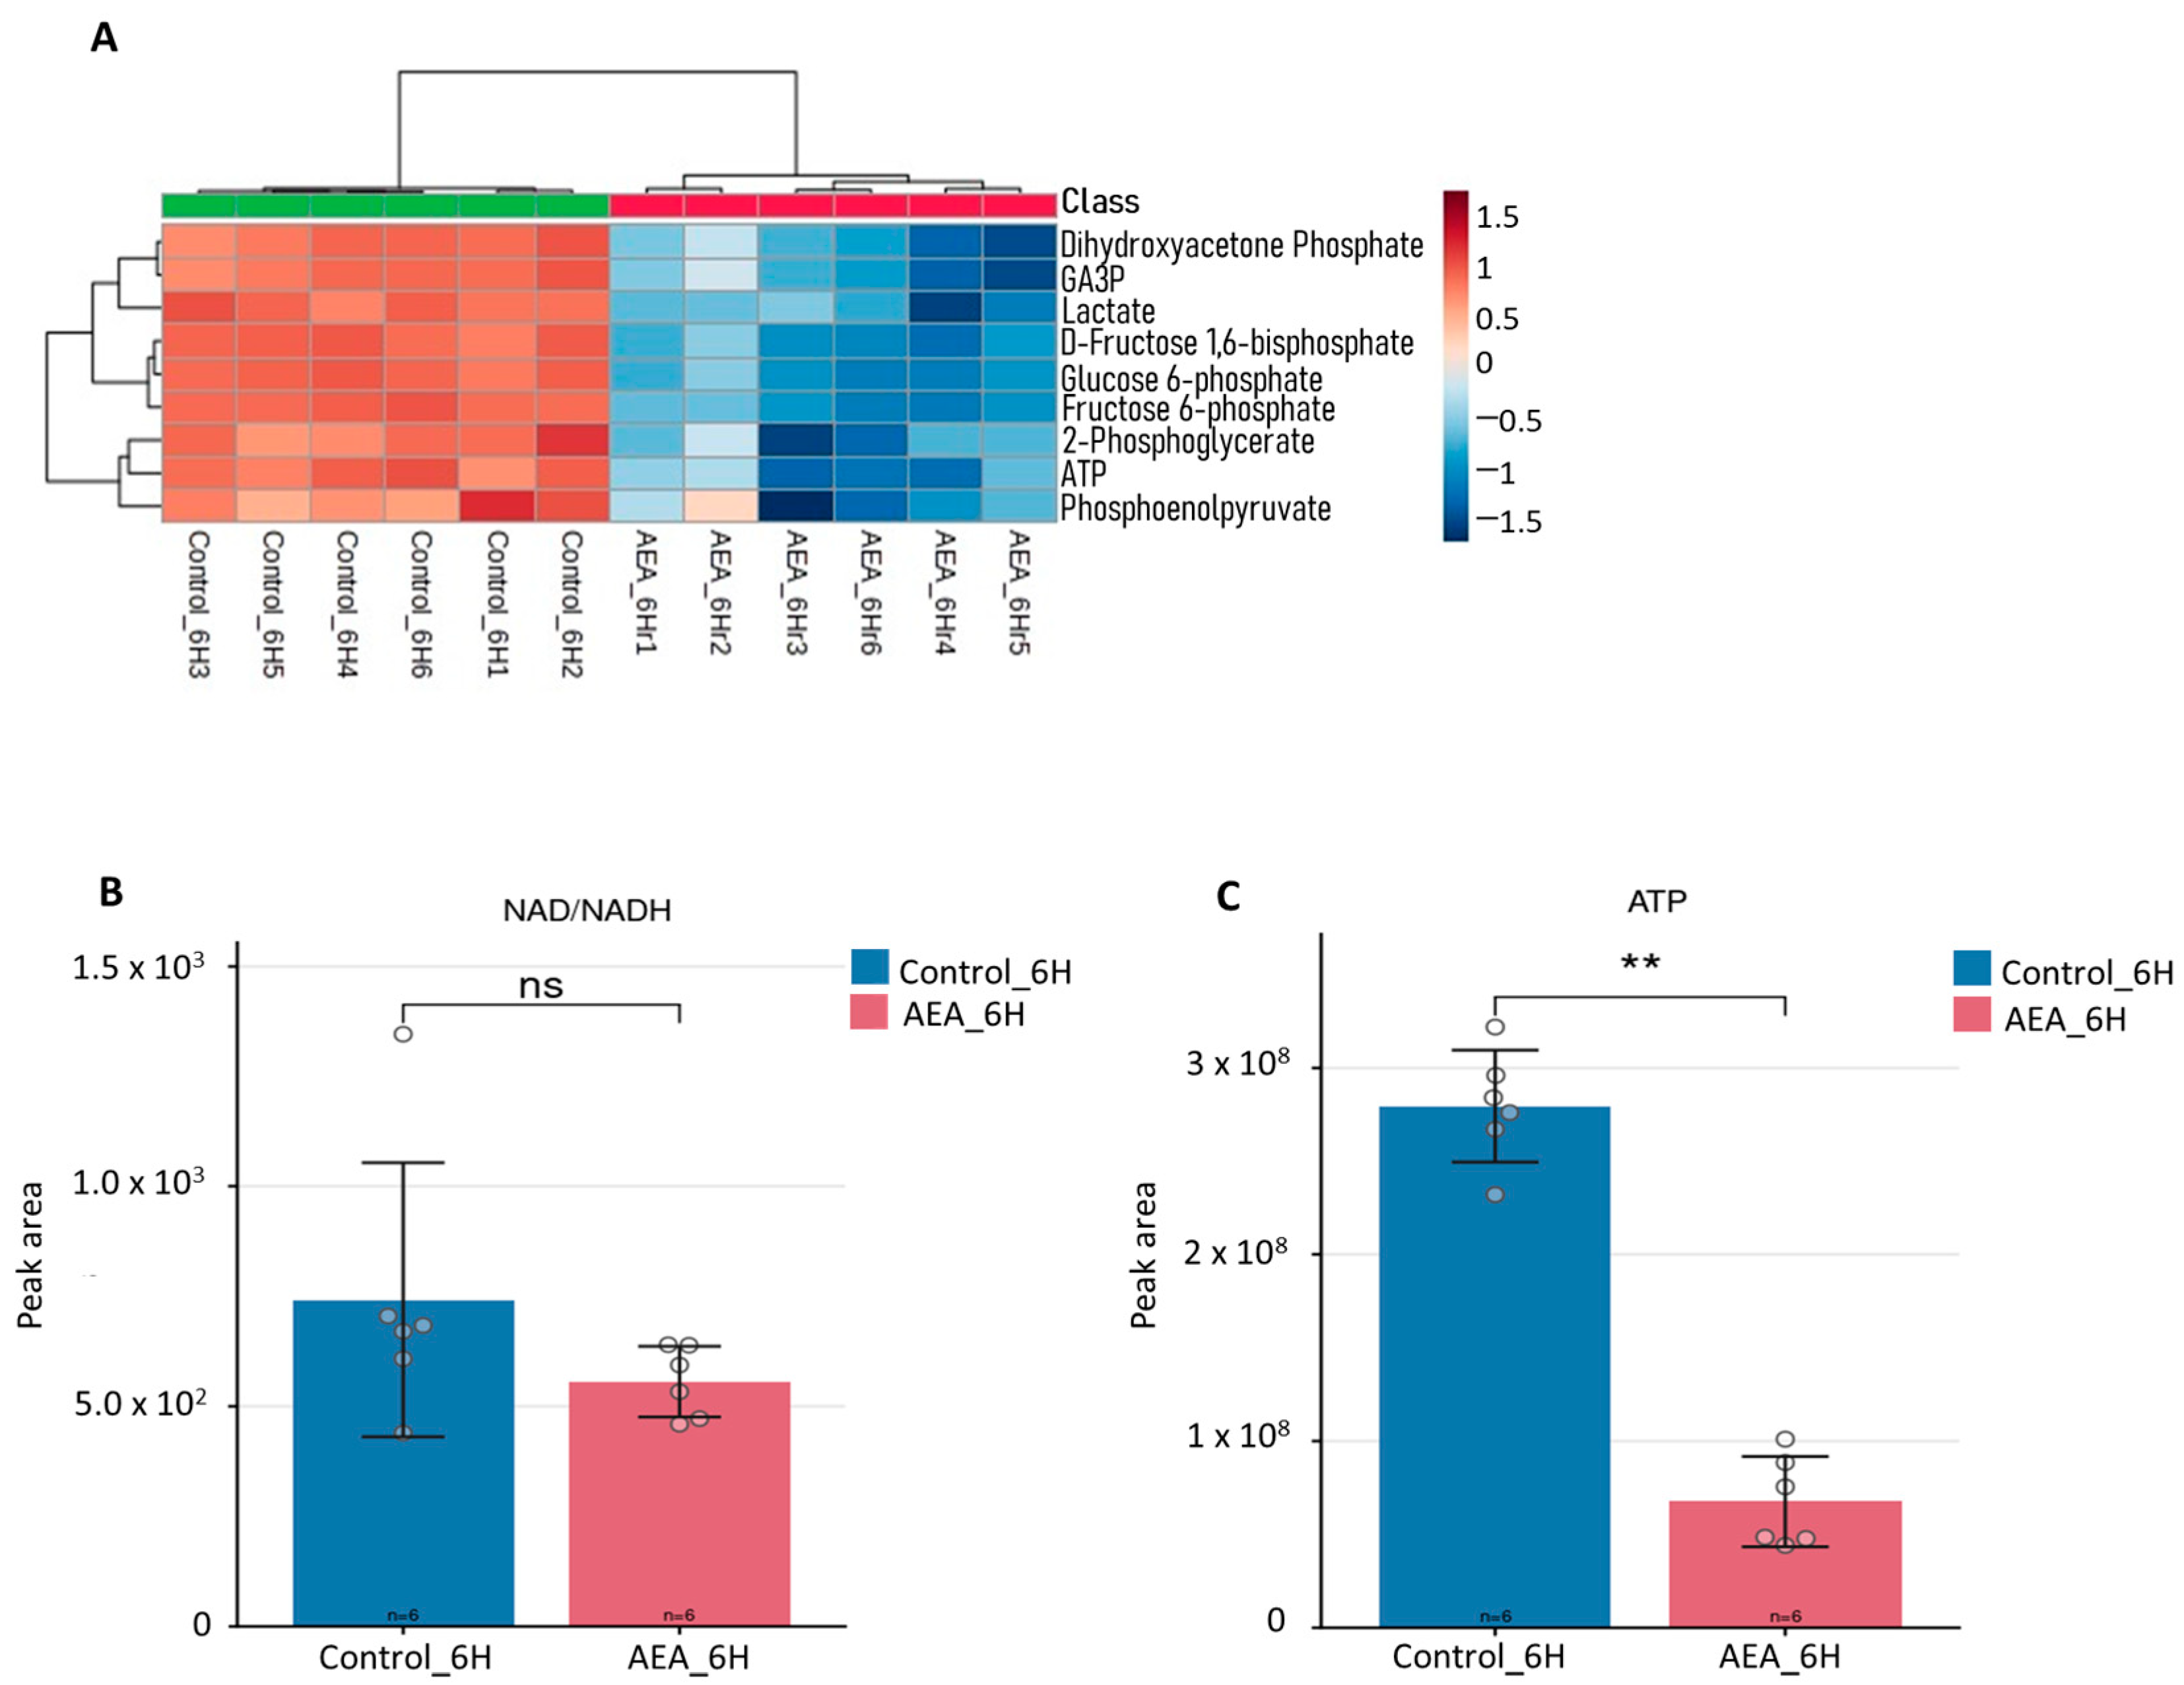
To validate the findings from the untargeted analysis in Figure 1, a more focused analysis of glycolytic intermediates was conducted. Heatmap analysis indicated that key intermediates in the glycolysis cycle were significantly reduced in treated cells compared to controls (Figure 2A). Levels of glucose-6-phosphate (G6P) and fructose-6-phosphate (F6P), which represent early glycolytic steps, were markedly decreased, suggesting a limitation in glucose uptake or entry into the glycolysis cycle (Figure 2A). Similarly, fructose-1,6-bisphosphate (F1,6BP), a key intermediate at the committed step of glycolysis, was significantly lower in treated cells (Figure 2A). These reductions indicate that AEA inhibits early glycolytic activity, thereby restricting carbon flow through the pathway.
Further downstream, intermediates of mid- and late glycolysis, including 2-phosphoglycerate (2-PG) and phosphoenolpyruvate (PEP), were also significantly reduced in treated cells (Figure 2A). The suppression of these intermediates highlights a metabolic bottleneck, further limiting the conversion of glucose to pyruvate. Consistent with this observation, pyruvate, an important end product of the glycolysis pathway, was significantly reduced under treatment conditions relative to controls (Figure 2A). The coordinated downregulation of glycolytic intermediates suggests that AEA treatment broadly suppresses glycolytic flux, impairing glucose-derived energy production.

2.2.1. NAD+/NADH Imbalance Reflects Redox Disruption

The NAD+/NADH ratio, a key indicator of cellular redox balance, was reduced in AEA-treated cells compared to controls (Figure 2B), indicating a disruption in redox homeostasis. This reduction impairs NAD+ regeneration, which is essential for glycolysis, where NAD+ acts as an electron acceptor during the oxidation of glyceraldehyde-3-phosphate. Consequently, the decreased NAD+/NADH ratio likely diminishes glycolytic activity and energy production. In S. mutans, which lacks a complete electron transport chain, maintaining the NAD+/NADH balance is critical for sustaining glycolytic flux and overall metabolic function. The ratio imbalance was associated with NAD+ accumulation in both control and AEA-treated samples, with a slower accumulation observed in the AEA-treated group compared to controls, rather than a depletion of NADH. The observed decrease in this ratio, therefore, contributes to metabolic disruption and impaired cellular processes under AEA treatment.

2.2.2. Compromised Adenosine Triphosphate (ATP) Production

ATP levels, a direct indicator of energy metabolism, were statistically significantly lower after 6 h incubation with AEA, showing a 75% reduction compared to controls (Figure 2C), which is consistent with the observed impairment of glycolytic activity. Glycolysis is a primary source of ATP production, particularly under glycolytic conditions. These results demonstrate that AEA-induced glycolytic suppression directly compromises energy availability, likely impacting cell function and survival.

2.3. Pathway Enrichment and Impact Analysis

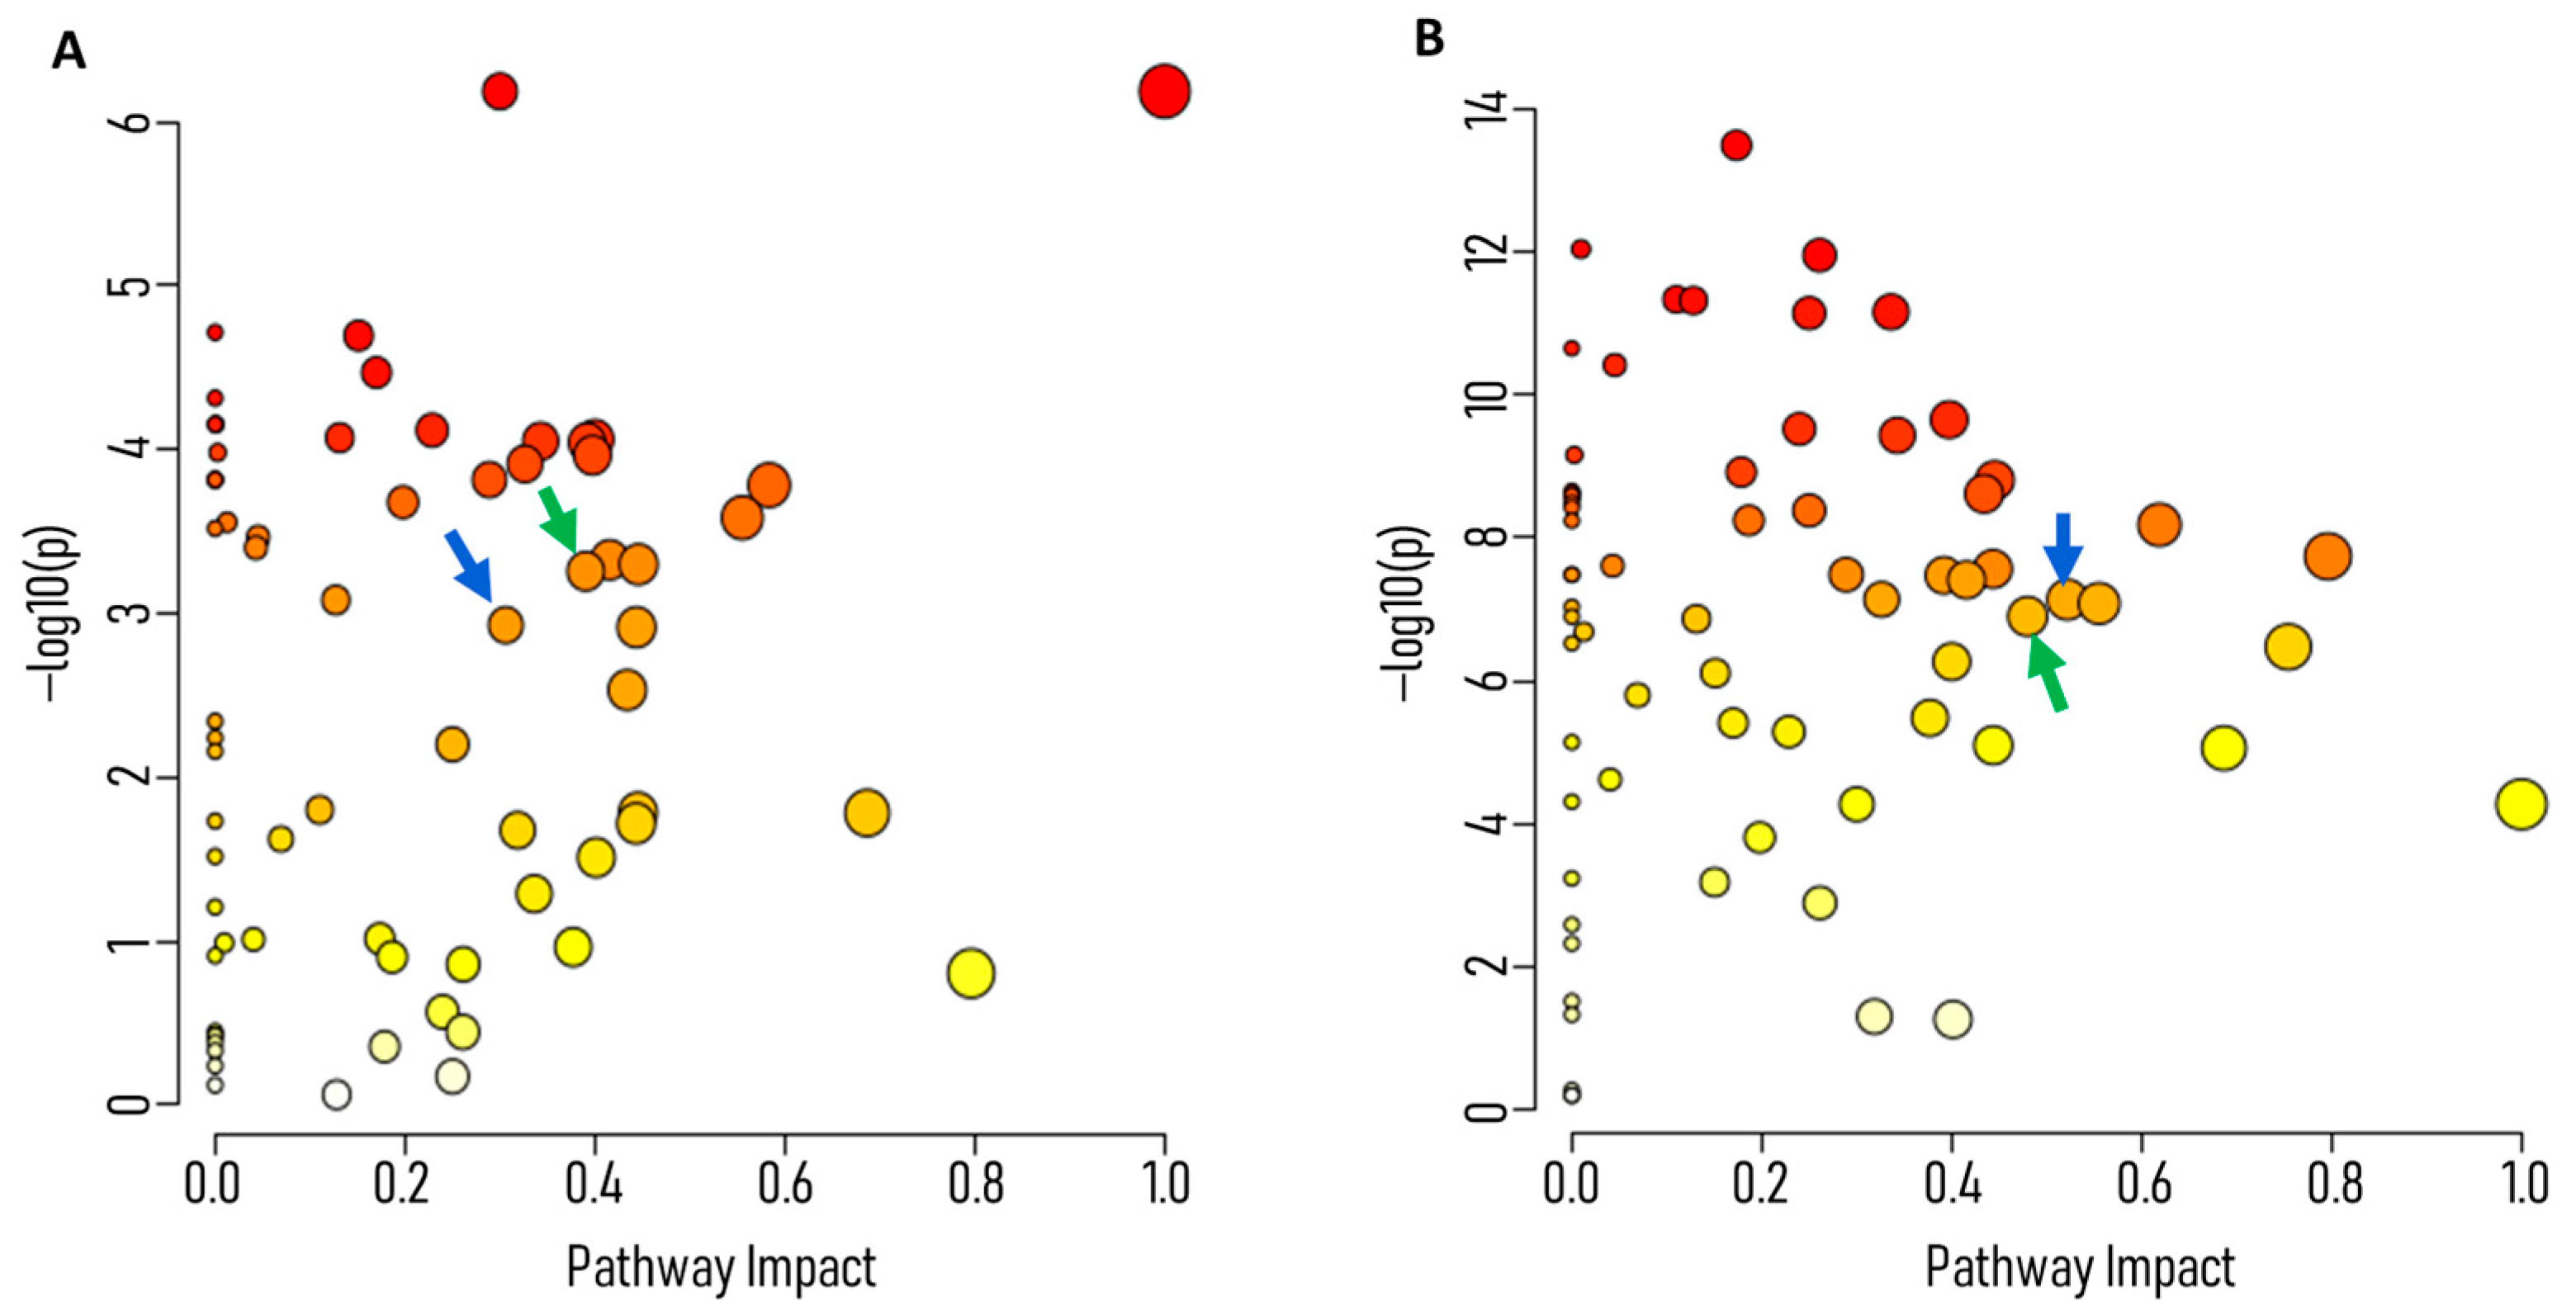
Untargeted metabolomics data were analyzed to assess potential pathway disruptions induced by AEA. Pathway impact scores for glycolysis revealed progressive inhibition over time. At 1 h, glycolysis exhibited moderate disruption, with an impact score of 0.39029 and an FDR-adjusted p-value of 0.001271 (Figure 3A). By 6 h, the impact score increased to 0.4799, accompanied by a highly significant FDR-adjusted p-value of 2.24 × 10⁻⁷ (Figure 3B). This escalation could indicate cumulative metabolic stress caused by sustained AEA treatment.
Pathway visualization further demonstrated significant perturbations in associated pathways, including the pentose phosphate pathway (PPP) and pyruvate metabolism, highlighting the broader impact of AEA on central carbon metabolism. The pathway impact values are listed in Table S4 for 1 h samples and Table S5 for 6 h samples. These findings provide strong justification for further targeted and tracing analyses to delineate the specific mechanisms underlying these disruptions.

2.4. Tracing of Intracellular Metabolites

To further investigate the impact of AEA on glycolytic metabolism, we performed a stable isotope tracing experiment using uniformly labeled D-Glucose (U-13C6). This approach enabled us to monitor the incorporation of labeled carbon atoms into glycolytic intermediates and assess pathway activity under control and treated conditions.
At the 1 h time point, significant 13C enrichment was detected in early glycolytic intermediates, including glucose-6-phosphate (G6P +6), fructose-6-phosphate (F6P +6), and fructose-1,6-bisphosphate (F1,6BP +6). These metabolites were markedly lower in AEA-treated cells compared to controls (Figure 4A–C), indicating reduced glucose uptake or impaired enzymatic conversion at the upper glycolysis level. This early inhibition was also reflected in mid- and late-stage intermediates: 2-phosphoglycerate (2-PG +3) and phosphoenolpyruvate (PEP +3) showed reduced labeling in the AEA group (Figure 4D,E), suggesting consistent pathway suppression downstream.
By the 6 h time point, accumulation of labeled intermediates in the control group continued to rise, while AEA-treated samples remained low across nearly all measured metabolites. Notably, the gap between treated and control groups widened at 6 h, especially for intermediates such as PEP and 2-PG, pointing to sustained inhibition of glycolytic flow. For pyruvate (+3), although the difference between control and treated was less pronounced, enrichment levels were still lower under AEA exposure (Figure 4F). Together, these results reveal a persistent and time-dependent reduction in 13C enrichment across glycolytic intermediates in AEA-treated S. mutans, reflecting a suppressed metabolic response relative to the control. Complete lists of labeled intracellular and extracellular metabolites are provided in Tables S6 and S7, respectively.

2.5. Tracing Analysis of Glucose and Lactate in the Growth Media

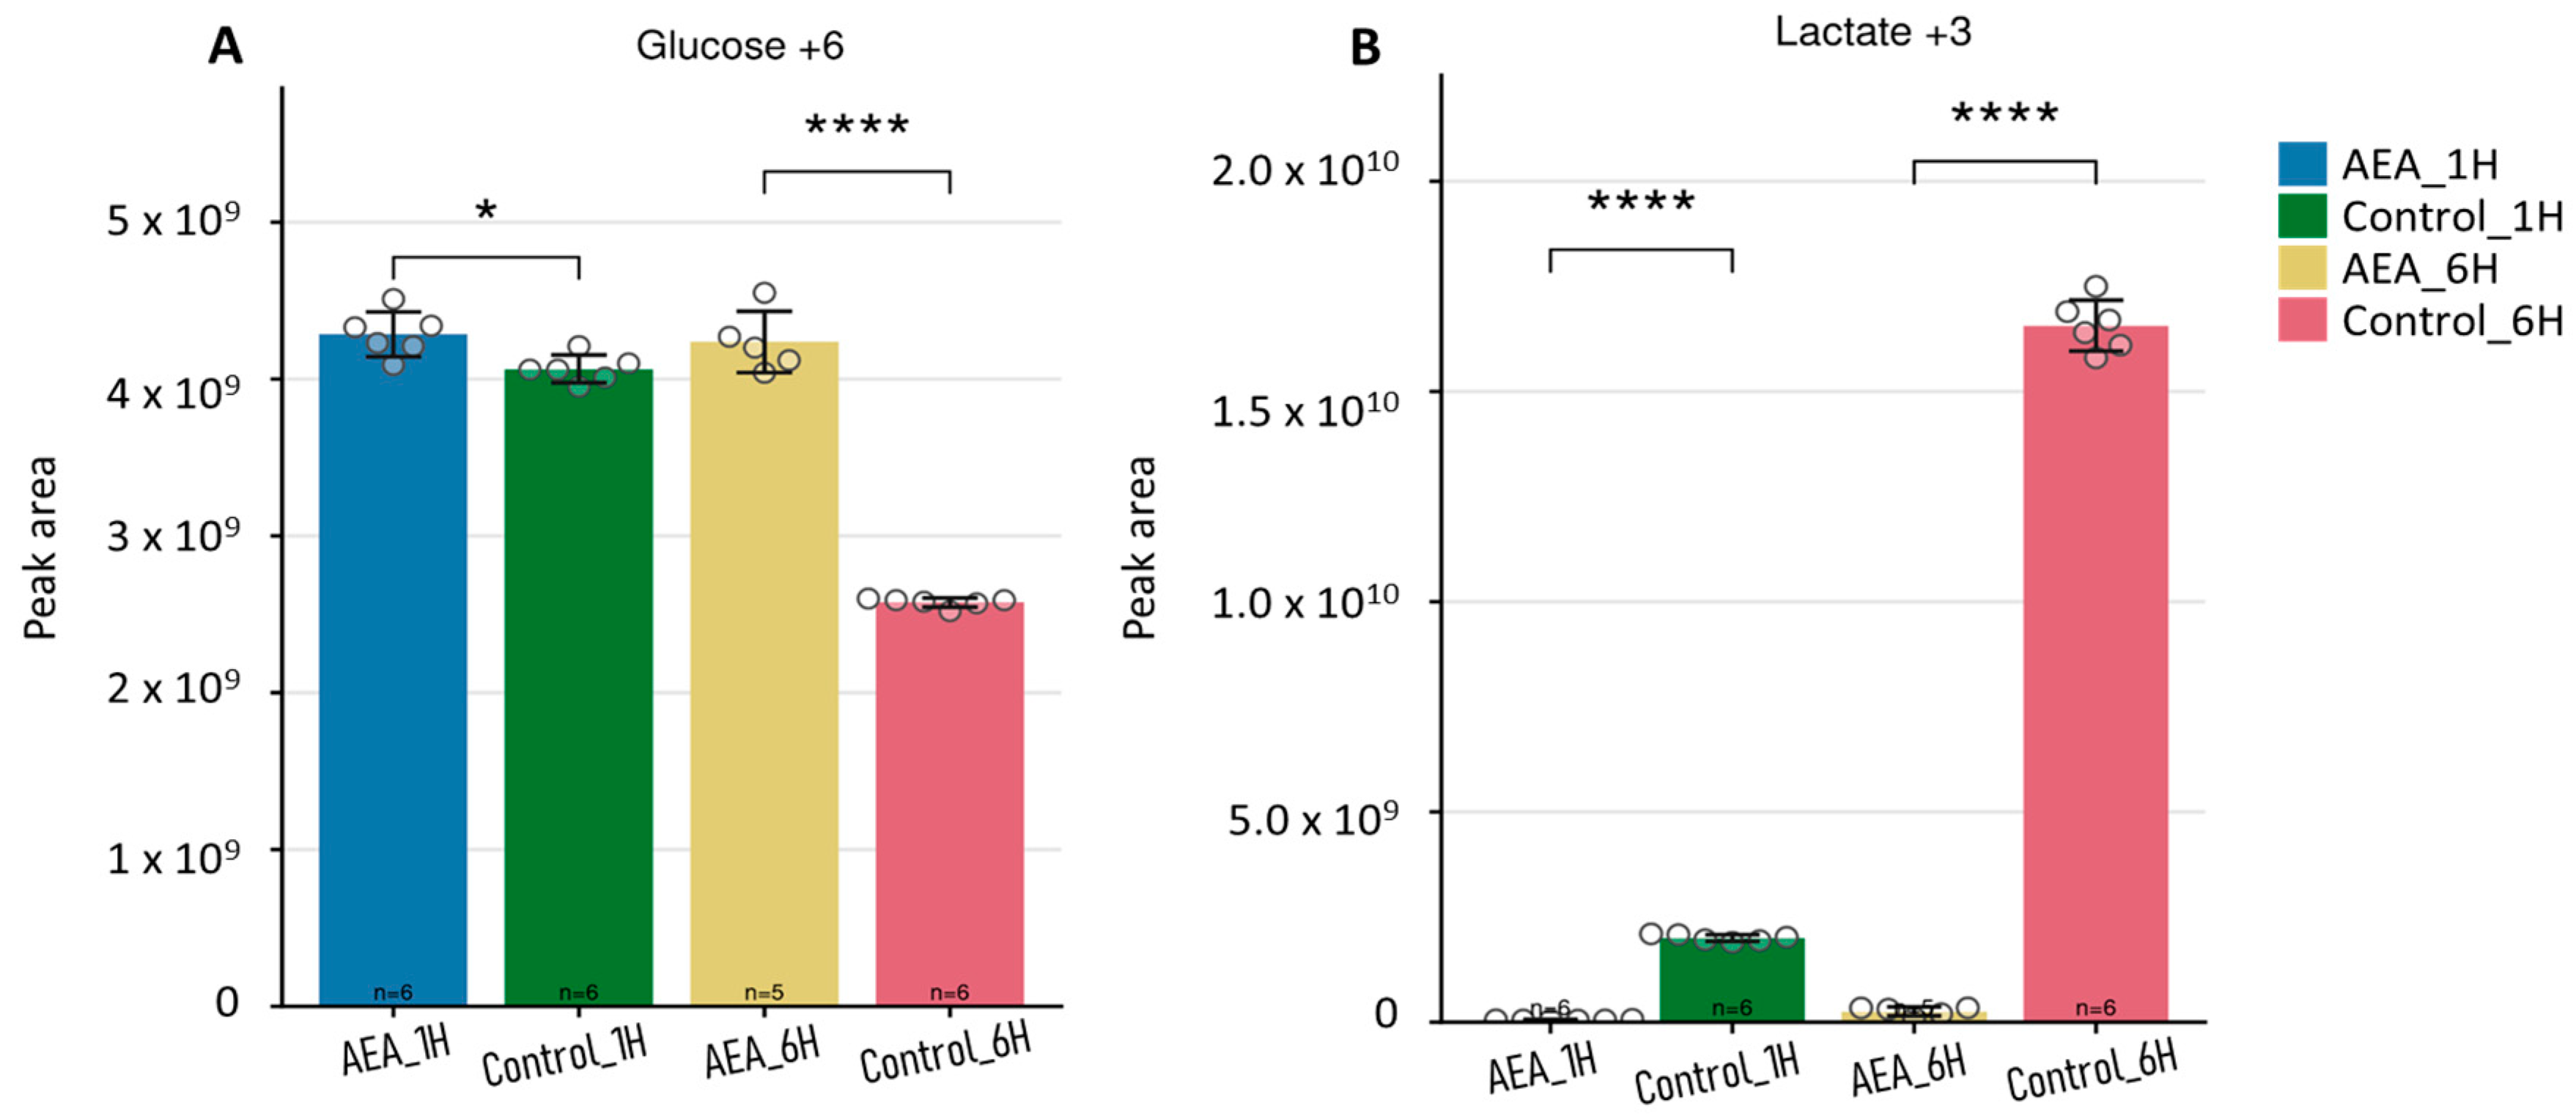
Analysis of extracellular 13C6-glucose levels in the growth media of the bacteria revealed statistically significant differences between control and treated groups over the incubation period (Figure 5). The results observed from 13C6-glucose (Figure 5A) show a clear decrease in the 13C6-glucose by the 6 h time point compared to 1 h, implying glucose has successfully been taken up into the cell. However, in the AEA-treated group, the levels of 13C6-glucose after 6 h remain close to the levels at 1 h in a highly significant manner (Figure 5A).
Furthermore, lactate, the end product of glycolysis, is expected to be expelled from the cell into the media. In the control groups, there is a marked increase in 13C3-lactate found in the growth media by the 6 h time point (Figure 5B). This reflects active glycolysis metabolism in untreated cells, with a significant conversion of pyruvate to lactate. In contrast, the AEA-treated groups displayed a markedly reduced 13C3-lactate production concomitant with the lack of glucose uptake, further supporting the notion that there is an inhibition of glycolysis.

2.6. Flux Analysis of Intracellular Glycolytic Intermediates in the Growth Media

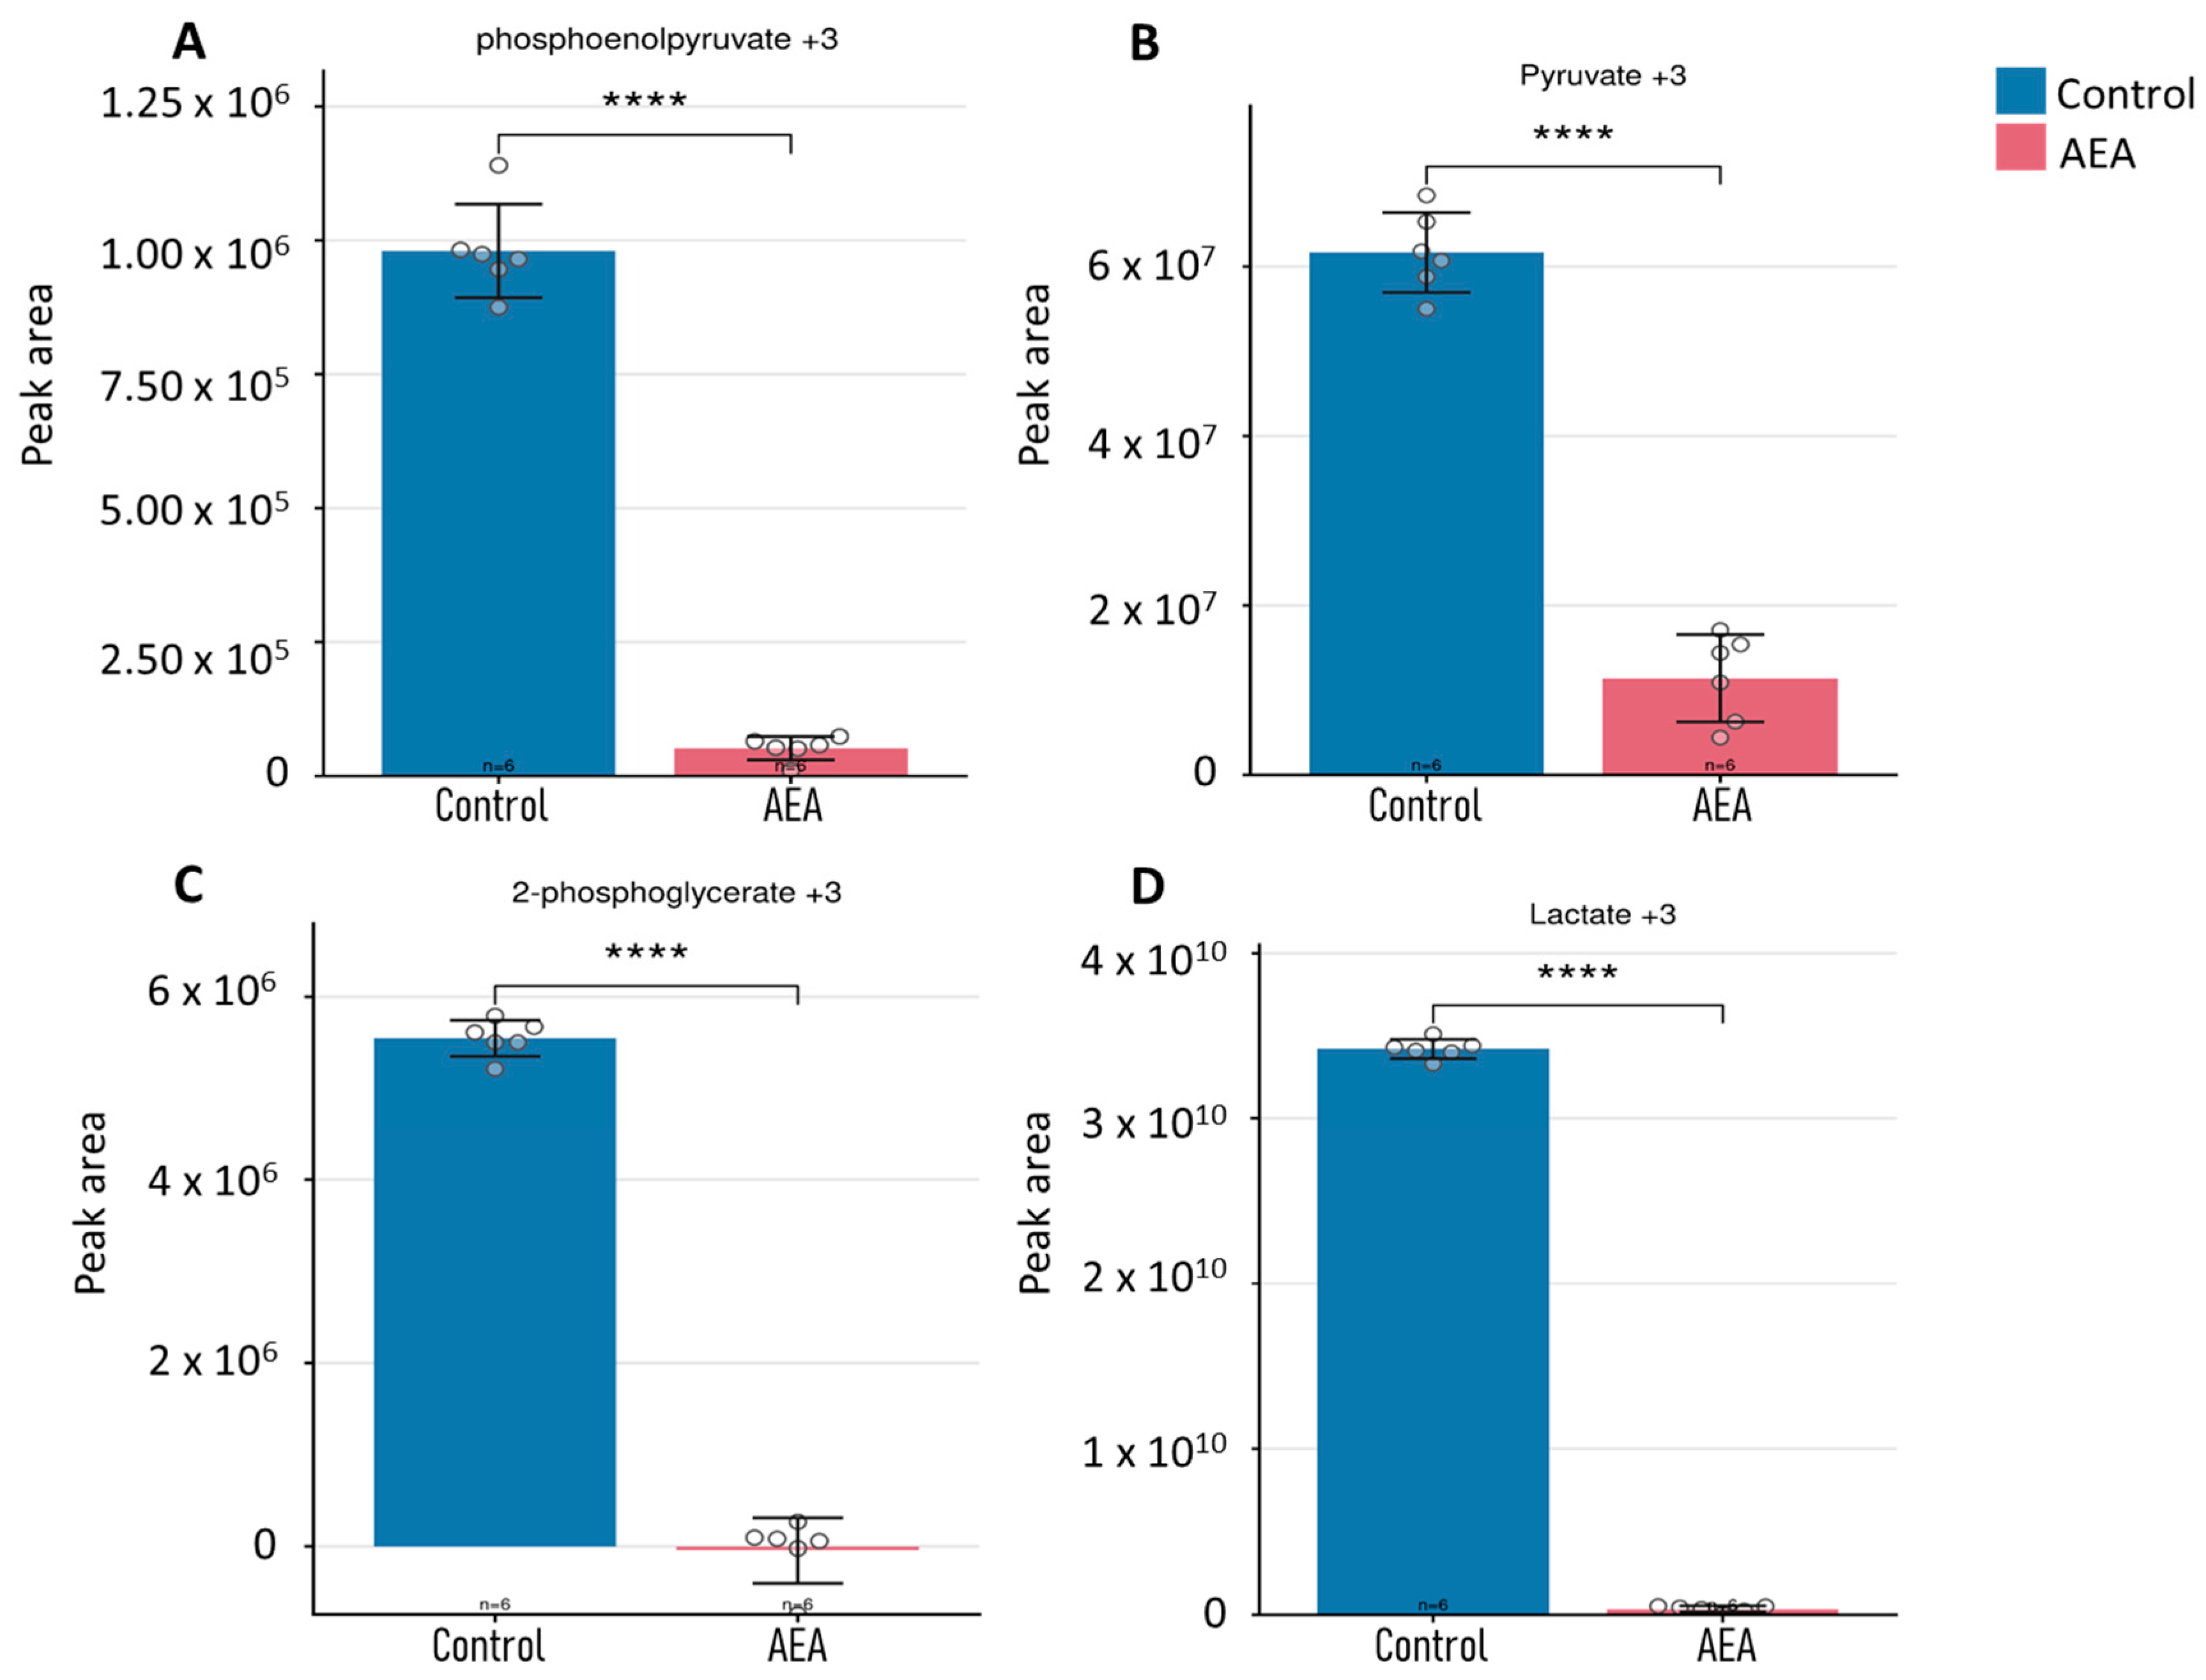
To complement the intracellular labeling data, we analyzed the isotopic enrichment of glycolytic end products secreted into the extracellular medium. These measurements reflect the rate at which metabolites are produced and secreted through the glycolysis pathway over time (1 to 6 h). This provided an additional perspective on pathway activity and metabolite export in response to AEA treatment. For PEP, enrichment increased more substantially in control cells compared to treated cells, suggesting reduced glycolytic progression in the presence of AEA (Figure 6A). Similarly, although pyruvate enrichment showed some variability, it was consistently lower in treated cells, supporting an inhibitory effect of AEA on glycolytic processing (Figure 6B). Enrichment of 2-PG was also reduced in treated cells relative to controls, indicating suppression across glycolytic intermediates (Figure 6C). The most pronounced reduction was observed for lactate, where enrichment levels were significantly lower in AEA-treated cells, reflecting diminished pyruvate-to-lactate conversion under treatment (Figure 6D). These findings collectively indicate that AEA treatment leads to a broad reduction in glycolytic activity, limiting glucose-derived energy production in S. mutans.
These findings from the growth media analysis corroborate the intracellular data, indicating that AEA treatment impairs glucose transport or utilization, contributing to the observed glycolytic inhibition.

2.7. AEA Treatment Reduces Growth Rate, Aciduricity, and Acidogenicity

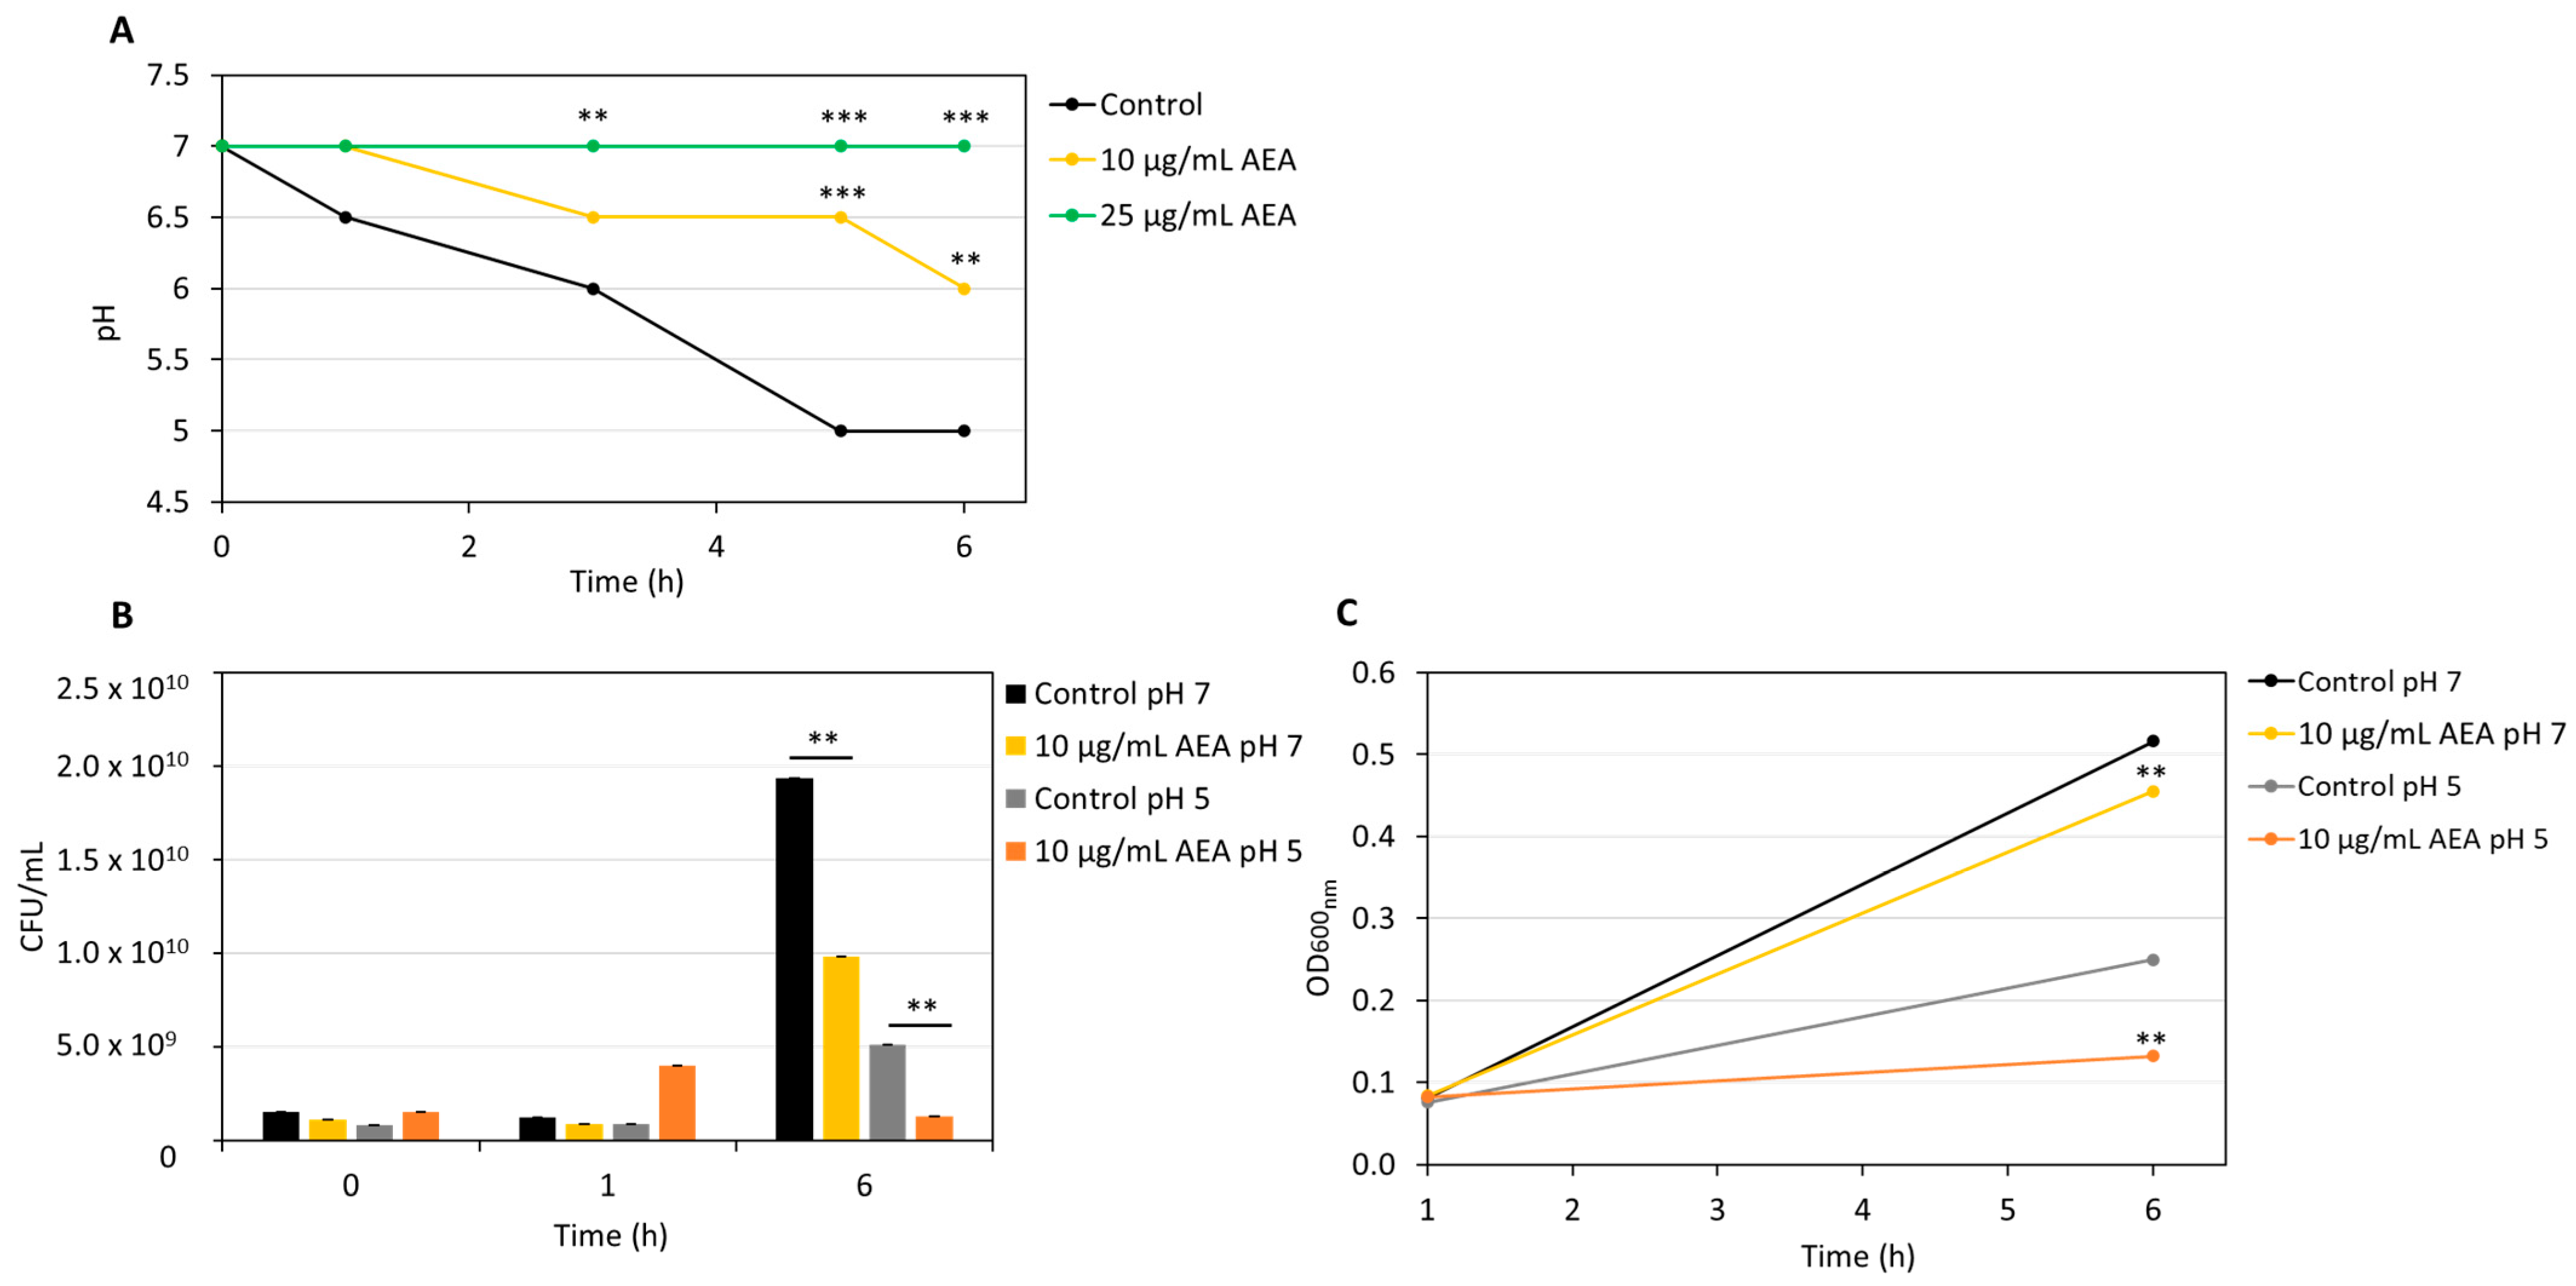
The effect of AEA on S. mutans growth was assessed by measuring the optical density (OD) of planktonic cultures grown in the presence of 12.5 and 25 µg/mL AEA for over a period of 24 h. AEA treatment slowed the growth in a dose-dependent manner, with greater inhibition observed at 25 µg/mL (Figure S1). Given that acidogenicity is a key virulence factor of S. mutans and a direct consequence of glycolysis, we also investigated the effect of 10 µg/mL AEA on the pH of the media. While the pH of control cultures reached 5 after 6 h, reflecting significant acid production, the pH of cultures treated with 10 µg/mL AEA only reached 6.5. In cultures treated with 25 µg/mL AEA, the pH remained at 7 (Figure 7A), indicating a substantial reduction in acid production in the 10 µg/mL AEA-treated samples.
Aciduric is another important virulence factor for S. mutans. Therefore, we investigated the effect of AEA on acid tolerance by comparing the number of colony-forming units (CFUs) of S. mutans grown in the absence (control) and presence of 10 µg/mL AEA at pH 7 and pH 5.2 (Figure 7B). After 1 h of incubation with AEA, CFU counts were similar between treated and control groups at both pH levels.
However, after 6 h, AEA-treated samples at pH 7 showed a 2-fold reduction in CFUs compared to their respective controls, as well as a 4-fold reduction at pH 5.2 compared to their respective controls (Figure 7B). The OD of these samples was measured simultaneously, revealing a concomitant reduction in OD in the presence of AEA at both pH 7 and pH 5 compared to their respective controls (Figure 7C).

2.8. The Effect of AEA on Carbohydrate Uptake and Glycolysis

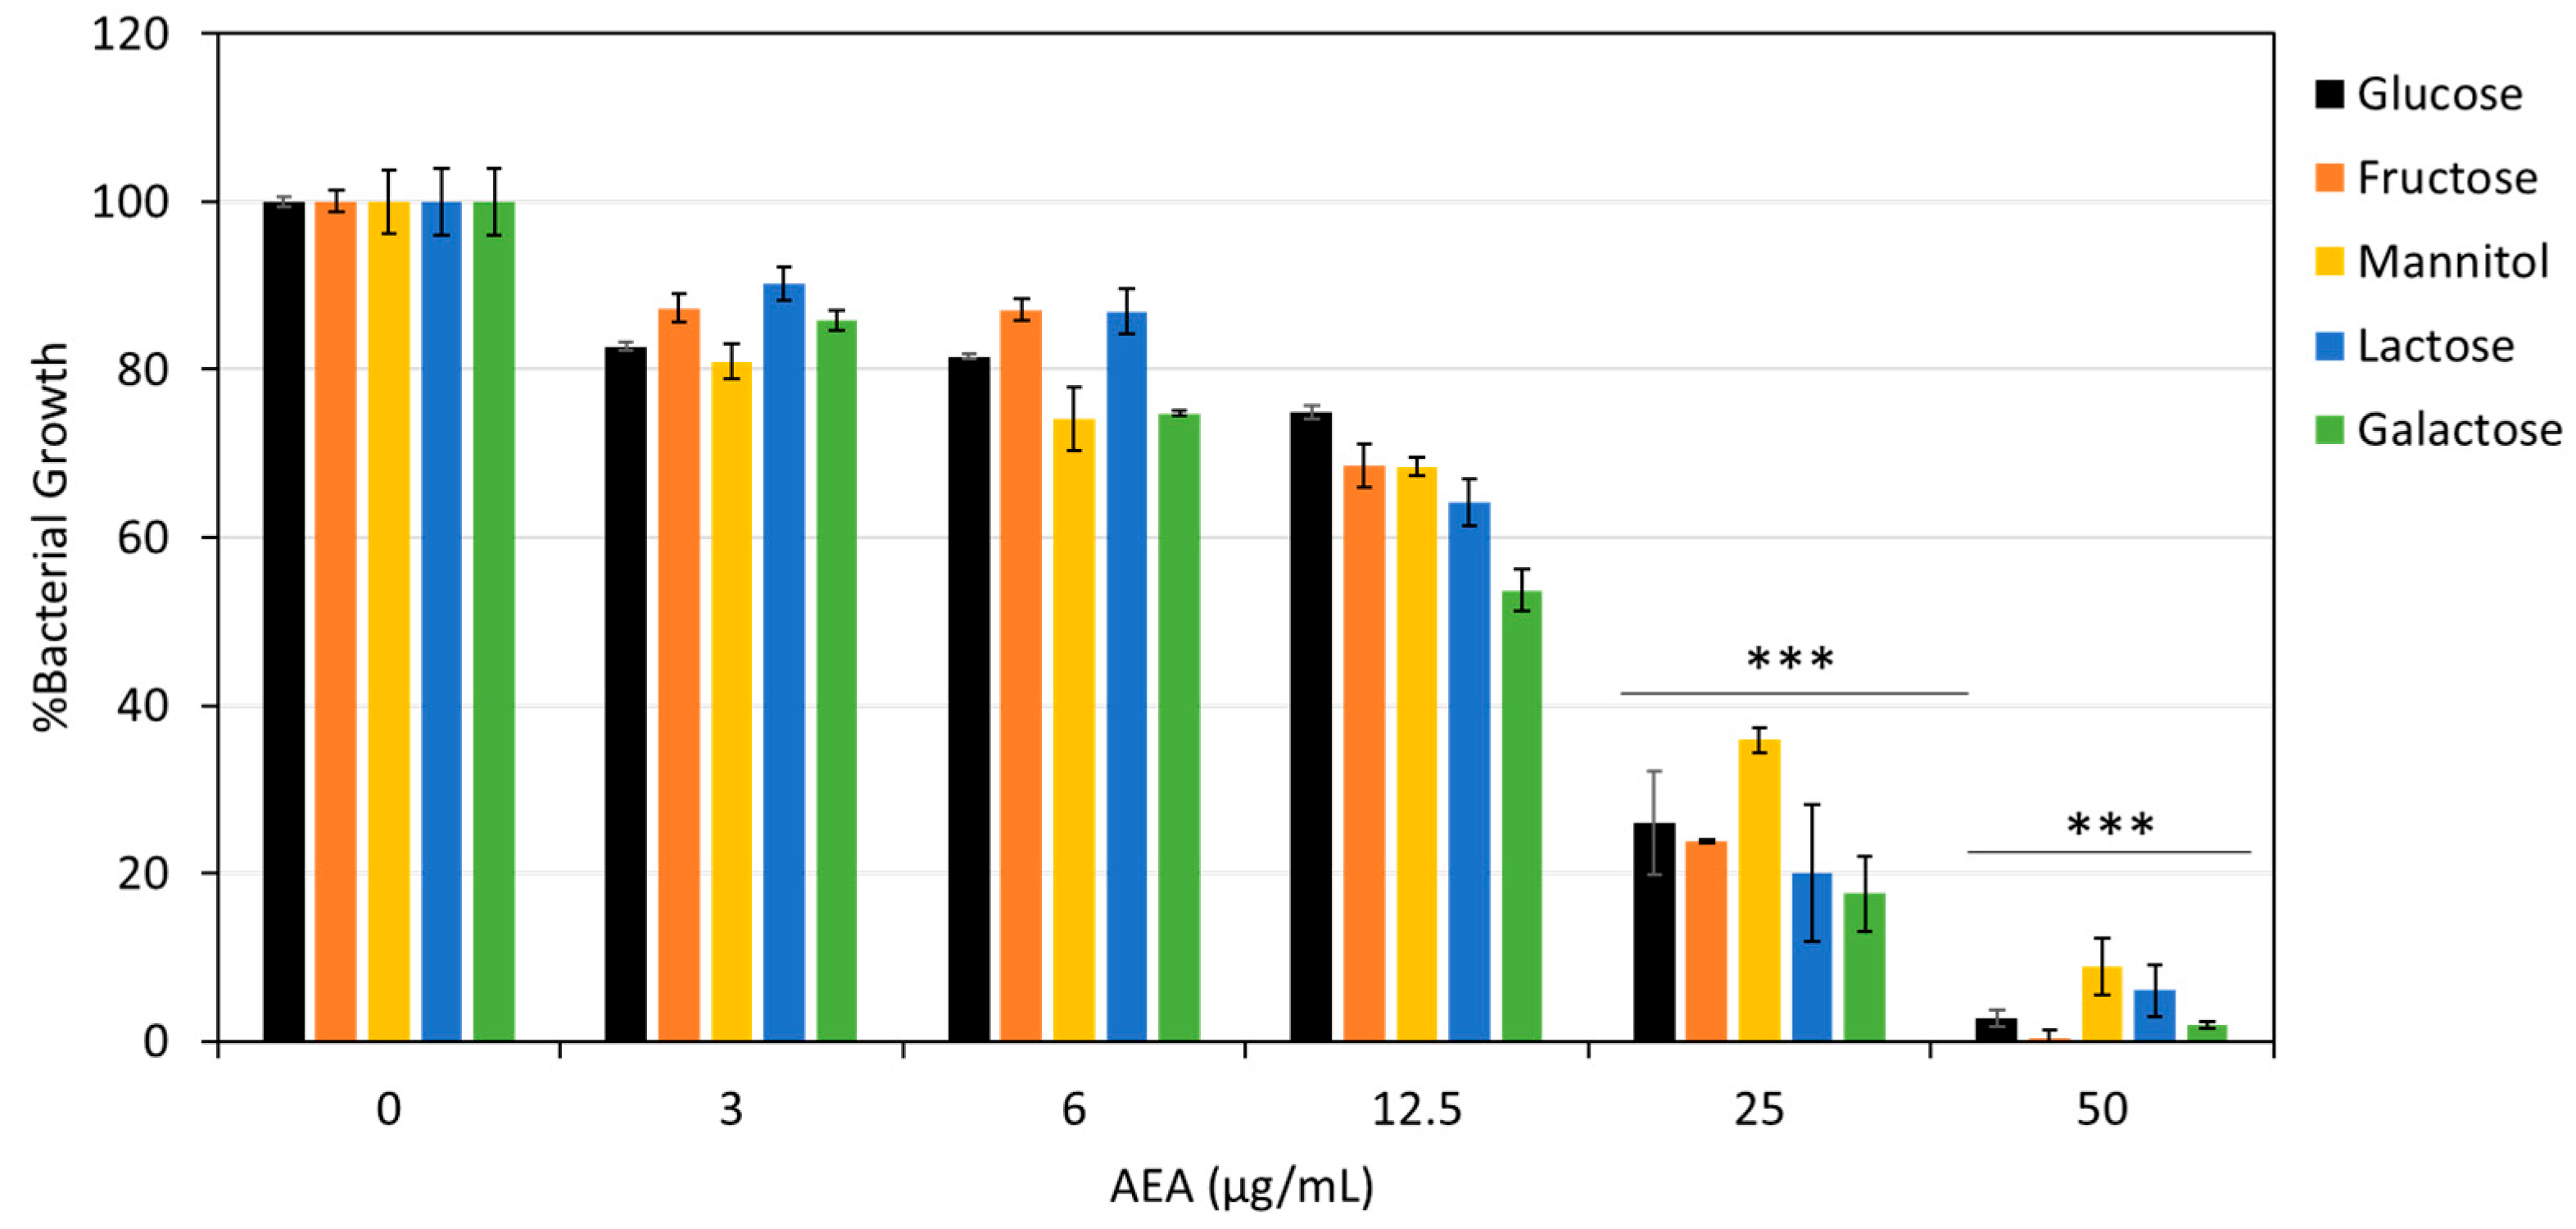
To determine whether AEA’s effect on S. mutans was specific to glucose uptake or involved a broader mechanism, we performed a carbohydrate rescue experiment. S. mutans was grown in tryptic soy broth (TSB) supplemented with 1% final concentration of various carbohydrates. Several different carbohydrates were used in this experiment. After 24 h of incubation with varying concentrations of AEA (0–50 µg/mL), we observed that the MIC of AEA remained between 25 and 50 µg/mL regardless of the presence of different carbohydrates such as fructose, mannitol, lactose, and galactose (Figure 8). These results indicate that AEA’s inhibitory effect is not solely due to impaired glucose uptake.

3. Discussion

The oral microflora is remarkably complex, harboring a vast diversity of microorganisms [21]. Bacteria are the most abundant microorganisms, with Streptococci species, particularly S. mutans, dominating the cariogenicity of the oral cavity [21]. S. mutans plays a critical role in dental plaque biofilm formation and is the primary etiologic agent of dental caries [21]. Its virulence is largely attributed to its aciduricity and acidogenicity [14,21]. Despite the availability of antibiotics and antiseptics targeting S. mutans and other cariogenic bacteria, effective treatments that fully eliminate their virulence remain elusive. Consequently, there has been a continuous search for novel therapeutic strategies against cariogenic species, focusing on antimicrobial, anti-biofilm, and, lately, antimetabolic approaches, particularly those that target acid production.
Previous research by our group demonstrated that AEA impacts S. mutans by affecting cell viability, biofilm formation via extracellular polysaccharide (EPS) production, the cell membrane, general metabolomics, and changes in cell morphology [12]. Importantly, the concentrations of AEA needed for the anti-bacterial effects were below the cytotoxic concentration for normal Vero epithelial cells [12]. Based on these previous findings, in the present study, we explored AEA’s mode of action via its effect on cell metabolism, specifically in the presence of glucose. Glucose is an essential nutrient in bacterial fermentation. It is a crucial energy source that results in the production of organic acids, which cause tooth demineralization and cavitation [14].
In our previous study, we performed experiments in brain heart infusion (BHI) media8, whereas in this study, we chose to use TSB media so we could control the levels of glucose the bacteria were exposed to. We observed the only notable difference to be in the MIC, which was 12.5 µg/mL in BHI to 25 µg/mL in TSB. This variation is expected, as previous studies have demonstrated that MIC values can be significantly influenced by growth medium composition, including factors such as nutrient content, buffering capacity, and even assay plate material, in both S. mutans and other bacterial species [22,23,24,25].
In the present study, we used S. mutans as a cariogenic bacterial model and demonstrated that AEA disrupts glycolysis in this bacterium. We observed that AEA reduces glycolytic activity flux and consequently diminishes acid production, thereby attenuating its cariogenic virulence.
A number of studies have investigated the effects of various compounds on S. mutans, revealing notable alterations in bacterial metabolism and glycolysis. For instance, fluoride treatment is known to inhibit bacterial growth by partially targeting the glycolytic enzyme enolase, thereby reducing glucose metabolism [20]. Xylitol, a sugar alcohol, has also been shown to inhibit S. mutans growth. Once taken up and phosphorylated to xylitol-5-phosphate (X5P), this compound cannot be further metabolized, leading to its intracellular accumulation. The buildup of X5P disrupts glycolytic intermediates and ultimately suppresses sugar metabolism [20]. To further study and elucidate the mechanism by which AEA affects S. mutans, our group designed and conducted a novel metabolomics experiment.
After performing untargeted metabolomic analysis, notably, many of the significantly downregulated metabolites were glycolytic intermediates (Figure 1 and Figure 2A). Furthermore, pathway analysis (Figure 3) indicated that the glycolysis pathway had been altered in a significant way compared to control samples. To further understand and investigate the importance of this, we chose to perform a tracing analysis experiment with labeled glucose to better observe the effects of AEA on the central carbon metabolism.
Tracing experiments revealed a significant reduction in the incorporation of 13C6-glucose into both early and late glycolytic intermediates, demonstrating the inhibitory effects of AEA across the glycolytic pathway.
The isotopic tracing enrichment flux analysis further supports these findings, showing a marked decrease in the incorporation of labeled glucose in intracellular intermediates and the reduction in labeled extracellular pyruvate and lactate end products. The reduction in lactate is particularly important, since it plays a central role in the cariogenic potential of S. mutans, contributing to acid production and biofilm formation. In the combined treatment of fluoride and xylitol, a reduction in lactate production in S. mutans, accompanied by a reduction in biofilm formation and overall virulence of the bacteria, was also observed [20]. When S. mutans is treated with nicotinamide, again, the same results are observed, in addition to a reduction in acid production, a concomitant reduction in biofilm formation, and EPS production [19]. By limiting lactate production, AEA not only restricts glycolysis but also impedes the cariogenic virulence properties of S. mutans.
The impact of this disruption is further reflected in the decline in ATP levels. ATP is crucial for energy metabolism in S. mutans, as it is utilized for numerous biological pathways and processes, including fermenting carbohydrates into lactic acid, cell wall synthesis, membrane transport systems, protein synthesis, DNA synthesis, pH homeostasis, biofilm formation, and DNA repair [14,26,27]. The declining levels of ATP caused by AEA in S. mutans can be observed by the reduced production and export of acid (lactate) out of the cell (Figure 5B and Figure 7A), the damages to the membrane transport and biofilm formation that was noted previously [12], and the dysregulation in pH homeostasis that can be noted by the reduced tolerance to acidic conditions (Figure 7B,C).
S. mutans treated with bedaquiline showed inhibited H+-ATPase activity, which was accompanied by reduced bacterial growth, biofilm formation, EPS secretion, and lactic acid production [28]. Similarly, treatment with piceatannol, curcumin, and demethoxycurcumin also resulted in reduced F-type ATPase activity, which is essential for S. mutans survival under acidic conditions [29]. These findings are consistent with observations from the current study on AEA-treated S. mutans. Notably, the effects of bedaquiline, piceatannol, curcumin, and demethoxycurcumin were most pronounced under acidic conditions (pH 5) and showed minimal impact at neutral pH (pH 7) [28,29]. While it is known that F-ATPase expression is upregulated under acidic conditions, the lack of any significant effect at neutral pH underscores the need to further elucidate the precise mechanisms of action of these compounds [29]. Therefore, given that S. mutans primarily relies on glycolysis for ATP generation, targeting ATP and the consequent reduction in energy availability, compromises its aciduricity, ability to sustain growth, pH homeostasis, and maintenance of biological pathways, and thus, it becomes less virulent in the presence of AEA even in a more neutral pH.
S. mutans has complex stress response pathways that allow it to survive the rapidly changing environment of the oral cavity, surpass competing microbial pathogens, and thrive in the dental plaque biofilm [13], which can mainly be attributed to its robust response to both acid and oxidative stress [30]. These responses are mostly attributed to NADH oxidase, which is thought to be critical for the regeneration of NAD+ for use in glycolysis and for the reduction of oxygen, which in turn prevents the formation of damaging reactive oxygen species [30]. The balance between oxidized NAD+ and reduced NADH is central to cell homeostasis. Thus, the observed shift in the NAD+/NADH ratio after AEA treatment suggests an imbalance in redox homeostasis, which can support our observations that AEA disrupts carbon metabolism and bacterial survival and reduces its stress response and resistance.
The reduction in the NAD+/NADH ratio, alongside suppressed ATP production, highlights a dual impairment in energy metabolism and redox homeostasis. Together, these findings indicate that treatment disrupts glucose utilization and energy production while exacerbating redox imbalance, further compounding metabolic stress. These effects collectively compromise cell viability and metabolic flexibility, exacerbating the cellular response to treatment.
A signature characteristic of S. mutans is its ability to metabolize a large variety of carbohydrates [15]. The PTS is a major carbohydrate transport system in streptococci, especially under carbohydrate-limiting conditions [31]. There are two general proteins that make up the PTS: the enzyme I (EI) and the heat-stable phosphocarrier protein (HPr). Additionally, the presence of enzyme II complexes (EII) allows for the phosphorylation and internalization of many different sugars into the bacteria [31]. The S. mutans UA159 strain specifically encodes 14 phosphoenolpyruvate-dependent sugar: PTSs with specificities for various mono- and disaccharides and additional ABC transporters for oligosaccharides [15].
This evolution of multiple transporters and regulatory capacities ensures the bacteria will be able to catabolize a wide range of carbohydrates and tolerate major fluctuations in nutrient availability and pH, which is crucial for their survival and cariogenicity [15,31]. We observed that AEA impacted more than just glucose uptake since the MIC of AEA remained between 25 and 50 µg/mL regardless of the presence of fructose, mannitol, lactose, and galactose (Figure 8). These results indicate that AEA’s inhibitory effect hinders the uptake and utilization of numerous carbohydrate sources, most likely affecting the EII enzyme complex in the bacteria, since this is the primary mode of uptake of various carbohydrates into the cells. It would be worthwhile to further investigate the binding site of AEA with sugar-specific permeases such as the EII complexes.
Notably, when comparing AEA to chlorhexidine (0.0075–2.0 mM), a widely accepted treatment used against cariogenic oral bacteria, there is a similar inhibition of bacterial growth and lactic acid production and a reduction in glycolytic intermediates and the rate of glycolysis after chlorhexidine treatment [32]. Further investigation into how chlorhexidine affects glycolysis revealed that it primarily targets the cell membrane of S. mutans, causing glycolytic intermediates to leak out of the cell rather than directly inhibiting the glycolytic pathway itself, as was originally thought [32]. In contrast, this mechanism was ruled out for AEA treatment, as only minimal amounts of labeled intermediates were detected in the growth medium (Figure 6).
Additionally, in the case of trans-cinnamaldehyde and triclosan, which both inhibit the growth rate and biofilm formation of S. mutans, they were both found to interfere with the glycolysis pathway of S. mutans [17,33] through various mechanisms. Investigations on the former suggest it suppresses glucose and sucrose consumption and interacts with pyruvate dehydrogenase (PDH), downstream of glycolysis, causing an anti-bacterial effect on S. mutans [17]. The latter has been observed to affect the bacteria through inhibition of glycolytic enzymes such as pyruvate kinase, lactate dehydrogenase, and aldolase [33].
The observations of this study demonstrate that AEA treatment significantly disrupts glycolysis in S. mutans, leading to reduced glucose uptake, lower intracellular glycolytic metabolite levels, and a decline in extracellular acid production. The alignment between increased extracellular glucose and the depletion of key glycolytic intermediates suggests that AEA impairs glucose transport or early glycolytic processing, thereby limiting the entry of carbon into the pathway. One notable novelty is that, unlike the other agents discussed here, which act directly on glycolytic enzymes, the cell membrane, or the ATPase activity, AEAs’ effect is primarily seen at the level of carbohydrate uptake. This inhibition propagates downstream, reducing the availability of pyruvate and lactate, the major fermentation end products that drive S. mutans acidogenicity. The substantial decrease in lactate production impedes S. mutans’ cariogenic potential by diminishing its glycolytic capacity flux, thus reducing its acid production, and thereby weakening the ability of S. mutans to generate the acidic microenvironment necessary for enamel demineralization and biofilm stability.

4. Materials and Methods

4.1. Materials

AEA (>98.0% purity) was purchased from Cayman Chemical (Ann Arbor, MI, USA) and dissolved in absolute ethanol at a concentration of 10 mg/mL. Respective dilutions of ethanol (0.0156–0.5%) as well as untreated bacteria were used as controls in this study.

4.2. Bacterial Growth Media

TSB media was prepared in the following manner: Tryptone (8.5 g/L) (Acumedia, Lansing, MI, USA), Peptone (1.5 g/L) (HiMedia Laboratories, Mumbai, India), NaCl (2.5 g/L), and K2HPO4·3H2O (2.3 g/L) were added, mixed, and autoclaved together. Glucose was prepared separately, filter-sterilized, and added to a final concentration of 1% to the TSB media prior to use (TSBG).
In the carbohydrate rescue experiment, the TSB was used with the addition of fructose, mannitol, galactose, or lactose. All carbohydrates were prepared in the same manner as the glucose and added to a final concentration of 1% to the TSB.
For the tracing analysis experiment, D-Glucose (U-13C6, 99%) (CLM-1396-1) was purchased from Cambridge Isotope Laboratories, Inc. (Andover, MA, USA), and was diluted directly into TSB and sterile-filtered before use at a final concentration of 1%.

4.3. Bacterial Growth

S. mutans UA159 was grown overnight at 37 °C in 95% air/5% CO2 in TSBG until an OD of approximately 1.2–1.3 was reached [12]. For planktonic growth, the overnight culture was diluted to an OD600nm of 0.1 in TSBG, and 200 µL of the bacterial culture was seeded in each well of a tissue-grade flat-bottom 96-well microplate (Corning, Glendale, AZ, USA) in the absence or presence of increasing concentrations of AEA (1.25–50 µg/mL) or respective ethanol concentrations (0.0156–0.5%) and incubated at 37 °C in 95% air/5% CO2 for 24 h.

4.4. LC-MS-Based Metabolomics

4.4.1. Sample Preparation

This protocol was adapted from Mielko et al. [34]. Overnight bacterial suspensions of OD600nm of 0.1 in the TSBG medium were centrifuged at 15,000× g for 10 min and washed twice in TSB media in order to remove any unlabeled glucose from the media. After this, an OD600nm of 0.1 of S. mutans was resuspended in the TSBG medium for metabolomic profiling or TSB + D-Glucose (U-13C6, 99%) (CLM-1396-1) (final concentration of 1%) for metabolomic tracing. The bacteria were then either left untreated or treated with a sub-MIC of AEA (10 µg/mL) and incubated at 37 °C, in air/5% CO2, for 1 and 6 h.
After incubation, from each sample, an OD600nm of 0.1 was taken in order to standardize the experiment, which was centrifuged at 15,000× g for 10 min at 4 °C and washed in order to separate the supernatant from the cell pellets. The cell pellets and supernatant were collected separately in Eppendorf tubes, and the cell pellet was washed twice in cold phosphate-buffered saline (PBS), which was then removed. The cell pellet was carefully aspirated to ensure a clean pellet, and the pellet and media samples were transferred to glass high-performance liquid chromatography (HPLC) vials and stored at −80 °C prior to LC-MS analysis. Untreated samples served as controls.
For intracellular metabolite extraction, the pellets were treated with 100 µL of an ice-cold extraction mixture composed of methanol, acetonitrile, and water in a 5:3:2 ratio. The samples then underwent three freeze–thaw cycles to enhance metabolite extraction. For media extraction, 20 µL of medium was mixed with 180 µL of the same extraction mixture. Following extraction, the samples were centrifuged at 20,000× g for 20 min at 4 °C. The resulting supernatant was carefully collected and transferred to HPLC vials for analysis. Quality control (QC) samples were prepared by pooling equal aliquots from each sample group. Additionally, for MS/MS analysis, each group was pooled to create an “ID sample” to facilitate metabolite identification.

4.4.2. LC-MS Data Acquisition

LC-MS metabolomics analysis was performed as described previously [35]. Briefly, a Dionex Ultimate 3000 high-performance liquid chromatography (UPLC) system (Thermo Fisher Scientific, Germering, Germany) coupled to an Orbitrap Q-Exactive plus Mass spectrometer (Thermo Fisher Scientific, Bermen, Germany), with a resolution of 70,000 at a 200 mass/charge ratio (m/z), electrospray ionization in the HESI source, and polarity switching mode to enable both positive and negative ions across a mass range of 70 to 1000 m/z, was used. The UPLC setup included a ZIC-pHILIC column (SeQuant, Merck, Darmstadt, Germany; 150 mm × 2.1 mm, 5 μm) with a Sure-Guard filter (SS frit 0.5 μm) (Thermo Fisher Scientific, Waltham, MA, USA). Of the sample extracts, 5 μL was injected, and the compounds were separated with a mobile phase gradient of 15 min, starting at 20% aqueous (20 mM ammonium carbonate adjusted to pH 9.2 with 0.1% of 25% ammonium hydroxide) and 80% organic (acetonitrile) and terminated with 20% acetonitrile. The flow rate and column temperature were maintained at 0.2 mL/min and 45 °C, respectively, for a total run time of 26 min. All metabolites were detected using mass accuracy below 5 ppm. Thermo Xcalibur (Thermo Fisher Scientific, Waltham, MA, USA) was used for data acquisition. Metabolomics data was normalized to optical density.

4.4.3. Metabolomics Data Analysis

Data processing and analysis were performed using Compound Discoverer (version 3.3.2.31) (Thermo Fisher Scientific, Bermen, Germany) with an in-house library. Tracing data analysis was conducted using Trace Finder (version 5.2) (Thermo Fisher Scientific, Bermen, Germany).

4.4.4. Metabolomics Statistical Analysis

All statistical analyses for the metabolomics experiments were performed using appropriate bioinformatics tools and statistical software. Untargeted metabolomics data were processed and analyzed using MetaboAnalyst software (version 6.0) (Xia Lab, McGill University, Montréal, QC, Canada), which was used for data normalization, feature selection, and visualization. Volcano plots were generated in MetaboAnalyst software (Xia Lab), applying a two-sample t-test or Wilcoxon rank-sum test for statistical comparisons, which is consistent with the software’s differential analysis module.
For targeted metabolite comparisons, statistical analysis was performed using Metabolite AutoPlotter (version2.6) (West Coast Metabolomics Center, University of California, Davis, CA, USA), employing a two-tailed Mann–Whitney U nonparametric test to assess differences between experimental groups.
Pathway impact analysis was conducted using MetaboAnalyst software (Xia Lab), with pathway significance assessed using FDR-adjusted p-values and pathway impact scores determined based on metabolite topological analysis within each pathway.

4.4.5. Metabolomics Outlier Identification and Quality Control

The LC-MS/MS analysis results were analyzed using an in-house Python (version 3.10; Python Software Foundation, https://www.python.org/) script to identify outliers and validate data quality and integrity based on Euclidean distance calculations instead of being limited to a visual PCA exploration. Metabolites with more than 80% missing values were excluded from the study. Data processing and formatting were performed with Pandas (version 2.0.3; pandas development team, https://pandas.pydata.org/). A log transformation was applied using NumPy (version 1.25.2; NumPy Developers, https://numpy.org/) to address skewness. The data were standardized utilizing Scikit-learn’s StandardScaler (version 1.3.0; scikit-learn developers, https://scikit-learn.org/), after which pairwise Euclidean distance calculations were performed. A heatmap and hierarchical clustering were developed using Seaborn (version 0.12.2; Seaborn Developers, https://seaborn.pydata.org/) and Plotly (version 5.15.0; Plotly Technologies Inc., Montréal, QC, Canada, https://plotly.com/) to visualize the distance matrix based on the calculated distances to detect outliers.

4.5. Kinetic Analysis of Planktonic Bacteria and pH Measurements

Bacterial suspensions of OD600nm of 0.1 in TSBG were treated with different concentrations of AEA (12.5–25 μg/mL) and incubated at 37 °C, in air/5% CO2, for 24 h. At various time points, the pH of the samples was measured using pH indicator paper strips (MColorpHast, Merck KGaA, Darmstadt, Germany), and the OD600nm was measured in parallel in a Tecan Infinite M200 PRO plate reader (Tecan Trading AG, Männedorf, Switzerland) [12]. Untreated samples served as a control.

4.6. Acid Tolerance Assay

Overnight bacterial suspensions of OD600nm of 0.1 in TSBG were centrifuged and resuspended in either TSBG pH 7, or in TSBG with the pH adjusted to 5.2 [36,37] by the addition of 0.2 M disodium hydrogen orthophosphate and 0.1 M citric acid (each at a final concentration of approximately 20 mM). Samples were treated (or untreated for control) with AEA (10 µg/mL) and incubated at 37 °C, air/5% CO2, for 0, 1, and 6 h. Growth characteristics were determined by culturing S. mutans in 200 µL aliquots of the medium in a 96-well sterile microtiter tray. Bacterial growth was measured using the OD600nm in a Tecan Infinite M200 PRO plate reader (Tecan Trading AG).
In parallel, to assess bacterial adaptation to acid tolerance, samples were taken before each time point and serially diluted from 10−1 to 10−6. Then, 10 µL from each suspension was plated on BHI (Acumedia, Lansing, MI, USA) agar plates and incubated at 37 °C, air/5% CO2, overnight. The CFUs were counted, and the results are expressed as the mean percentage (±standard deviation) of colonies present [36,37].
The following equation was used to calculate the CFUs per well in the original sample: number of colonies × dilution factor × original volume of sample × 10 [12].

4.7. Carbohydrate Rescue Assay

Overnight bacterial suspensions in TSBG were centrifuged and resuspended in TSB to an OD600nm of 0.1 with the addition of carbohydrates such as fructose, mannitol, galactose, and lactose (glucose served as a control). Samples were treated with AEA (1.25–50 µg/mL) and incubated at 37 °C, in air/5% CO2, overnight. The absorbance of overnight bacterial growth was recorded at OD600nm in the Tecan Infinite M200 PRO plate reader (Tecan Trading AG) [12].

4.8. Statistical Analysis

All experiments, with the exception of metabolomics experiments, were independently performed three times in triplicate. Data were statistically analyzed using Student’s t-test in Microsoft Excel, with a p-value of less than 0.05 considered significant when comparing treated versus control samples.

Supplementary Materials

The following supporting information can be downloaded at https://www.mdpi.com/article/10.3390/ijms26178401/s1.

Author Contributions

Conceptualization, G.W. and D.S.; methodology, G.W., A.E., A.M., C.J.E.-R. and O.S.; software, G.W. and O.S.; validation, G.W., D.S. and O.S.; formal analysis, G.W., D.S. and O.S.; investigation, G.W., D.S. and O.S.; resources, G.W. and O.S.; data curation, G.W. and O.S.; writing—original draft preparation, G.W. and O.S.; writing—review and editing, G.W., D.S., I.P., M.K. and O.S.; visualization, G.W., D.S. and O.S.; supervision, D.S., I.P., M.K. and O.S.; funding acquisition, D.S., I.P. and M.K. All authors have read and agreed to the published version of the manuscript.

Funding

This study was carried out with the support of the Center for Absorption in the Science Ministry of Immigration and Absorption, Israel, for G.W.

Institutional Review Board Statement

Not applicable.

Informed Consent Statement

Not applicable.

Data Availability Statement

The original mass spectrometry metabolomics data in this study are openly available at the MassIVE repository at ftp://massive-ftp.ucsd.edu/v09/MSV000097584/ (accessed on 27 August 2025) with the data set identifierMSV000097584.

Acknowledgments

We would like to thank Ronit Vogt Sionov for her invaluable time and help with the scientific and experimental sections in this paper. We would also like to thank Michael Berger for his generous help and insights. Additionally, we would like to thank the Canadian Friends of The Hebrew University for their support with the David Kline Award for G.W. The study is part of G.W.’s fulfillment of her Ph.D. studies.

Conflicts of Interest

The authors declare no conflicts of interest.

Abbreviations

The following abbreviations are used in this manuscript:
S. mutansStreptococcus mutans
AEAAnandamide
MICMinimum inhibitory concentration
ATPAdenosine triphosphate
LC-MSLiquid chromatography–mass spectrometry
2-AG2-arachidonoylglycerol
CB1/CB2Cannabinoid receptor 1/2
NAPEN-acyl-phosphatidylethanolamie
PIP2Phosphatidylinositol-4,5-bisphosphate
GPCRsG-protein-coupled receptors
MRSAMethicillin-resistant Staphylococcus aureus
TSBTryptic soy broth
TSBGTryptic soy broth with 1% glucose
ODOptical density
DDWDouble-distilled water
PBSPhosphate-buffered saline
HPLCHigh-performance liquid chromatography
QCQuality control
UPLCUltimate 300 high-performance liquid chromatography
m/zMass/charge ratio
PCAPrincipal component analysis
BHIBrain heart infusion
CFUsColony-forming units
G6PGlucose-6-phosphate
F6PFructose-6-phosphate
F1,6BPFructose-1,6-bisphosphate
2-PG 2-phosphoglycerate
PEPPhosphoenolpyruvate
GA3PGlyceraldehyde-3-phosphate
PPPPentose phosphate pathway
EPSExtracellular polysaccharides
X5PXylitol-5-phosphate
PTSPhosphotransferase system
EIEnzyme I
EIIEnzyme II
HPrHeat-stable phosphocarrier protein
ABCsATP-binding cassettes
PDHPyruvate dehydrogenase

References

  1. Sionov, R.V.; Steinberg, D. Anti-Microbial Activity of Phytocannabinoids and Endocannabinoids in the Light of Their Physiological and Pathophysiological Roles. Biomedicines 2022, 10, 631. [Google Scholar] [CrossRef]
  2. Devane, W.A.; Hanuš, L.; Breuer, A.; Pertwee, R.G.; Stevenson, L.A.; Griffin, G.; Gibson, D.; Mandelbaum, A.; Etinger, A.; Mechoulam, R. Isolation and Structure of a Brain Constituent That Binds to the Cannabinoid Receptor. Science 1992, 258, 1946–1949. [Google Scholar] [CrossRef]
  3. Wei, D.; Allsop, S.; Tye, K.; Piomelli, D. Endocannabinoid Signaling in the Control of Social Behavior. Trends Neurosci. 2017, 40, 385–396. [Google Scholar] [CrossRef]
  4. Vickstrom, C.R.; Liu, X.; Liu, S.; Hu, M.M.; Mu, L.; Hu, Y.; Yu, H.; Love, S.L.; Hillard, C.J.; Liu, Q.S. Role of Endocannabinoid Signaling in a Septohabenular Pathway in the Regulation of Anxiety- and Depressive-like Behavior. Mol. Psychiatry 2021, 26, 3178–3191. [Google Scholar] [CrossRef]
  5. Yin, A.Q.; Wang, F.; Zhang, X. Integrating Endocannabinoid Signaling in the Regulation of Anxiety and Depression. Acta Pharmacol. Sin. 2019, 40, 336–341. [Google Scholar] [CrossRef]
  6. Banerjee, S.; Sionov, R.V.; Feldman, M.; Smoum, R.; Mechoulam, R.; Steinberg, D. Anandamide Alters the Membrane Properties, Halts the Cell Division and Prevents Drug Efflux in Multidrug Resistant Staphylococcus aureus. Sci. Rep. 2021, 11, 8690. [Google Scholar] [CrossRef] [PubMed]
  7. Feldman, M.; Smoum, R.; Mechoulam, R.; Steinberg, D. Antimicrobial Potential of Endocannabinoid and Endocannabinoid-like Compounds against Methicillin-Resistant Staphylococcus aureus. Sci. Rep. 2018, 8, 17696. [Google Scholar] [CrossRef]
  8. Sionov, R.V.; Banerjee, S.; Bogomolov, S.; Smoum, R.; Mechoulam, R.; Steinberg, D. Targeting the Achilles’ Heel of Multidrug-Resistant Staphylococcus aureus by the Endocannabinoid Anandamide. Int. J. Mol. Sci. 2022, 23, 7798. [Google Scholar] [CrossRef] [PubMed]
  9. Cravatt, B.F.; Demarest, K.; Patricelli, M.P.; Bracey, M.H.; Giang, D.K.; Martin, B.R.; Lichtman, A.H. Supersensitivity to Anandamide and Enhanced Endogenous Cannabinoid Signaling in Mice Lacking Fatty Acid Amide Hydrolase. Proc. Natl. Acad. Sci. USA 2001, 98, 9371–9376. [Google Scholar] [CrossRef]
  10. Fornelos, N.; Franzosa, E.A.; Bishai, J.; Annand, J.W.; Oka, A.; Lloyd-Price, J.; Arthur, T.D.; Garner, A.; Avila-Pacheco, J.; Haiser, H.J.; et al. Growth Effects of N-Acylethanolamines on Gut Bacteria Reflect Altered Bacterial Abundances in Inflammatory Bowel Disease. Nat. Microbiol. 2020, 5, 486–497. [Google Scholar] [CrossRef] [PubMed]
  11. Sionov, R.V.; Feldman, M.; Smoum, R.; Mechoulam, R.; Steinberg, D. Anandamide Prevents the Adhesion of Filamentous Candida albicans to Cervical Epithelial Cells. Sci. Rep. 2020, 10, 13728. [Google Scholar] [CrossRef]
  12. Wolfson, G.; Sionov, R.V.; Smoum, R.; Korem, M.; Polacheck, I.; Steinberg, D. Anti-Bacterial and Anti-Biofilm Activities of Anandamide against the Cariogenic Streptococcus mutans. Int. J. Mol. Sci. 2023, 24, 6177. [Google Scholar] [CrossRef]
  13. Baker, J.L.; Faustoferri, R.C.; Quivey, R.G. Acid-Adaptive Mechanisms of Streptococcus mutans–the More We Know, the More We Don’t. Mol. Oral Microbiol. 2017, 32, 107–117. [Google Scholar] [CrossRef] [PubMed]
  14. Dashper, S.G.; Reynolds, E.C. Lactic Acid Excretion by Streptococcus mutans. Microbiology 1996, 142, 33–39. [Google Scholar] [CrossRef] [PubMed]
  15. Lemos, J.A.; Palmer, S.R.; Zeng, L.; Wen, Z.T.; Kajfasz, J.K.; Freires, I.A.; Abranches, J.; Brady, L.J. The Biology of Streptococcus Mutans. Microbiol. Spectr. 2018, 7, 10–1128. [Google Scholar] [CrossRef]
  16. Krzyściak, W.; Jurczak, A.; Kościelniak, D.; Bystrowska, B.; Skalniak, A. The Virulence of Streptococcus mutans and the Ability to Form Biofilms. Eur. J. Clin. Microbiol. Infect. Dis. 2014, 33, 499–515. [Google Scholar] [CrossRef]
  17. Zhang, H.; Mu, R.; Wang, Z.; Peng, S.; Yang, X.Y.; Qin, X. Trans-Cinnamaldehyde Inhibition of Pyruvate Dehydrogenase: Effects on Streptococcus mutans Carbohydrate Metabolism. J. Proteome Res. 2024, 23, 3682–3695. [Google Scholar] [CrossRef]
  18. Miyasawa, H.; Iwami, Y.; Mayanagi, H.; Takahashi, N. Xylitol Inhibition of Anaerobic Acid Production by Streptococcus mutans at Various PH Levels. Oral Microbiol. Immunol. 2003, 18, 215–219. [Google Scholar] [CrossRef]
  19. Lin, Y.; Gong, T.; Ma, Q.; Jing, M.; Zheng, T.; Yan, J.; Chen, J.; Pan, Y.; Sun, Q.; Zhou, X.; et al. Nicotinamide Could Reduce Growth and Cariogenic Virulence of Streptococcus mutans. J. Oral Microbiol. 2022, 14, 2056291. [Google Scholar] [CrossRef] [PubMed]
  20. Maehara, H.; Iwami, Y.; Mayanagi, H.; Takahashi, N. Synergistic Inhibition by Combination of Fluoride and Xylitol on Glycolysis by Mutans Streptococci and Its Biochemical Mechanism. Caries Res. 2005, 39, 521–528. [Google Scholar] [CrossRef]
  21. Daboor, S.M.; Masood, F.S.S.; Al-Azab, M.S.; Nori, E.E. A Review On Streptococcus mutans With Its Diseases Dental Caries, Dental Plaque And Endocarditis. Indian J. Microbiol. Res. 2015, 2, 76–82. [Google Scholar]
  22. Queiroz, V.S.D.; Ccahuana-Vásquez, R.A.; Tedesco, A.F.; Lyra, L.; Cury, J.A.; Schreiber, A.Z. Influence of the Culture Medium in Dose-Response Effect of the Chlorhexidine on Streptococcus mutans Biofilms. Scientifica 2016, 2016, 2816812. [Google Scholar] [CrossRef] [PubMed]
  23. Chamlagain, M.; Hu, J.; Sionov, R.V.; Steinberg, D. Anti-Bacterial and Anti-Biofilm Activities of Arachidonic Acid against the Cariogenic Bacterium Streptococcus Mutans. Front. Microbiol. 2024, 15, 1333274. [Google Scholar] [CrossRef] [PubMed]
  24. Rewak-Soroczynska, J.; Dorotkiewicz-Jach, A.; Drulis-Kawa, Z.; Wiglusz, R.J. Culture Media Composition Influences the Antibacterial Effect of Silver, Cupric, and Zinc Ions against Pseudomonas aeruginosa. Biomolecules 2022, 12, 963. [Google Scholar] [CrossRef]
  25. Bock, L.J.; Hind, C.K.; Sutton, J.M.; Wand, M.E. Growth Media and Assay Plate Material Can Impact on the Effectiveness of Cationic Biocides and Antibiotics against Different Bacterial Species. Lett. Appl. Microbiol. 2018, 66, 368–377. [Google Scholar] [CrossRef]
  26. Dashper, S.G.; Reynolds, E.C. pH Regulation by Streptococcus mutans. J. Dent. Res. 1992, 71, 1159–1165. [Google Scholar] [CrossRef]
  27. Thevenot, T.; Brochu, D.; Vadeboncoeur, C.; Hamilton, I.R. Regulation of ATP-Dependent P-(Ser)-HPr Formation in Streptococcus mutans and Streptococcus salivarius. J. Bacteriol. 1995, 177, 2751–2759. [Google Scholar] [CrossRef] [PubMed]
  28. Zhang, M.; Yu, W.; Zhou, S.; Zhang, B.; Lo, E.C.M.; Xu, X.; Zhang, D. In Vitro Antibacterial Activity of an FDA-Approved H+-ATPase Inhibitor, Bedaquiline, Against Streptococcus mutans in Acidic Milieus. Front. Microbiol. 2021, 12, 647611. [Google Scholar] [CrossRef]
  29. Sekiya, M.; Izumisawa, S.; Iwamoto-Kihara, A.; Fan, Y.; Shimoyama, Y.; Sasaki, M.; Nakanishi-Matsui, M. Proton-Pumping F-ATPase Plays an Important Role in Streptococcus mutans under Acidic Conditions. Arch. Biochem. Biophys. 2019, 666, 46–51. [Google Scholar] [CrossRef]
  30. Baker, J.L.; Derr, A.M.; Faustoferri, R.C.; Quivey, R.G. Loss of NADH Oxidase Activity in Streptococcus mutans Leads to Rex-Mediated Overcompensation in NAD+ Regeneration by Lactate Dehydrogenase. J. Bacteriol. 2015, 197, 3645–3657. [Google Scholar] [CrossRef]
  31. Abranches, J.; Candella, M.M.; Wen, Z.T.; Baker, H.V.; Burne, R.A. Different Roles of EIIABMan and EIIGlc in Regulation of Energy Metabolism, Biofilm Development, and Competence in Streptococcus mutans. J. Bacteriol. 2006, 188, 3748–3756. [Google Scholar] [CrossRef] [PubMed]
  32. Iwami, Y.; Schachtele, C.F.; Yamada, T. Mechanism of Inhibition of Glycolysis in Streptococcus mutans NCIB 11723 by Chlorhexidine. Oral Microbiol. Immunol. 1995, 10, 360–364. [Google Scholar] [CrossRef] [PubMed]
  33. Phan, T.N.; Marquis, R.E. Triclosan Inhibition of Membrane Enzymes and Glycolysis of Streptococcus mutans in Suspensions and Biofilms. Can. J. Microbiol. 2006, 52, 977–983. [Google Scholar] [CrossRef] [PubMed]
  34. Mielko, K.A.; Jabłoński, S.J.; Łukaszewicz, M.; Młynarz, P. Comparison of Bacteria Disintegration Methods and Their Influence on Data Analysis in Metabolomics. Sci. Rep. 2021, 11, 20859. [Google Scholar] [CrossRef] [PubMed]
  35. MacKay, G.M.; Zheng, L.; Van Den Broek, N.J.F.; Gottlieb, E. Analysis of Cell Metabolism Using LC-MS and Isotope Tracers. In Methods Enzymol; Academic Press Inc.: Cambridge, MA, USA, 2015; Volume 561, pp. 171–196. [Google Scholar]
  36. Alam, S.; Brailsford, S.R.; Adams, S.; Allison, C.; Sheehy, E.; Zoitopoulos, L.; Kidd, E.A.; Beighton, A.D. Genotypic Heterogeneity of Streptococcus oralis and Distinct Aciduric Subpopulations in Human Dental Plaque. Appl. Environ. Microbiol. 2000, 66, 3330–3336. [Google Scholar] [CrossRef]
  37. Wilkins, J.C.; Homer, K.A.; Beighton, D. Analysis of Streptococcus mutans Proteins Modulated by Culture under Acidic Conditions. Appl. Environ. Microbiol. 2002, 68, 2382–2390. [Google Scholar] [CrossRef]
Figure 1. PCA and volcano plot analyses reveal AEA-induced metabolic changes in S. mutans. Metabolomic profiling of S. mutans treated with AEA. S. mutans was untreated (control) or treated with 10 µg/mL for 1 and 6 h. Metabolites were analyzed by LC-MS. PCA score plot of samples at (A) 1 h and (C) 6 h. Volcano plot showing differentially expressed metabolites in AEA-treated samples at (B) 1 h and (D) 6 h compared to controls. Data were analyzed and visualized using MetaboAnalyst software V.6.0. n = 6.
Ijms 26 08401 g001
Figure 2. ATP production is suppressed, and NAD+/NADH imbalance reflects redox disruption. (A) Heatmap showing glycolytic intermediates after 6 h incubation with 10 µg/mL AEA, displaying glycolytic intermediates glyceraldehyde-3-phosphate (GA3P), dihydroxyacetone phosphate, lactate, D-fructose 1,6-biphosphate (F1,6BP), F6P, 2-PG, ATP, and phosphoenolpyruvate. Samples were analyzed and graphs were generated using MetaboAnalyst software V.6.0. n = 6. (B) NAD+/NADH ratio and (C) ATP production in AEA-treated samples after 6 h incubation compared to control. Samples were analyzed and graphs were generated using Metabolite Autoplotter V.2.6. n = 6. ** p < 0.01; n.s. not significant.
Ijms 26 08401 g002
Figure 3. Pathway enrichment and impact analysis of S. mutans treated with AEA. S. mutans was untreated (control) or treated with 10 µg/mL AEA. Metabolites were analyzed by LC-MS. Pathway Enrichment Analysis results are shown after (A) 1 h and (B) 6 h of incubation. Green arrows indicate the PPP, and blue arrows denote the glycolysis pathway. Data were analyzed and visualized using MetaboAnalyst Software V.6.0. n = 6.
Ijms 26 08401 g003
Figure 4. Tracing analysis of glycolytic intermediates. S. mutans untreated and treated with 10 µg/mL AEA for 1 and 6 h, grown in the presence of 13C-glucose, and analyzed by LC-MS-based metabolomics. Glycolytic intermediates (A) G6P, (B) F6P, (C) F1,6BP, (D) 2-PG, (E) PEP, and (F) pyruvate were analyzed, and graphs were generated using Metabolite AutoPlotter V.2.6. Statistical significance was calculated using the Mann–Whitney test. n = 6 for all conditions except AEA 6 h, where n = 4. * p < 0.05 and ** p < 0.01; n.s. not significant.
Ijms 26 08401 g004
Figure 5. Metabolomics of extracellular glycolytic intermediates. Glycolytic intermediates (A) 13C6-glucose and (B) 13C3-lactate were analyzed, and graphs were generated using Metabolite AutoPlotter V.2.6. n = 6 for all conditions except AEA 6 h, where n = 5. * p < 0.05 and **** p < 0.0001.
Ijms 26 08401 g005
Figure 6. Metabolomics and flux analysis of intracellular glycolytic intermediates. Intracellular glycolytic intermediates, including (A) 13C3-phosphoenolpyruvate, (B) 13C3-pyruvate, (C) 13C3-2-PG, and (D) 13C3-lactate, were analyzed, and graphs were generated using Metabolite AutoPlotter V.2.6. n = 6. **** p < 0.0001.
Ijms 26 08401 g006
Figure 7. AEA reduces aciduricity and acidogenicity in S. mutans. (A) The pH of the S. mutans culture medium measured at 0, 1, and 6 h incubation with AEA (0, 12.5, and 25 µg/mL). (B) CFUs per mL of bacteria treated with 0 and 10 µg/mL AEA in pH 7 and pH 5.2 after 0, 1, and 6 h of incubation. (C) The OD of these samples measured at the same time. n = 3; ** p < 0.01, *** p < 0.001.
Ijms 26 08401 g007
Figure 8. AEA inhibits various carbohydrate metabolisms. The viability of S. mutans after 24 h incubation with AEA (0–50 µg/mL) with the external addition of either glucose, fructose, mannitol, lactose, or galactose to a final concentration of 1% measured at OD600nm. n = 3; *** p < 0.001.
Ijms 26 08401 g008
Disclaimer/Publisher’s Note: The statements, opinions and data contained in all publications are solely those of the individual author(s) and contributor(s) and not of MDPI and/or the editor(s). MDPI and/or the editor(s) disclaim responsibility for any injury to people or property resulting from any ideas, methods, instructions or products referred to in the content.