1. Introduction
Vision is one of the critical sensory modalities for living organisms, enabling them to respond with high accuracy to changes and events in their environment. At the same time, illumination levels and visual stimuli in a natural context can vary by up to 10 orders of magnitude. The vertebrate visual system can operate across this entire spectrum, at least thanks in part to two types of photoreceptors found in the retina and their associated adaptation mechanisms. There are two main types of photoreceptors in vertebrates: rods and cones. Rods are receptors for night vision, characterized by high sensitivity and slow photoresponse development. Cones are day vision receptors that exhibit rapid photoresponses and lower light sensitivity and do not saturate even at the highest intensities [
1,
2].
The biochemical cascade of visual transduction is principally shared by rods and cones and involves several amplification steps [
3,
4]. The visual pigment, a member of the G-protein-coupled receptor family, interacts with a GTP-binding protein called transducin upon absorbing light, producing its active form, T* (Tα-GTP). Each T* molecule activates the effector enzyme cGMP-phosphodiesterase (PDE), significantly increasing the hydrolysis rate of cyclic guanosine monophosphate (cGMP), the secondary messenger in the vertebrate phototransduction cascade. cGMP-gated cation channels located in the outer segment plasma membrane are highly sensitive to a decline in cGMP levels, which causes the cyclic nucleotide-gated (CNG) channels to close. Photoreceptor cells hyperpolarize, and neurotransmitter release from the synaptic terminal slows down. This is the process of the response to light that occurs in the retina. The light-activated cascade is quenched by mechanisms operating at each activation step. Light-induced visual pigment activity is decreased by multiple phosphorylation carried out by opsin kinases (also called G-protein-coupled receptor kinases, GRKs) and subsequent arrestin binding. The active TαGTP-PDE* is turned off by its intrinsic GTPase activity, while the restoration of dark cGMP levels is due to continuously running guanylate cyclase (GC).
The visual system can operate over a wide range of illuminances thanks to light adaptation mechanisms, which occur at various stages of visual perception and processing, primarily at the level of photoreceptor cells [
5]. The first and most extensively studied group of these mechanisms relies on intracellular calcium concentrations [
6,
7]. The regulatory effect of calcium is based on changing the balance of its input and output through the plasma membrane of the photoreceptor outer segment. Under illumination, the concentration of calcium in the cytoplasm decreases. This leads to increased GRK activity via recoverin, increased GC activity via guanylate cyclase activating protein (GCAP), and increased affinity of CNG channels for cGMP via calmodulin. Calcium feedbacks contribute greatly to light adaptation, but it cannot fully explain the range of adaptation in rods and cones. This suggests the existence of additional calcium-independent regulatory mechanisms in the phototransduction cascade, and the search for such additional mechanisms is ongoing.
The search for new regulatory loops in the phototransduction cascade, which underlies light and dark adaptation as well as the adjustment of photoreceptor functions in accordance with diurnal rhythms, led to the discovery of the important role of cyclic adenosine monophosphate (cAMP) in regulating visual transduction. The level of cAMP in vertebrate retinal cells is light-dependent and consequently follows a diurnal rhythm [
8,
9,
10]. Its concentration decreases cyclically during the day and increases at night. This pattern indicates that the intracellular level of cAMP may regulate circadian adjustments in the retina, facilitating adaptation to high illumination levels during the day and low illumination levels at night. Recent work suggests that such cAMP-based regulation may also occur at the level of photoreceptor cells. A number of studies have shown that direct effectors of intracellular cAMP—protein kinase A (PKA) and exchange protein activated by cAMP (EPAC)—have targets among the proteins participating in the phototransduction cascade. These targets include GRKs, whose phosphorylation has been demonstrated in both in vitro and in vivo studies [
11,
12,
13]. Furthermore, it has been shown that cAMP levels influence the function of CNG channels [
14], as well as phosducin, a protein whose function is not fully understood but which can bind to the α-subunit of transducin [
15,
16,
17,
18]. With regard to the capacity of cAMP to modulate the functions of photoreceptor cells in general, a number of electrophysiological studies have been conducted in recent years. Our group [
19] carried out research on amphibian rods and demonstrated that an increase in intracellular cAMP levels, comparable to the daily fluctuations in the retina, causes more than a twofold increase in rod sensitivity to light stimuli. It was also found that pharmacological elevation of cAMP significantly increases the signal-to-noise ratio in amphibian rods [
20]. Furthermore, direct measurements of cAMP levels in the outer segments of rods from the same species revealed that saturating background illumination results in an immediate increase in cAMP levels and the simultaneous activation of PKA [
21]. However, in mouse rods, another method showed a short-term decrease in PKA activity under saturating illumination, followed by a subsequent increase in PKA activity after the light was turned off [
22].
In this context, the question of whether the phototransduction cascade in cones is regulated by cAMP seems non-trivial. Cones are daytime photoreceptors that operate at high levels of illumination; at twilight, their contribution to vision is almost negligible. An increase in sensitivity during the ‘dark’ phase would be functionally unnecessary for them. However, cAMP-dependent regulation in cones could exist independently of circadian rhythms, enabling them to quickly and efficiently adjust to changing light levels during the daytime. Nevertheless, considerably less is known about the ability of cAMP to regulate the phototransduction cascade in cones, and the available data are somewhat contradictory. Previously, our group pharmacologically increased cAMP levels in isolated green- and red-sensitive cones of the golden carp (
Carassius carassius) and demonstrated that this slows the kinetics of photoresponse shutdown without altering the cones’ sensitivity to light [
23]. Another study on the whole eye of five-day-old zebrafish larvae showed that increasing cAMP levels slowed dark adaptation in cones (without differentiation by spectral type), but this was not accompanied by changes in sensitivity to light flashes or photoresponse parameters [
24]. The discrepancy between the results obtained for the cones of adult
Carassius carassius and
Danio rerio larvae may be due to underdeveloped signaling systems in larval cones or to the effects of mixing of responses from all spectral cell types.
Thus, there is a need to clarify how the regulatory effects of cAMP influence the function, light sensitivity, and photoresponses of mature vertebrate cones of different spectral types in the fully developed retina. Zebrafish (
Danio rerio) is a suitable species for such a study, as the expression of GRKs in their photoreceptors has been characterized: the cones of this species possess a retinal GRK expression pattern similar to that of humans, and both Grk1b and Grk7 are expressed and participate in returning cone photoreceptors to the dark-adapted state [
25].
2. Results
In darkness, photoreceptors generate a photocurrent that flows through the cytoplasm, across the membranes of both the outer and inner segments, and through the extracellular space. Light partly or completely stops the photocurrent, depending on the spectrum, intensity, and duration of the stimulation. The suction pipette allows recording of the photocurrent from an individual photoreceptor.
In the present study, we used the suction pipette method to selectively assess the effect of forskolin-induced elevated cAMP levels on isolated fish cones of two spectral classes: green-sensitive (or medium-wavelength-sensitive, MWS) and blue-sensitive (short-wavelength-sensitive, SWS2) cones of zebrafish. We should note that until recently, and as far as we know, no studies had selectively recorded photoresponses from isolated zebrafish cones. The very first research of its kind was published earlier this year [
26]. Our group adapted the suction pipette method [
27] for zebrafish cones and used it to analyze the effects of forskolin, which is the focus of the present study.
To increase the intracellular level of cAMP, we employed the adenylate cyclase activator forskolin. In our previous study on amphibian rods, forskolin increased cAMP concentration in the outer segment approximately twofold at 2 µM and sixfold at 10 µM. This effect plateaued within approximately 15 min [
19]. In the present study, the perfusion solution in the whole sample holder was replaced with a solution containing forskolin; replacement was completed within approximately 3.5 to 4 min. Considering these circumstances, photoresponses were recorded under the ‘forskolin-exposed’ conditions approximately 20 min after the perfusion solution replacement began.
In our previous research on amphibian rods examining the impact of cAMP on photoresponses, recordings were performed using two configurations: ‘outer segment out’, in which outer segments were exposed to drug and inner segments were held in the suction pipette, and ‘inner segment out’, where drug was applied to inner segments while outer segments were in the pipette. Perfusing either the rod’s outer or inner segment with a solution containing forskolin produced comparable effects in both configurations [
19,
20]. In this work, we used the ‘inner segment out’ configuration to record cone currents. Based on our experience, this approach significantly increased the number of cells that remained viable throughout the entire experimental protocol.
Four morphologically and spectrally different types of cone photoreceptor have been found in the retina of zebrafish: UV-sensitive (SWS1), blue-sensitive (SWS2), green-sensitive (MWS), and red-sensitive (LWS) [
28]. In the retina of adult fish, these cone types are arranged into a precise mosaic pattern, characterized by alternating rows of double cones composed of green- and red-sensitive cones, alongside single large blue- and small UV-sensitive cones. Consequently, the retina of this species contains twice as many green- and red-sensitive cones as blue- and UV-sensitive cones. The structural organization of the photoreceptor layer of the zebrafish retina directly determines the composition and cellular ratios of photoreceptor suspensions used for current recordings. For analysis, we have chosen a representative type from both double-cone (the green-sensitive) and single-cone (blue-sensitive) subpopulations.
In the prepared photoreceptor suspension, double cones are more commonly found, whereas single cones sensitive to blue and UV light are less frequently observed. In our experiments, to find a green-sensitive cone, we captured the outer segment of one of the double cones with a pipette. When searching for a blue-sensitive cone, we captured the outer segment of a single large cell.
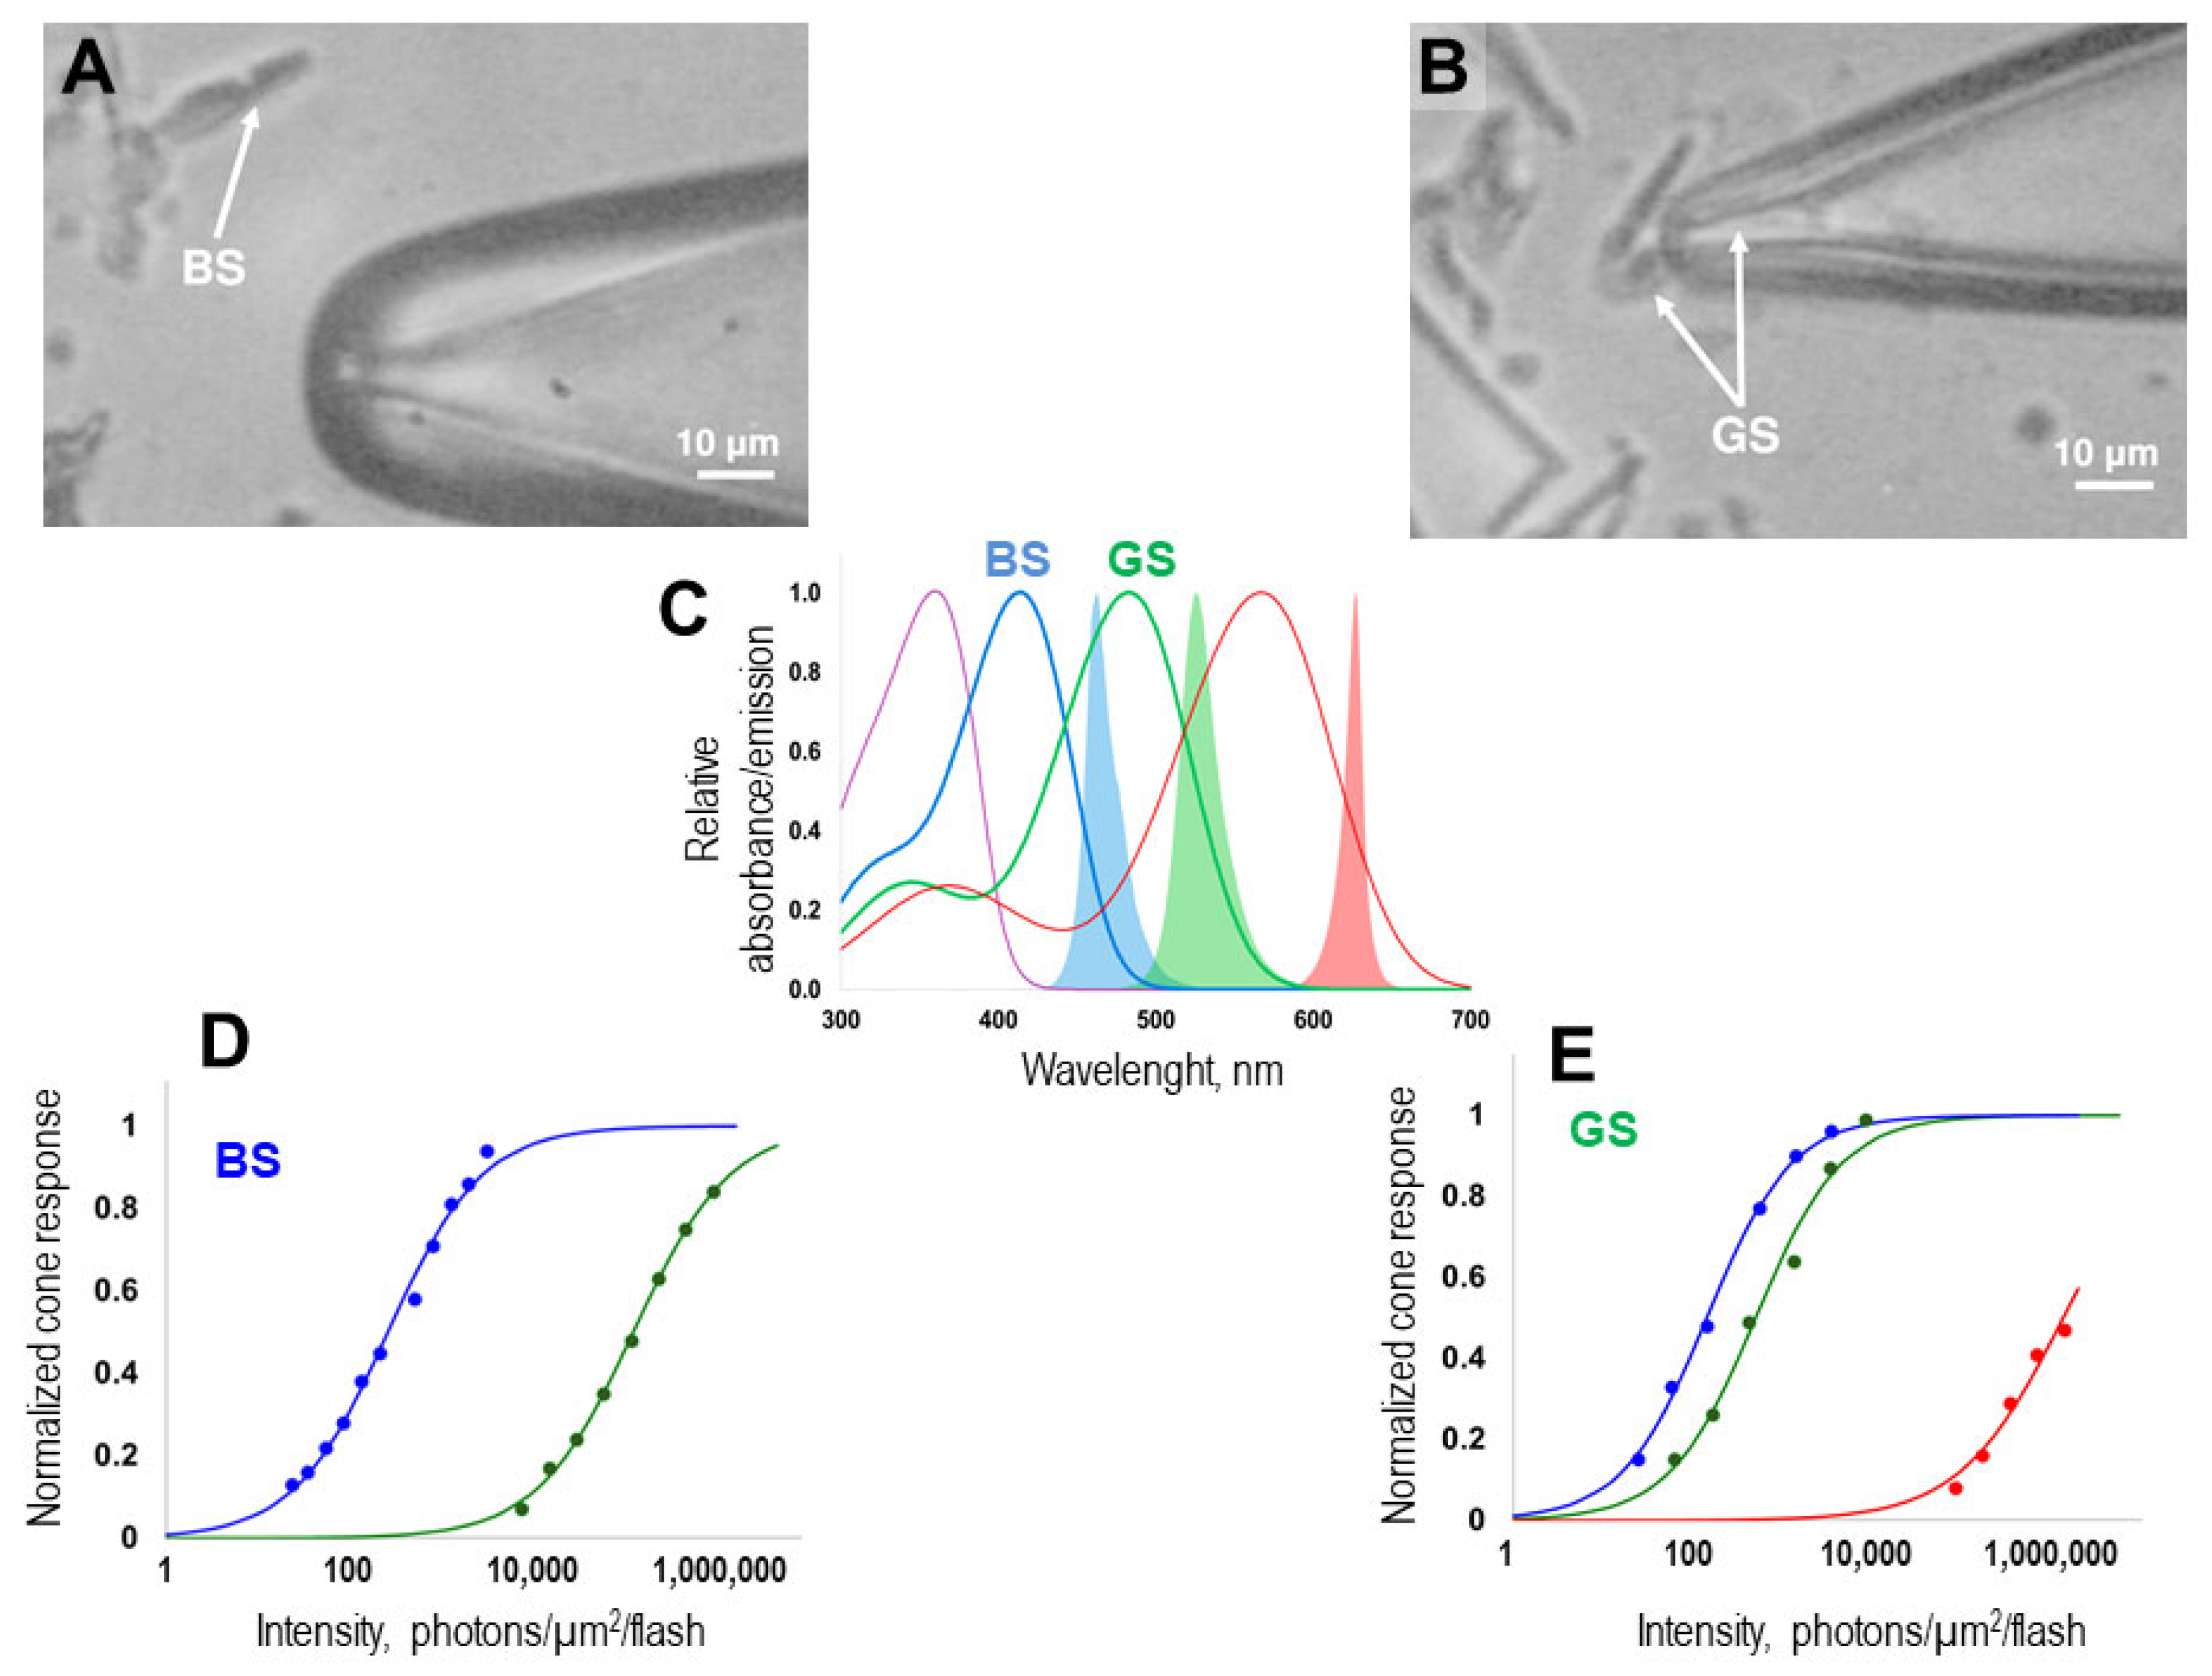
Figure 1A,B show the typical morphology of the cells whose currents we recorded in our study.
In order to accurately identify the spectral type of the cone that was drawn into the pipette, we determined its sensitivity to flashes of light with different spectral compositions. In our setup, three stimulating LEDs were used, each with a specific absorption maximum: red (λ
max = 630 nm), green (λ
max = 525 nm), and blue (λmax = 460 nm) (for more details, see the Material and Methods section). By overlaying the absorption spectra of the individual cone types of zebrafish with the emission spectra of the LEDs, we were able to precisely estimate the differential sensitivities of green- and blue-sensitive cones (see
Figure 1C). The response–intensity curves recorded for each cone at the beginning of the protocol allowed us to accurately assign the cone to its specific spectral type (
Figure 1D,E).
After determining the spectral type, the blue- and green-sensitive cones underwent a light stimulation and pharmacological exposure protocol designed to evaluate the potential effects of forskolin, which elevates cAMP levels. For light stimulation of both green- and blue-sensitive cones, we used blue light flashes (λmax = 460 nm). The light stimulation protocol included recording photoresponses to the flashes as follows: saturating flashes (to assess dark current), approximately half-saturating flashes (to analyze sensitivity and the kinetic parameters of the responses in detail), two consecutive saturating flashes at different intervals, and/or a set of saturating flashes with increasing intensity (to determine the rate of the limiting step of the cascade based on the time constant τD from Peppeberg’s analysis). For each cone, photoresponses were first recorded in Ringer’s solution, and a second set of measurements was conducted 20 min after replacing the normal Ringer’s solution with Ringer’s solution containing 10 µM forskolin.
Control experiments were performed on both types of cones studied: green- and blue-sensitive. In the control group, the isolated cones were subjected to the same experimental protocol as those in the forskolin group. The control cones were incubated in Ringer’s solution containing 0.1% DMSO (solvent) for approximately 20 min. The effects of forskolin on each photoresponse parameter were then assessed by comparison with the control group.
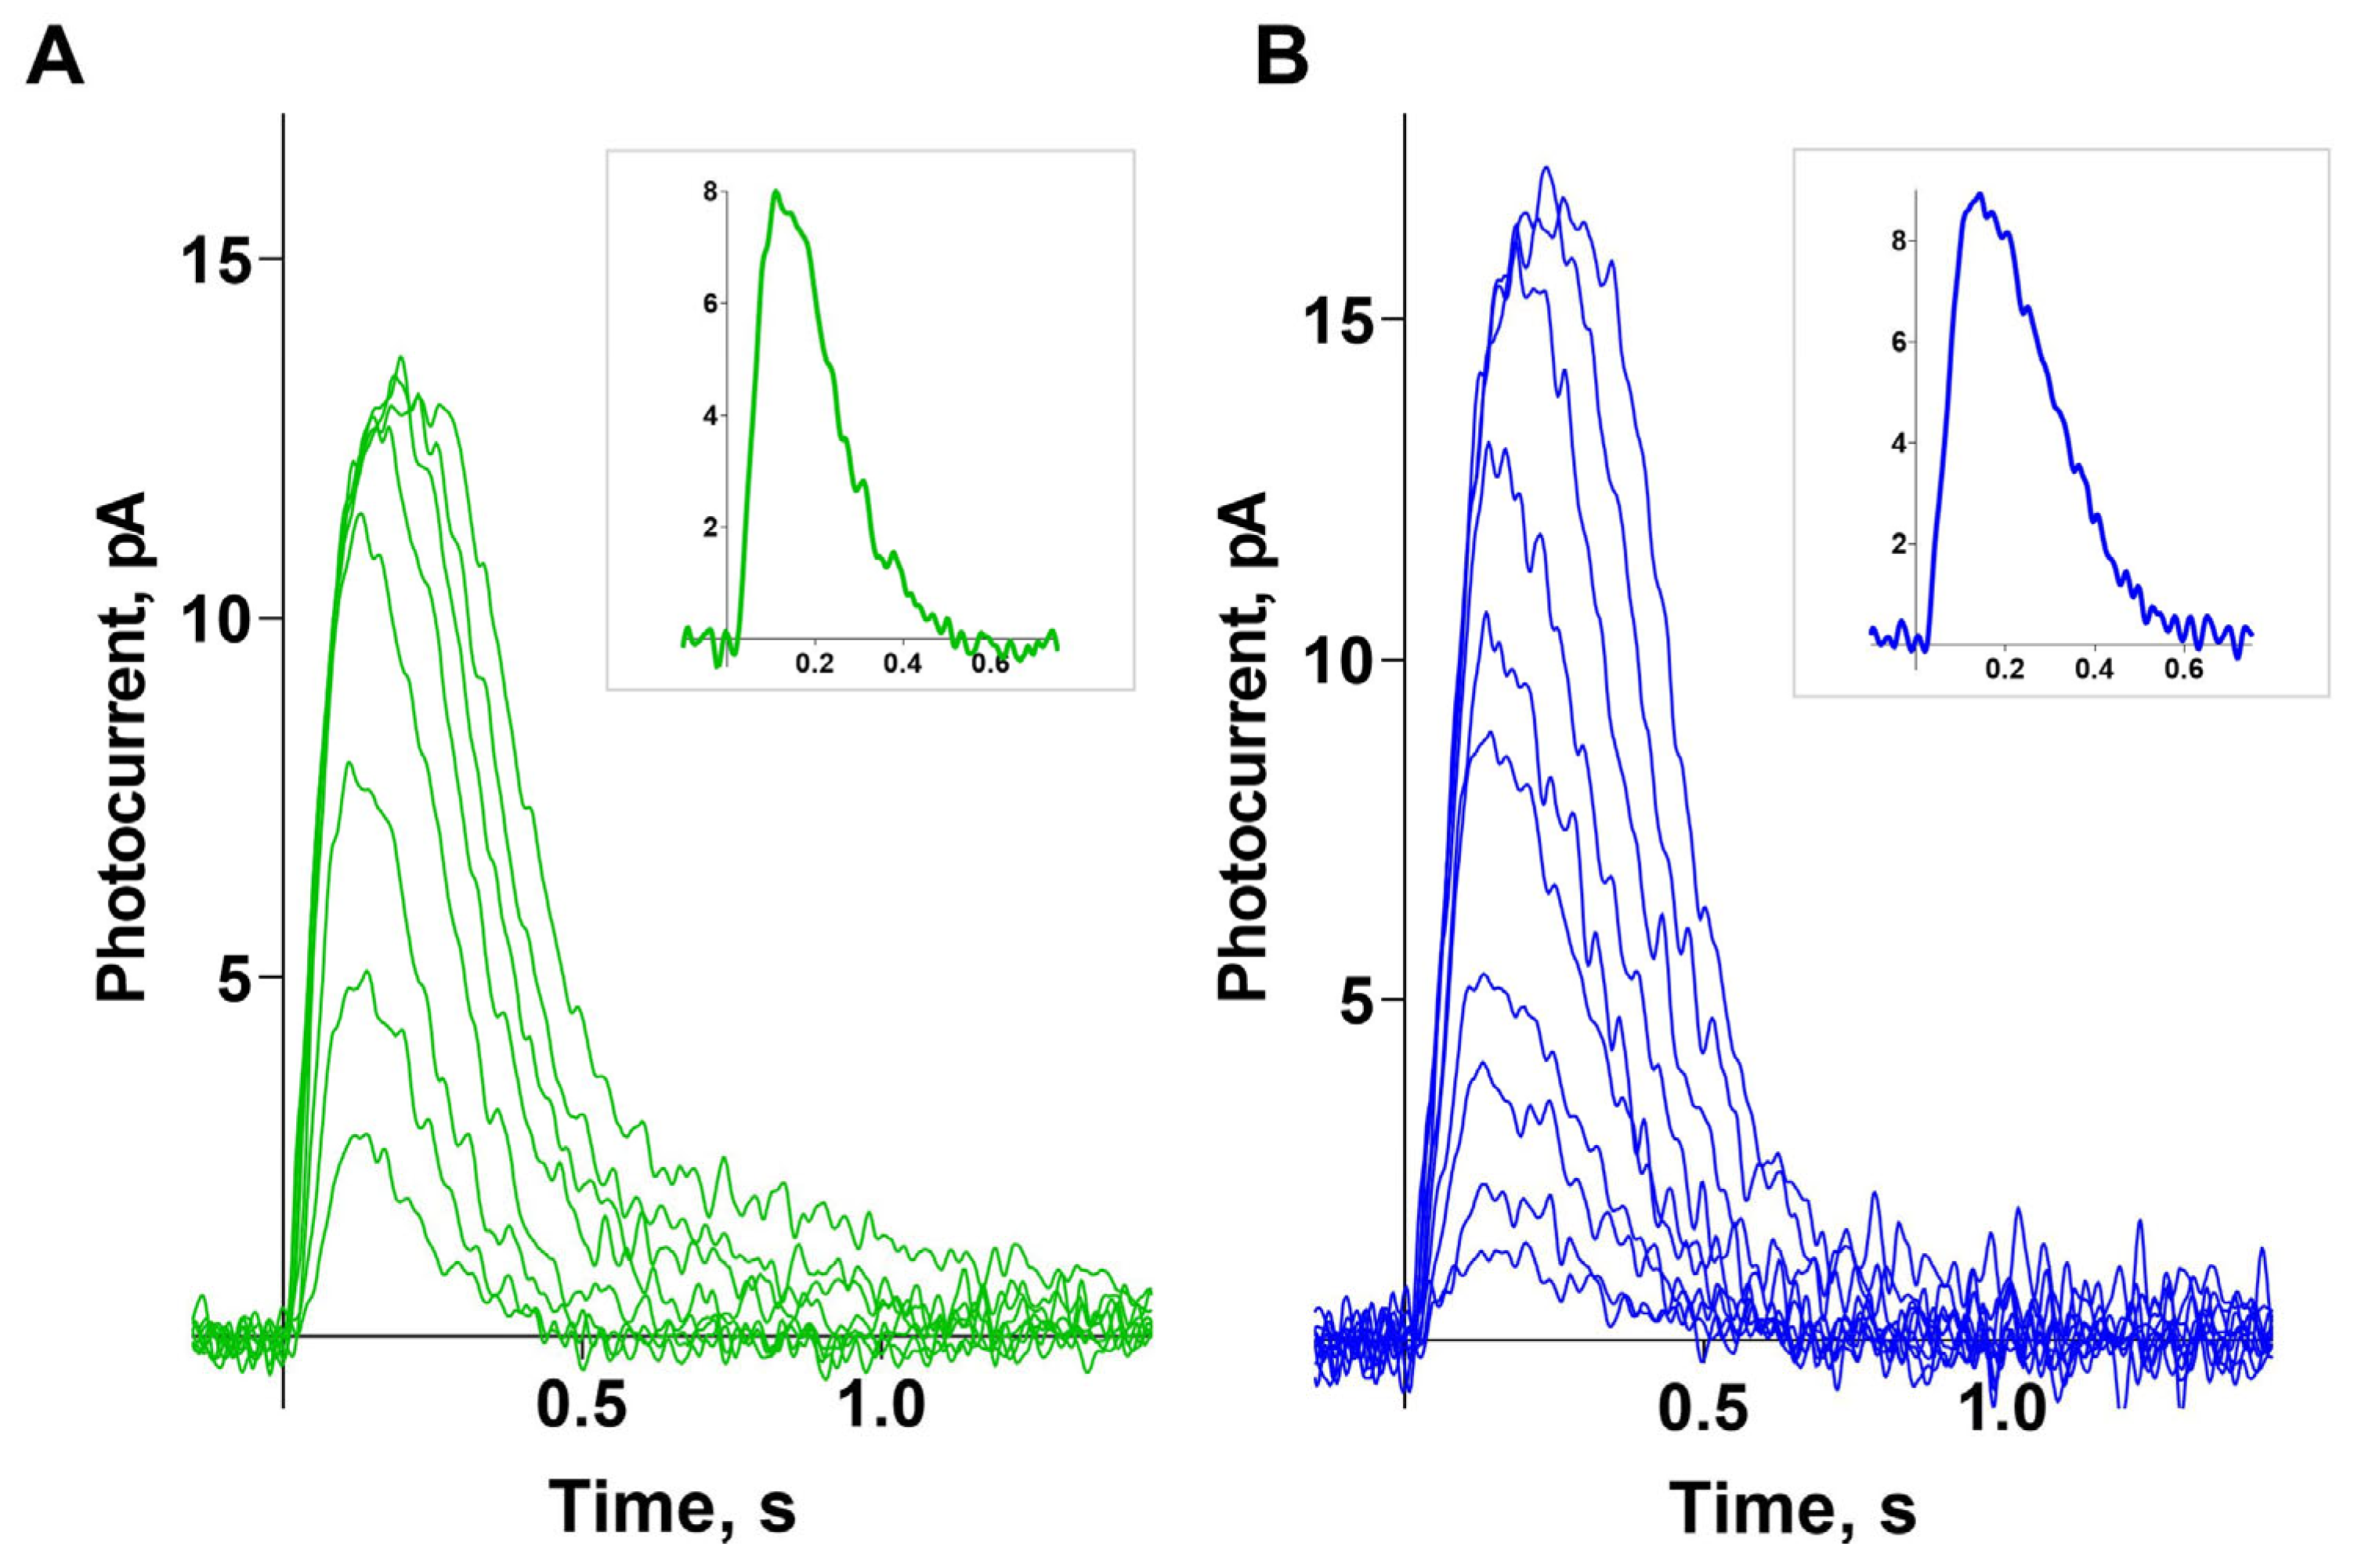
Figure 2 (panels A and B) shows typical sets of photoresponses from green- and blue-sensitive cones to blue light flashes of increasing intensity. For the analyzed cells, the mean dark current was 12.7 ± 0.7 pA for green-sensitive (GS) cones and 12.1 ± 0.7 pA for blue-sensitive (BS) cones. Near half-saturated responses differ in shape between GS and BS cones, with BS cones demonstrating slower recovery (the time constants of the recovery phase are 140 ± 11 ms and 184 ± 16 ms, respectively; a significant difference was found using an unpaired
t-test; both parameters are presented as mean ± SEM). Typical near half-saturated responses for GS and BS cones are shown in the two corresponding insets.
2.1. Forskolin Increases the Sensitivity of the Green- and Blue-Sensitive Cones
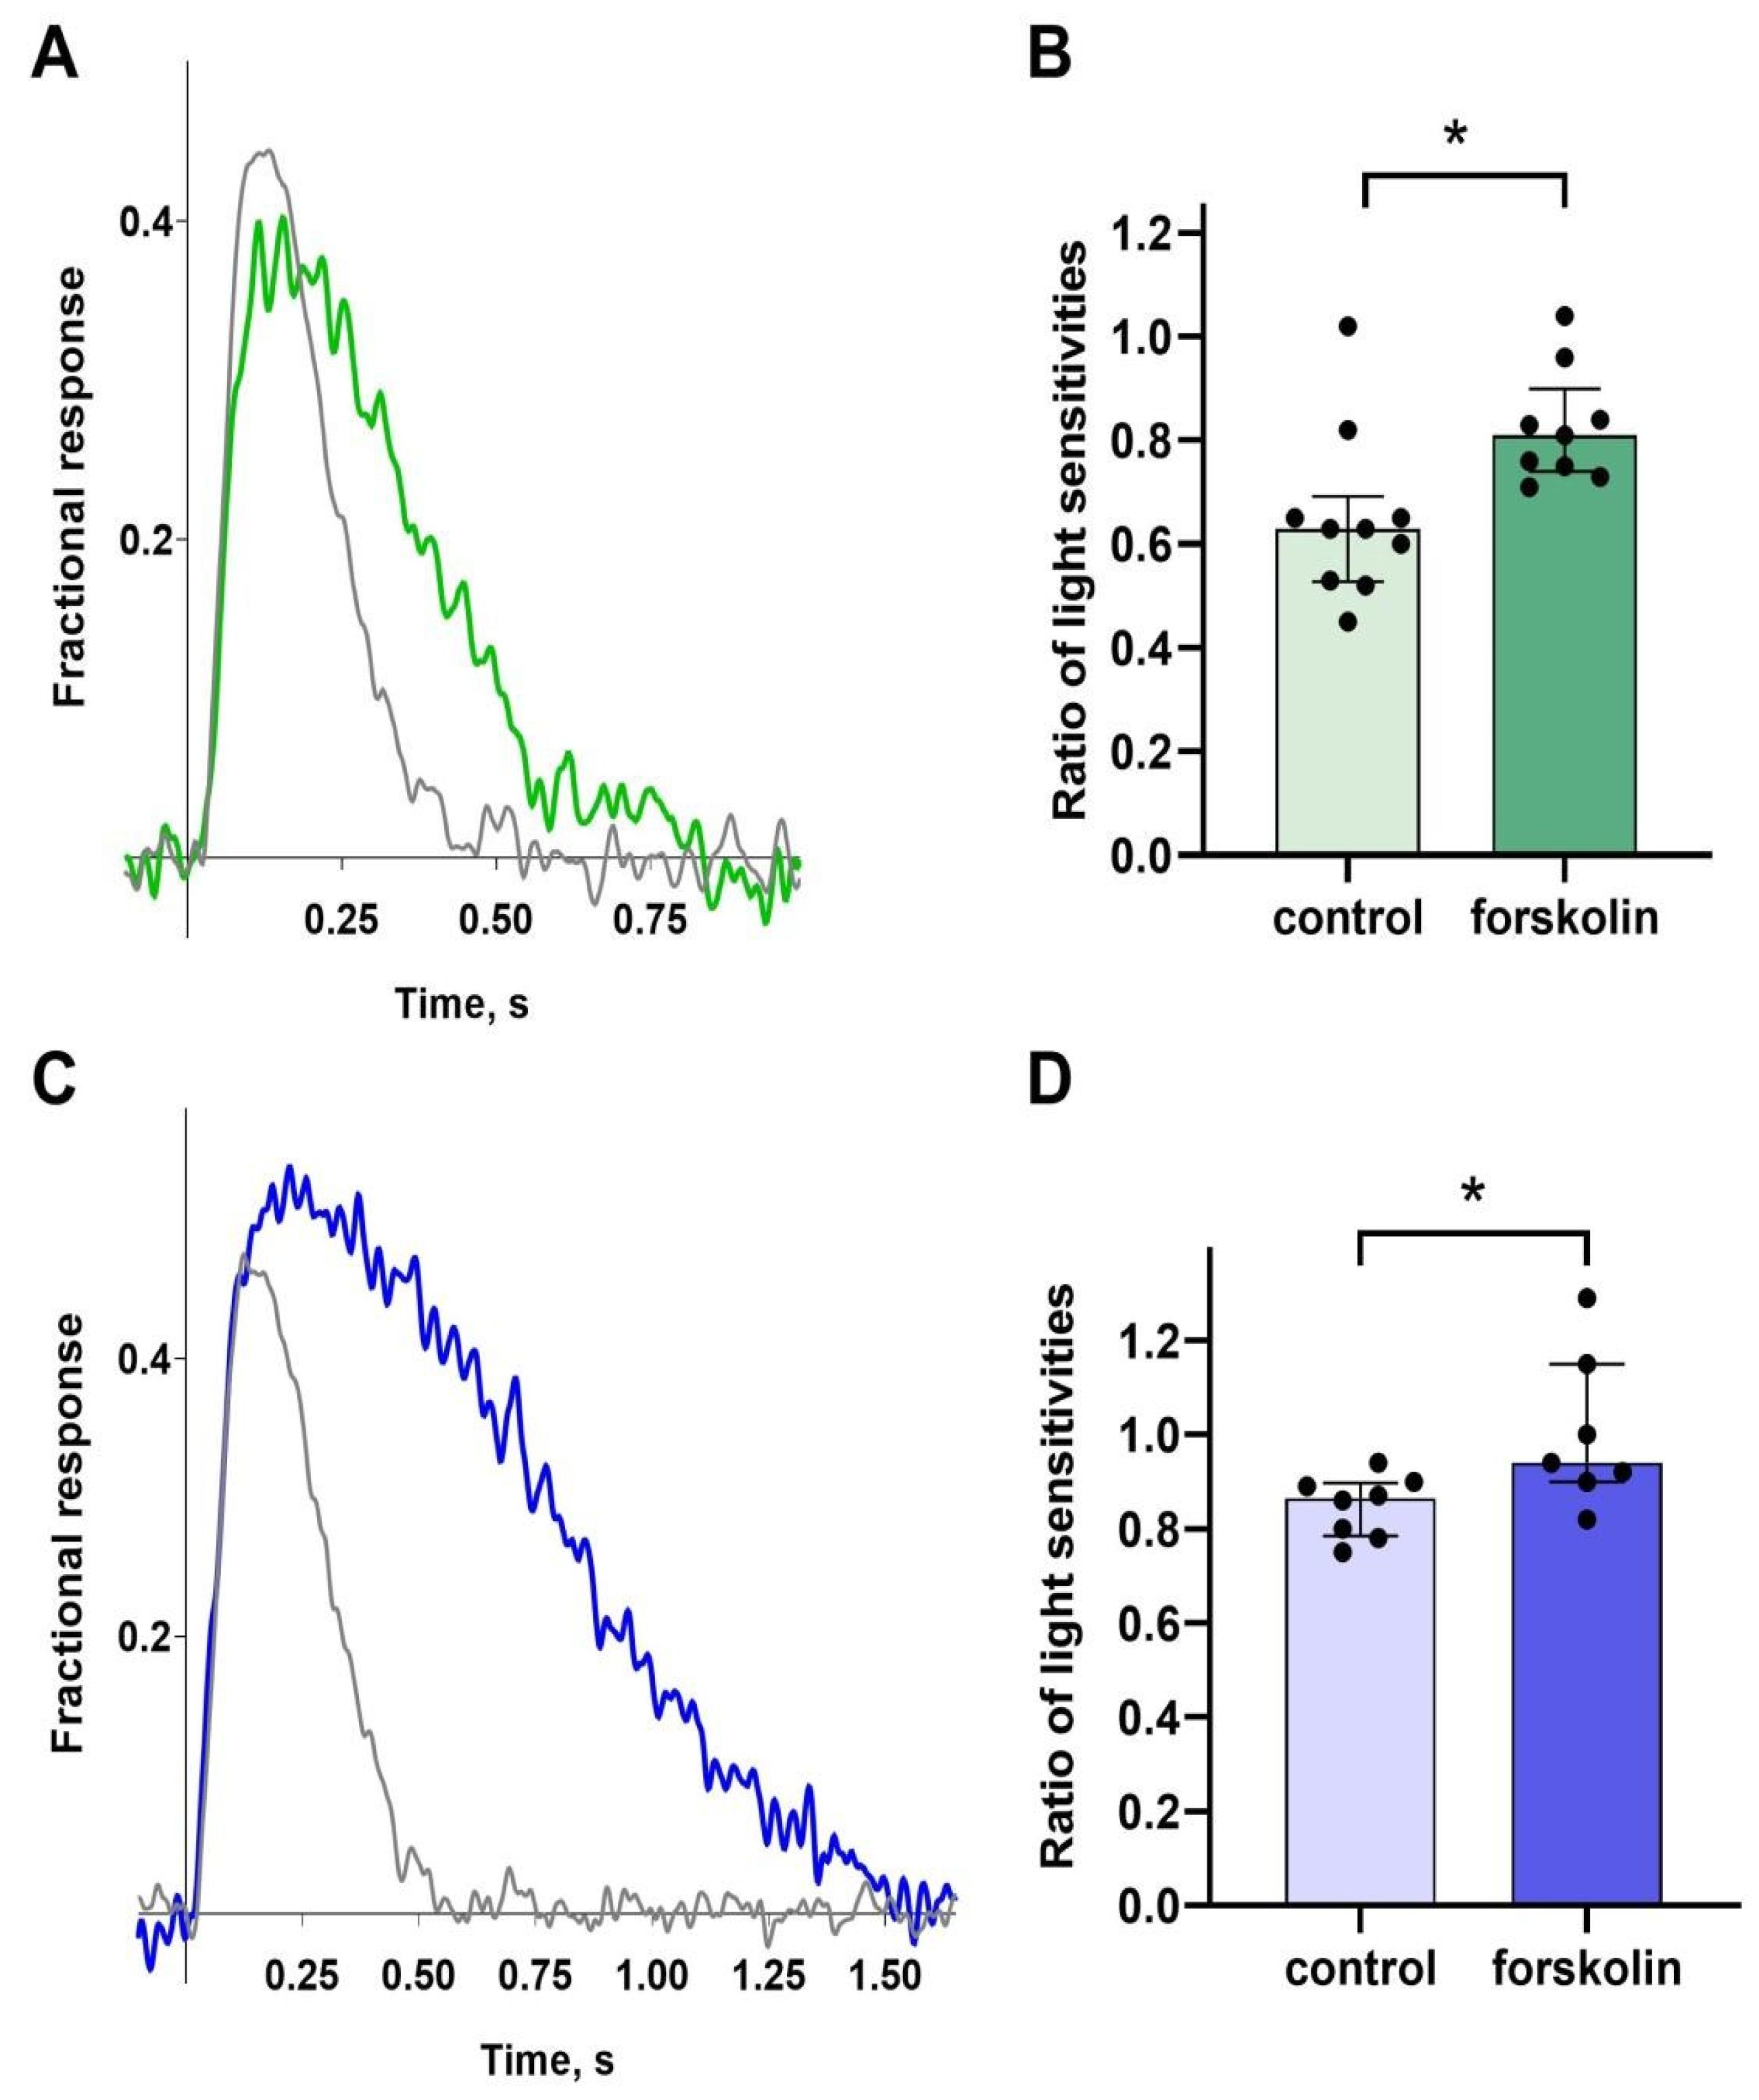
To examine how forskolin affects cone sensitivity to light, we recorded photoresponses to approximately half-saturating flashes first in normal Ringer’s solution and then again after 20 min of exposure to 10 μM forskolin (or 0.1% DMSO for control experiments). The intensity of the half-saturating flash was selected individually for each cone and varied within a small range due to variations in the sensitivity of the particular cells. For green-sensitive cones, this range was 224–701 photons/μm2 per flash, and for blue-sensitive cones, it was 340–548 photons/μm2 per flash. These non-saturated responses were then normalized to the dark current, determined by the amplitude of the saturated response recorded in the corresponding closest time point, to obtain the fractional response. As a criterion for possible changes in sensitivity induced by forskolin or in the control group, we used the ratio of the fractional response amplitude after exposure to that before exposure.
Exposure to 10 μM forskolin in green-sensitive cones led to a slight decrease in sensitivity (a representative example of normalized responses before and after forskolin exposure is shown in
Figure 3A), while the control group exposed to 0.1% DMSO exhibited a greater drop in sensitivity. The difference was statistically significant (see
Figure 3B). So, we interpreted this to mean that forskolin increases the sensitivity. A very similar effect of forskolin on sensitivity was observed in blue-sensitive cones (
Figure 3C,D), and we also concluded that forskolin increased the sensitivity of blue-sensitive cones compared to controls.
2.2. Forskolin Slows Down the Photoresponse Turn-Off Without Affecting the Activation Phase in Green- and Blue-Sensitive Cones
Visual comparison of responses before and after forskolin treatment reveals a noticeable change in the kinetics of photoresponses, which, at first glance, seems to be related to the inactivation phase of the phototransduction cascade. For a more rigorous quantitative assessment of the kinetic parameters of photoresponses affected by forskolin, we performed a mathematical analysis of potential changes.
To estimate the possible effect of forskolin on the activation rate of the phototransduction, we evaluated the variability of the initial phase of the response. Cones are characterized by extremely rapid processes in the phototransduction cascade, including very fast turn-off processes, which begin to affect the response curve shape from the very first fractions of a second. Therefore, we suppose that fitting the initial phase with a simple mathematical function, for example, a quadratic polynomial, as done in some studies [
30,
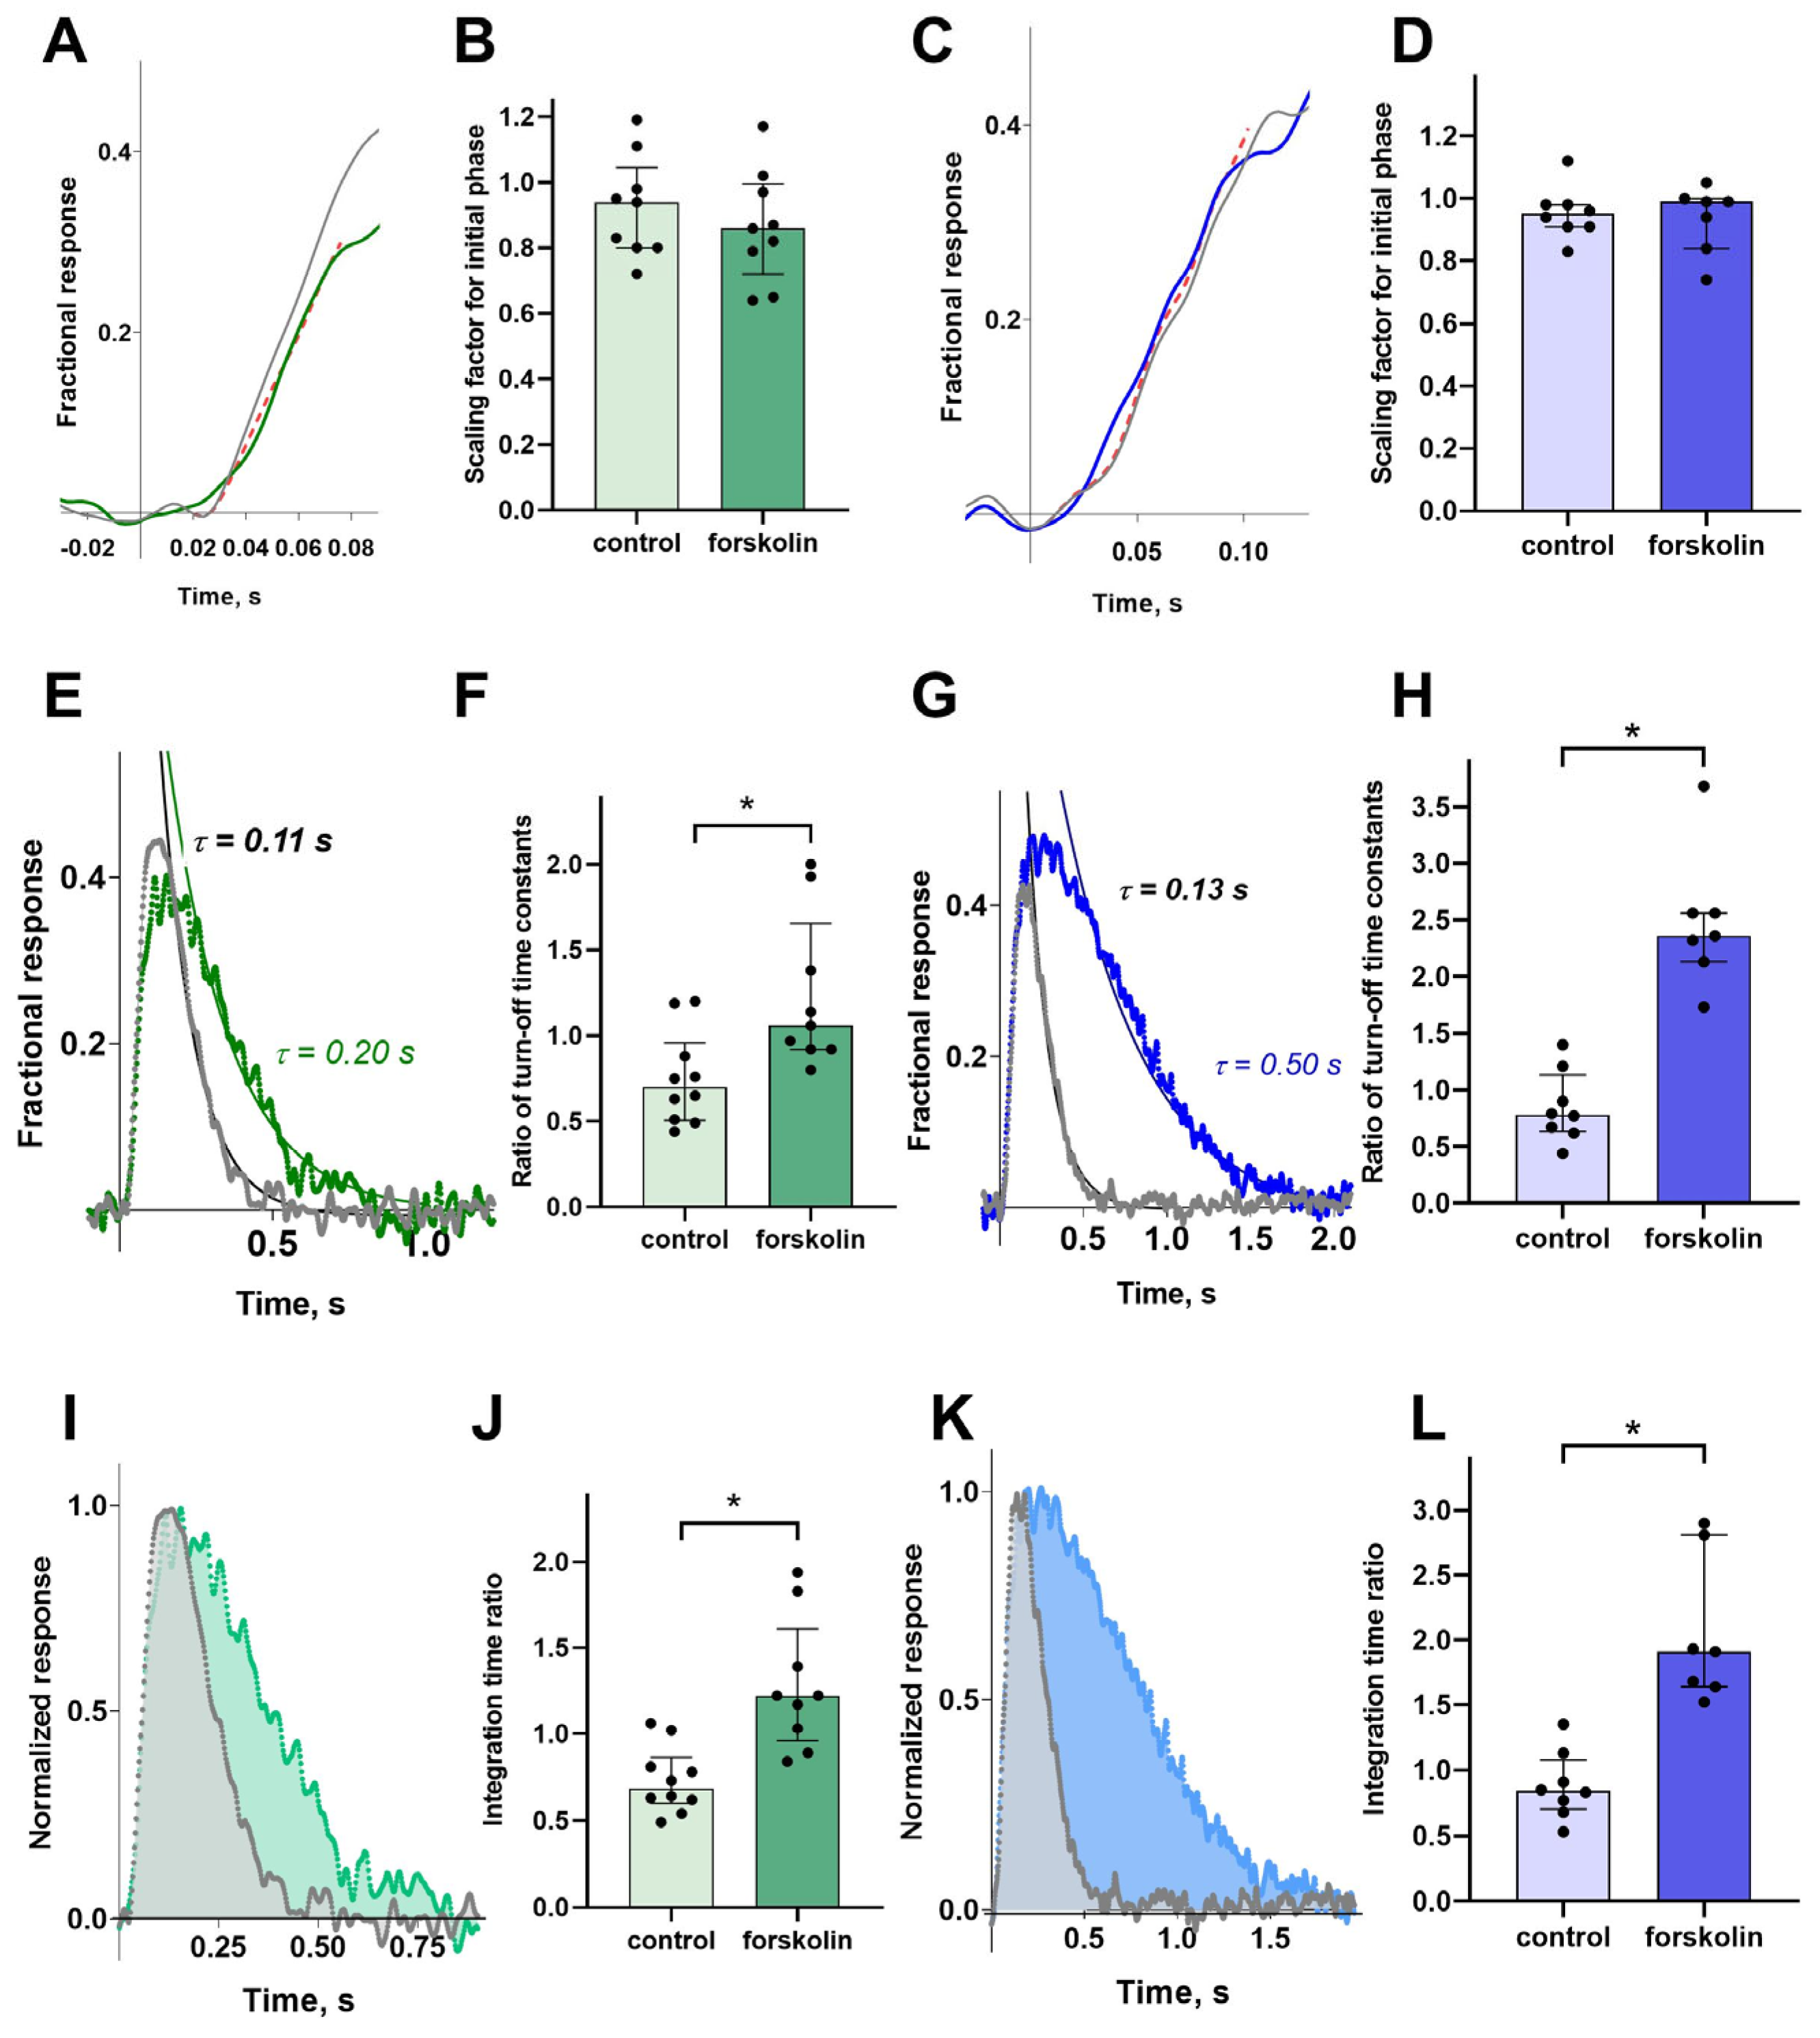
31], can introduce significant errors in calculations. For the purposes of our study, we only needed to determine the relative changes in the steepness of the initial phase. Therefore, we extracted the ratio of the two activation rates by adjusting the rising phases of two normalized photoresponses, recorded before and after exposure with a scaling factor (
Figure 4A,C).
Visual inspection of the two normalized unsaturated responses, pre- and post-forskolin treatment, indicates a slowing of the photoresponse turn-off. To quantify this effect and assess its significance, we fitted the falling phase of the photoresponse with an exponential function, as shown in
Figure 4E,F for the green- and blue-sensitive cone responses, respectively. This fit provides a photoresponse turn-off rate constant. It is observed that the time constant increased with forskolin treatment in both the green- and blue-sensitive cones; that is, the rate of photoresponse turn-off slowed. This effect is significant compared to the control group, as shown in
Figure 4F,G, especially since the control group and/or the duration of the experiment conversely accelerate the photoresponse turn-off time constant.
We also analyzed how forskolin affected the integral parameter—the integration time of the non-saturated response, which depends on the main kinetic parameters of the response curve (see
Figure 4I,K). The analysis showed that, compared to the control, forskolin leads to a significant and pronounced increase in the integration time in both green- and blue-sensitive cones.
2.3. Forskolin Slows Down the Dominant Shut-Off Time Constant
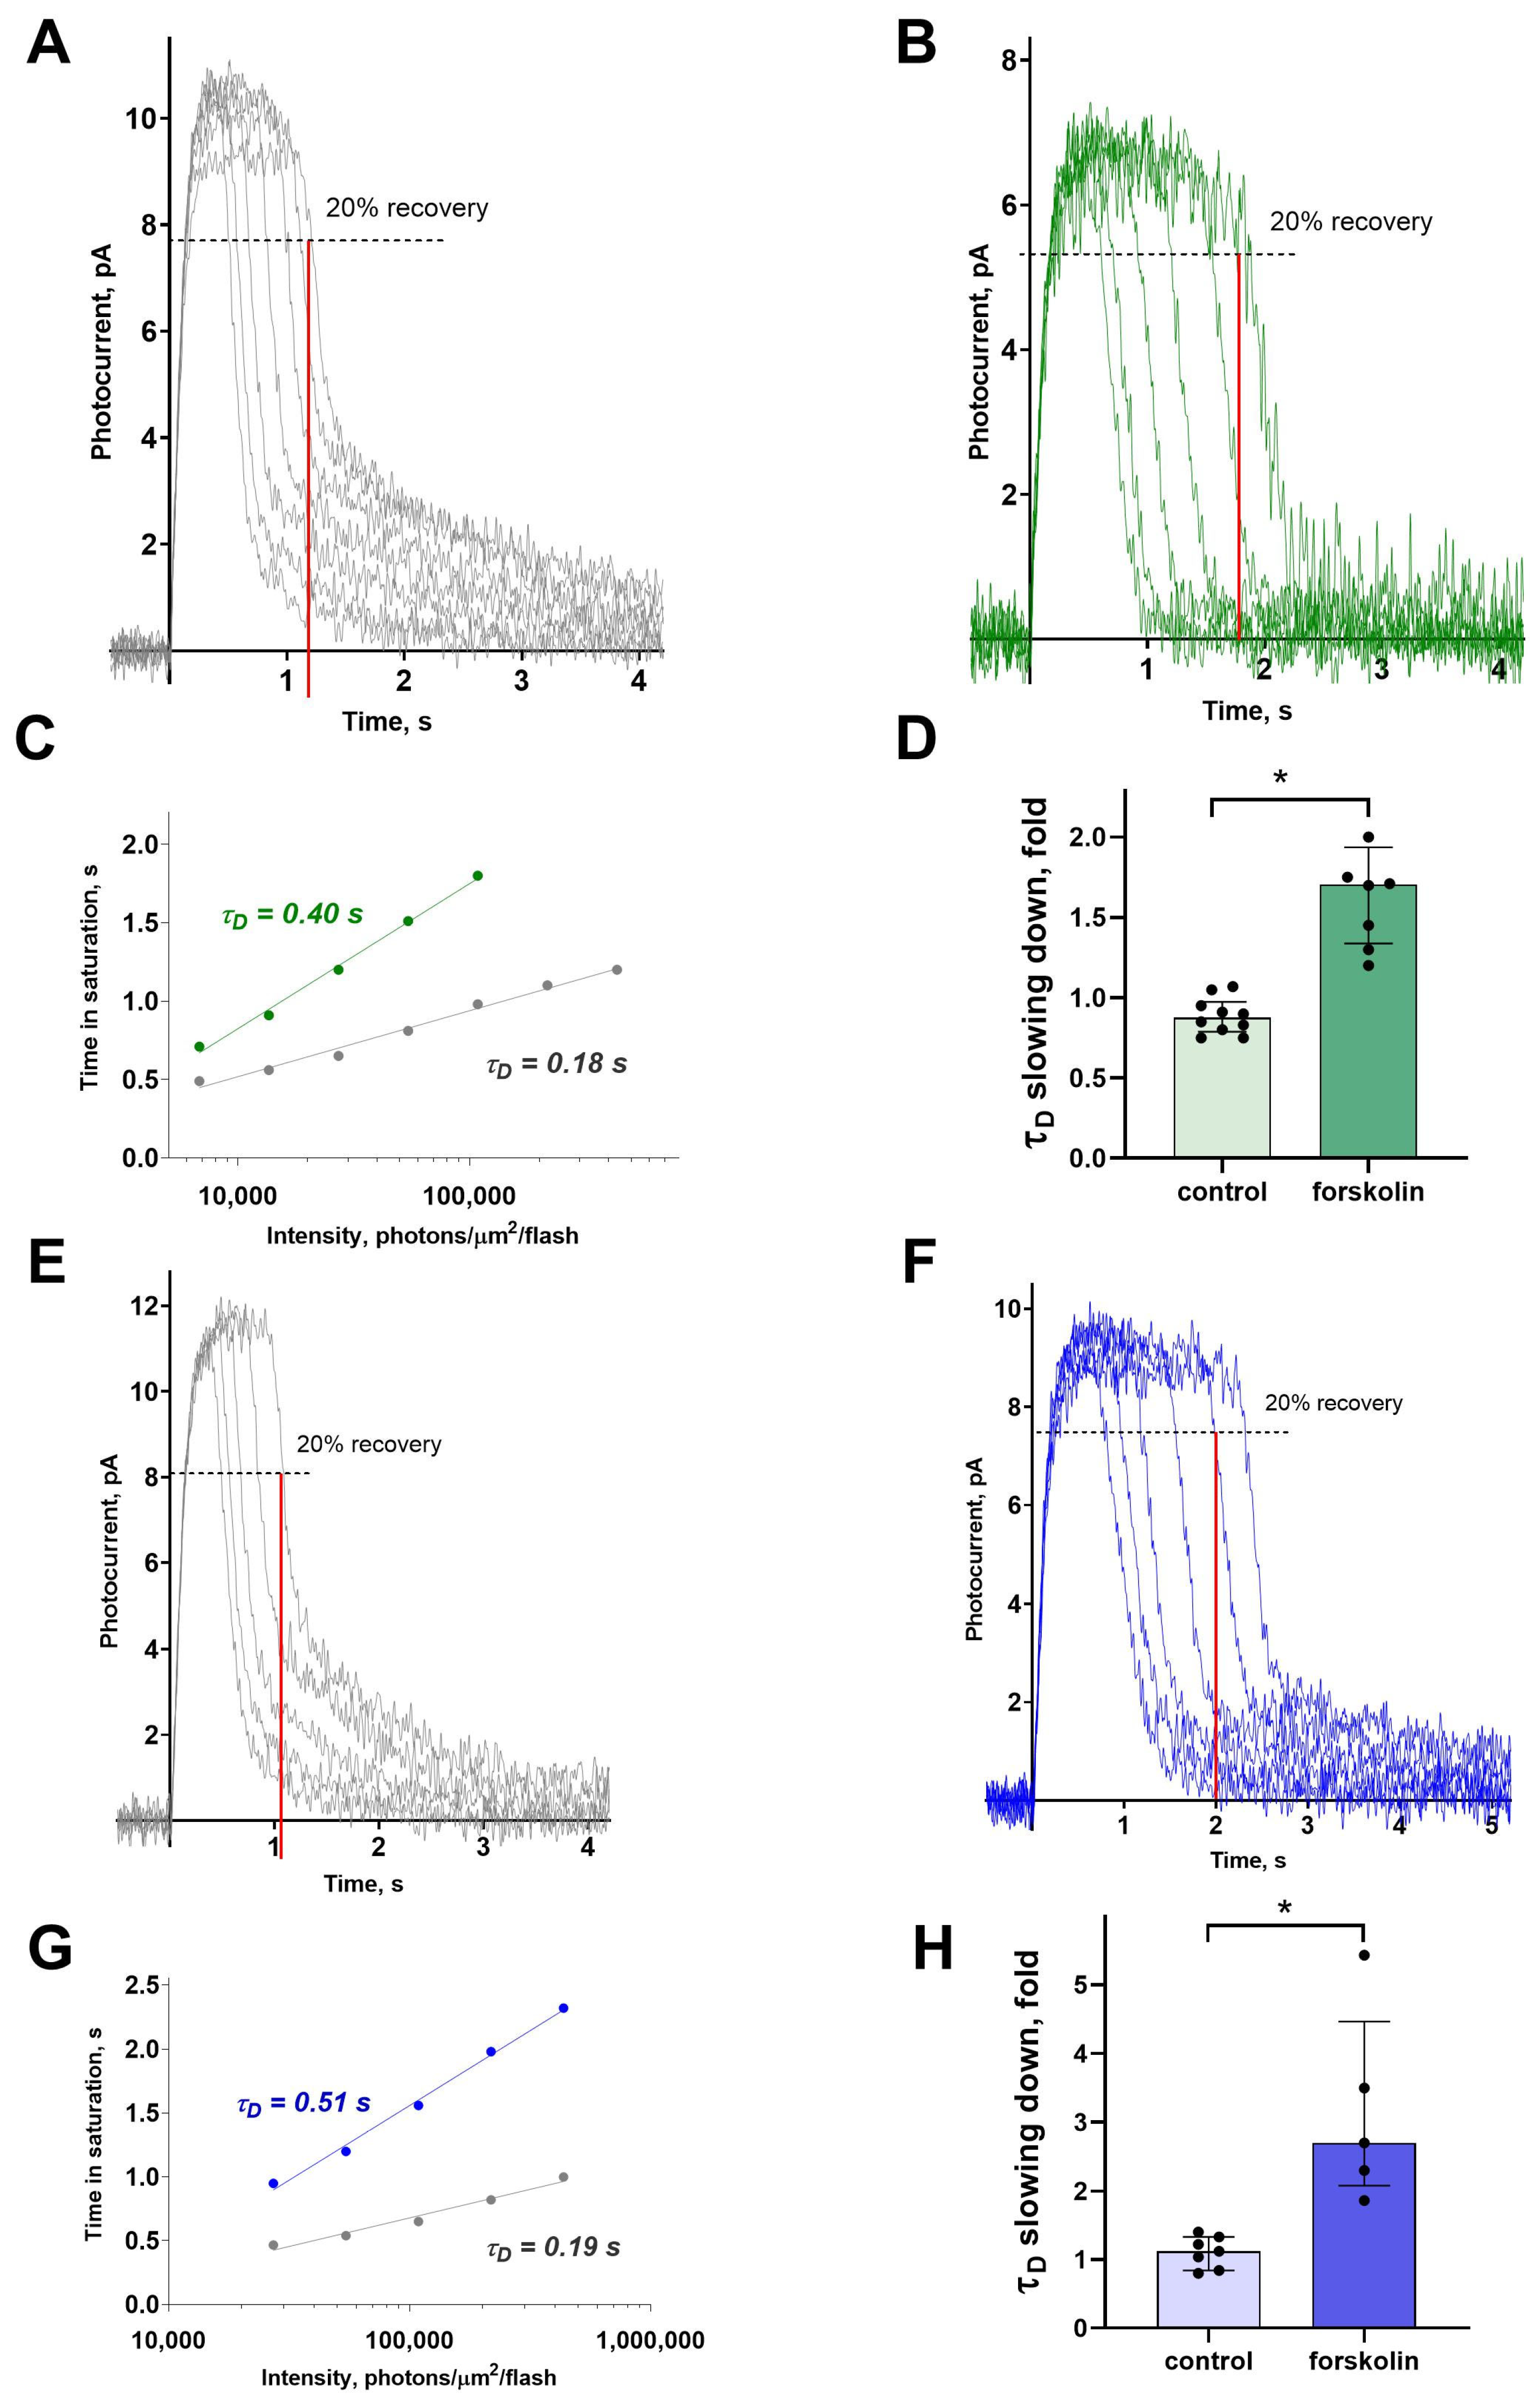
To estimate the impact of forskolin-induced cAMP elevation on the limiting recovery process, we recorded a series of photoresponses to saturating light stimuli of increasing intensities and analyzed the slope of the Pepperberg line, which represents the relation between time in saturation and flash intensity. This kind of analysis allows evaluation of the rate of the slowest inactivation process in the phototransduction cascade, characterized by the so-called dominant shut-off time constant, or τ
D [
32]. For plotting such dependence, the time in saturation is defined at the point where 20% of the dark current has recovered, as illustrated in
Figure 5A–D. The slope of the curve is determined on a logarithmic scale or from equation T
rec = C + τ
D ln [I], where I is intensity of the light stimulus and τ
D is the dominant shut-off time constant (See
Figure 5C,G).
Figure 5 illustrates representative examples of τ
D estimation for green- and blue-sensitive cones in normal Ringer’s solution and following forskolin exposure. The results indicate that forskolin markedly prolonged the time in saturation, steepened the slope of the Pepperberg line, and consequently increased τ
D in both green- and blue-sensitive cones. For both cone types, this effect was significant compared to the control groups (
Figure 5D,H).
2.4. Forskolin Has No Effect in a Dual Flash Paradigm in Isolated Green- and Blue-Sensitive Cones
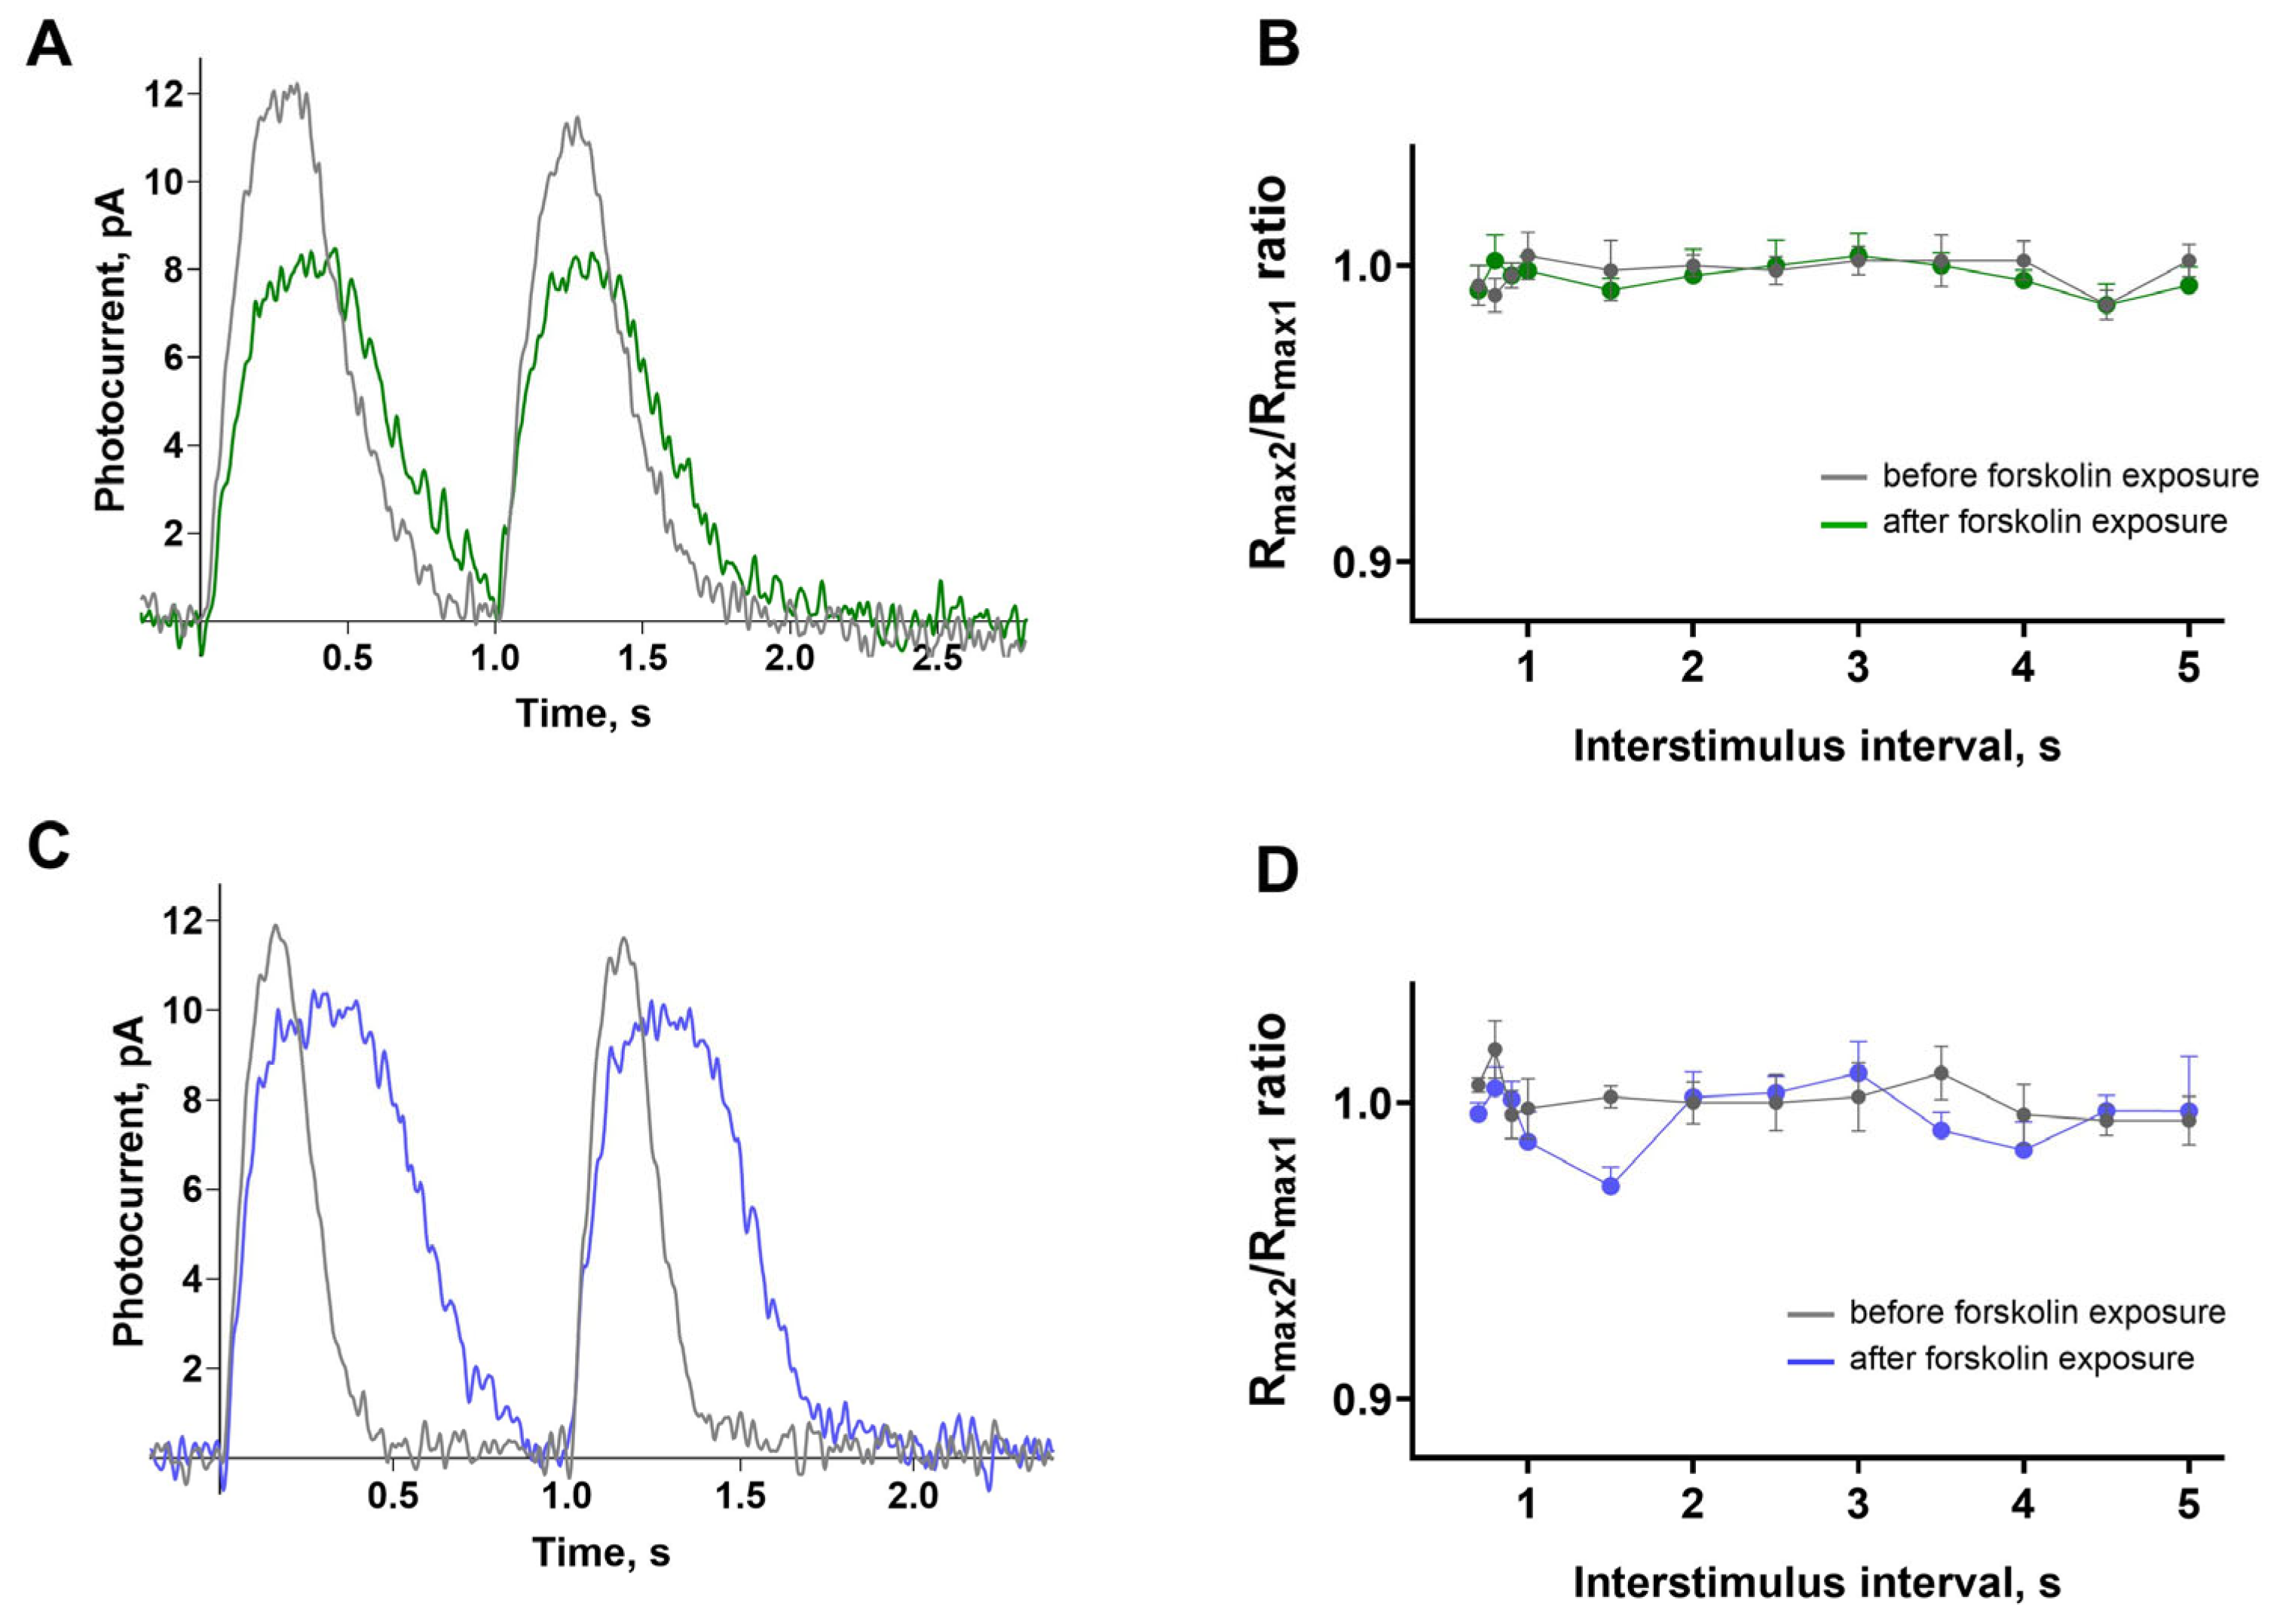
In a previous study by Chrispel et al., the effect of forskolin on the electroretinogram of the larval zebrafish retina was assessed, and the only significant effect found was in a dual flash paradigm [
24]. The authors gave two consecutive saturating flashes at intervals, ranging from 0.75 to 5 s, and observed that forskolin impaired the ability of the response amplitude to recover with the second flash. To determine whether this effect also occurred in isolated cones from adult zebrafish, we nearly replicated this protocol exactly: presenting identical saturating stimuli at intervals ranging from 0.7 to 5 s in Ringer’s solution, followed by approximately 20 min incubation in forskolin.
Figure 6A,C show examples of responses of the green- and blue-sensitive cones to two successive identical saturating stimuli with a 1 s interval. It is evident that the amplitude of the response to the second flash is practically unchanged.
Figure 6B,D illustrate the average ratios of the amplitudes of the responses to the second flash compared to those of the first flash. It is clear that within this range of the interstimulus interval (ISI), the response is completely restored, and forskolin has no effect. Thus, under our experimental conditions, the effect of forskolin reported by Chrispel et al. could not be observed.
2.5. The Regulatory Effects of Forskolin Are More Pronounced in Blue-Sensitive than in Green-Sensitive Cones
When we analyzed the effect of forskolin on the kinetic parameters of non-saturated responses and the dominant shut-off time constant from saturated responses, it seemed to us that, for most of the observed effects, the degree of expression was greater in blue-sensitive cones than in green-sensitive cones. In order to test this assumption more rigorously, we performed a direct statistical comparison of the mean changes in the photoresponse turn-off rate, integration time, and dominant shut-off time constant induced by forskolin (i.e., the ratios of each parameter after versus before forskolin treatment) for green- and blue-sensitive cones. We had previously verified that the mean changes in these parameters in the control groups did not show significant differences between green- and blue-sensitive cones. A direct comparison of the mean changes confirmed our assumption: the effects of forskolin on the turn-off rate, integration time of the unsaturated response, and dominant shut-off time constant of saturated responses were statistically significantly more pronounced in blue-sensitive cones. These comparisons between green- and blue-sensitive cones are shown in
Supplementary Material Figure S2.
In summary, the main observations from the results described in this section are as follows. Forskolin increases cAMP levels in the outer segments of the cones, making the green- and blue-sensitive cones more sensitive to light. This is accompanied by a slowdown in the rate of photoresponse turn-off and integration time, as well as an increase in the dominant shut-off time constant in responses to saturating stimuli. The activation rate of the phototransduction cascade is unaffected by forskolin. The listed effects in green- and blue-sensitive cones are in the same direction, but the effects themselves are stronger in blue-sensitive cones.
4. Materials and Methods
4.1. Experimental Animals and Ethics Statement
Adult zebrafish (Danio rerio) were obtained from a local supplier and housed in laboratory aquariums at a density of 4 to 6 fish per 15 L. The fish were fed dry fish food and kept under a controlled 12 h light and 12 h dark cycle. For this study, only adult fish, at least 6–8 months old, of both sexes were used. The fish were dark-adapted overnight prior to each experiment to avoid disrupting their usual day–night cycle. They were then euthanized by decapitation, after which the eyes were enucleated, and a piece of the retina was carefully extracted under dim red light using binocular magnification. The remaining retina and the second eyecup were stored in a light-proof chamber at 4 °C prior to use. Throughout the preparations and electrical recordings, the temperature in the experimental room was consistently maintained between 18 and 22 °C.
The handling of experimental animals complied with the requirements of European Directive 2010/63/EU and the recommendations of the Bioethics Committee of Sechenov Institute of Evolutionary Physiology and Biochemistry of the Russian Academy of Sciences (Permit#1-1/2024 of 31 January 2024, issued by the Bioethics Committee of IEPhB RAS).
4.2. Solutions and Specimen Preparation
Ringer solution, used for preparation, storage, and perfusion of samples, contained in mM: NaCl 102, KCl 2.6, MgCl2 1, glucose 5, CaCl2 1, NaHCO3 28, HEPES 5, and the pH was adjusted to 7.8–8.0. The forskolin-containing solution was prepared by diluting a fresh 10 mM stock solution in DMSO with Ringer’s solution to achieve a final concentration of 10 µM. All the chemicals were purchased from Sigma-Aldrich (St. Louis, MO, USA). A piece of the isolated retina was placed into a drop of Ringer’s solution, carefully shredded into small fragments using two fine forceps, and gently pipetted several times to isolate individual photoreceptors. Finally, the resulting suspension, consisting of retinal fragments and isolated photoreceptors, was carefully transferred into the perfusion chamber of the experimental setup for subsequent photoreceptor current recordings.
4.3. Single-Cell Current Recordings and Determining Cone Spectral Type
To record the photocurrent of isolated photoreceptors, we used Baylor’s original suction pipette technique [
27], which we have modified and adapted to our own needs [
2,
36]. As mentioned above, the zebrafish’s retina contains four morphologically and spectrally distinct types of cones, enabling the fish to detect light wavelengths ranging from UV to red. Our experimental setup allows us to identify three of them (blue-, green-, and red-sensitive cones) by rapidly changing the spectrum of the stimulating light. The light stimulation system of the setup consisted of two independent channels, each based on high-output LEDs. The intensity of both channels was regulated under computer control, adjusted stepwise by neutral density (ND) filters inserted into the beam and continuously by the LED output. The first channel was equipped with an LED emitting at λ
max = 525 nm (green), while the second channel featured switchable LEDs with λ
max = 460 nm, 525 nm, and 630 nm (blue, green, and red, respectively). The processes of data acquisition, stimulus timing, and flash intensity were precisely controlled using LabView16.0 hardware and software (National Instruments, Austin, TX, USA).
A reliable method for distinguishing spectral types of photoreceptors involves averaging their responses to non-saturating flashes of various colors, followed by a comparative analysis of their sensitivity. Using this approach, we were able not only to identify the spectral types of cones but also to determine the optimal wavelengths for light stimulation. We revealed that both green-sensitive and blue-sensitive cones are more responsive to blue light LED in our setup (λ
max = 460 nm) (see
Figure 1D,E). Therefore, to stimulate green- and blue-sensitive cones, we used blue light LED. Regarding the duration of the test flashes, we typically used 2 ms flashes to record non-saturated responses. However, when recording saturated responses, particularly supersaturated responses for Pepperberg’s analysis, we gradually increased the flash duration to enhance the overall stimulus luminance (using durations of 4, 8, 16, 32, and 128 ms). For all analyses and in the figure captures, we used the resulting stimulus intensities adjusted for stimulus duration.
4.4. Experimental Protocol, Data Processing, and Statistical Analysis
Zebrafish cones were individually sucked into a glass pipette, with their outer segments facing inward, and their responses were recorded under various light conditions. For each cell, responses were initially recorded in Ringer’s solution, and then recorded again 25 min after replacing the Ringer’s solution with 10 µM forskolin. In control experiments, 0.1% DMSO solution was used as a vehicle control in place of forskolin.
A typical light stimulation protocol started by recording responses to non-saturating light stimuli across various wavelengths to identify the spectral type of each cone. Once the spectral type of each cone had been determined, it was stimulated with light flashes (of blue light) that elicited both saturated and fractional responses, the latter being approximately half-saturated. Some cones were exposed to a series of saturating light flashes with gradually increasing intensities, and their responses were recorded to perform the Pepperberg analysis [
32]. A dual flash protocol, similar to that described in [
24], was applied to other cones to analyze their responses to successive saturating flashes delivered at specified time intervals. All photoresponses of cones were recorded with a 30 Hz low-pass filter and digitized at 2 ms intervals.
Data acquired from the setup were processed using custom software developed in LabVIEW 16.0 and Python 3.8. To assess potential changes in the response characteristics of cones, we examined the following parameters: the dark current, sensitivity, activation rate, turn-off time constant for non-saturating response, and dominant shut-off time constant, τD (Pepperberg constant).
The sample size (n) represents the number of individual cones analyzed. For each experimental group, including controls, sample sizes ranged from 8 to 10, consistent with standard practice in our research area. From each retina of a single eye, we prepared one or two specimens for suction pipette recordings. As a result, some experiments allowed recording from up to four cells per fish. However, frequently, some cells did not survive the entire experimental protocol and were excluded from the analysis. In total, data for each group were collected from at least three zebrafish, typically four to five. Control and forskolin experiments were performed in an alternating manner, with animals randomly assigned to groups to ensure unbiased distribution.
Statistical analyses were carried out using OriginPro 2021 software. To evaluate the significance of differences between groups, the unpaired t-test or the Mann–Whitney U test was applied. A p-value threshold of 0.05 was used to determine statistical significance. The results represent the ratio of the measured parameters following a 20 min incubation of cones in either a forskolin-containing solution or, for the control, a 0.1% DMSO solution, compared to those obtained in normal Ringer’s solution. We used Cohen’s d to determine the effect sizes of the measurements, where a value of d = 0.20 corresponds to a small effect, d = 0.50 to a medium effect, and d = 0.80 to a large effect, following conventional benchmarks in statistical analysis.
