Abstract
Chronic kidney disease (CKD) is a heterogeneous condition with various etiologies, including type 2 diabetes mellitus (T2D), hypertension, and autoimmune disorders. Both diabetic CKD (CKD_T2D) and non-diabetic CKD (CKD_nonT2D) share overlapping clinical features, but understanding the molecular mechanisms underlying each subtype and distinguishing diabetic from non-diabetic forms remain poorly defined. To identify differentially expressed genes (DEGs) and enriched biological pathways between CKD_T2D and CKD_nonT2D cohorts, including autoimmune (CKD_nonT2D_AI) and hypertensive (CKD_nonT2D_HT) subtypes, through integrative transcriptomic analysis. Publicly available gene expression datasets from human glomerular and tubulointerstitial kidney tissues were curated and analyzed from GEO and ArrayExpress. Differential expression analysis and Gene Set Enrichment Analysis (GSEA) were conducted to assess cohort-specific molecular signatures. A considerable overlap in DEGs was observed between CKD_T2D and CKD_nonT2D, with CKD_T2D exhibiting more extensive gene expression changes. Hypertensive-CKD shared greater transcriptomic similarity with CKD_T2D than autoimmune-CKD. Key DEGs involved in fibrosis, inflammation, and complement activation—including Tgfb1, Timp1, Cxcl6, and C1qa/B—were differentially regulated in diabetic samples, where GSEA revealed immune pathway enrichment in glomeruli and metabolic pathway enrichment in tubulointerstitium. The transcriptomic landscape of CKD_T2D reveals stronger immune and metabolic dysregulation compared to non-diabetic CKD. These findings suggest divergent pathological mechanisms and support the need for tailored therapeutic approaches.
1. Introduction
Chronic kidney disease (CKD) represents a global health burden, affecting more than 10% of the population worldwide [1]. It is a progressive disorder and a major contributor to morbidity and mortality, which contributes to accelerated aging and all-cause and mainly cardiovascular premature death [2,3]. CKD is a complex syndrome that encompasses and reflects the activation of numerous pathophysiological pathways that are in many cases common, regardless of their etiology. Both genomic and environmental factors contribute to this complex heterogeneous disease [4]. CKD heritability is estimated to be high (30–75%) [5,6], and there is a strong association between an individual’s genetic make-up and their predisposition to develop nephropathy. For example, it has been shown that up to 35% of the patients with diabetes develop nephropathy, irrespective of glycemic control [7]. Genome-wide association studies (GWAS) and GWAS meta-analyses have proposed several genetic loci associated with CKD [8,9]. However, these genetic markers do not account for all the susceptibility to CKD, and the causal pathways remain incompletely understood. Among the various etiologies, type 2 diabetes mellitus (T2D) is the leading cause of CKD, with diabetic nephropathy accounting for a substantial proportion of patients progressing to end-stage renal disease. Nevertheless, CKD also arises in non-diabetic settings, often driven by hypertension or autoimmune glomerulopathies, and regardless of overlapping clinical outcomes, the pathophysiological mechanisms driving diabetic and non-diabetic CKD may diverge significantly.
Despite their clinical relevance, comparative molecular profiling between diabetic and non-diabetic CKD forms has remained limited. Integrating high-throughput gene expression and transcriptomics analysis facilitates a better understanding of disease mechanisms by revealing changes in gene expression across tissues. However, few studies have comprehensively contrasted the molecular landscapes of CKD_T2D and CKD_nonT2D—including its autoimmune and hypertensive subtypes—at the level of individual genes and biological pathways.
This study aims to bridge that gap by integrating and analyzing publicly available transcriptomic datasets of kidney tissues, focusing on glomeruli and tubulointerstitium, to elucidate shared and distinct molecular signatures between CKD_T2D and CKD_nonT2D. Through differential expression analysis (DEGs) and gene set enrichment (GSEA), we provide insights into tissue-specific processes underpinning disease progression and uncover potential molecular targets for precision medicine in CKD.
2. Results
2.1. Dataset Compilation and Selection
From an initial pool of 174 datasets retrieved from GEO (n = 95) and ArrayExpress (n = 79), 30 met the inclusion criteria (GEO (n = 18) and ArrayExpress (n = 12)) (Figure 1). After removing duplicates, 20 datasets were included. Of these, only experiments containing both cohorts of interest (CKD_nonT2D and CKD_T2D), as well as healthy controls, were prioritized in front of studies containing only one of the two conditions of interest (CKD_T2D or CKD_nonT2D, either autoimmune or hypertensive), obtaining two relevant datasets, GSE104954 (tubulointerstitium) and GSE104948 (glomeruli). Samples of the two relevant datasets clustered according to tissue, as illustrated in Supplementary Figure S1. Figure 1A shows how the datasets were obtained and selected. For the other kidney datasets two (GSE175759 and GSE30529) contained healthy controls and a cohort of interest. GSE30529 was obtained following the same experimental procedure as the primary analysis datasets, microarray, while GSE175759 samples were analyzed through RNAseq. Therefore, only GSE30529 was used to validate the results obtained from the primary analysis.
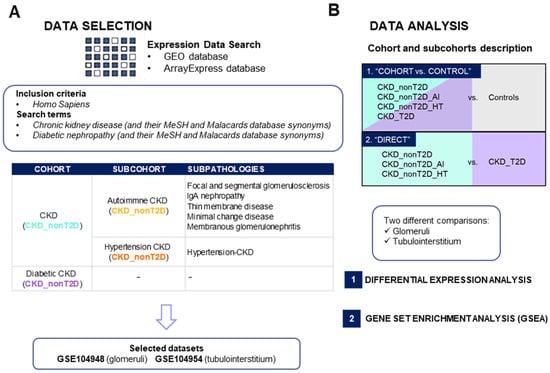
Figure 1.
Study summary of dataset selection (A) and gene expression analysis (B) in chronic kidney disease. AI: Autoimmune; CKD_T2D: chronic kidney disease cohort associated with type 2 diabetes mellitus; CKD_nonT2D: chronic kidney disease cohort not associated with type 2 diabetes; GEO: Gene Expression Omnibus; HT: hypertensive. To aid interpretation, different colors were used to distinguish study cohorts: ice blue for CKD_nonT2D, mauve for CKD_nonT2D, topaz for CKD_nonT2D, and tangerine for CKD_nonT2D.
2.2. Differential Expression Analysis Results
2.2.1. Chronic Kidney Disease Glomeruli and Tubulointerstitium Transcriptomic Profile Differences Between Cohorts
Differential expression analysis (DEA) was performed to identify differentially expressed genes (DEGs) between diabetic or non-diabetic CKD populations against controls and directly between CKD_T2D patients and those with CKD_nonT2D and its sub-cohorts, as schematized in Figure 1B. A complete list of the differentially expressed genes is shown in the Supplementary Material (Supplementary Table S1), which compiles all the information found for each gene during the analysis for the different comparisons performed. Log fold change (logFC) and Adj. p-value scores are provided for both the “CKD-cohort vs. control” and direct comparison “CKD_T2D vs. CKD_nonT2D” both in glomeruli and tubulointerstitium.
Both glomeruli and tubulointerstitium samples were analyzed independently. The results of this comparison were filtered according to the pre-established thresholds (adjusted p-value < 0.05; |logFC| > 0.5), with genes fulfilling these conditions being considered DEGs (Figure 2).
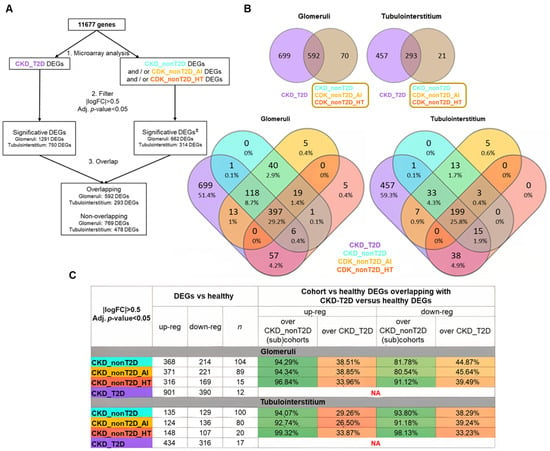
Figure 2.
DEGs from comparing cohorts/subcohorts against healthy control samples. (A) Description of the path followed during the analysis. (±) Significative DEGs must satisfy the filter for, at least, CKD_nonT2D or one of its subcohorts, but not for all of them. Overlapping DEGs are defined as those that show an overlap between CKD_T2D and CKD_nonT2D or any of its subcohorts. (B) Venn diagrams. CKD_nonT2D and CKD-T2D overlap for glomeruli and tubulointerstitium. (lower panels) CKD_nonT2D, CKD-T2D, CKD_nonT2D_AI, and CKD_nonT2D_HT overlap for glomeruli and tubulointerstitium. (C) Summary of the differential expression analysis in glomeruli and tubulointerstitium and the proportion of DEGs in common between diabetic and non-diabetic cohorts compared to healthy, n = number of samples. DEGs: differentially expressed genes; AI: Autoimmune; CKD_T2D: chronic kidney disease cohort associated with type 2 diabetes mellitus; CKD_nonT2D: chronic kidney disease cohort not associated with type 2 diabetes; HT: hypertensive. To aid interpretation, different colors were used to distinguish study cohorts: ice blue for CKD_nonT2D, mauve for CKD_nonT2D, topaz for CKD_nonT2D, and tangerine for CKD_nonT2D.
Subsequently, the DEGs against healthy control of the CKD_T2D cohort were compared with the significant DEGs of the CKD_nonT2D cohort and its subcohorts. Two categories of DEGs were established: (1) overlapping DEGs, as those that presented overlap between the CKD_T2D and CKD_nonT2D or any of its subcohorts; (2) non-overlapping DEGs, such as those DEGs that did not present overlap between those of CKD_T2D and those of CKD_nonT2D or any of its subcohorts. No DEGs were observed to be significantly increased in the CKD_T2D cohort and decreased in CKD_nonT2D, and vice versa: all the significant overlapping DEGs followed the same direction.
In order to ascertain the degree of similarity between cohorts, the proportion of DEGs in common between diabetic and non-diabetic cohorts compared to healthy ones was examined. Figure 2C summarizes these findings, and, for example, in glomeruli 347 increased DEGs are shared between CKD_NonT2D and CKD_T2D, representing 94.29% of all increased DEGs in CKD_NonT2D (368) and 38.51% of all increased DEGs in CKD_T2D (901). Both glomeruli and tubulointerstitium increased (or decreased) genes always represent more than 80% when comparing with non-diabetic cohorts; meanwhile, when comparing over the diabetic cohort, these genes represent 26.5–45.64%. Therefore, while the majority of the changes from the non-diabetic cohort are also present in the diabetic cohort, in this last cohort more than half of the DEGs are not present in the first cohort, suggesting that kidneys from the diabetic populations also have other changes not present in the non-diabetic cohort.
The GSE30529 dataset (containing 10 samples from CKD_T2D and 12 samples from living donors tubulointerstitium biopsies) was used to validate the results obtained in GSE104954 in the CKD-T2D versus control comparison. This analysis showed that 95% of DEGs in both studies maintain the same regulation trend, and only 5% show reverse trends (Supplementary Figure S2).
2.2.2. Similarities and Differences of Diabetic CKD Transcriptomic Profile with Non-Diabetic Cohort/Subcohorts
Comparisons were made between the non-diabetic cohort and its subcohorts and the diabetic cohort, as described in Figure 1B, to highlight differences between pathologies. DEGs identified with this strategy are referred to as “direct” DEGs and the results obtained are presented in Figure 3. The results showed no significant direct DEGs, in hypertension CKD compared with diabetic CKD. In contrast, most of the direct DEGs detected for the diabetic cohort coincide with those detected for the autoimmune CKD subcohort. The direct DEGs of autoimmune CKD and non-diabetic CKD were merged, constituting the “direct DEGs” group, which included 169 DEGs for glomeruli and 106 DEGs for tubulointerstitium.
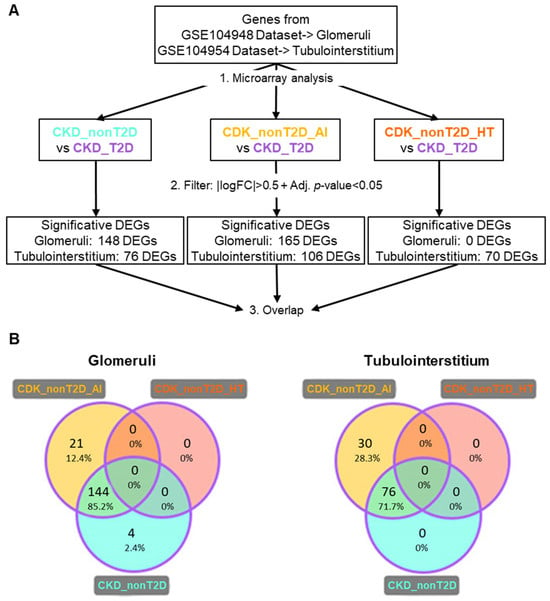
Figure 3.
DEGs from direct comparison between the CKD_T2D vs. CKD_nonT2D cohort/subcohorts. (A) Description of the path followed during the analysis. Overlapping DEGs are defined as those that show an overlap between CKD_T2D and CKD_nonT2D or any of its subcohorts. (B) Venn diagrams for the results of glomeruli and tubulointerstitium direct comparison with CKD_T2D (represented by purple edges). DEGs: Differentially expressed genes; CKD_T2D: chronic kidney disease cohort associated with type 2 diabetes mellitus; CKD-nonT2D: chronic kidney disease cohort not associated with type 2 diabetes; CKD_nonT2D_AI: autoimmune chronic kidney disease; CKD_nonT2D_HT: hypertension CKD. To aid interpretation, different colors were used to distinguish study cohorts: ice blue for CKD_nonT2D, mauve for CKD_nonT2D, topaz for CKD_nonT2D, and tangerine for CKD_nonT2D.
2.2.3. Expression Changes Across CKD Subtypes
In order to compare more in-depth the differences between CKD cohorts/subcohorts, we selected (A) those common DEGs in diabetic and non-diabetic patients in comparison to controls, overlapping in the two conditions (“overlapping DEGs”, see VENN diagram in Figure 2B) that were also direct DEGs (as defined in Section 2.2.2); and (B) those DEGs not shared by diabetic and non-diabetic patients in comparison to controls (“non-overlapping DEGs”, see VENN diagram in Figure 2B) that were also direct DEGs. In the latter group, we identified a small subset showing differential expression in both CKD_T2D and CKD_nonT2D patients relative to controls, but in opposite directions. These were defined as inverse DEGs. For example, a gene may be upregulated in CKD_T2D while being downregulated in CKD_nonT2D_HT or CKD_nonT2D_AI. Such inverse patterns may reflect divergent molecular responses related to disease etiology—such as metabolic stress in T2D versus immune or hemodynamic factors in autoimmune or hypertensive CKD. The identification of these genes may offer valuable insight into etiology-specific mechanisms and highlight potential biomarkers of disease divergence within the broader CKD spectrum.
The selection process described in (A) yielded 56 genes for glomeruli and 52 for tubulointerstitium (overlapping; direct DEGs), and selection B, 83 direct and 18 inverse genes for glomeruli, and 48 direct and 4 inverse genes for tubulointerstitium (non-overlapping; direct or inverse DEGs).
To better visualize changes of expression patterns of those selected DEGs, clustered heatmaps were generated (Figure 4 and Figure 5) and allowed identifying DEGs with consistent behavior in glomeruli and tubulointerstitium, highlighted in bold in the heatmaps.
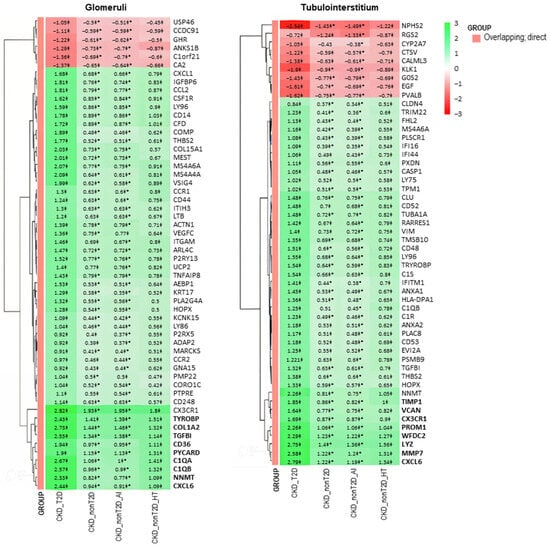
Figure 4.
Clustered heatmap of glomerular and tubulointerstitial overlapping genes between CKD and control samples. The heatmap displays logFC values from the “CKD cohort vs. control” comparison. The color scale ranges from red (downregulation) to green (upregulation). Values marked with a double cross (‡) are statistically significant in the “cohort vs. control” comparison (adjusted p-value < 0.05). Asterisks (*) denote values that are also significant in the direct comparison between CKD-T2D and CKD-nonT2D. Genes in bold belong to a cluster presenting a higher logFC change in CKD-T2D vs. controls. Hierarchical clustering was applied to both genes and samples. CKD_T2D: chronic kidney disease cohort associated with type 2 diabetes mellitus; CKD-nonT2D: chronic kidney disease cohort not associated with type 2 diabetes; CKD_nonT2D_AI: autoimmune chronic kidney disease; CKD_nonT2D_HT: hypertension CKD.
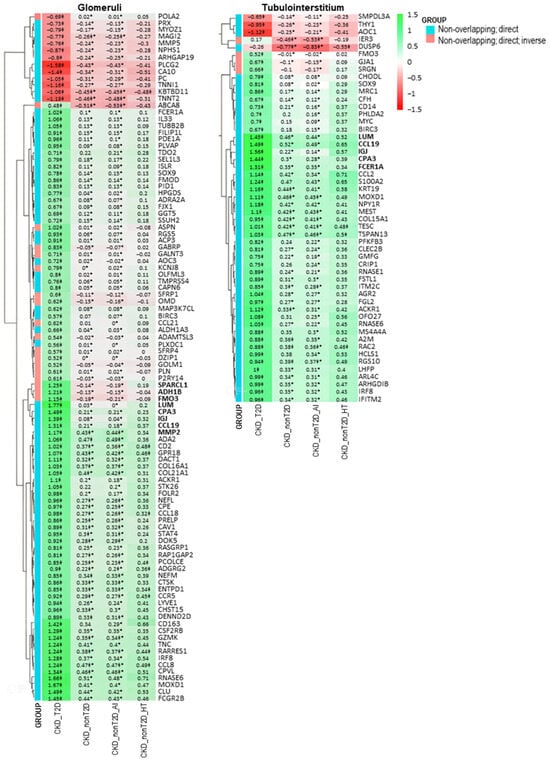
Figure 5.
Clustered heatmap of glomerular and tubulointerstitial non-overlapping genes identified in the direct comparison between CKD-T2D and CKD-nonT2D patients. The heatmap displays logFC values from this comparison. The color scale ranges from red (downregulation) to green (upregulation), indicating the direction and magnitude of gene expression change. Genes are classified into two categories (as shown in the GROUP legend): blue indicates “Non-overlapping: direct” genes (differentially expressed only in one population), while red indicates “Non-overlapping: direct; inverse” genes—i.e., genes that show opposite regulation direction between CKD-T2D and CKD-nonT2D when compared to controls. Values marked with a double cross (‡) are statistically significant in the “CKD cohort vs. control” comparison (adjusted p-value < 0.05). Asterisks (*) denote values that are statistically significant in the direct comparison (adjusted p-value < 0.05 and |logFC| > 0.5). Genes in bold belong to a cluster presenting a higher logFC change in CKD-T2D vs. controls. Hierarchical clustering was applied to both genes and samples.
These genes with consistent behaviors between the studied cohorts are shown in Figure 6. Specifically, overlapping and direct genes such as Cxcl6 and Nnmt and non-overlapping and direct genes such as Ccl19, Cpa3, Igj, and Lum are observed both in glomeruli and tubulointerstitium, reflecting common expression patterns. Furthermore, changes in gene expression in the CKD-T2D cohort are more pronounced than those in the overall CKD cohort, highlighting significant differences in the molecular response to type 2 diabetes within the context of the renal disease. On the other hand, hypertension-CKD shows greater similarity to CKD_T2D than autoimmune-CKD, indicating a possible pathological alignment between hypertension and diabetic complications in chronic kidney disease.
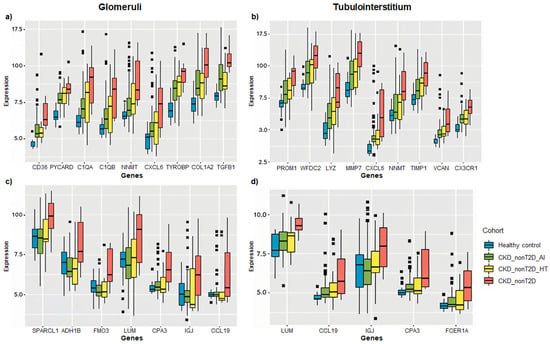
Figure 6.
Box plots showing the expression of selected DEGs across CKD subtypes relative to healthy controls. Genes were selected for their consistent behavior in both renal compartments (glomeruli and tubulointerstitium) and for presenting some of the highest log fold change (logFC) values across comparisons. Panels (a,b) display overlapping direct genes, while panels (c,d) present non-overlapping direct and inverse genes. Expression is represented as logFC values for each comparison between CKD subgroups (CKD_T2D, CKD_nonT2D_AI, CKD_nonT2D_HT) and controls. Panels a and c correspond to glomerular data, and panels b and d to tubulointerstitial data. Data were obtained from chip definition files of GSE104948 (glomeruli) and GSE104954 (tubulointerstitium).
2.3. Enriched Pathways in Chronic Kidney Diseases
A GSEA analysis was performed to explore biological differences between the cohorts. Thus, GSEA analysis was carried out based on the information obtained from the differential expression analysis for the biological interpretation of the results. Genes ranked by logFC were used as an input for each cohort/subcohort in order to obtain sets up or downregulated for each one of them. Only sets with an FDR q-value < 0.01 and a set size between 10 and 500 genes/proteins were selected. The results of these analyses are provided in a tissue-specific table (Supplementary Table S1), where all significant gene/protein sets that are over- or underexpressed are listed. A total of 13 gene sets were identified as significantly enriched in diabetic patients but not in the non-diabetic in glomeruli and 117 for tubulointerstitium. Only one gene set in glomeruli and none in tubulointerstitium were significantly enriched in non-diabetic patients and their subcohorts and not in diabetic ones. A total of 35 gene sets for glomeruli and 77 for tubulointerstitium were significantly enriched only in diabetic and hypertension cohorts. From these, the 20 gene sets with a lower FDR per comparison were represented in Figure 7 and Figure 8.
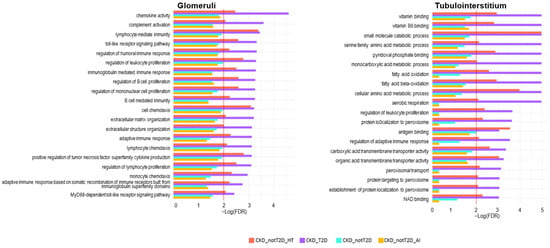
Figure 7.
Significantly enriched processes in CKD_T2D but not in CKD_nonT2D. The figure illustrates the results of gene set enrichment analysis (GSEA), depicting significantly enriched biological processes in glomerular and tubulointerstitial compartments across four CKD subtypes: hypertensive CKD (CKD_nonT2D_HT), diabetic CKD (CKD_T2D), overall non-diabetic CKD (CKD_nonT2D), and autoimmune CKD (CKD_nonT2D_AI). Bars represent enrichment significance as –log(FDR), with higher values indicating greater statistical significance. The red line shows the proportion of null hypotheses in the data.
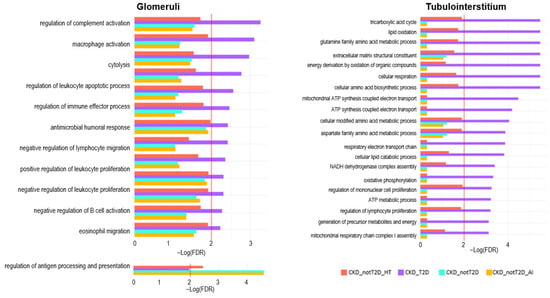
Figure 8.
Significantly enriched processes in CKD_T2D and hypertension-CKD in glomeruli and tubulointerstitium. Depicts the results of gene set enrichment analysis (GSEA) in the glomerular and tubulointerstitial compartments across CKD cohorts. The enrichment significance is represented as –log(FDR), with higher values indicating stronger enrichment. The red line shows the proportion of null hypotheses in the data.
In order to provide further insights on the implications of the results, these sets were classified into functional groups, according to a bibliographic review on kidney disease and T2D pathophysiology. Focusing on enriched processes in the CKD_T2D but not in the CKD_nonT2D cohorts and their subcohorts (Figure 7), we found that in general, glomeruli have more immune-mediated enriched processes and tubulointerstitium have more metabolism-associated enriched processes. In the glomerular compartment, enriched pathways were predominantly immune-related across all subtypes. Notably, diabetic CKD (purple) displayed the highest enrichment in processes such as regulation of complement activation, leukocyte apoptotic process, macrophage activation, and cytolysis, highlighting robust immune and inflammatory activity. This is consistent with the known role of complement and immune dysregulation in diabetic nephropathy. Interestingly, regulation of antigen processing and presentation was uniquely enriched in non-diabetic subtypes, especially autoimmune CKD, suggesting distinct immunological mechanisms in glomerular injury across etiologies. In contrast, the tubulointerstitial compartment revealed a predominance of metabolic processes. Diabetic CKD again showed the most significant enrichment in pathways related to mitochondrial function, including the TCA cycle, oxidative phosphorylation, NADH dehydrogenase complex assembly, and fatty acid oxidation, consistent with metabolic reprogramming. Non-diabetic subtypes, particularly autoimmune CKD, showed less enrichment in these pathways. Interestingly, extracellular matrix structural constituent were enriched in diabetic CKD, further supporting the fibrotic remodeling phenotype in the tubulointerstitium of these patients.
Focusing on processes enriched in diabetic CKD and also in hypertension-CKD (Figure 8), we found similar results as before, more immune-related in glomeruli, where terms such as chemokine activity, complement activation, lymphocyte-mediated immunity, and toll-like receptor signalling pathways are significantly enriched in CKD_T2D, indicating heightened innate and adaptive immune responses in the glomerular compartment of diabetic patients. In contrast, the tubulointerstitial compartment showed a stronger enrichment of metabolic and transport-related pathways. In particular, CKD_T2D exhibited activation of pathways involved in vitamin metabolism (e.g., vitamin B6 binding, pyridoxal phosphate binding), fatty acid oxidation, and mitochondrial/peroxisomal function (e.g., aerobic respiration, protein targeting/localization to peroxisomes, peroxisomal transport). Beyond general metabolic categories, some of these processes converge on well-defined regulatory axes such as PPAR signaling, which orchestrates lipid metabolism and mitochondrial β-oxidation, and mTOR signaling, a central pathway in nutrient sensing, cellular growth, and metabolic homeostasis. The enrichment of these pathways in CKD_T2D suggests a more profound metabolic remodeling in the tubulointerstitium under diabetic conditions, integrating both basal bioenergetic processes and higher-order regulatory responses, potentially contributing to disease-specific progression in a compartment-specific manner.
Altogether the GSEA analysis indicates a compartmentalized molecular pattern in CKD subtypes, with most of the pathophysiological changes in the glomeruli related to the overactivation of the immune system. In contrast, in the tubulointerstitium, metabolic changes may contribute to a greater extent to disease progression in CKD_T2D (and to some extent in CKD_nonT2D_HT) compared to CKD_nonT2D_AI.
3. Discussion
This integrative transcriptomic analysis provides a comparative landscape of gene expression alterations in CKD_T2D and CKD_nonT2D, revealing both overlapping and divergent molecular signatures across kidney tissues. While overall expression changes in CKD_T2D and CKD_nonT2D are similar when compared to healthy controls, several key differences emerged upon direct comparison between diabetic and nondiabetic samples. First, diabetic samples exhibited a broader set of DEGs and higher logFC values compared to non-diabetics, indicating a more extensive molecular disturbance in diabetic kidney disease, where roughly half of DEGs are not present in CKD_nonT2D, suggesting that kidneys from the diabetic populations also have other changes not present in the non-diabetic cohort. This suggests that hyperglycemia, its associated metabolic dysfunction, and chronic metabolic stress [10,11], together, potentiate transcriptomic changes beyond those observed in autoimmune or hypertensive CKD. Interestingly, our findings also highlight a notable similarity between CKD_T2D and CKD_nonT2D_HT, particularly in the enrichment of metabolic pathways in the tubulointerstitial compartment. This may reflect shared pathophysiological mechanisms between diabetic and hypertensive CKD. Both conditions are characterized by systemic and intrarenal endothelial dysfunction, leading to impaired vasodilation, capillary rarefaction, and altered glomerular hemodynamics [12]. Additionally, oxidative stress has been widely recognized as a common pathogenic denominator in T2D and hypertension, promoting mitochondrial dysfunction, chronic inflammation, and progressive fibrosis [13,14]. In this context, the observed activation of mitochondrial and peroxisomal pathways in both CKD_T2D and CKD_nonT2D_HT may reflect a shared compensatory response to heightened oxidative and metabolic stress. These similarities suggest that overlapping molecular responses—particularly in tubular compartments—might contribute to disease progression through converging mechanisms. This potential convergence suggests that therapeutic strategies targeting mitochondrial resilience, redox balance, or endothelial function may be beneficial in both CKD subtypes.
Within the non-diabetic CKD cohort, hypertensive and autoimmune etiologies presented distinct expression profiles. Interestingly, CKD_nonT2D_HT showed greater similarity to CKD_T2D than the autoimmune counterpart, consistent with clinical evidence linking systemic and intraglomerular hypertension to diabetic nephropathy. This may reflect shared activation of pathways such as the renin–angiotensin–aldosterone system (RAAS), a common driver of glomerular injury in both conditions [15,16]. We identified and highlighted a selection of genes with significant differential expression across tissues, particularly those that demonstrate the most pronounced quantitative shifts between disease cohorts and controls. These genes, whether overlapping or non-overlapping differentially expressed genes (DEGs) with respect to the control cohort, were clustered based on their tissue-specific or shared expression patterns. Their biological roles were further categorized into pathways related to extracellular matrix (ECM) remodeling, immune and inflammatory responses, diabetes-related alterations, complement system activation, apoptosis, and emerging molecular candidates of unclear function in CKD or T2D.
A substantial subset of DEGs was associated with ECM remodeling, a hallmark of chronic kidney disease (CKD) progression. In glomerular tissue, Tgfb1 was markedly upregulated in response to hyperglycemic stimuli [17], consistent with its known role in promoting type I collagen synthesis. This was corroborated by the concurrent overexpression of Col1a2, a principal ECM component, which underscores the fibrotic response initiated by elevated glucose levels [18]. Within the tubulointerstitial compartment, we observed increased expression of Timp1, a known inhibitor of metalloproteinases, alongside Vcan, which contributes to ECM-cell interactions and intercellular signaling [19]. Additional upregulated genes such as Wfdc2 and Mmp7 further support the notion of active ECM deposition in this compartment [20,21]. Notably, Cxcl6, Ccl19, and Lum were found to be upregulated in both glomeruli and tubulointerstitium, suggesting a shared fibrotic axis [22,23]. These genes are functionally linked to TGF-β1 signaling and likely key mediators in fibrosis development. Interestingly, Nnmt, which also appeared in both tissues, may represent a compensatory anti-fibrotic mechanism [24], as previously proposed.
Beyond fibrotic remodeling, a number of DEGs were implicated in immune regulation and inflammatory signaling. Within the glomeruli, Tyrobp emerged as a prominent gene, previously associated with immune function and autoimmune CKD, based on reanalysis of public datasets (GSE93798, GSE37460) [25]. In the tubulointerstitial tissue, Cx3cr1 was notably enriched, consistent with its roles in immune surveillance, leukocyte adhesion, and chemotaxis [26]. Cxcl6 and Ccl19, beyond their involvement in ECM remodeling, also possess proinflammatory properties [27,28] and were differentially expressed in both compartments, reflecting the complex interplay between inflammation and fibrosis.
We also identified DEGs with established links to diabetes-related processes. In the glomeruli, the Adh1b gene has been found to be overexpressed in human perirenal adipose tissue-derived mesenchymal stem cells [29]. This is the first report demonstrating that Adh1b is also upregulated in glomeruli, indicating a direct association with insulin resistance and suggesting that metabolic stress may directly influence glomerular gene expression profiles. Conversely, in the tubulointerstitial region, Lyz was found to be upregulated. A previous study using in vitro HK-2 cells showed that human recombinant Lyz downregulates interleukin-6 (IL-6) production induced by advanced glycation end products (AGEs). This effect may represent a protective mechanism that counteracts AGE-induced inflammation [30].
A pronounced overactivation of the complement system was observed predominantly in glomerular tissue. Genes such as C1qa and C1qb [31] were significantly overexpressed in diabetic CKD compared to non-diabetic CKD, displaying notable log fold change (logFC < −1.6). Igj, another complement-associated gene, was also detected in both compartments, underscoring a systemic activation of this pathway, particularly in the diabetic context.
Interestingly, genes typically associated with tubular apoptosis were differentially expressed in the glomerular compartment. Cd36, known to mediate AGE-BSA-induced apoptosis [32], and Pycard (also known as Asc), a key inflammasome component [33], were both upregulated, suggesting possible cross-talk between glomerular and tubular compartments. Pycard also connects mechanistically to SGLT2 pathways; in fact, dual DPP4- and SGLT2-inhibitor therapies have been shown to suppress NLRP3/ASC inflammasome activation [34]. As inflammasome activation is closely tied to endoplasmic reticulum (ER) stress, and ER stress is a known driver of tubular apoptosis [35,36], this observation may highlight an underappreciated axis of intercompartmental communication in CKD pathogenesis.
Lastly, we identified a set of genes whose roles in CKD or T2D have not yet been fully characterized, although preliminary data suggest potential involvement. These include Sparcl1 and Fmo3 in glomeruli, Prom1 and Fcer1a in the tubulointerstitium, and Cpa3, which was upregulated in both tissues. The functions of these genes remain to be elucidated but may represent novel biomarkers or therapeutic targets [37].
In summary, the DEGs expressed in both glomerular and tubulointerstitial tissues largely converge on fibrotic and proinflammatory pathways, with TGF-β1-mediated ECM remodeling and inflammation representing core mechanisms. This aligns with current knowledge that positions diabetes as a driver of chronic inflammation and fibrosis, ultimately exacerbating renal damage [38].
Our findings underscore the value of comparative transcriptomics in unraveling the shared and tissue-specific molecular landscapes underpinning diabetic and non-diabetic CKD. A key strength of this study is the use of kidney tissue datasets, which allow for more accurate cohort classification and mitigate potential misclassification bias common in population-based studies without histological confirmation.
Gene set enrichment analysis (GSEA) further complemented these transcriptomic findings by elucidating the broader functional implications of gene expression changes across tissues and disease subtypes. When comparing CKD and CKD-T2D cohorts to controls, both displayed a similar landscape of altered biological processes, emphasizing common pathological mechanisms driving renal dysfunction. However, direct comparison between CKD and CKD-T2D revealed more pronounced transcriptional divergence in the tubulointerstitial compartment than in the glomeruli, suggesting that tubulointerstitial tissue may serve as a more sensitive indicator of diabetes-specific molecular alterations [39].
In terms of enriched biological functions, consistent with individual gene-level findings, processes related to ECM remodeling and immune system activation were markedly enriched in CKD-T2D relative to CKD across both renal compartments. Complement activation remained a glomerulus-specific hallmark, reflecting its strong association with immune complex-mediated damage in this region. Interestingly, metabolic disturbances—including those associated with metabolic acidosis, lipid remodeling, and dyslipidemia—were found to be uniquely enriched in the tubulointerstitium of CKD-T2D patients. While prior studies have implicated these pathways in both diabetic and non-diabetic CKD [40,41,42,43], our data suggest a higher prevalence or intensity of these alterations in the diabetic context, particularly in the tubular environment. These findings emphasize the multifaceted impact of diabetes on renal physiology, extending beyond fibrosis and inflammation to include significant metabolic reprogramming, especially at the level of the tubulointerstitium.
4. Materials and Methods
4.1. Data Selection
4.1.1. Databases Used and Search Strategies
High-throughput data compilation was carried out in two different database repositories, Gene Expression Omnibus (GEO) [44] and ArrayExpress [45]. In both databases, a search for gene expression data was performed for the medical condition “chronic kidney disease” (including its MeSH and Malacards synonyms). In addition, the same search strategy was used for ‘diabetic nephropathy,’ incorporating the term of this medical condition along with its MeSH and Malacards database synonyms. Searches were also restricted for Homo sapiens (organism).
4.1.2. Inclusion and Exclusion Criteria
For this study, only Homo sapiens gene expression data obtained using high-precision techniques such as array expression profiling and high-throughput sequencing were included. Single-cell RNA-seq studies were excluded due to their non-comparable results with the mRNAseq technique. Studies that analyzed renal transplant samples and cases of autosomal dominant or autosomal recessive polycystic kidney disease, lupus nephritis, or antineutrophil cytoplasmic antibody (ANCA)-associated vasculitis were also excluded. Additionally, studies with a sample size for any cohorts of interest less than ten were discarded. Finally, an exhaustive review of the scientific literature associated with the included studies was carried out.
4.1.3. Description and Selections of the Cohorts
This study established various cohorts and subcohorts based on the etiology of chronic kidney disease: CKD cohort associated with type 2 diabetes (CKD_T2D) and the non-diabetic associated (CKD_nonT2D), which was further divided into the autoimmune subcohort (Autoimmune CKD, hereafter defined as CKD_nonT2D_AI), which includes subpathologies, such as focal and segmental glomerulosclerosis, IgA nephropathy, thin membrane disease, minimal change disease, and membranous glomerulonephritis, and the hypertensive CKD subcohort (Hypertension CKD, hereafter defined as CKD_nonT2D_HT). The datasets were selected based on the specific tissues found in the kidneys (glomerulus and/or tubuli). More information will be found in Supplementary Methods.
4.2. Data Treatment and Analysis
Raw gene expression data were quantile normalized and batch-corrected using the COMBAT method [46]. Differential expression analyses were carried out using the Limma package from R version 3.46.0 (R Foundation for Statistical Computing, Vienna, Austria). For identifying differentially expressed genes, thresholds of Adj. p-value < 0.05 and an absolute log fold change (|logFC|) > 0.5 were established. The Benjamini–Hochberg approach was used as a multi-test correction for each database [47]. Gene Set Enrichment Analysis (GSEAs) was performed using the list of differentially expressed genes/proteins ranked by their logFC. The number of permutations in the GSEA was set to 1000. The GO_BIOLOGICAL_PROCESS and GO_MOLECULAR_FUNCTION databases [48] were used for the analysis. The Benjamini–Hochberg approach was used as a multi-test correction for each database, and a False Discovery Rate (FDR) q-value < 0.01 was considered significant. Moreover, only gene/protein sets with a set size between 10 and 500 genes/proteins were selected in order to discard unspecific or too general results [49].
5. Conclusions
In conclusion, our findings provide a comprehensive transcriptomic overview of diabetic and non-diabetic CKD, highlighting both shared and distinct molecular pathways across renal compartments. Diabetic CKD exhibited a broader spectrum of transcriptomic alterations, particularly in the tubulointerstitial compartment, where metabolic and fibrotic processes were strongly enriched. In contrast, immune-related changes predominated in glomeruli, especially via complement activation. The comparative analysis also revealed that hypertensive CKD shares greater molecular resemblance with diabetic CKD than the autoimmune subtype. These results support the hypothesis that diabetes triggers a multifactorial and compartment-specific molecular response that amplifies inflammation, fibrosis, and metabolic stress. Ultimately, our study underscores the utility of transcriptomic profiling to dissect the complex pathogenesis of CKD and advocate for precision medicine strategies tailored to disease etiology and tissue-specific mechanisms.
Supplementary Materials
The following supporting information can be downloaded at: https://www.mdpi.com/article/10.3390/ijms26157421/s1. Reference [50] is cited in the Supplementary Materials.
Author Contributions
Conceptualization, C.B., M.C. and M.R.; methodology, M.R., C.M. and J.P.; validation, E.R., E.M. and A.B.; formal analysis, C.B.; investigation, M.R. and C.B.; data curation, C.B., J.d.R., M.P., J.H. and A.G.; writing—original draft preparation, C.B. and M.C.; writing—review and editing, M.R., E.R., E.M. and A.B.; supervision, C.B. and M.C.; project administration, M.R.; funding acquisition, C.B. and M.C. All authors have read and agreed to the published version of the manuscript.
Funding
This study was funded by AstraZeneca Spain; by Instituto de Salud Carlos III (ISCIII) co-funded by the European Union (PI22/00006); and by the ISCIII RICORS program to RICORS2040-Renal (RD24/0004/0003), funded by Instituto de Salud Carlos III and co-funded by the European Union—NextGenerationEU.
Institutional Review Board Statement
Not applicable.
Informed Consent Statement
Not applicable.
Data Availability Statement
The original contributions presented in this study are included in the article. Further inquiries can be directed to the corresponding authors.
Acknowledgments
The authors thank Anaxomics Biotech S.L. for its contribution in cutting-edge systems biology and artificial intelligence (machine learning).
Conflicts of Interest
The authors declare no conflict of interest.
Abbreviations
The following abbreviations are used in this manuscript:
| AGEs | advanced glycation end-products |
| AI | autoimmune |
| ANCA | anti-neutrophil cytoplasm antibodies |
| BSA | bovine serum albumin |
| CKD | chronic kidney disease |
| DEGs | differentially expressed genes |
| DPP4 | dipeptidyl peptidase 4 |
| ECM | extracellular matrix |
| FDR | false discovery rate |
| GEO | gene expression omnibus |
| GSEA | gene set enrichment analysis |
| GWAS | genome-wide association studies |
| HT | hypertensive |
| logFC | log fold change |
| NADH | nicotinamide adenine dinucleotide |
| SGLT2 | sodium–glucose cotransporter 2 |
| T2D | type 2 diabetes mellitus |
| TCA | tricarboxylic acid |
References
- Stevens, P.E.; Ahmed, S.B.; Carrero, J.J.; Foster, B.; Francis, A.; Hall, R.K.; Herrington, W.G.; Hill, G.; Inker, L.A.; Kazancıoğlu, R.; et al. KDIGO 2024 Clinical Practice Guideline for the Evaluation and Management of Chronic Kidney Disease. Kidney Int. 2024, 105, S117–S314. [Google Scholar] [CrossRef]
- Hallan, S.I.; Matsushita, K.; Sang, Y.; Mahmoodi, B.K.; Black, C.; Ishani, A.; Kleefstra, N.; Naimark, D.; Roderick, P.; Tonelli, M.; et al. Age and Association of Kidney Measures with Mortality and End-Stage Renal Disease. JAMA 2012, 308, 2349–2360. [Google Scholar] [CrossRef]
- Ortiz, A.; Covic, A.; Fliser, D.; Fouque, D.; Goldsmith, D.; Kanbay, M.; Mallamaci, F.; Massy, Z.A.; Rossignol, P.; Vanholder, R.; et al. Epidemiology, Contributors to, and Clinical Trials of Mortality Risk in Chronic Kidney Failure. Lancet 2014, 383, 1831–1843. [Google Scholar] [CrossRef]
- Obrador, G.T.; Schultheiss, U.T.; Kretzler, M.; Langham, R.G.; Nangaku, M.; Pecoits-Filho, R.; Pollock, C.; Rossert, J.; Correa-Rotter, R.; Stenvinkel, P.; et al. Genetic and Environmental Risk Factors for Chronic Kidney Disease. Kidney Int. Suppl. 2017, 7, 88–106. [Google Scholar] [CrossRef]
- Satko, S.G.; Freedman, B.I. The Familial Clustering of Renal Disease and Related Phenotypes. Med. Clin. N. Am. 2005, 89, 447–456. [Google Scholar] [CrossRef] [PubMed]
- Cañadas-Garre, M.; Anderson, K.; Cappa, R.; Skelly, R.; Smyth, L.J.; McKnight, A.J.; Maxwell, A.P. Genetic Susceptibility to Chronic Kidney Disease—Some More Pieces for the Heritability Puzzle. Front. Genet. 2019, 10, 453. [Google Scholar] [CrossRef] [PubMed]
- Andersen, A.R.; Christiansen, J.S.; Andersen, J.K.; Kreiner, S.; Deckert, T. Diabetic Nephropathy in Type 1 (Insulin-Dependent) Diabetes: An Epidemiological Study. Diabetologia 1983, 25, 496–501. [Google Scholar] [CrossRef] [PubMed]
- O’Seaghdha, C.M.; Fox, C.S. Genome-Wide Association Studies of Chronic Kidney Disease: What Have We Learned? Nat. Rev. Nephrol. 2011, 8, 89–99. [Google Scholar] [CrossRef]
- Regele, F.; Jelencsics, K.; Shiffman, D.; Paré, G.; McQueen, M.J.; Mann, J.F.E.; Oberbauer, R. Genome-Wide Studies to Identify Risk Factors for Kidney Disease with a Focus on Patients with Diabetes. Nephrol. Dial. Transpl. 2015, 30 (Suppl. S4), iv26–iv34. [Google Scholar] [CrossRef]
- Giri, B.; Dey, S.; Das, T.; Sarkar, M.; Banerjee, J.; Dash, S.K. Chronic Hyperglycemia Mediated Physiological Alteration and Metabolic Distortion Leads to Organ Dysfunction, Infection, Cancer Progression and Other Pathophysiological Consequences: An Update on Glucose Toxicity. Biomed. Pharmacother. 2018, 107, 306–328. [Google Scholar] [CrossRef]
- Islam, S.; Moinuddin; Mir, A.R.; Arfat, M.Y.; Alam, K.; Ali, A. Studies on Glycoxidatively Modified Human IgG: Implications in Immuno-Pathology of Type 2 Diabetes Mellitus. Int. J. Biol. Macromol. 2017, 104, 19–29. [Google Scholar] [CrossRef]
- Düsing, P.; Zietzer, A.; Goody, P.R.; Hosen, M.R.; Kurts, C.; Nickenig, G.; Jansen, F. Vascular Pathologies in Chronic Kidney Disease: Pathophysiological Mechanisms and Novel Therapeutic Approaches. J. Mol. Med. 2021, 99, 335–348. [Google Scholar] [CrossRef] [PubMed]
- Chen, L.; Bai, H.; Jin, H.; Zhang, T.; Shi, B.; Cai, M.; Wang, Y. Outcomes in Kidney Transplantation with Mycophenolate Mofetil-Based Maintenance Immunosuppression in China: A Large-Sample Retrospective Analysis of a National Database. Transpl. Int. 2020, 33, 718–728. [Google Scholar] [CrossRef] [PubMed]
- Li, Y.; Yuan, F.; Wu, T.; Lu, L.; Liu, J.; Feng, W.; Chen, S.Y. Sulforaphane Protects against Ethanol-Induced Apoptosis in Neural Crest Cells through Restoring Epithelial-Mesenchymal Transition by Epigenetically Modulating the Expression of Snail1. Biochim. Biophys. Acta. Mol. Basis Dis. 2019, 1865, 2586–2594. [Google Scholar] [CrossRef] [PubMed]
- Van Buren, P.N.; Toto, R. Hypertension in Diabetic Nephropathy: Epidemiology, Mechanisms, and Management. Adv. Chronic Kidney Dis. 2011, 18, 28–41. [Google Scholar] [CrossRef]
- Cooper, M.E. Pathogenesis, Prevention, and Treatment of Diabetic Nephropathy. Lancet 1998, 352, 213–219. [Google Scholar] [CrossRef]
- Gewin, L.S. TGF-β and Diabetic Nephropathy: Lessons Learned over the Past 20 Years. Am. J. Med. Sci. 2020, 359, 70–72. [Google Scholar] [CrossRef]
- Van Der Pijl, J.W.; Daha, M.R.; Van Den Born, J.; Verhagen, N.A.M.; Lemkes, H.H.P.J.; Bucala, R.; Berden, J.H.M.; Zwinderman, A.H.; Bruijn, J.A.; Van Es, L.A.; et al. Extracellular Matrix in Human Diabetic Nephropathy: Reduced Expression of Heparan Sulphate in Skin Basement Membrane. Diabetologia 1998, 41, 791–798. [Google Scholar] [CrossRef]
- Kim, S.H.; Turnbull, J.; Guimond, S. Extracellular Matrix and Cell Signalling: The Dynamic Cooperation of Integrin, Proteoglycan and Growth Factor Receptor. J. Endocrinol. 2011, 209, 139–151. [Google Scholar] [CrossRef]
- Wan, J.; Wang, Y.; Cai, G.; Liang, J.; Yue, C.; Wang, F.; Song, J.; Wang, J.; Liu, M.; Luo, J.; et al. Elevated Serum Concentrations of HE4 as a Novel Biomarker of Disease Severity and Renal Fibrosis in Kidney Disease. Oncotarget 2016, 7, 67748–67759. [Google Scholar] [CrossRef]
- Li, X.; Zhang, T.; Geng, J.; Wu, Z.; Xu, L.; Liu, J.; Tian, J.; Zhou, Z.; Nie, J.; Bai, X. Advanced Oxidation Protein Products Promote Lipotoxicity and Tubulointerstitial Fibrosis via CD36/β-Catenin Pathway in Diabetic Nephropathy. Antioxid. Redox Signal. 2019, 31, 521–538. [Google Scholar] [CrossRef] [PubMed]
- Taneda, S.; Pippin, J.W.; Sage, E.H.; Hudkins, K.L.; Takeuchi, Y.; Couser, W.G.; Alpers, C.E. Amelioration of Diabetic Nephropathy in SPARC-Null Mice. J. Am. Soc. Nephrol. 2003, 14, 968–980. [Google Scholar] [CrossRef] [PubMed]
- Schaefer, L.; Raslik, I.; Gröne, H.; Schönherr, E.; Macakova, K.; Ugorcakova, J.; Budny, S.; Schaefer, R.M.; Kresse, H. Small Proteoglycans in Human Diabetic Nephropathy: Discrepancy between Glomerular Expression and Protein Accumulation of Decorin, Biglycan, Lumican, and Fibromodulin. FASEB J. 2001, 15, 559–561. [Google Scholar] [CrossRef] [PubMed]
- Zhang, W.; Rong, G.; Gu, J.; Fan, C.; Guo, T.; Jiang, T.; Deng, W.; Xie, J.; Su, Z.; Yu, Q.; et al. Nicotinamide N-Methyltransferase Ameliorates Renal Fibrosis by Its Metabolite 1-Methylnicotinamide Inhibiting the TGF-Β1/Smad3 Pathway. FASEB J. 2022, 36, e22084. [Google Scholar] [CrossRef]
- Jiang, X.; Xu, Z.; Du, Y.; Chen, H. Bioinformatics Analysis Reveals Novel Hub Gene Pathways Associated with IgA Nephropathy. Eur. J. Med. Res. 2020, 25, 40. [Google Scholar] [CrossRef]
- Imai, T.; Hieshima, K.; Haskell, C.; Baba, M.; Nagira, M.; Nishimura, M.; Kakizaki, M.; Takagi, S.; Nomiyama, H.; Schall, T.J.; et al. Identification and Molecular Characterization of Fractalkine Receptor CX3CR1, Which Mediates Both Leukocyte Migration and Adhesion. Cell 1997, 91, 521–530. [Google Scholar] [CrossRef]
- Duarte Abreu, M.A.; de Castro, P.A.S.V.; Moreira, F.R.C.; de Oliveira Ferreira, H.; Simões e Silva, A.C. Potential Role of Novel Cardiovascular Biomarkers in Pediatric Patients with Chronic Kidney Disease. Mini Rev. Med. Chem. 2024, 24, 491–506. [Google Scholar] [CrossRef]
- Chen, H.; Zhang, Z.; Zhou, L.; Cai, T.; Liu, B.; Wang, L.; Yang, J. Identification of CCL19 as a Novel Immune-Related Biomarker in Diabetic Nephropathy. Front. Genet. 2022, 13, 830437. [Google Scholar] [CrossRef]
- Winnier, D.A.; Fourcaudot, M.; Norton, L.; Abdul-Ghani, M.A.; Hu, S.L.; Farook, V.S.; Coletta, D.K.; Kumar, S.; Puppala, S.; Chittoor, G.; et al. Transcriptomic Identification of ADH1B as a Novel Candidate Gene for Obesity and Insulin Resistance in Human Adipose Tissue in Mexican Americans from the Veterans Administration Genetic Epidemiology Study (VAGES). PLoS ONE 2015, 10, e0119941. [Google Scholar] [CrossRef]
- Gallo, D.; Cocchietto, M.; Masat, E.; Agostinis, C.; Harei, E.; Veronesi, P.; Sava, G. Human Recombinant Lysozyme Downregulates Advanced Glycation Endproduct-Induced Interleukin-6 Production and Release in an in-Vitro Model of Human Proximal Tubular Epithelial Cells. Exp. Biol. Med. 2014, 239, 337–346. [Google Scholar] [CrossRef]
- Lai, S.; Gaudio, C.; Perrotta, A.M.; Iorio, R.; Asllanaj, B.; Ferrigno, L.; Mangiulli, M.; Mariotti, A.; Menè, P.; Mazzaferro, S.; et al. Relationships between Diabetic Nephropathy and Insulin Resistance, Inflammation, Trx, Txnip, CysC and Serum Complement Levels. Eur. Rev. Med. Pharmacol. Sci. 2020, 24, 11690–11699. [Google Scholar] [PubMed]
- Susztak, K.; Ciccone, E.; McCue, P.; Sharma, K.; Böttinger, E.P. Multiple Metabolic Hits Converge on CD36 as Novel Mediator of Tubular Epithelial Apoptosis in Diabetic Nephropathy. PLoS Med. 2005, 2, e45. [Google Scholar] [CrossRef] [PubMed]
- Shahzad, K.; Bock, F.; Al-Dabet, M.M.; Gadi, I.; Kohli, S.; Nazir, S.; Ghosh, S.; Ranjan, S.; Wang, H.; Madhusudhan, T.; et al. Caspase-1, but Not Caspase-3, Promotes Diabetic Nephropathy. J. Am. Soc. Nephrol. 2016, 27, 2270–2275. [Google Scholar] [CrossRef]
- Birnbaum, Y.; Bajaj, M.; Yang, H.C.; Ye, Y. Combined SGLT2 and DPP4 Inhibition Reduces the Activation of the Nlrp3/ASC Inflammasome and Attenuates the Development of Diabetic Nephropathy in Mice with Type 2 Diabetes. Cardiovasc. Drugs Ther. 2018, 32, 135–145. [Google Scholar] [CrossRef]
- Chong, W.C.; Shastri, M.D.; Peterson, G.M.; Patel, R.P.; Pathinayake, P.S.; Dua, K.; Hansbro, N.G.; Hsu, A.C.; Wark, P.A.; Shukla, S.D.; et al. The Complex Interplay between Endoplasmic Reticulum Stress and the NLRP3 Inflammasome: A Potential Therapeutic Target for Inflammatory Disorders. Clin. Transl. Immunol. 2021, 10, e1247. [Google Scholar] [CrossRef] [PubMed]
- Sanchez-Niño, M.D.; Benito-Martin, A.; Ortiz, A. New Paradigms in Cell Death in Human Diabetic Nephropathy. Kidney Int. 2010, 78, 737–744. [Google Scholar] [CrossRef]
- Lake, B.B.; Menon, R.; Winfree, S.; Hu, Q.; Ferreira, R.M.; Kalhor, K.; Barwinska, D.; Otto, E.A.; Ferkowicz, M.; Diep, D.; et al. An Atlas of Healthy and Injured Cell States and Niches in the Human Kidney. Nature 2023, 619, 585–594. [Google Scholar] [CrossRef]
- Shao, B.Y.; Zhang, S.F.; Li, H.D.; Meng, X.M.; Chen, H.Y. Epigenetics and Inflammation in Diabetic Nephropathy. Front. Physiol. 2021, 12, 649587. [Google Scholar] [CrossRef]
- Xu, C.; Ha, X.; Yang, S.; Tian, X.; Jiang, H. Advances in Understanding and Treating Diabetic Kidney Disease: Focus on Tubulointerstitial Inflammation Mechanisms. Front. Endocrinol. 2023, 14, 1232790. [Google Scholar] [CrossRef]
- Wang, M.; Pang, Y.; Guo, Y.; Tian, L.; Liu, Y.; Shen, C.; Liu, M.; Meng, Y.; Cai, Z.; Wang, Y.; et al. Metabolic Reprogramming: A Novel Therapeutic Target in Diabetic Kidney Disease. Front. Pharmacol. 2022, 13, 970601. [Google Scholar] [CrossRef]
- Adamczak, M.; Surma, S. Metabolic Acidosis in Patients with CKD: Epidemiology, Pathogenesis, and Treatment. Kidney Dis. 2021, 7, 452–467. [Google Scholar] [CrossRef]
- Li, Y.; Sha, Z.; Peng, H. Metabolic Reprogramming in Kidney Diseases: Evidence and Therapeutic Opportunities. Int. J. Nephrol. 2021, 2021, 5497346. [Google Scholar] [CrossRef] [PubMed]
- Gao, Z.; Chen, X. Fatty Acid β-Oxidation in Kidney Diseases: Perspectives on Pathophysiological Mechanisms and Therapeutic Opportunities. Front. Pharmacol. 2022, 13, 805281. [Google Scholar] [CrossRef] [PubMed]
- Edgar, R.; Domrachev, M.; Lash, A.E. Gene Expression Omnibus: NCBI Gene Expression and Hybridization Array Data Repository. Nucleic Acids Res. 2002, 30, 207–210. [Google Scholar] [CrossRef] [PubMed]
- Athar, A.; Füllgrabe, A.; George, N.; Iqbal, H.; Huerta, L.; Ali, A.; Snow, C.; Fonseca, N.A.; Petryszak, R.; Papatheodorou, I.; et al. ArrayExpress Update—From Bulk to Single-Cell Expression Data. Nucleic Acids Res. 2019, 47, D711–D715. [Google Scholar] [CrossRef]
- Grayson, P.C.; Eddy, S.; Taroni, J.N.; Lightfoot, Y.L.; Mariani, L.; Parikh, H.; Lindenmeyer, M.T.; Ju, W.; Greene, C.S.; Godfrey, B.; et al. Metabolic Pathways and Immunometabolism in Rare Kidney Diseases. Ann. Rheum. Dis. 2018, 77, 1227–1234. [Google Scholar] [CrossRef]
- Ritchie, M.E.; Phipson, B.; Wu, D.; Hu, Y.; Law, C.W.; Shi, W.; Smyth, G.K. Limma Powers Differential Expression Analyses for RNA-Sequencing and Microarray Studies. Nucleic Acids Res. 2015, 43, e47. [Google Scholar] [CrossRef]
- Ashburner, M.; Ball, C.A.; Blake, J.A.; Botstein, D.; Butler, H.; Cherry, J.M.; Davis, A.P.; Dolinski, K.; Dwight, S.S.; Eppig, J.T.; et al. Gene Ontology: Tool for the Unification of Biology. The Gene Ontology Consortium. Nat. Genet. 2000, 25, 25–29. [Google Scholar] [CrossRef]
- Rivals, I.; Personnaz, L.; Taing, L.; Potier, M.C. Enrichment or Depletion of a GO Category within a Class of Genes: Which Test? Bioinformatics 2007, 23, 401–407. [Google Scholar] [CrossRef]
- Heerspink, H.J.L.; Stefánsson, B.V.; Correa-Rotter, R.; Chertow, G.M.; Greene, T.; Hou, F.-F.; Mann, J.F.E.; McMurray, J.J.V.; Lindberg, M.; Rossing, P.; et al. Dapagliflozin in Patients with Chronic Kidney Disease. N. Engl. J. Med. 2020, 383, 1436–1446. [Google Scholar] [CrossRef]
Disclaimer/Publisher’s Note: The statements, opinions and data contained in all publications are solely those of the individual author(s) and contributor(s) and not of MDPI and/or the editor(s). MDPI and/or the editor(s) disclaim responsibility for any injury to people or property resulting from any ideas, methods, instructions or products referred to in the content. |
© 2025 by the authors. Licensee MDPI, Basel, Switzerland. This article is an open access article distributed under the terms and conditions of the Creative Commons Attribution (CC BY) license (https://creativecommons.org/licenses/by/4.0/).