
Temporal and Sex-Dependent N-Glycosylation Dynamics in Rat Serum

 , , , , , and
Abstract
1. Introduction
2. Results
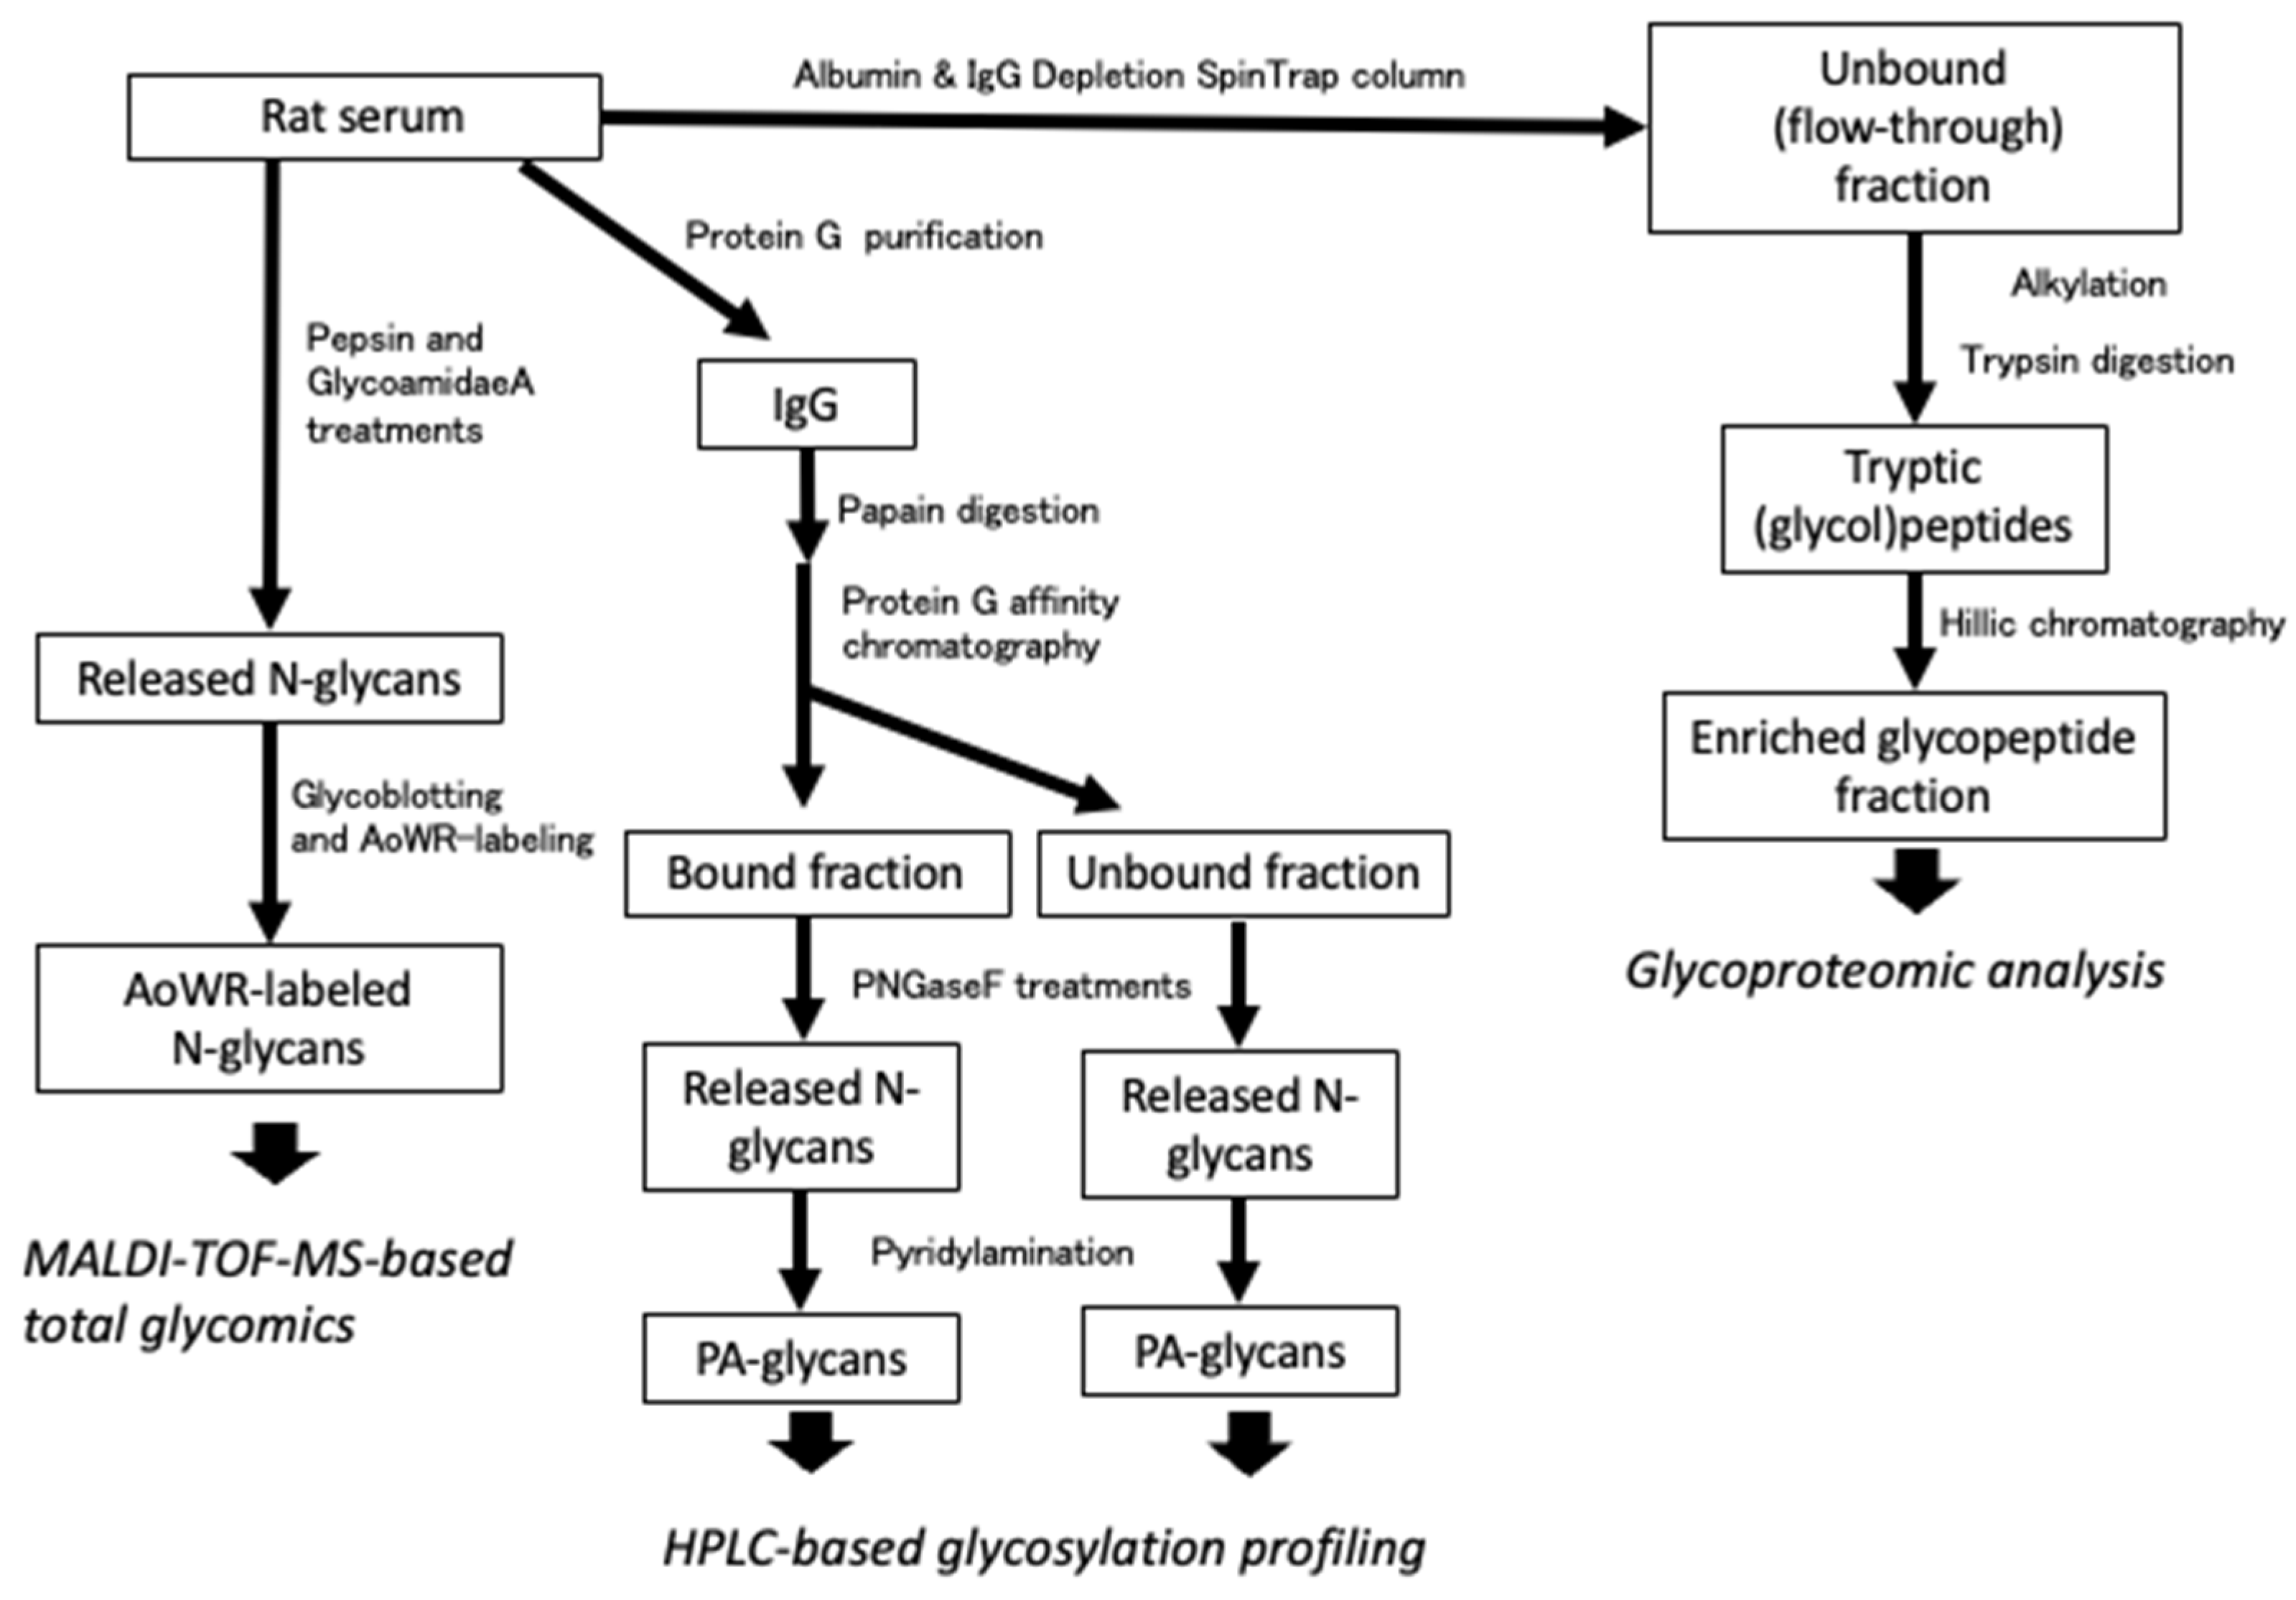
2.1. Overall Work Flow of Glycomic and Glycoproteomic Analyses
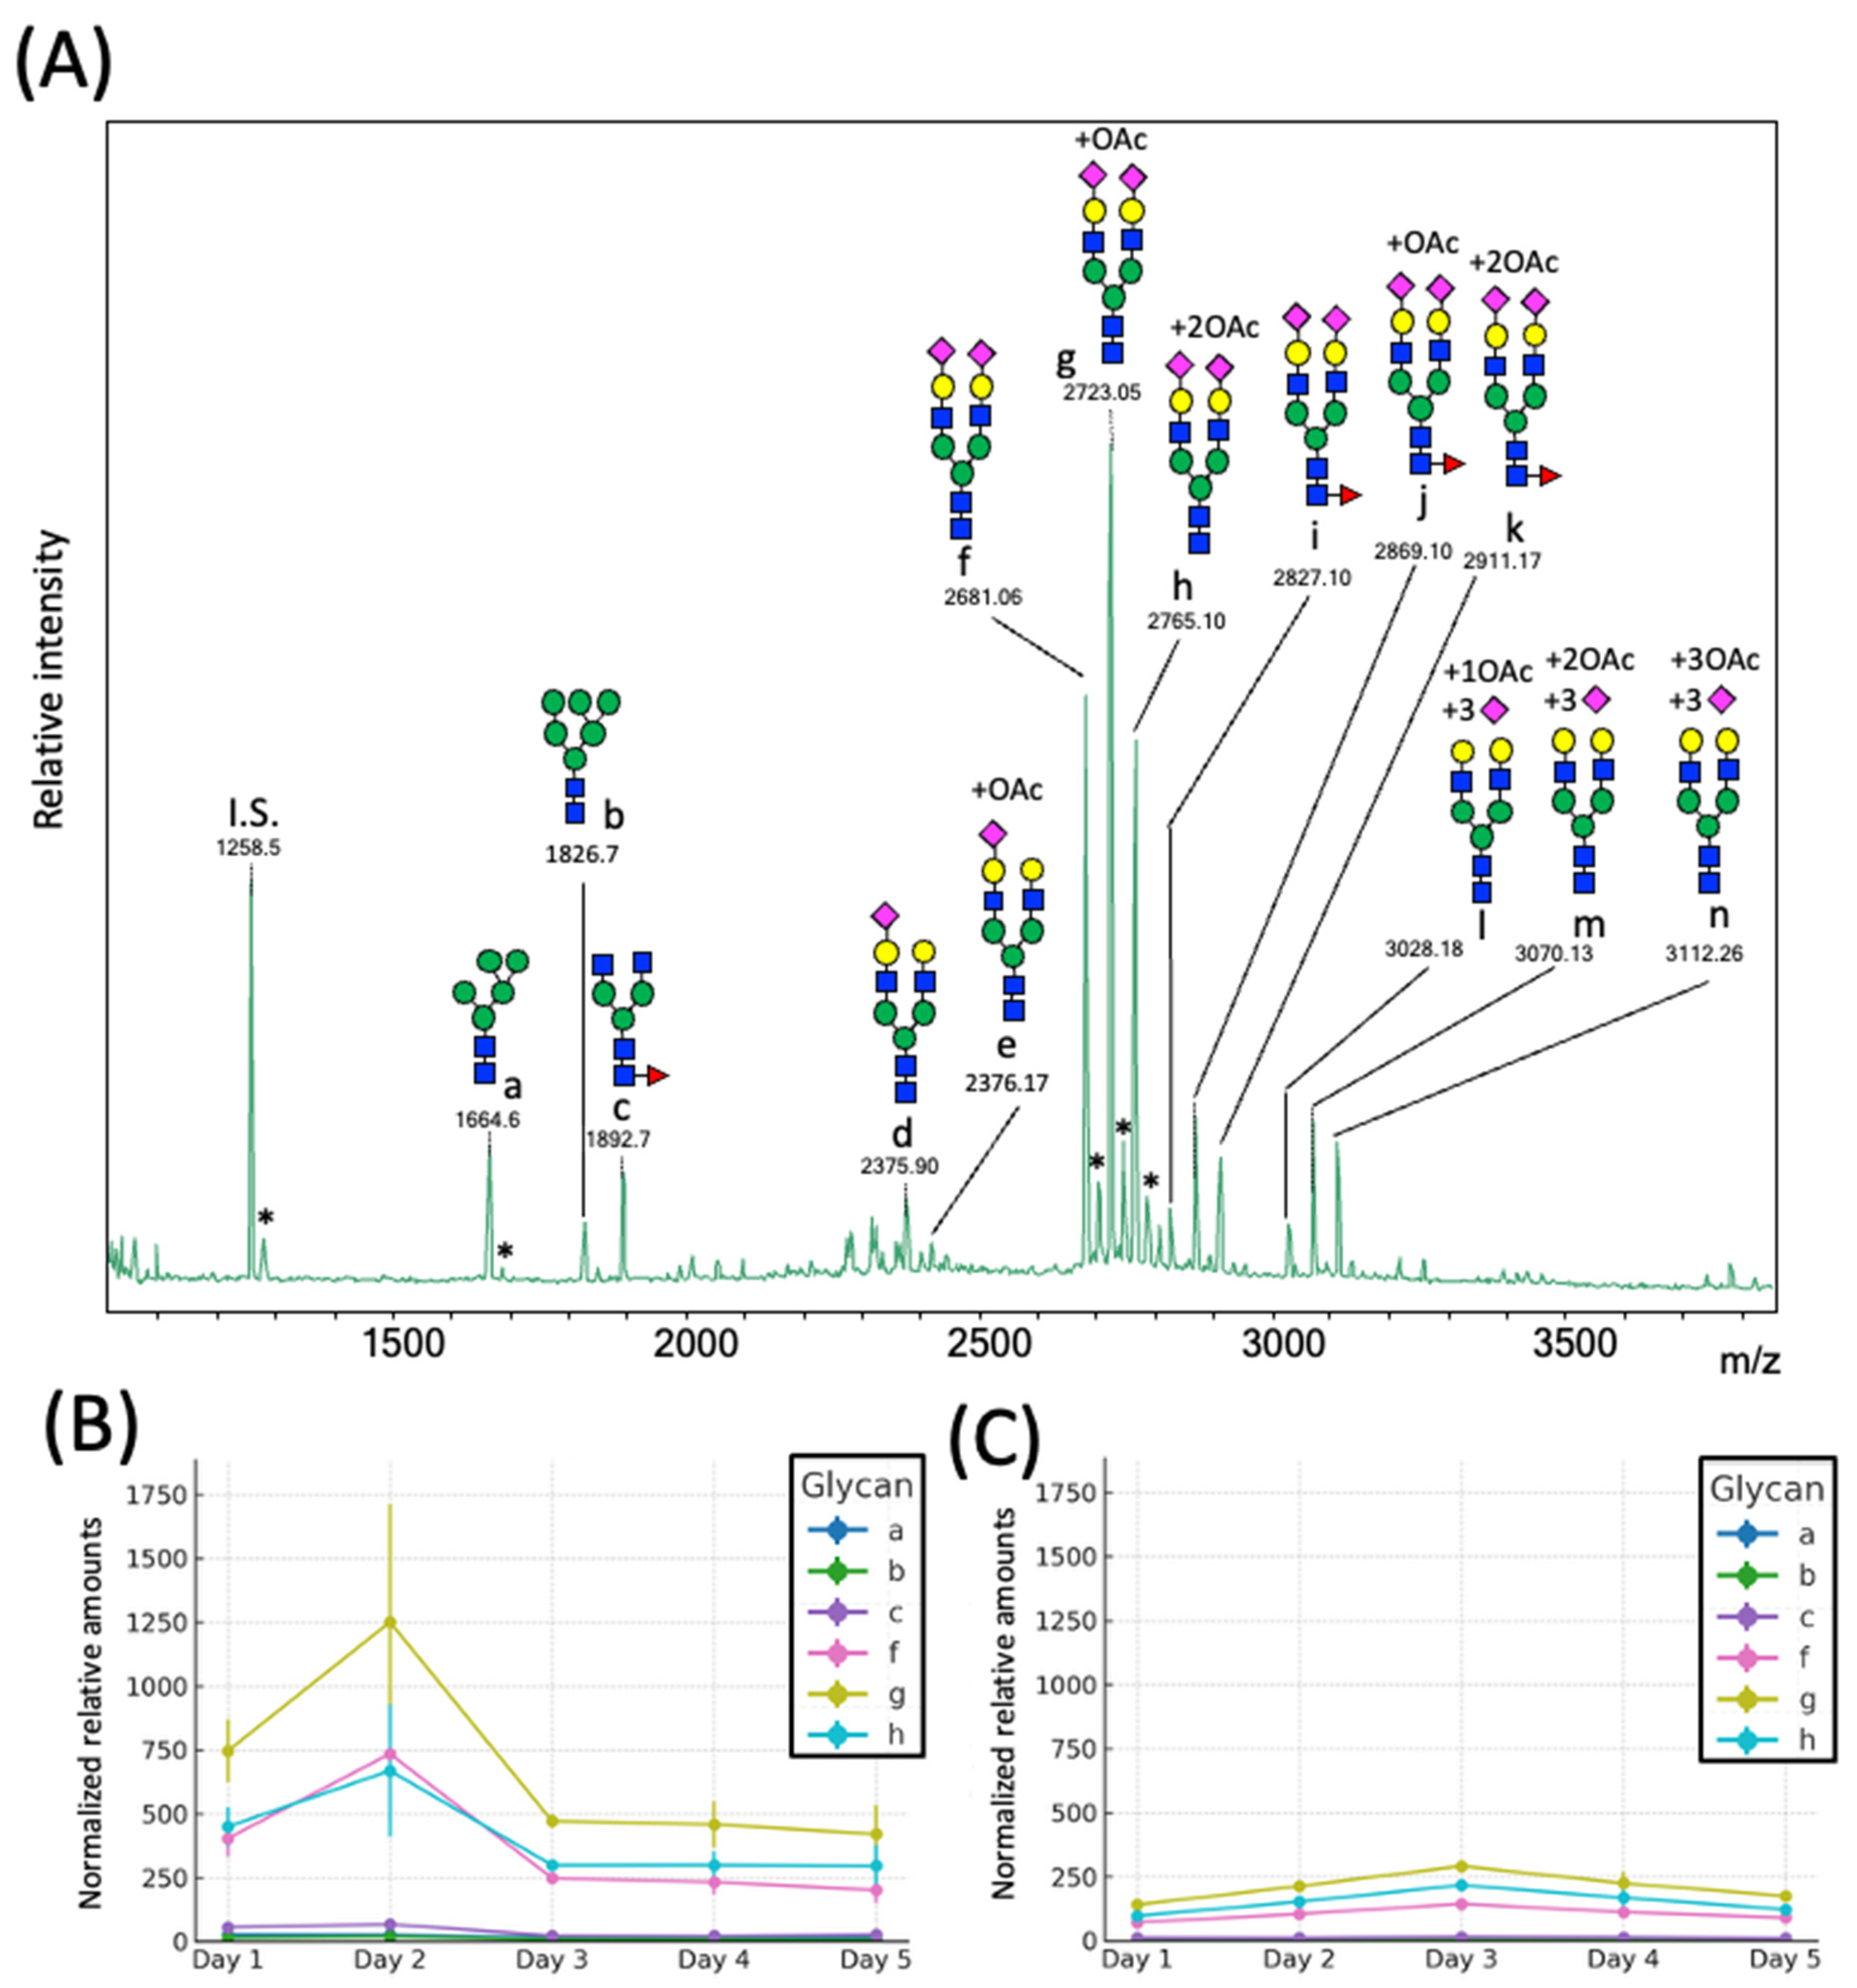
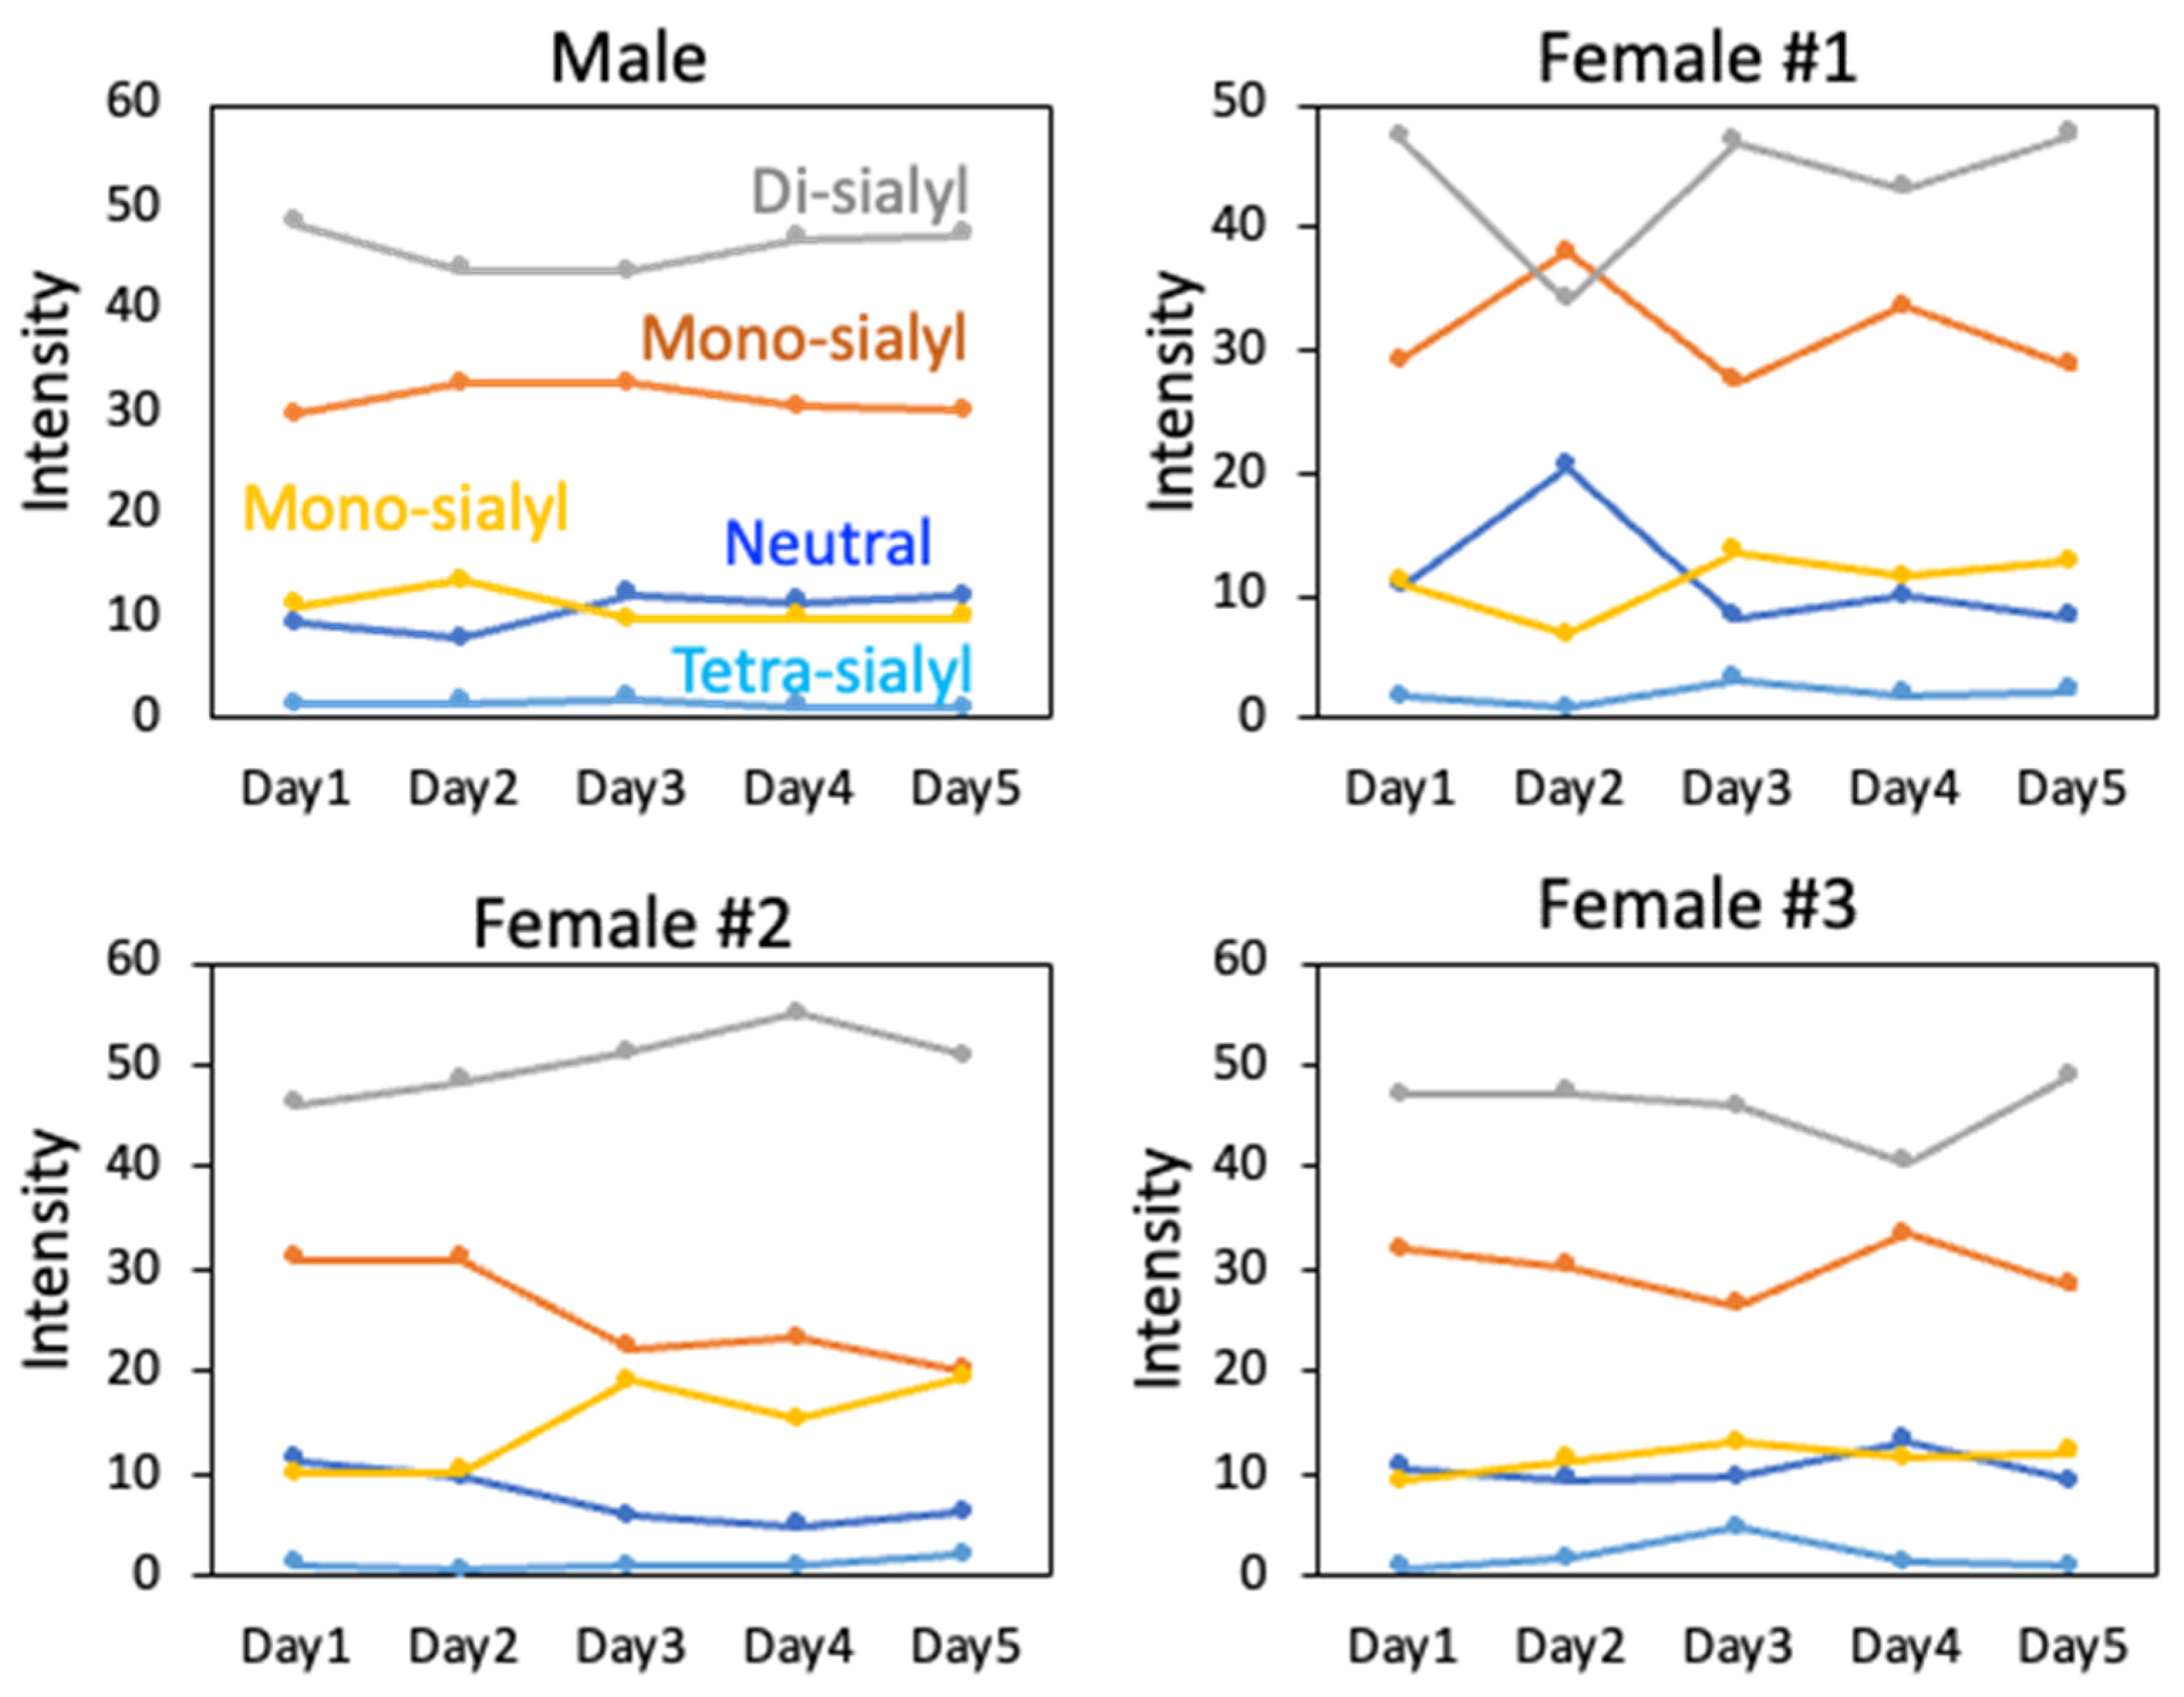
2.2. Day-to-Day Variations in the N-Glycome of Rat Serum
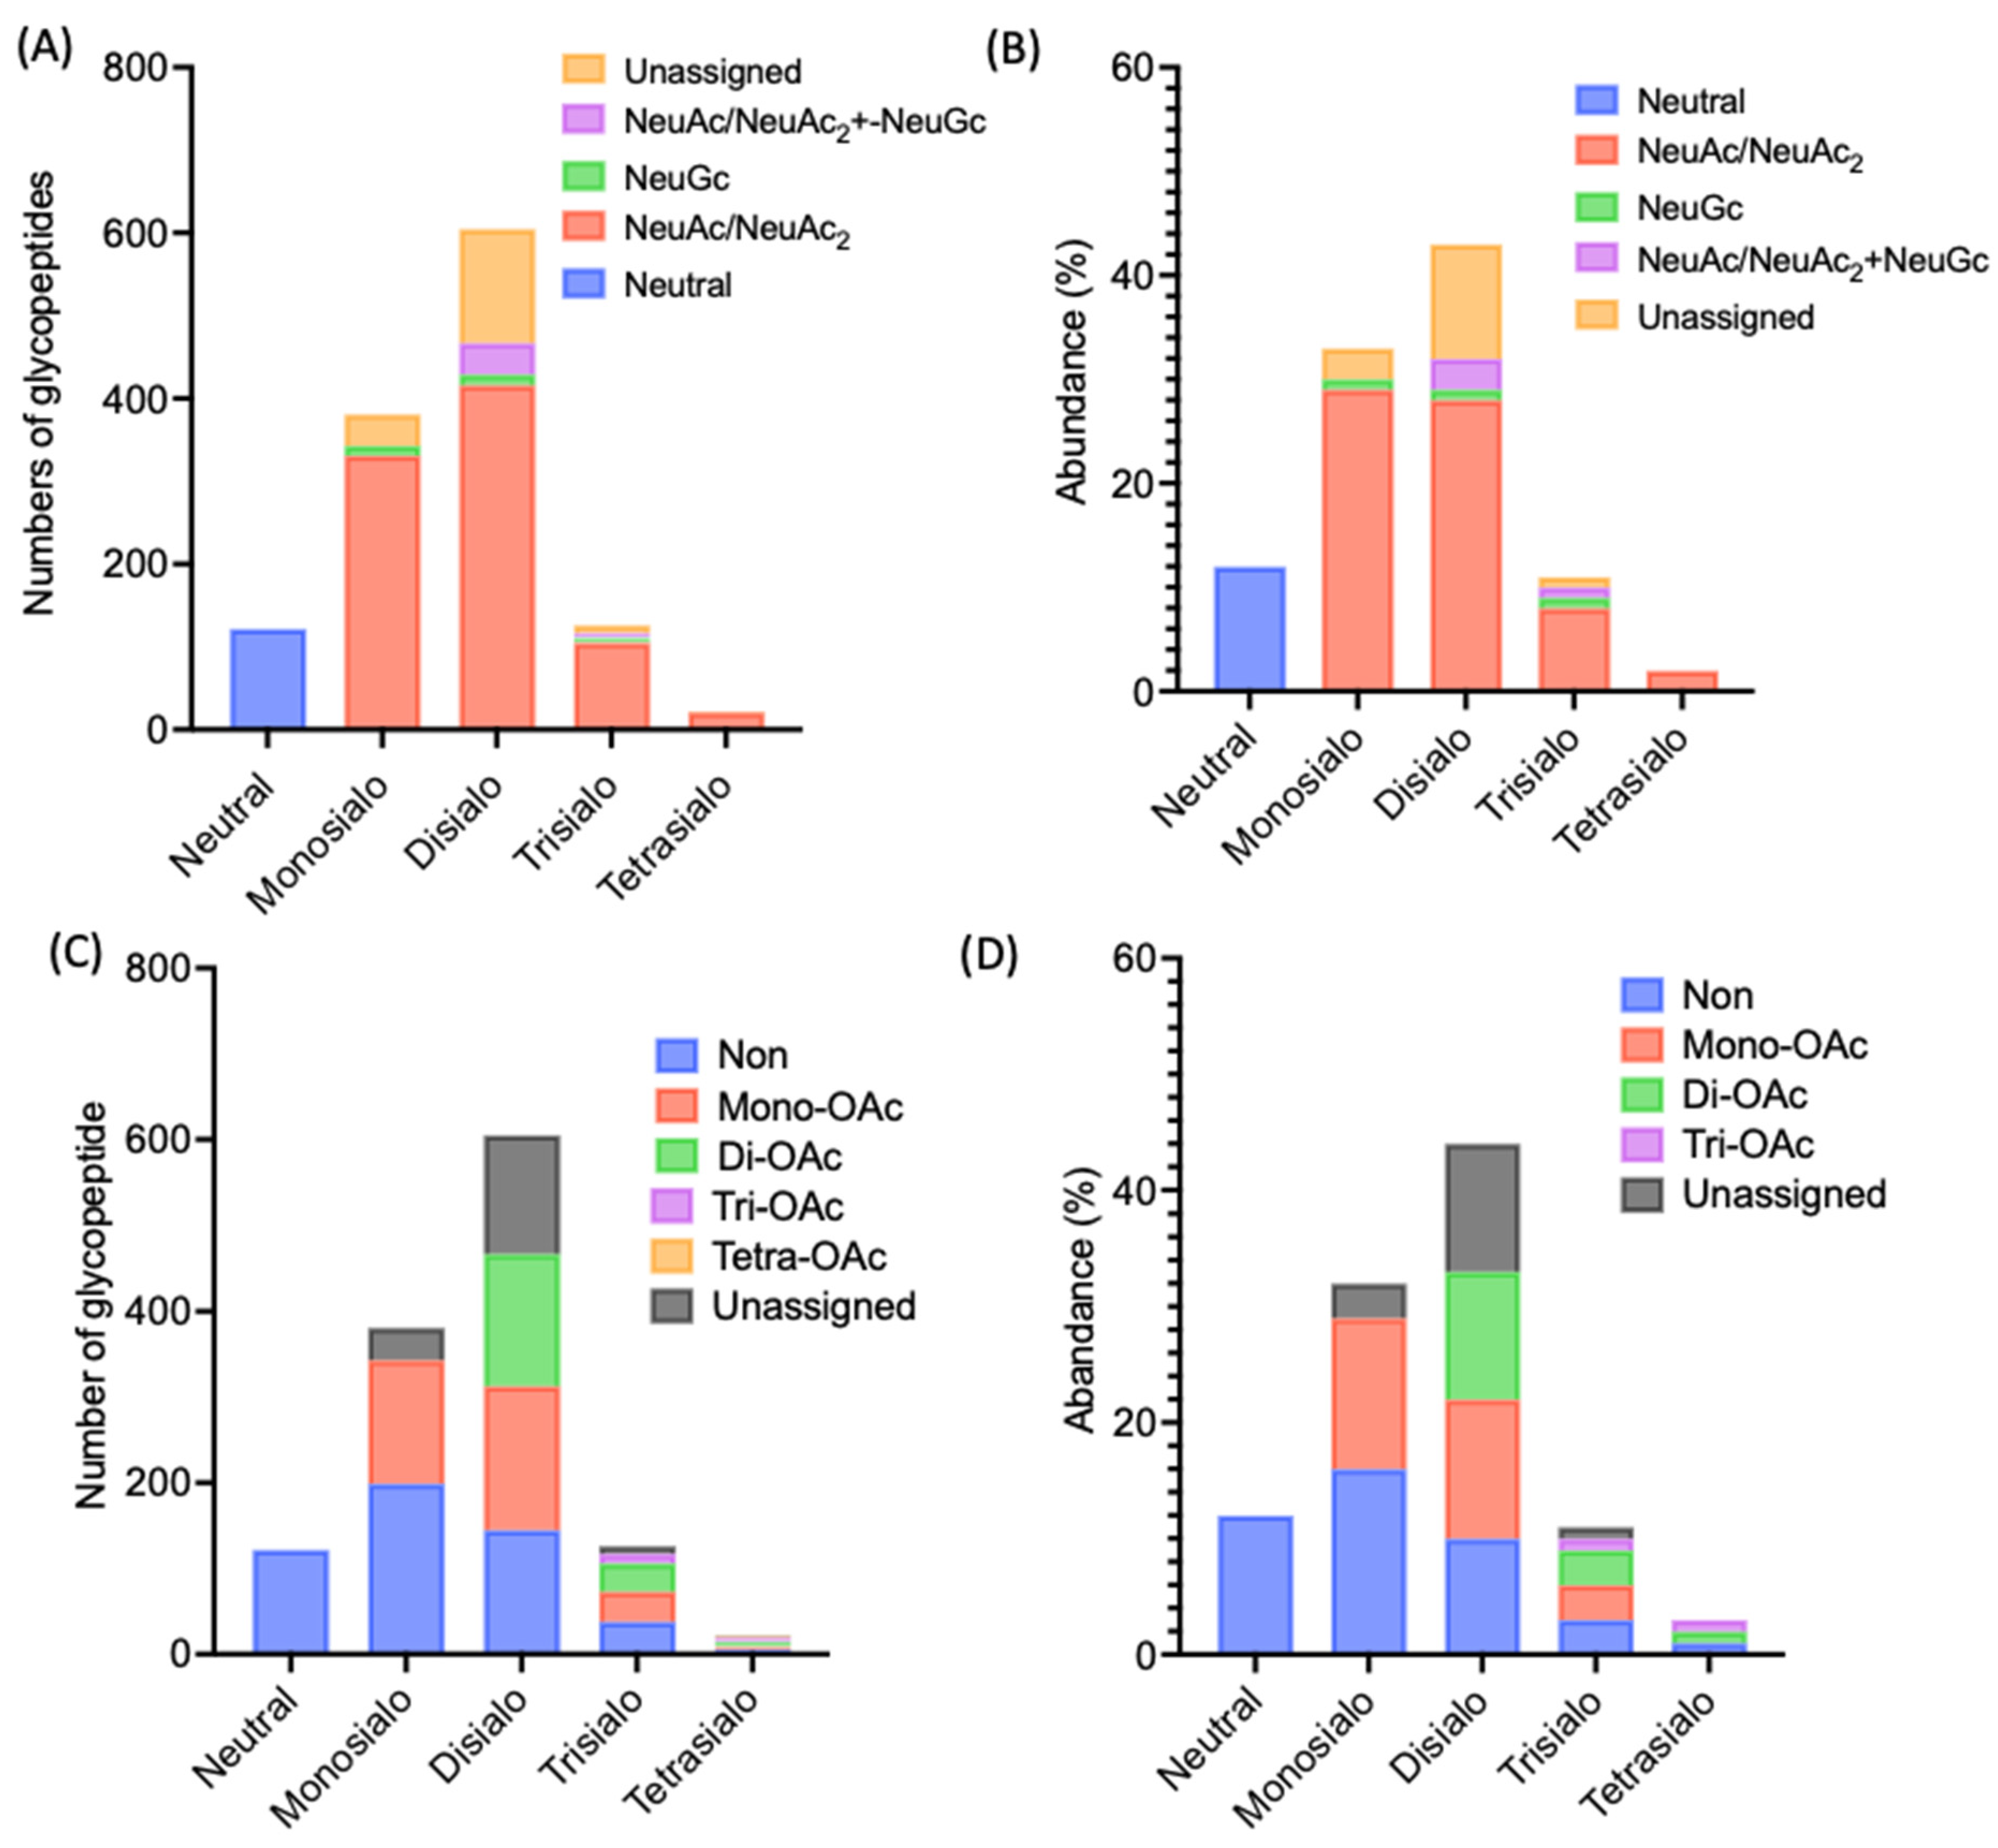
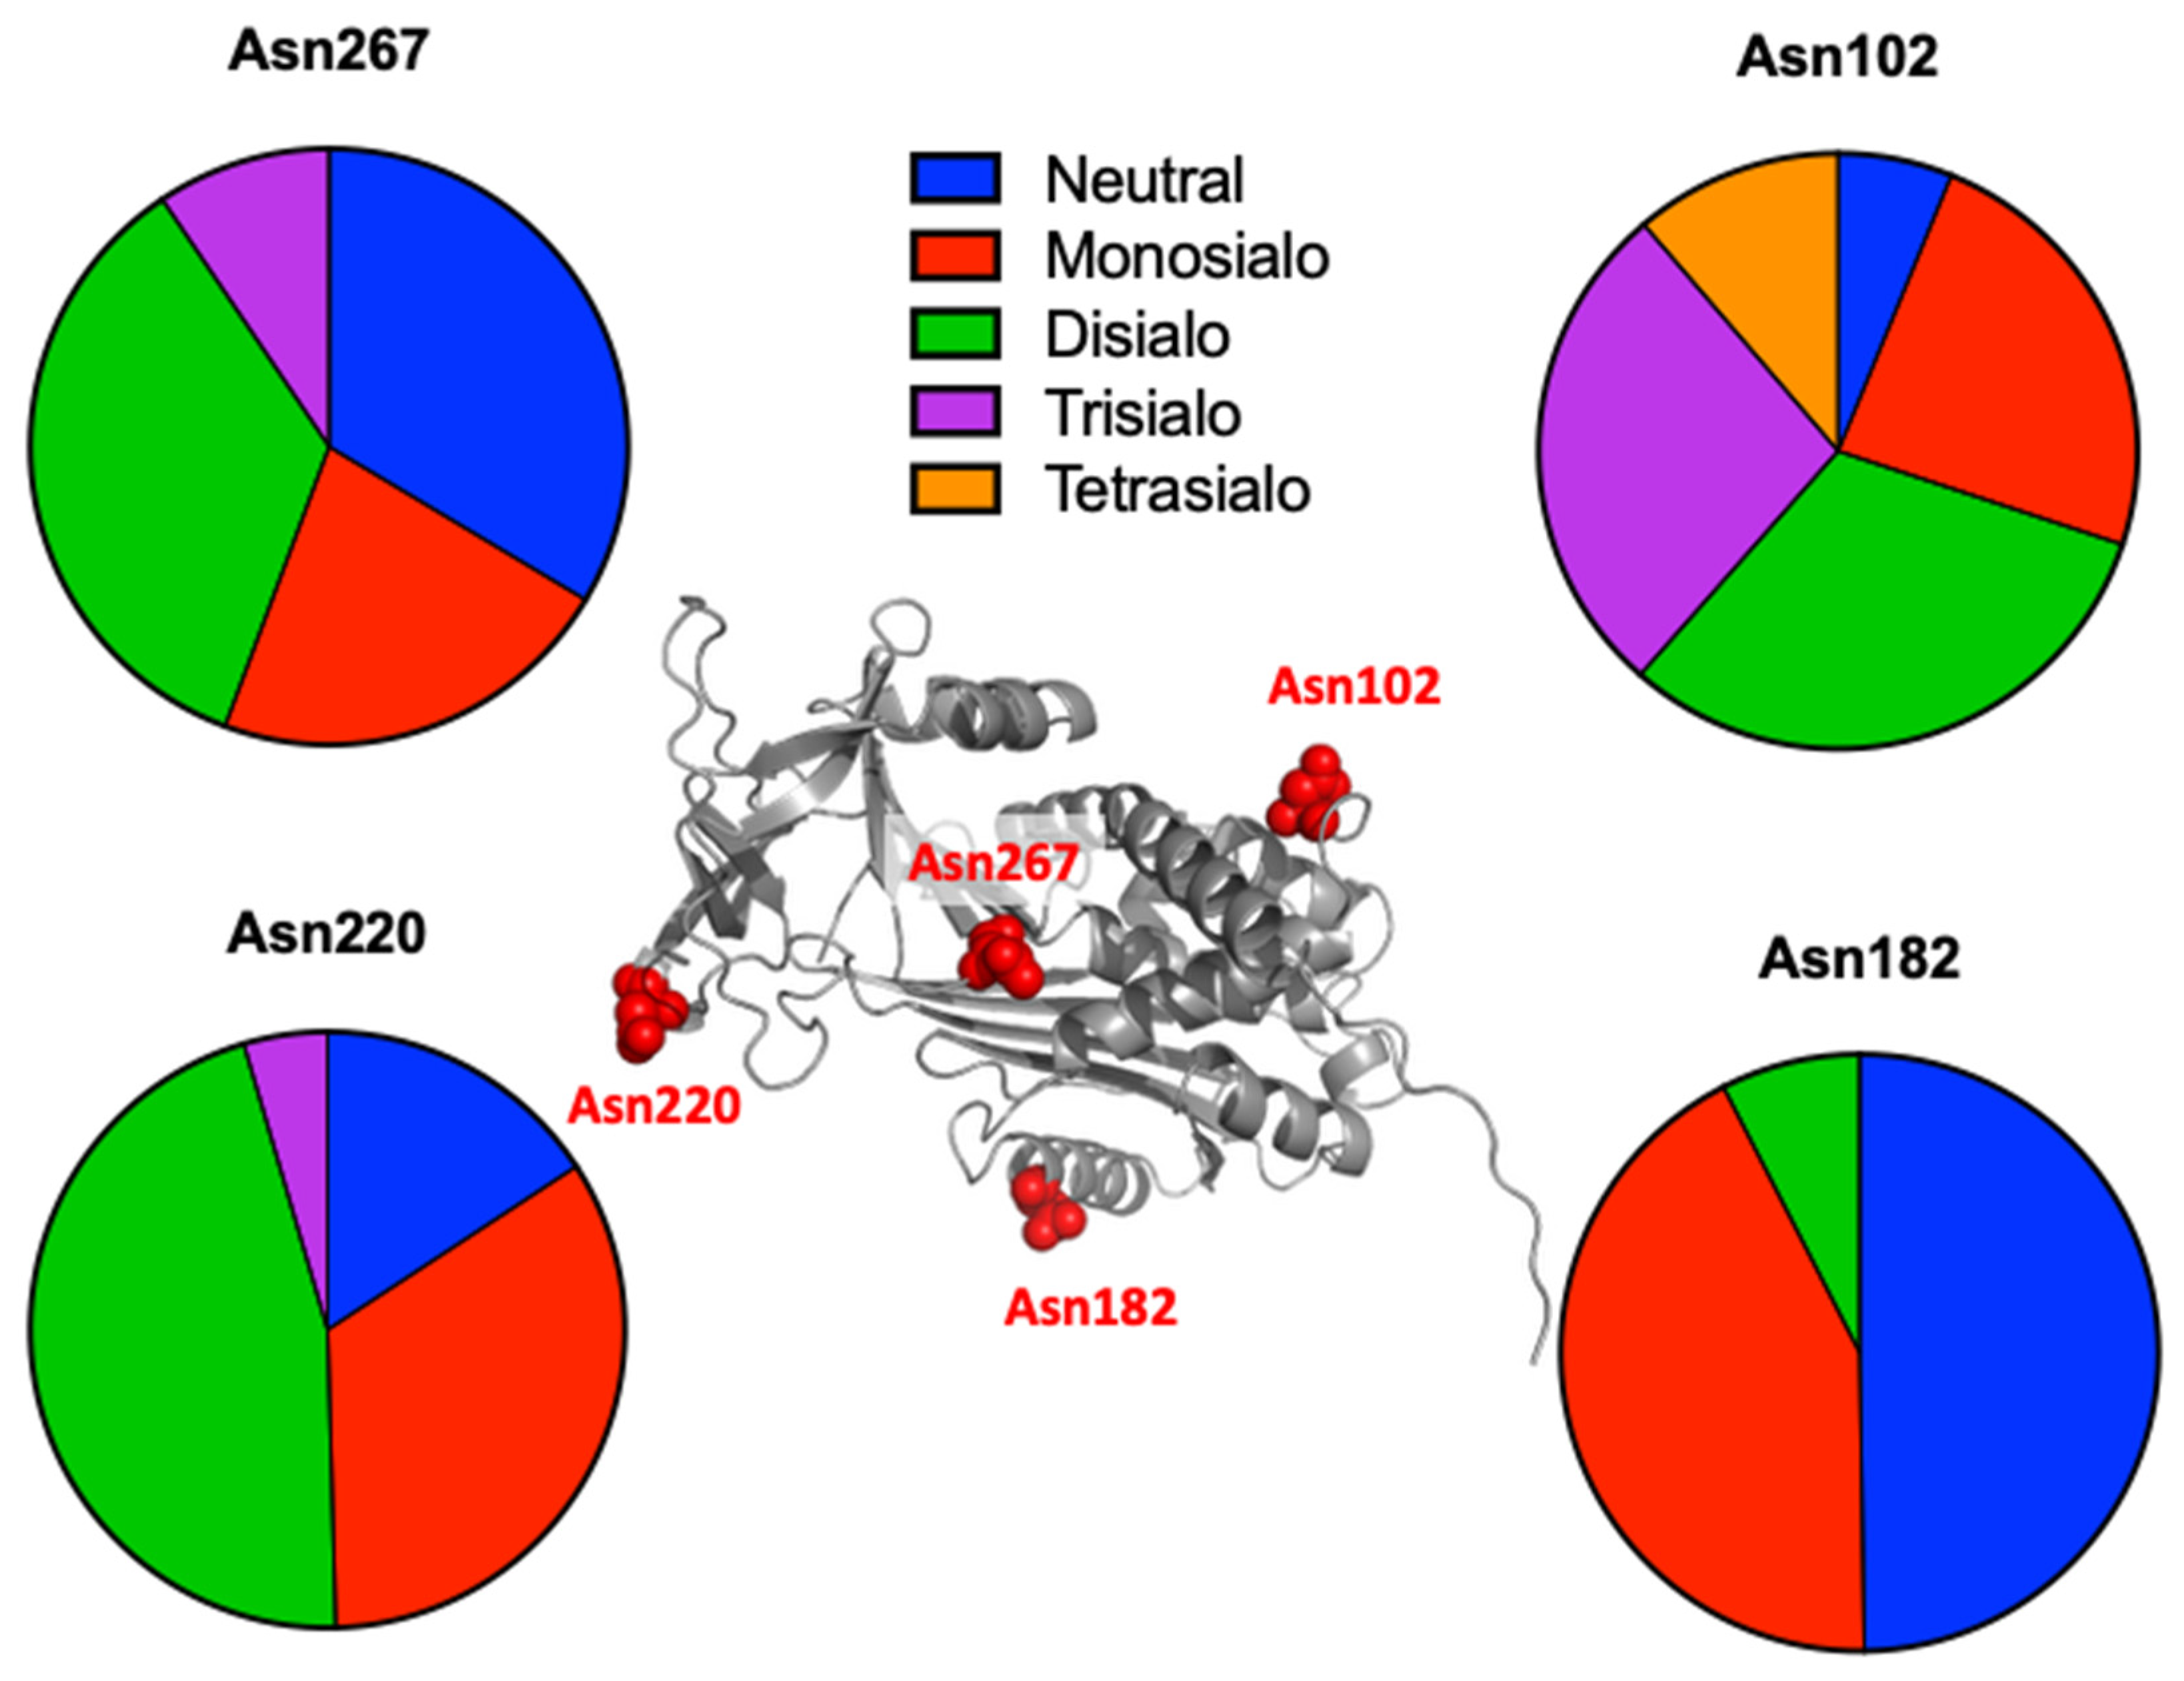
2.3. Identification of Rat Serum N-Glycoproteins
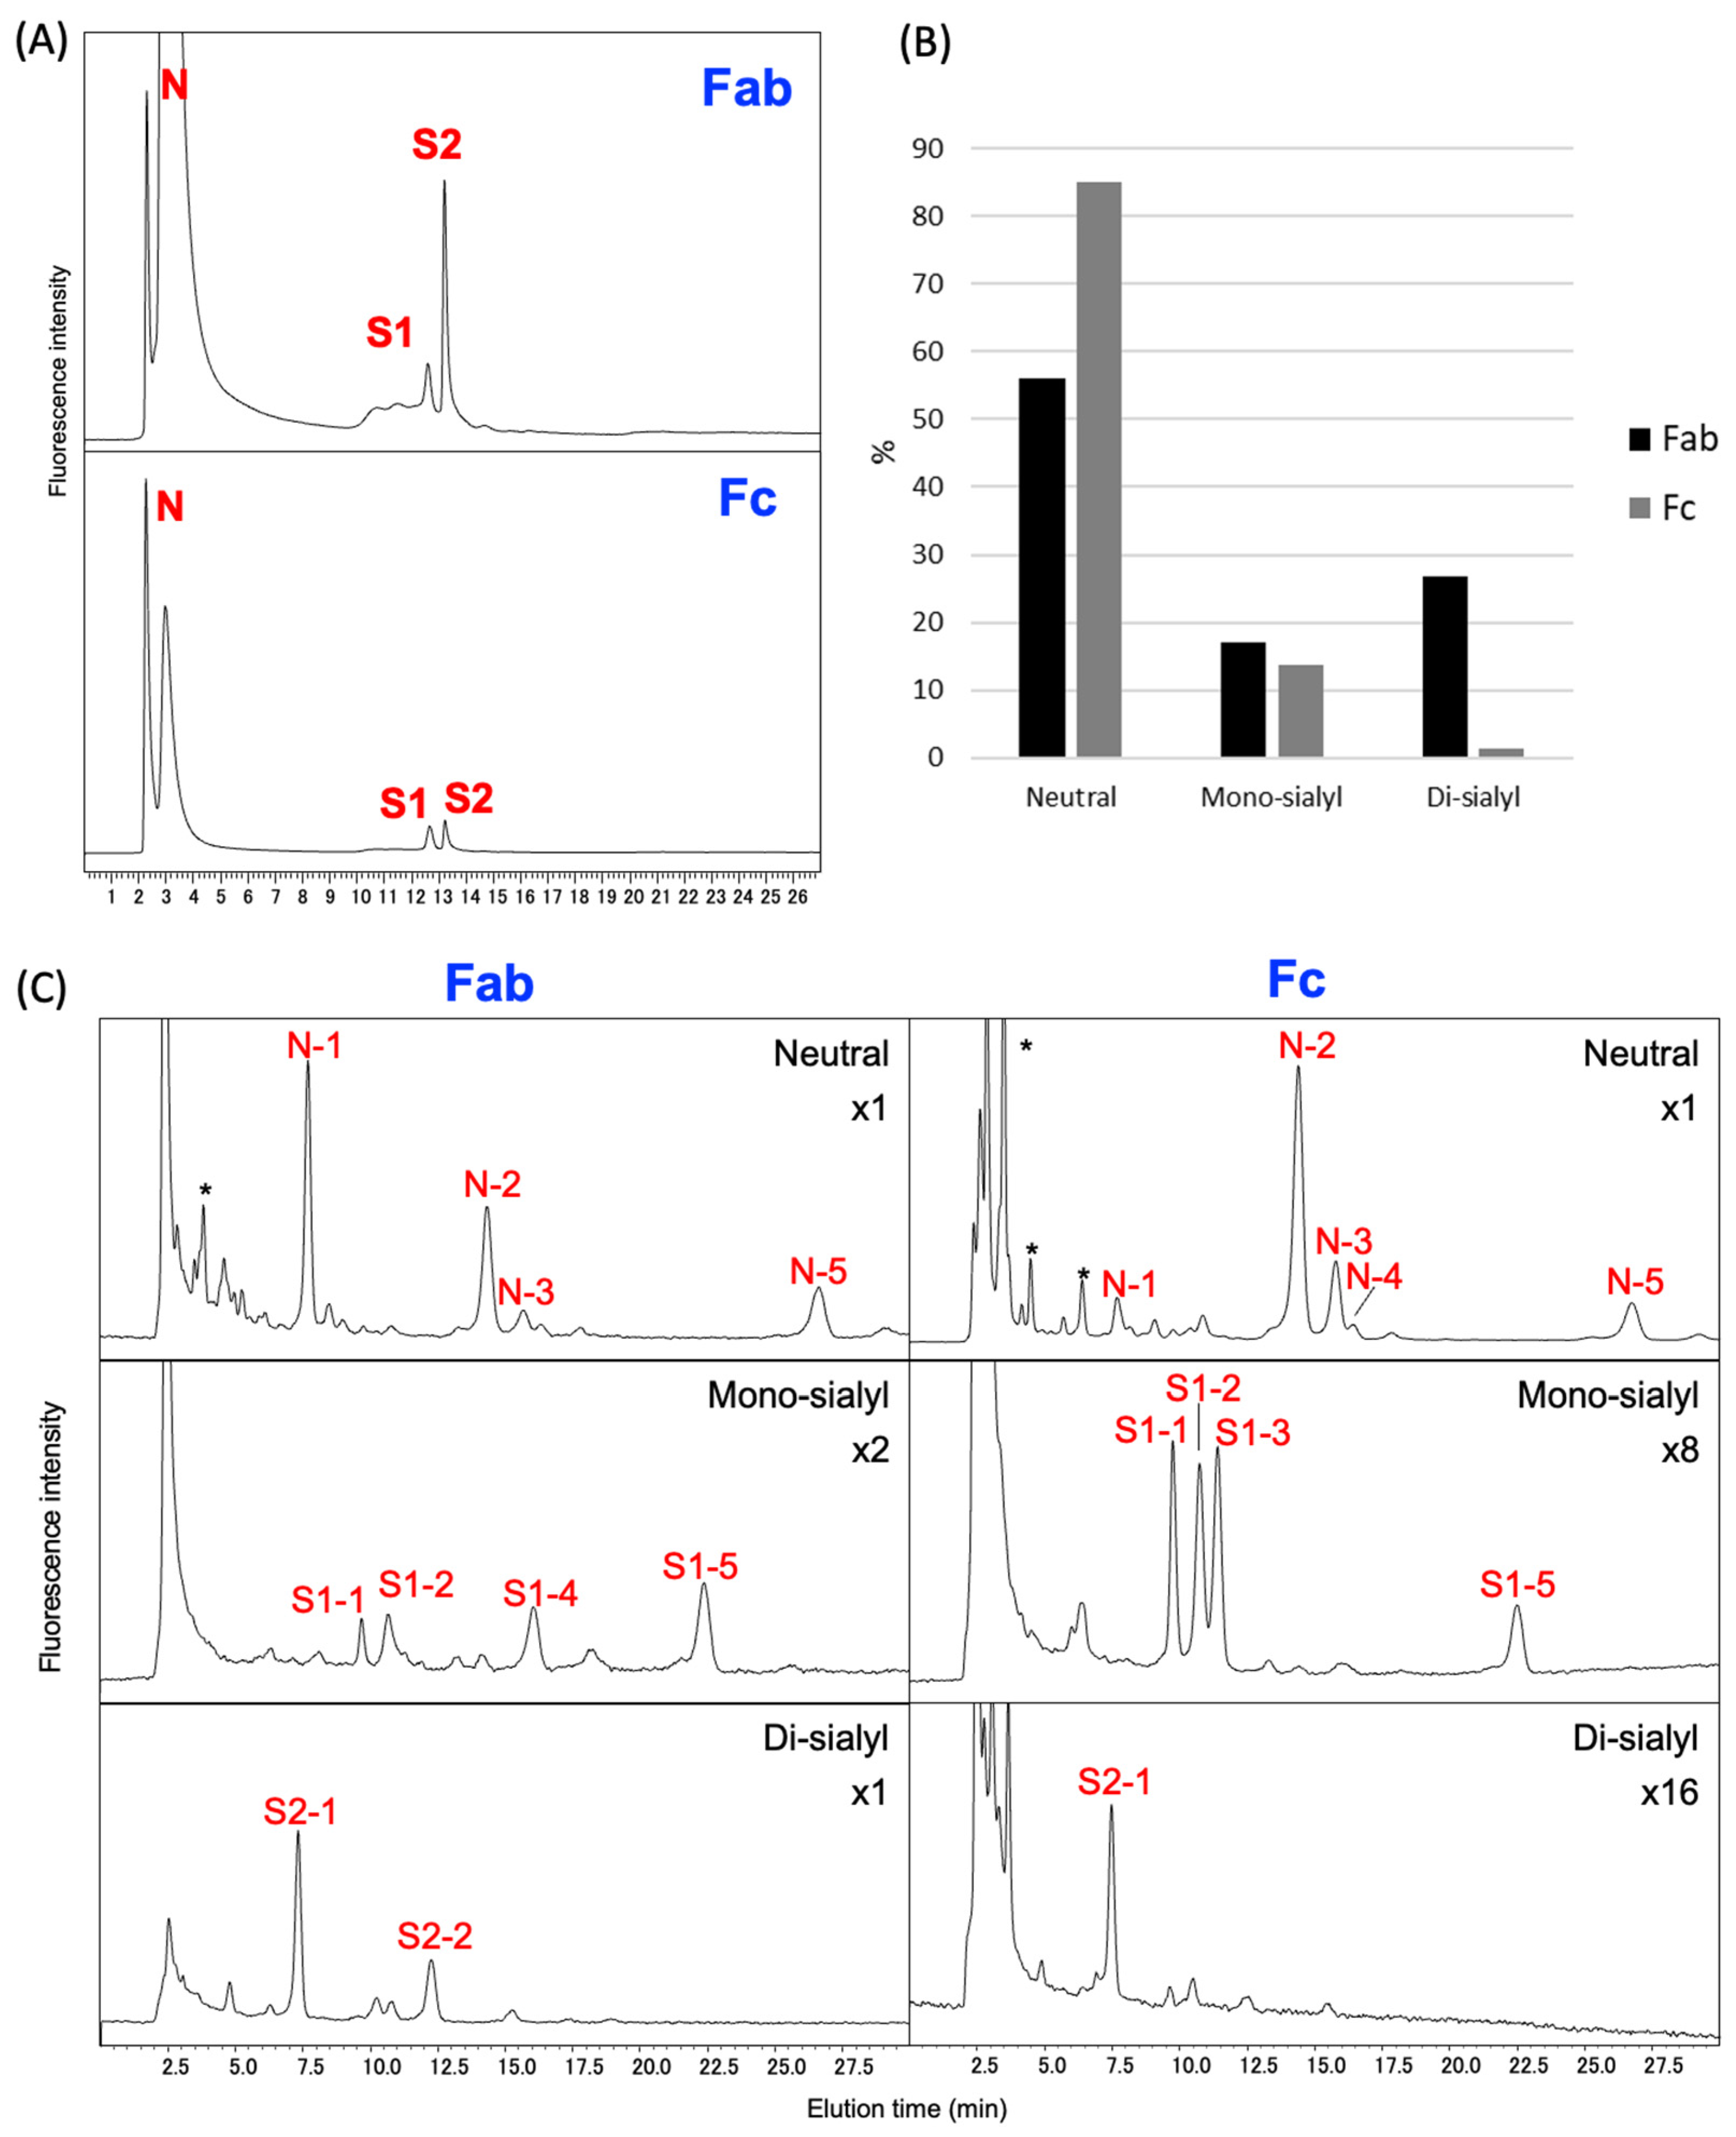
2.4. N-Glycosylation Profiles of Rat Serum IgG
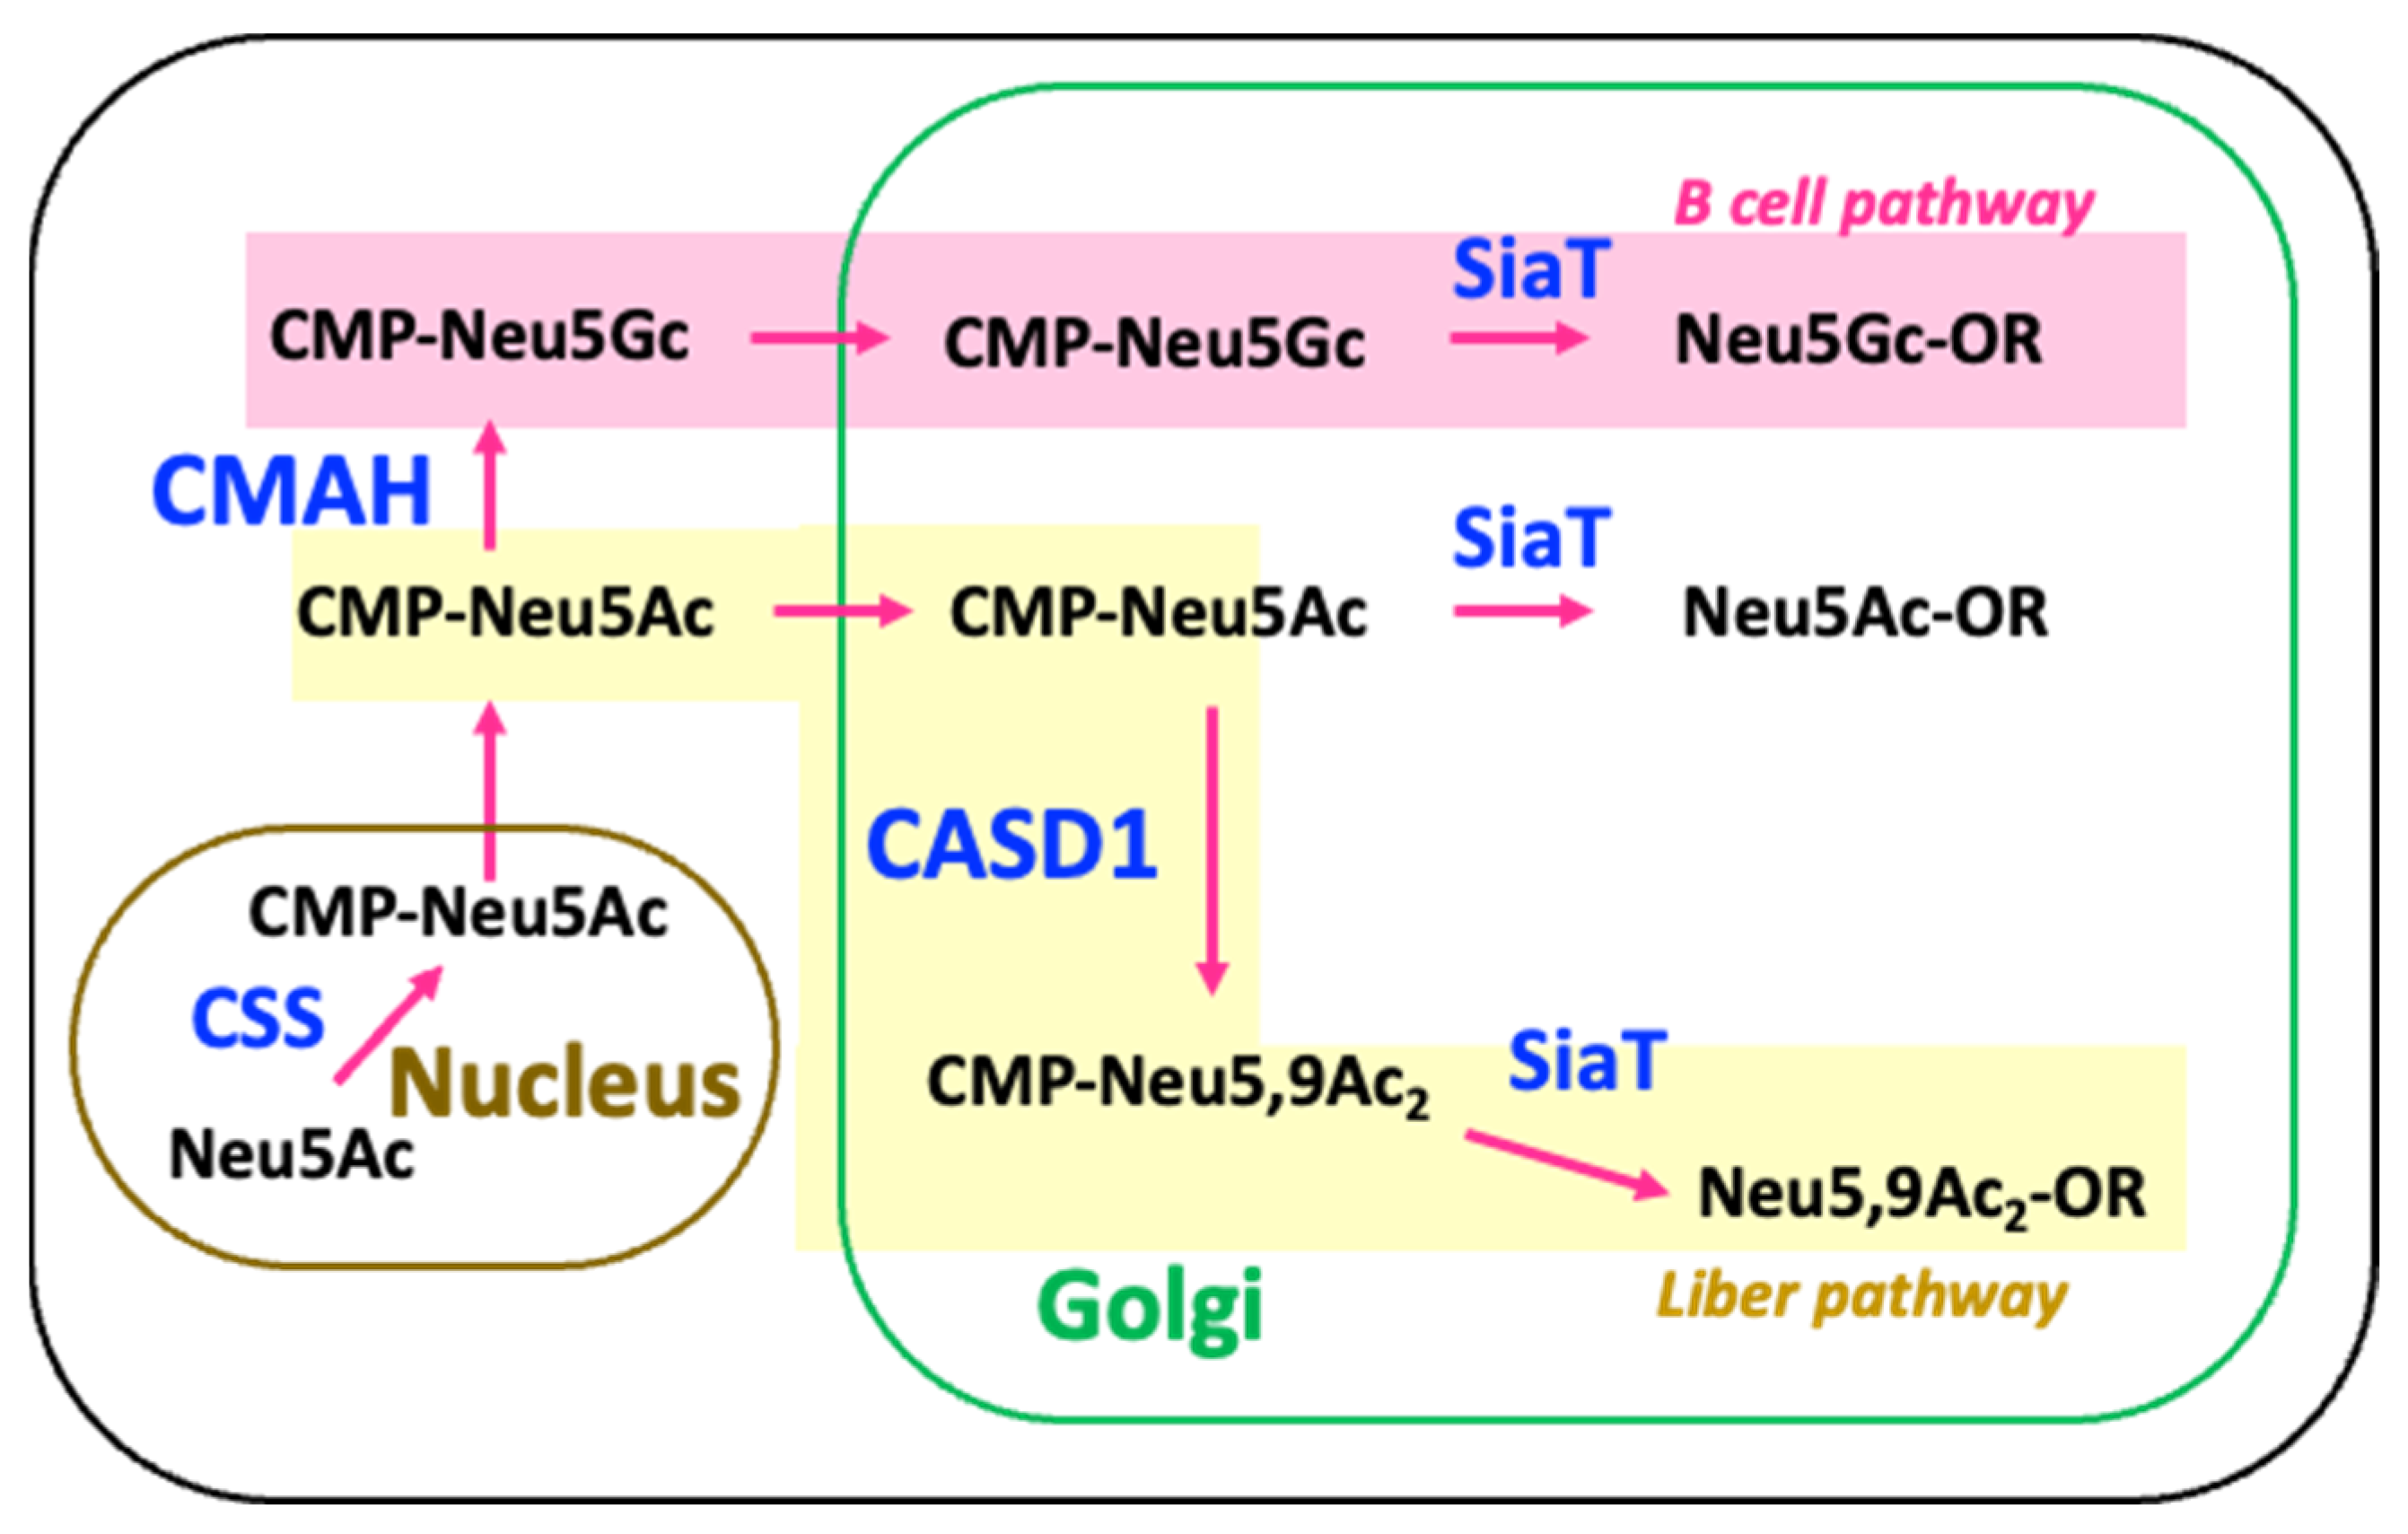
3. Discussion
4. Materials and Methods
4.1. Rat Sera
4.2. Analysis of Day-to-Day Variations in the N-Glycome of Rat Serum
4.3. Glycoproteomic Analysis of Serum Glycoproteins Other Than IgG
4.3.1. Sample Preparation
4.3.2. LC-MS/MS Measurements
4.3.3. Data Analysis
4.4. N-Glycosylation Profiling of Rat Serum IgG
4.4.1. Sample Preparation
4.4.2. Identification of Fab and Fc Fractions
4.4.3. Identification of PA-Glycans Derived from Rat Serum IgG
Supplementary Materials
Author Contributions
Funding
Institutional Review Board Statement
Informed Consent Statement
Data Availability Statement
Acknowledgments
Conflicts of Interest
Abbreviations
| AGC | Automatic gain control |
| CASD1 | Cas1 domain-containing protein 1 |
| CID | Collision-induced dissociation |
| CMAH | CMP-N-acetylneuraminic acid hydroxylase |
| CSS | CMP-sialic acid synthetase |
| DEAE | Diethylaminoethyl (anion-exchange chromatography) |
| DTT | Dithiothreitol |
| Fab | Fragment antigen-binding |
| FAIMS | Field asymmetric ion mobility spectrometry |
| Fc | Fragment crystallizable |
| GO | Gene ontology |
| HCD | Higher-energy collisional dissociation |
| HPLC | High-performance liquid chromatography |
| HRP | Horseradish peroxidase |
| IAA | Iodoacetamide |
| IgG | Immunoglobulin G |
| LC-MS/MS | Liquid chromatography–tandem mass spectrometry |
| MALDI-TOF-MS | Matrix-assisted laser desorption/ionization time-of-flight mass spectrometry |
| MS | Mass spectrometry |
| Neu5Ac | N-acetylneuraminic acid |
| Neu5,9Ac2 | O-acetylated N-acetylneuraminic acid |
| Neu5Gc | N-glycolylneuraminic acid |
| ODS | Octadecylsilyl (C18 reverse phase column) |
| PNGase F | Peptide-N-Glycosidase F |
| PSM | Peptide spectrum match |
| XIC | Extracted ion chromatogram |
References
- Peng, W.; Gutierrez Reyes, C.D.; Gautam, S.; Yu, A.; Cho, B.G.; Goli, M.; Donohoo, K.; Mondello, S.; Kobeissy, F.; Mechref, Y. MS-Based Glycomics and Glycoproteomics Methods Enabling Isomeric Characterization. Mass Spectrom. Rev. 2023, 42, 577–616. [Google Scholar] [CrossRef]
- Ruhaak, L.R.; Xu, G.; Li, Q.; Goonatilleke, E.; Lebrilla, C.B. Mass Spectrometry Approaches to Glycomic and Glycoproteomic Analyses. Chem. Rev. 2018, 118, 7886–7930. [Google Scholar] [CrossRef]
- Pan, S.; Chen, R.; Aebersold, R.; Brentnall, T.A. Mass Spectrometry Based Glycoproteomics--from a Proteomics Perspective. Mol. Cell. Proteom. 2011, 10, R110.003251. [Google Scholar] [CrossRef]
- Bagdonaite, I.; Malaker, S.A.; Polasky, D.A.; Riley, N.M.; Schjoldager, K.; Vakhrushev, S.Y.; Halim, A.; Aoki-Kinoshita, K.F.; Nesvizhskii, A.I.; Bertozzi, C.R.; et al. Glycoproteomics. Nat. Rev. Methods Primers 2022, 2, 48. [Google Scholar] [CrossRef]
- Miura, Y.; Endo, T. Glycomics and Glycoproteomics Focused on Aging and Age-Related Diseases--Glycans as a Potential Biomarker for Physiological Alterations. Biochim. Biophys. Acta 2016, 1860, 1608–1614. [Google Scholar] [CrossRef]
- Paton, B.; Suarez, M.; Herrero, P.; Canela, N. Glycosylation Biomarkers Associated with Age-Related Diseases and Current Methods for Glycan Analysis. Int. J. Mol. Sci. 2021, 22, 5788. [Google Scholar] [CrossRef]
- Lu, H.; Zhang, Y.; Yang, P. Advancements in Mass Spectrometry-Based Glycoproteomics and Glycomics. Natl. Sci. Rev. 2016, 3, 345–364. [Google Scholar] [CrossRef]
- He, K.; Baniasad, M.; Kwon, H.; Caval, T.; Xu, G.; Lebrilla, C.; Hommes, D.W.; Bertozzi, C. Decoding the Glycoproteome: A New Frontier for Biomarker Discovery in Cancer. J. Hematol. Oncol. 2024, 17, 12. [Google Scholar] [CrossRef]
- Nagai-Okatani, C.; Tomioka, A.; Tominaga, D.; Sakaue, H.; Kuno, A.; Kaji, H. Inter-Tissue Glycan Heterogeneity: Site-Specific Glycoform Analysis of Mouse Tissue N-Glycoproteomes Using MS1-Based Glycopeptide Detection Method Assisted by Lectin Microarray. Anal. Bioanal. Chem. 2025, 417, 973–988. [Google Scholar] [CrossRef]
- Gizaw, S.T.; Koda, T.; Amano, M.; Kamimura, K.; Ohashi, T.; Hinou, H.; Nishimura, S.-I. A Comprehensive Glycome Profiling of Huntington’s Disease Transgenic Mice. Biochim. Biophys. Acta 2015, 1850, 1704–1718. [Google Scholar] [CrossRef]
- Reiding, K.R.; Hipgrave Ederveen, A.L.; Rombouts, Y.; Wuhrer, M. Murine Plasma N-Glycosylation Traits Associated with Sex and Strain. J. Proteome Res. 2016, 15, 3489–3499. [Google Scholar] [CrossRef]
- Gao, W.-N.; Yau, L.-F.; Liu, L.; Zeng, X.; Chen, D.-C.; Jiang, M.; Liu, J.; Wang, J.-R.; Jiang, Z.-H. Microfluidic Chip-LC/MS-Based Glycomic Analysis Revealed Distinct N-Glycan Profile of Rat Serum. Sci. Rep. 2015, 5, 12844. [Google Scholar] [CrossRef]
- Kinoshita, M.; Yamamoto, S.; Suzuki, S. Age-Related Changes in O-Acetylation of Sialic Acids Bound to N-Glycans of Male Rat Serum Glycoproteins and Influence of Dietary Intake on Their Changes. ACS Omega 2020, 5, 18608–18618. [Google Scholar] [CrossRef]
- Habazin, S.; Mlinarević, D.; Balog, M.; Bardak, A.; Gaspar, R.; Szűcs, K.F.; Vari, S.G.; Vučković, F.; Lauc, G.; Novokmet, M.; et al. High-Throughput Rat Immunoglobulin G N-Glycosylation Profiling Revealed Subclass-Specific Changes Associated with Chronic Stress. J. Proteom. 2021, 245, 104293. [Google Scholar] [CrossRef]
- Liu, D.; Xue, Y.; Ding, D.; Zhu, B.; Shen, J.; Jin, Z.; Sun, S. Distinct O-Acetylation Patterns of Serum Glycoproteins among Humans, Mice, and Rats. J. Proteome Res. 2024, 23, 5511–5519. [Google Scholar] [CrossRef]
- Furukawa, J.-I.; Shinohara, Y.; Kuramoto, H.; Miura, Y.; Shimaoka, H.; Kurogochi, M.; Nakano, M.; Nishimura, S.-I. Comprehensive Approach to Structural and Functional Glycomics Based on Chemoselective Glycoblotting and Sequential Tag Conversion. Anal. Chem. 2008, 80, 1094–1101. [Google Scholar] [CrossRef]
- Yagi, H.; Amagasa, E.; Shiota, M.; Yamada, I.; Aoki-Kinoshita, K.F.; Kato, K. GALAXY Ver3: Updated Web Application for Glycosylation Profiling Based on 3D HPLC Map. Glycobiology 2022, 32, 646–650. [Google Scholar] [CrossRef]
- Takahashi, N.; Kato, K. GALAXY(Glycoanalysis by the Three Axes of MS and Chromatography): A Web Application That Assists Structural Analyses of N-Glycans. Trends Glycosci. Glycotechnol. 2003, 15, 235–251. [Google Scholar] [CrossRef]
- Hase, S.; Ikenaka, T.; Matsushima, Y. Structure Analyses of Oligosaccharides by Tagging of the Reducing End Sugars with a Fluorescent Compound. Biochem. Biophys. Res. Commun. 1978, 85, 257–263. [Google Scholar] [CrossRef]
- Takahashi, N.; Nakagawa, H.; Fujikawa, K.; Kawamura, Y.; Tomiya, N. Three-Dimensional Elution Mapping of Pyridylaminated N-Linked Neutral and Sialyl Oligosaccharides. Anal. Biochem. 1995, 226, 139–146. [Google Scholar] [CrossRef]
- Varki, A. Loss of N-Glycolylneuraminic Acid in Humans: Mechanisms, Consequences, and Implications for Hominid Evolution. Am. J. Phys. Anthropol. 2001, 116, 54. [Google Scholar] [CrossRef]
- Blanco, R.; Muñoz, J.P. The Role of Non-Human Sialic Acid Neu5Gc-Containing Glycoconjugates in Human Tumors: A Review of Clinical and Experimental Evidence. Biomolecules 2025, 15, 253. [Google Scholar] [CrossRef]
- Fogarty, C.A.; Fadda, E. Oligomannose N-Glycans 3D Architecture and Its Response to the FcγRIIIa Structural Landscape. J. Phys. Chem. B 2021, 125, 2607–2616. [Google Scholar] [CrossRef]
- Kizuka, Y.; Taniguchi, N. Enzymes for N-Glycan Branching and Their Genetic and Nongenetic Regulation in Cancer. Biomolecules 2016, 6, 25. [Google Scholar] [CrossRef]
- Boune, S.; Hu, P.; Epstein, A.L.; Khawli, L.A. Principles of N-Linked Glycosylation Variations of IgG-Based Therapeutics: Pharmacokinetic and Functional Considerations. Antibodies 2020, 9, 22. [Google Scholar] [CrossRef]
- Holland, M.; Yagi, H.; Takahashi, N.; Kato, K.; Savage, C.O.S.; Goodall, D.M.; Jefferis, R. Differential Glycosylation of Polyclonal IgG, IgG-Fc and IgG-Fab Isolated from the Sera of Patients with ANCA-Associated Systemic Vasculitis. Biochim. Biophys. Acta 2006, 1760, 669–677. [Google Scholar] [CrossRef]
- Mahan, A.E.; Tedesco, J.; Dionne, K.; Baruah, K.; Cheng, H.D.; De Jager, P.L.; Barouch, D.H.; Suscovich, T.; Ackerman, M.; Crispin, M.; et al. A Method for High-Throughput, Sensitive Analysis of IgG Fc and Fab Glycosylation by Capillary Electrophoresis. J. Immunol. Methods 2015, 417, 34–44. [Google Scholar] [CrossRef]
- Bondt, A.; Rombouts, Y.; Selman, M.H.J.; Hensbergen, P.J.; Reiding, K.R.; Hazes, J.M.W.; Dolhain, R.J.E.M.; Wuhrer, M. Immunoglobulin G (IgG) Fab Glycosylation Analysis Using a New Mass Spectrometric High-Throughput Profiling Method Reveals Pregnancy-Associated Changes. Mol. Cell. Proteom. 2014, 13, 3029–3039. [Google Scholar] [CrossRef]
- Takahashi, N.; Ishii, I.; Ishihara, H.; Mori, M.; Tejima, S.; Jefferis, R.; Endo, S.; Arata, Y. Comparative Structural Study of the N-Linked Oligosaccharides of Human Normal and Pathological Immunoglobulin G. Biochemistry 1987, 26, 1137–1144. [Google Scholar] [CrossRef]
- Krištić, J.; Lauc, G. The Importance of IgG Glycosylation-What Did We Learn after Analyzing over 100,000 Individuals. Immunol. Rev. 2024, 328, 143–170. [Google Scholar] [CrossRef]
- de Haan, N.; Reiding, K.R.; Krištić, J.; Hipgrave Ederveen, A.L.; Lauc, G.; Wuhrer, M. The N-Glycosylation of Mouse Immunoglobulin G (IgG)-Fragment Crystallizable Differs between IgG Subclasses and Strains. Front. Immunol. 2017, 8, 608. [Google Scholar] [CrossRef]
- Baumann, A.-M.T.; Bakkers, M.J.G.; Buettner, F.F.R.; Hartmann, M.; Grove, M.; Langereis, M.A.; de Groot, R.J.; Mühlenhoff, M. 9-O-Acetylation of Sialic Acids Is Catalysed by CASD1 via a Covalent Acetyl-Enzyme Intermediate. Nat. Commun. 2015, 6, 7673. [Google Scholar] [CrossRef]
- Chou, H.H.; Takematsu, H.; Diaz, S.; Iber, J.; Nickerson, E.; Wright, K.L.; Muchmore, E.A.; Nelson, D.L.; Warren, S.T.; Varki, A. A Mutation in Human CMP-Sialic Acid Hydroxylase Occurred after the Homo-Pan Divergence. Proc. Natl. Acad. Sci. USA 1998, 95, 11751–11756. [Google Scholar] [CrossRef]
- Naito, Y.; Takematsu, H.; Koyama, S.; Miyake, S.; Yamamoto, H.; Fujinawa, R.; Sugai, M.; Okuno, Y.; Tsujimoto, G.; Yamaji, T.; et al. Germinal Center Marker GL7 Probes Activation-Dependent Repression of N-Glycolylneuraminic Acid, a Sialic Acid Species Involved in the Negative Modulation of B-Cell Activation. Mol. Cell. Biol. 2007, 27, 3008–3022. [Google Scholar] [CrossRef]
- Kong, S.; Gong, P.; Zeng, W.-F.; Jiang, B.; Hou, X.; Zhang, Y.; Zhao, H.; Liu, M.; Yan, G.; Zhou, X.; et al. PGlycoQuant with a Deep Residual Network for Quantitative Glycoproteomics at Intact Glycopeptide Level. Nat. Commun. 2022, 13, 7539. [Google Scholar] [CrossRef]
- Ghaderi, D.; Taylor, R.E.; Padler-Karavani, V.; Diaz, S.; Varki, A. Implications of the Presence of N-Glycolylneuraminic Acid in Recombinant Therapeutic Glycoproteins. Nat. Biotechnol. 2010, 28, 863–867. [Google Scholar] [CrossRef]
- Zhu, W.; Zhou, Y.; Guo, L.; Feng, S. Biological Function of Sialic Acid and Sialylation in Human Health and Disease. Cell Death Discov. 2024, 10, 415. [Google Scholar] [CrossRef]
- Falck, D.; Thomann, M.; Lechmann, M.; Koeleman, C.A.M.; Malik, S.; Jany, C.; Wuhrer, M.; Reusch, D. Glycoform-Resolved Pharmacokinetic Studies in a Rat Model Employing Glycoengineered Variants of a Therapeutic Monoclonal Antibody. MAbs 2021, 13, 1865596. [Google Scholar] [CrossRef]
- Wauthier, V.; Sugathan, A.; Meyer, R.D.; Dombkowski, A.A.; Waxman, D.J. Intrinsic Sex Differences in the Early Growth Hormone Responsiveness of Sex-Specific Genes in Mouse Liver. Mol. Endocrinol. 2010, 24, 667–678. [Google Scholar] [CrossRef]
- Waxman, D.J.; O’Connor, C. Growth Hormone Regulation of Sex-Dependent Liver Gene Expression. Mol. Endocrinol. 2006, 20, 2613–2629. [Google Scholar] [CrossRef]
- Clodfelter, K.H.; Holloway, M.G.; Hodor, P.; Park, S.-H.; Ray, W.J.; Waxman, D.J. Sex-Dependent Liver Gene Expression Is Extensive and Largely Dependent upon Signal Transducer and Activator of Transcription 5b (STAT5b): STAT5b-Dependent Activation of Male Genes and Repression of Female Genes Revealed by Microarray Analysis. Mol. Endocrinol. 2006, 20, 1333–1351. [Google Scholar] [CrossRef]
- Yagi, H.; Saito, T.; Guu, S.-Y.; Yamakawa, N.; Shimamura, S.; Kondo, S.; Yagi-Utsumi, M.; Takai, K.; Furukawa, J.-I.; Guerardel, Y.; et al. Uncommon N-Glycan Structures in Anhydrobiotic Tardigrades. Mol. Cell. Proteom. 2025, 24, 100979. [Google Scholar] [CrossRef]
- Frankenfield, A.M.; Ni, J.; Ahmed, M.; Hao, L. Protein Contaminants Matter: Building Universal Protein Contaminant Libraries for DDA and DIA Proteomics. J. Proteome Res. 2022, 21, 2104–2113. [Google Scholar] [CrossRef]

| Peak | GU (ODS) a | Observed Mass Value b | Structure | Relative Quantity c (mol %) | |
|---|---|---|---|---|---|
| Fab | Fc | ||||
| N-1 | 8.8 | - f |  | 22.8 | 4.5 |
| N-2 | 12.0 | - | 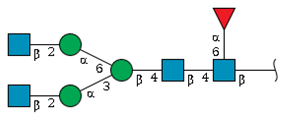 | 17.7 | 50.2 |
| N-3 | 12.6 | - | 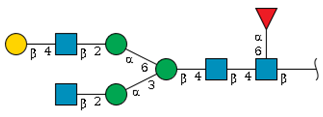 | 2.8 | 14.4 |
| N-4 | 12.8 | - | 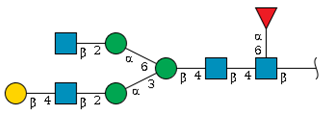 | - | 2.1 |
| N-5 | 16.7 | - | 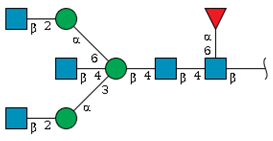 | 9.4 | 9.9 |
| N-others e | 3.4 | 3.7 | |||
| S1-1 | 10.0 | 2054.6 | 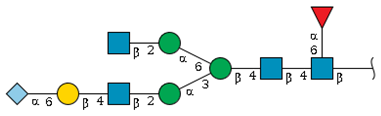 | 1.6 | 3.0 |
| S1-2 | 10.5 | 2216.7 | 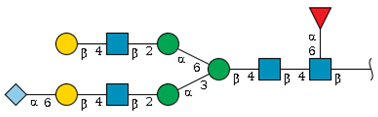 | 2.3 | 3.9 |
| S1-3 | 10.8 | - |  | - | 4.3 |
| S1-4 d | 12.7 | 2257.7 | 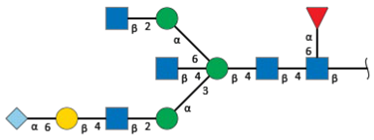 | 5.0 | - |
| S1-5 d | 15.1 | 2545.8 | 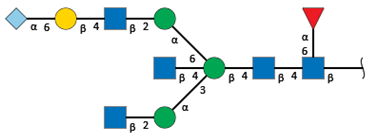 | 6.5 | 1.8 |
| S1-others e | 1.6 | 0.7 | |||
| S2-1 | 8.7 | 2545.8 | 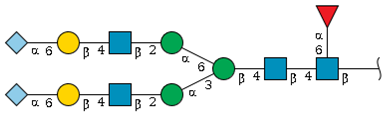 | 18.2 | 1.4 |
| S2-1 d | 11.2 | 2748.9 | 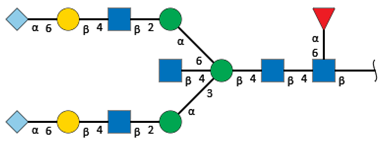 | 7.2 | - |
| S2-others e | 1.5 | 0.1 | |||
| Total | 100 | 100 | |||
Disclaimer/Publisher’s Note: The statements, opinions and data contained in all publications are solely those of the individual author(s) and contributor(s) and not of MDPI and/or the editor(s). MDPI and/or the editor(s) disclaim responsibility for any injury to people or property resulting from any ideas, methods, instructions or products referred to in the content. |
© 2025 by the authors. Licensee MDPI, Basel, Switzerland. This article is an open access article distributed under the terms and conditions of the Creative Commons Attribution (CC BY) license (https://creativecommons.org/licenses/by/4.0/).
Share and Cite
Yagi, H.; Kondo, S.; Murakami, R.; Yogo, R.; Yanaka, S.; Umezawa, F.; Yagi-Utsumi, M.; Fujita, A.; Okina, M.; Hashimoto, Y.; et al. Temporal and Sex-Dependent N-Glycosylation Dynamics in Rat Serum. Int. J. Mol. Sci. 2025, 26, 7266. https://doi.org/10.3390/ijms26157266
Yagi H, Kondo S, Murakami R, Yogo R, Yanaka S, Umezawa F, Yagi-Utsumi M, Fujita A, Okina M, Hashimoto Y, et al. Temporal and Sex-Dependent N-Glycosylation Dynamics in Rat Serum. International Journal of Molecular Sciences. 2025; 26(15):7266. https://doi.org/10.3390/ijms26157266
Chicago/Turabian StyleYagi, Hirokazu, Sachiko Kondo, Reiko Murakami, Rina Yogo, Saeko Yanaka, Fumiko Umezawa, Maho Yagi-Utsumi, Akihiro Fujita, Masako Okina, Yutaka Hashimoto, and et al. 2025. "Temporal and Sex-Dependent N-Glycosylation Dynamics in Rat Serum" International Journal of Molecular Sciences 26, no. 15: 7266. https://doi.org/10.3390/ijms26157266
APA StyleYagi, H., Kondo, S., Murakami, R., Yogo, R., Yanaka, S., Umezawa, F., Yagi-Utsumi, M., Fujita, A., Okina, M., Hashimoto, Y., Hotta, Y., Kato, Y., Nakajima, K., Furukawa, J.-i., & Kato, K. (2025). Temporal and Sex-Dependent N-Glycosylation Dynamics in Rat Serum. International Journal of Molecular Sciences, 26(15), 7266. https://doi.org/10.3390/ijms26157266