Article

C2H2 Zinc Finger Proteins GIS2 and ZFP8 Regulate Trichome Development via Hormone Signaling in Arabidopsis

by
Muhammad Umair Yasin
1,†,
Lili Sun
2,†,
Chunyan Yang
1,
Bohan Liu
3 and
Yinbo Gan
1,*
1
Zhejiang Key Laboratory of Crop Germplasm, Department of Agronomy, College of Agriculture and Biotechnology, Zhejiang University, Hangzhou 310058, China
2
Department of Biostatistics, Vanderbilt University Medical Center, Vanderbilt University, Nashville, TN 37232, USA
3
College of Agronomy, Hunan Agricultural University, Changsha 410128, China
*
Author to whom correspondence should be addressed.
These authors contributed equally to this work.
Int. J. Mol. Sci. 2025, 26(15), 7265; https://doi.org/10.3390/ijms26157265
Submission received: 11 June 2025 / Revised: 17 July 2025 / Accepted: 25 July 2025 / Published: 27 July 2025

Abstract

Trichomes are specialized epidermal structures that protect plants from environmental stresses, regulated by transcription factors integrating hormonal and environmental cues. This study investigates the roles of two C2H2 zinc finger proteins, GIS2 and ZFP8, in regulating trichome patterning in Arabidopsis thaliana. Using dexamethasone-inducible overexpression lines, transcriptomic profiling, and chromatin immunoprecipitation, we identified 142 GIS2- and 138 ZFP8-associated candidate genes involved in sterol metabolism, senescence, and stress responses. GIS2 positively and directly regulated the expression of SQE5, linked to sterol biosynthesis and drought tolerance, and repressed SEN1, a senescence marker associated with abscisic acid and phosphate signaling. ZFP8 modulated stress-related target genes, including PR-4 and SPL15, with partial functional overlap between GIS family members. Spatially, GIS2 functions in inflorescence trichomes via integrating gibberellin-cytokinin pathways, while ZFP8 influences leaf trichomes through cytokinin and abscisic acid signal. Gibberellin treatment stabilized GIS2 protein and induced SQE5 expression, whereas SEN1 repression was gibberellin-independent. Chromatin immunoprecipitation and DEX-CHX experiment confirmed GIS2 binding to SQE5 and SEN1 promoters at conserved C2H2 motifs. These findings highlight hormone-mediated transcriptional regulation of trichome development by GIS2 and ZFP8, offering mechanistic insight into signal integration. The results provide a foundation for future crop improvement strategies targeting trichome-associated stress resilience.

1. Introduction

Trichomes, hair-like epidermal structures on plant aerial surfaces, serve critical ecological roles in mitigating herbivory, ultraviolet (UV) radiation, and water loss [1,2,3]. In economically important crops such as cotton and tobacco, trichomes contribute to fiber production and the synthesis of secondary metabolites [4]. In Arabidopsis thaliana, trichome development has emerged as a model system for studying cell fate determination, differentiation, and the integration of hormonal and environmental signals. A core regulatory network centered on the MYB-bHLH-WD40 (MBW) complex—comprising GLABRA1 (GL1), GLABRA3 (GL3)/ENHANCER OF GLABRA3 (EGL3), and TRANSPARENT TESTA GLABRA1 (TTG1)—activates trichome-promoting genes such as GLABRA2 (GL2) [5,6,7,8]. Trichome patterning is administered by two competing models. The activation-inhibition mechanism involves the MBW complex inducing trichome initiation while stimulating inhibitors such as TRIPTYCHON (TRY) and CAPRICE (CPC), creating a self-organizing feedback loop to prevent adjacent cell differentiation [9,10,11]. In contrast, the activator-depletion model proposes that trichome precursors sequester TTG1, limiting its availability in neighboring cells [10,12].
Hormonal crosstalk intricately modulates trichome development. Gibberellins (GA) promote initiation by destabilizing DELLA repressors, which otherwise suppress GL1 and GIS family proteins [13,14]. Cytokinins (CK) antagonize GA signaling in a dose-dependent manner, reducing trichome density on mature leaves through mechanisms involving ARABIDOPSIS RESPONSE REGULATOR (ARR) genes [15,16], while jasmonic acid (JA) synergizes with GA via JAZ protein degradation, releasing GL3/EGL3 to activate trichome genes [17]. This crosstalk ensures precise spatiotemporal control of trichome development, enabling adaptation to environmental and developmental cues. However, the integration of hormonal signals (e.g., GA, CK, and JA) with environmental factors remains incompletely resolved, particularly the roles of C2H2 zinc finger proteins like GIS2 and ZFP8 in mediating these interactions, highlighting the need for further research into these regulatory intersections.
C2H2 zinc finger proteins (ZFPs) function as key transcriptional regulators in trichome development by integrating hormonal signaling and environmental responses through sequence-specific DNA interactions. Plant C2H2 ZFPs are characterized by conserved cysteine (Cys) and histidine (His) residues that coordinate zinc ions, forming a “finger-like” DNA-binding domain [18,19]. This structural configuration enables sequence-specific interactions, often targeting AG/CT-rich motifs such as AGCTNAC, which are critical for regulating developmental and stress-responsive pathways [20,21,22,23,24]. A hallmark of plant-specific C2H2 ZFPs, such as GIS2 and ZFP8, is the QALGGH pentapeptide motif within their zinc finger loops, which enhances DNA-binding specificity to plant cis-elements and distinguishes them from animal counterparts [20,25,26]. Functionally, these proteins act as molecular hubs, integrating environmental and endogenous signals to regulate diverse processes, including development, hormone signaling, and abiotic stress responses [27]. For example, the C2H2 ZFP SUPERMAN maintains floral meristem boundaries by repressing WUSCHEL expression [28,29], while ZAT12 enhances oxidative stress tolerance by activating ROS-scavenging enzymes [30]. Similarly, STZ/ZAT10 integrates salt and drought responses through ABA-dependent pathways [31]. A subset of C2H2 ZFPs, including GIS, GIS2, and ZFP8, specifically regulate trichome development through hormonal signals. GIS promotes trichome initiation on inflorescence stems through gibberellin (GA) signal upstream of GLABRA1 (GL1) [32], while GIS2 and ZFP8 regulate trichome development by integrating gibberellin (GA) and cytokinin (CK) pathways. GIS2 and ZFP8 exhibit distinct spatial roles: GIS2 primarily influences floral organ trichomes, whereas ZFP8 modulates trichomes on stems and leaves [13,33]. Despite their conserved QALGGH motif and overlapping regulatory roles, key questions remain unresolved. These include the direct transcriptional targets of GIS2 and ZFP8, their interactions with hormone pathways, and the evolutionary drivers of their functional divergence. Collectively, C2H2 ZFPs exemplify functional versatility, bridging growth regulation and stress adaptation. Their structural conservation, coupled with lineage-specific motifs like QALGGH, highlights their evolutionary specialization in plant gene regulatory networks. Future studies should prioritize elucidating their context-specific DNA-binding dynamics and signaling crosstalk in developmental and stress contexts, as addressed in this work.
Hormonal crosstalk between gibberellin (GA) and cytokinin (CK) signaling pathways represents an essential regulatory axis in trichome regulation, with the GLABROUS INFLORESCENCE STEMS (GIS) family of C2H2 zinc finger proteins (ZFPs) acting as key molecular mediators. GA promotes trichome initiation by destabilizing DELLA repressor proteins, which suppress the expression of GIS family genes (e.g., GIS, GIS2, and ZFP8) [13,32,34]. Conversely, CK antagonizes GA signaling in a dose-dependent manner, reducing trichome density through mechanisms involving ARABIDOPSIS RESPONSE REGULATOR (ARR) genes, though the molecular intermediates linking these pathways remain unidentified [15,16]. Recent studies highlight the hierarchical regulation within the GIS family: GA and CK signals converge to regulate trichome density, with GIS2 and ZFP8 exhibiting distinct hormonal sensitivities [13,33,35]. Functional redundancy and spatial specialization exist among GIS paralogs; GIS2 primarily regulates floral trichomes, whereas ZFP8 governs stem and leaf trichomes, partially compensating for GIS loss [36].
Despite these advances, critical knowledge gaps persist. The regulatory cascades downstream of GIS2 and ZFP8, including their putative targets such as PR-4 and SPL15 (already characterized for GIS), remain uncharacterized. Furthermore, the mechanisms by which GIS2 and ZFP8 differentially integrate GA and CK signals are unclear, as are the evolutionary drivers underlying their promoter-binding specificity and sub-functionalization. Although ZFP5 has been identified as a GA-responsive regulator linking GIS and ZFP8 [37,38,39], it is unknown whether GIS2 and ZFP8 directly mediate hormone signaling or require additional intermediaries. Additionally, the extent of functional redundancy and divergence among GIS family members in fine-tuning trichome development in response to environmental cues remains unresolved. Addressing these questions will clarify how hormonal and developmental signals orchestrate trichome patterning through the GIS network, offering broader insights into plant developmental plasticity.
Trichome development, a key determinant of plant and environment interactions, is dynamically regulated by hormonal and environmental cues through specialized transcription factors. C2H2 zinc finger proteins play a crucial role in coordinating growth and stress adaptation; however, the mechanistic basis by which homologs GIS2 and ZFP8 integrate gibberellin (GA) and cytokinin (CK) crosstalk to modulate trichome patterning remains unclear. This study addresses this gap by pursuing three objectives: identifying transcriptional targets of GIS2 and ZFP8, using chromatin immunoprecipitation (ChIP) and DEX-CHX methods integrated with transcriptomic profiling, and examining their roles in sterol metabolism (SQE5), senescence (SEN1), and stress adaptation (PR-4, WRKY25); investigating how GA and CK signaling influence their activity, through hormone responsiveness assays, in the context of promoter-binding specificity and functional divergence; and comparing potential redundancy and specialization between GIS2 and ZFP8 by analyzing single and double mutants (gis2 zfp8) and RNAi lines, focusing on shared targets like SPL15 that influence trichome patterning during developmental phase transitions. By synthesizing ChIP-qPCR, microarray analysis, and mutant characterization, this work examines how GIS2 and ZFP8 may have evolved divergent regulatory networks while retaining overlapping functions in trichome development. The significance of this research lies in its potential to expand the trichome regulatory framework, offering mechanistic insights into how C2H2 zinc finger proteins balance redundancy and specialization to coordinate development with environmental responses. Notably, GIS2 regulation of SQE5 and SEN1 suggests possible links between trichome morphogenesis and drought or ABA signaling, while ZFP8 regulation of PR-4 (pathogen defense) may connect trichome traits to biotic resilience. Elucidating GIS2 and ZFP8 networks could provide a conceptual foundation for future strategies such as CRISPR-based approaches to engineer crops with optimized trichome features and enhanced adaptability to environmental challenges.

2. Results

2.1. Expression of GIS2 and ZFP8 in the pOp6/LhGR System

To analyze the temporal expression profiles of GIS2 and ZFP8 under dexamethasone (Dex) induction, T2 transgenic lines of pOp6-GIS2:LhGR and pOp6-ZFP8:LhGR were screened on kanamycin- and hygromycin-containing media. When the primary stems reached approximately 5 cm, Dex was applied, and tissues were harvested at 2 h, 4 h, and 6 h post-treatment. RNA extraction and subsequent cDNA synthesis revealed that GIS2 expression in lines pOp6-GIS2:LhGR-5-1 and pOp6-GIS2:LhGR-6-2 increased progressively and reached a stable level at 4 h after Dex induction (Figure 1A,B), closely resembling the temporal pattern of the related GIS gene [40]. Similarly, ZFP8 expression in lines pOp6-ZFP8:LhGR-3-1 and pOp6-ZFP8:LhGR-6-3 exhibited comparable kinetics, with peak transcript levels observed at 4 h (Figure 1C,D). Notably, error bars in Figure 1A–D reflect minimal biological variability (SEM, n = 3), and Student’s t-test analysis confirmed statistically significant induction (p < 0.01) at 4 h and 6 h compared to mock controls (Figure 1 legend). Based on these results, the 4 h time point was selected for downstream microarray analysis. Tissues from the high-expression lines pOp6-GIS2:LhGR-5-1 and pOp6-ZFP8:LhGR-6-3 were used to examine Dex-responsive gene expression changes. This unified experimental framework allowed consistent analysis of early transcriptional responses potentially mediated by GIS2 and ZFP8, providing a foundation to identify candidate downstream genes regulated under inducible conditions.

2.2. Identification of Downstream Genes Involved in GIS2 and ZFP8 Regulatory Pathways via Microarray Data Analysis

To elucidate the molecular mechanisms by which GIS2 and ZFP8 may influence trichome development, transcriptomic profiling was performed using Affymetrix microarrays on Arabidopsis wild type (WT), mutants (gis2, zfp8), dexamethasone (Dex)-induced overexpression lines (pOp6-GIS2:LhGR-5-1 and pOp6-ZFP8:LhGR-6-3), and mock-treated controls, with three biological replicates per condition. In gis2 mutants, 1603 genes were significantly upregulated (fold-change > 1.5, q < 0.01) and 1016 downregulated (fold-change < 0.67, q < 0.01) compared to WT, while Dex-induced GIS2 overexpression led to 641 upregulated and 921 downregulated genes. Cross-comparison identified 58 genes upregulated in gis2 but repressed upon GIS2 induction and 84 genes downregulated in gis2 but induced following Dex treatment, yielding 142 GIS2-associated differentially expressed genes. Similarly, zfp8 mutants exhibited 1214 upregulated and 831 downregulated genes, while ZFP8 overexpression resulted in 1446 upregulated and 1743 downregulated transcripts. Among these, 85 genes were upregulated in zfp8 but suppressed by Dex-induced ZFP8, and 53 genes were downregulated in zfp8 but induced upon overexpression, identifying 138 ZFP8-associated candidates. Gene ontology (GO) enrichment analysis showed that these gene sets were significantly associated with catalytic activity, metabolic processes, binding, and cellular components. Notably, GIS2-associated genes included At5g24150 (SQE5), involved in sterol biosynthesis, and At4g35770 (SEN1), linked to senescence regulation, while ZFP8-associated candidates featured PR-4 (At3g04720) and SPL15 (At3g57920), genes related to the stress response and phase transition (Table 1, Table 2, Table 3 and Table 4). These overlapping genes with inverse expression profiles between mutant and overexpression lines are considered as potential transcriptional targets and were further evaluated by using ChIP-qPCR and hormone response assays. Collectively, the data support a model in which GIS2 and ZFP8 participate in partially overlapping but distinct regulatory networks influencing trichome development through transcriptional modulation of stress- and hormone-related genes.

2.3. Transcription Factor Analysis of 142 GIS2-Regulated Genes and 138 ZFP8-Regulated Genes

Microarray analysis identified 142 GIS2-associated genes, comprising 84 genes downregulated and 58 genes upregulated in the gis2 mutant compared to the wild type. The top 20 most significantly downregulated genes (Table 1) and the top 20 most upregulated genes (Table 2) were selected for validation via quantitative PCR (q-PCR). In 35S:GIS2 overexpression lines, 19 out of 20 downregulated genes (excluding GIS2 itself) showed expression patterns that positively correlated with GIS2 levels, while the 20 upregulated genes displayed inverse trends (Figure 2A,B). Among these, At4g01080 (hypothetical protein) and At5g24150 (SQE5, squalene monooxygenase) showed pronounced upregulation in 35S:GIS2 and marked downregulation in gis2, suggesting their transcription is influenced by GIS2 activity. Conversely, At4g35770 (SEN1, senescence-associated gene), At4g17460 (homeobox-leucine zipper protein), At3g45860 (receptor-like kinase), and At5g45890 (cysteine protease) were identified as candidates potentially repressed by GIS2. For ZFP8, microarray analysis identified 138 associated genes, with 53 downregulated and 85 upregulated in the zfp8 mutant. q-PCR validation of the 20 most significantly altered genes (Table 3 and Table 4) revealed that 19 out of 20 downregulated genes (excluding ZFP8) exhibited a positive correlation with ZFP8 expression, while the 20 upregulated genes were inversely regulated (Figure 2C,D). Key ZFP8-associated targets included At1g02930 (glutathione S-transferase), At3g22060 (unknown protein), At3g04720 (PR-4), At1g51800 (receptor kinase), and At3g16530 (lectin-like protein), many of which are known to be involved in abiotic and biotic stress responses. Notably, PR-4 appeared in both GIS2 and ZFP8 gene sets (Table 2 and Table 3), highlighting a point of functional convergence within their regulatory networks. These findings suggest that both GIS2 and ZFP8 function as transcriptional activators of positively regulated targets and potential repressors of negatively correlated genes, as reflected in the inverse expression profiles validated by q-PCR. The high concordance between microarray data and q-PCR results (Figure 2) supports the robustness of the identified gene sets. The inclusion of stress-associated (At3g04720 and At1g02930) and developmental (At3g16530) genes among ZFP8-regulated targets further underscores its dual role in trichome patterning and environmental adaptation.

2.4. q-PCR Validation of Downstream Genes Regulated by GIS2 and ZFP8

Transcription factors (TFs) play pivotal roles in regulating trichome development. Among the 142 GIS2-associated genes (Figure 3), 10 were annotated as transcription factors, including GIS2 itself. Of these, four TFs appeared to be upregulated and five downregulated in response to GIS2 activity (Table 5 and Table 6). Quantitative PCR (q-PCR) in gis2 mutants and 35S:GIS2 (O-3-1) overexpression lines confirmed that the four upregulated TFs displayed ≥ 1.5-fold increased expression in overexpression lines (Figure 4A), with At5g60890 (an MYB family transcription factor homologous to ATR1/MYB34) showing the strongest induction. Among the downregulated TFs, At4g17460 (homeobox-leucine zipper protein HAT1), known to influence trichome initiation, was notably suppressed in gis2 mutants (Figure 4B). For the 138 ZFP8-associated genes (Figure 5), 16 encoded TFs, including ZFP8. Of these, eight were upregulated and seven downregulated in the zfp8 mutant background. q-PCR validation in zfp8 mutants and 35S:ZFP8 (O-1-1) lines revealed ≥ two-fold induction of the eight positively regulated TFs (Figure 4C), including AT1G68840 (AP2-EREBP family member RAV2) and AT2G30250 (WRKY25), both implicated in stress response signaling. Among the negatively associated TFs, AT1G53160 (SPL4), AT3G57920 (SPL15), AT5G15830 (a bZIP family TF), and AT5G44210 (an ERF subfamily member) were significantly upregulated in zfp8 mutants, suggesting they may be negatively modulated by ZFP8 (Figure 4D). Importantly, SPL15 (AT3G57920), previously reported as a GIS target, was also among the GIS2- and ZFP8-influenced genes, highlighting a possible regulatory intersection. The consistent negative regulation of SPL15 and SPL4 by both GIS2 and ZFP8 suggests functional overlap between their pathways, potentially contributing to the coordination of trichome development with phase transition events such as the shift from vegetative to reproductive growth.

2.5. Screening of GIS2 Candidate Target Genes Using Dex and Cycloheximide Treatment

To further assess whether GIS2 directly regulates the candidate genes identified through transcriptomic profiling, a dexamethasone (Dex)-inducible 35S:GIS2-GR construct was introduced into gis2 mutants, resulting in 12 independent transgenic lines (Figure 6A). Among them, line 35S:GIS2-GR::gis2-8-1, which showed the highest GIS2 expression by q-PCR (Figure 6B), was selected for analysis. Seedlings were subjected to four treatments: mock, Dex alone, Dex with cycloheximide (CHX), and CHX alone. RNA was extracted 2 h after the second spray for q-PCR analysis. For positively regulated genes including At5g24150 (SQE5), At4g01080 (hypothetical protein), and At5g60890 (MYB34), expression was significantly induced under Dex treatment compared to mock. Notably, only SQE5 maintained elevated expression in the Dex + CHX treatment (Figure 6C), suggesting that its regulation by GIS2 may not require de novo protein synthesis and is, therefore, a strong candidate for direct transcriptional activation. For negatively associated targets, such as At4g17460 (HAT1), At4g35770 (SEN1), At3g45860 (receptor-like kinase), and At5g45890 (SAG12), Dex treatment reduced transcript levels. Among these, only SEN1 remained significantly downregulated in the Dex + CHX condition (Figure 6D), implicating it as a putative direct repression target of GIS2. These expression trends mirror patterns observed in earlier transcriptomic datasets and are consistent with established protocols [33,41]. While additional assays such as ChIP are needed to conclusively determine direct binding, the CHX inhibition approach provides strong evidence that SQE5 and SEN1 are likely direct transcriptional targets of GIS2, highlighting their relevance in linking trichome development to hormonal and senescence pathways.

2.6. ChIP Analysis Reveals GIS2 Binding to At5g24150 and At4g35770 Promoters

Chromatin immunoprecipitation (ChIP) assays using 35S:GIS2-GFP transgenic lines provided further evidence for GIS2 binding to the promoter regions of two candidate target genes, At5g24150 (SQE5) and At4g35770 (SEN1), which were previously implicated through transcriptomic and CHX-based expression analyses (Figure 7). Within the 2000 bp upstream regions of both genes, four conserved C2H2 zinc finger binding motifs (A[AG/CT]CNAC) were identified. ChIP-qPCR revealed that promoter fragments II and III of SQE5 and fragments III and IV of SEN1 were significantly enriched following anti-GFP immunoprecipitation (Figure 7B,D), suggesting direct binding by GIS2. Functionally, SQE5 encodes a squalene monooxygenase involved in sterol biosynthesis and has been associated with drought adaptation, similar to its homolog SQE1 [42]. In contrast, SEN1 is a senescence-associated gene responsive to darkness and abscisic acid (ABA) signaling, consistent with its known induction in stress-related and developmental transitions [43,44]. These ChIP results corroborate previous q-PCR and expression data (Figure 4 and Figure 6), supporting the model that GIS2 exerts dual regulatory roles by directly activating positively regulated targets such as SQE5 and repressing genes like SEN1. The promoter-specific binding highlights GIS2’s function in modulating both developmental timing and stress responses through targeted transcriptional control (Figure 7A,C).

2.7. GA-Induced Expression of GIS2 and Its Downstream Target Genes

To validate GA-induced regulation of GIS2 beyond the transcriptional level, we analyzed GIS2 protein dynamics in 35S:GIS2-GFP plants treated with 100 µM gibberellic acid (GA). Western blotting revealed a significant increase in GIS2 protein abundance after 8 h of GA treatment (Figure 8A), confirming GA-dependent regulation at the protein level. This stabilization supports the role of GIS2 in integrating GA signaling with trichome development, as DELLA protein degradation by GA is known to relieve repression on GIS2 accumulation [13]. We further examined the GA responsiveness of two GIS2-regulated targets: At5g24150 (SQE5), a positively regulated gene, and At4g35770 (SEN1), a negatively regulated one. In wild-type (WT) plants, SQE5 expression increased significantly after 4 to 6 h of GA treatment (Figure 8B), while SEN1 exhibited no significant response in either WT or the GA-deficient ga1-3 mutant (Figure 8B). Given that SEN1 is known to respond to abscisic acid (ABA) and phosphate starvation [43,44,45], its regulation by GIS2 may occur through GA-independent pathways or in a context-dependent manner. These results collectively demonstrate that GA enhances GIS2 protein levels and promotes SQE5 expression, whereas SEN1 repression by GIS2 appears uncoupled from GA signaling. This divergence in hormonal responsiveness highlights distinct regulatory modes—GIS2 links trichome morphogenesis to sterol biosynthesis via GA-responsive SQE5, while modulating SEN1 through potentially ABA- or nutrient-mediated mechanisms (Figure 8).

2.8. Functional Analysis of ZFP8-Regulated Genes in Biological Processes

Functional annotation of ZFP8-associated genes revealed roles in both stress adaptation and developmental regulation. Upregulated targets such as At1g02930 (glutathione S-transferase), At3g22060 (unknown protein), At3g04720 (PR-4), a pathogenesis-related protein, At1g51800 (receptor kinase), At3g16530 (lectin-like protein), and transcription factors At1g68840 (RAV2) and At2g30250 (WRKY25) were enriched in pathways related to hormone signaling (abscisic acid and ethylene), abiotic stress responses (including cold, drought, and salinity), pathogen defense, toxin catabolism, and transcriptional control (Figure 9A). In contrast, downregulated genes such as At5g35480, At3g28510, At3g14395, At1g03170, and At3g05890 and transcription factors At1g53160 (SPL4), At3g57920 (SPL15), At5g15830 (bZIP-type), and At5g44210 (ERF family) were linked to ethylene signaling, defense responses, cell expansion, transcriptional repression, and phase transition control (Figure 9B). Although ZFP8 is a known regulator of trichome patterning on stem leaves [13]—a trait contributing to water retention, temperature buffering, and protection against abiotic stress [2]—the specific roles of its downstream genes in trichome formation remain to be elucidated. Notably, the ZFP8-modulated stress-responsive pathways, such as ABA-related signaling via RAV2 and WRKY25 and pathogen defense via PR-4, align with the protective functions of trichomes, suggesting potential indirect links. The identification of PR-4 as a shared target of GIS2 and ZFP8 (Figure 4, Table 2 and Table 3) supports a role in biotic stress resistance, possibly mediated through trichome architecture. Similarly, SPL15 (Figure 9B; Table 7 and Table 8), known to influence developmental phase transitions, further connects ZFP8 activity to growth stage-dependent trichome dynamics. While the functional relevance of these targets in direct trichome development remains unresolved, their integration into hormone and defense pathways underscores ZFP8’s broader regulatory capacity. Future studies are necessary to clarify whether these targets contribute directly to trichome morphogenesis or enhance environmental resilience through secondary pathways regulated by ZFP8.

3. Discussion

Plant tissue and organ morphogenesis is dependent on an exact coordination of cell cycle progression and differentiation, which is mediated by conserved regulators such as cyclin-dependent kinases (CDKs) and cyclins [46]. Metabolic signals, including sugar availability, help to further refine these mechanisms through combining growth with developmental barriers to ensure appropriate cellular patterns [47,48]. Trichome development in Arabidopsis thaliana provides a model of this coordination in which epidermal cells move from mitotic division to endoreduplication—a cell cycle variant that increases nuclear DNA content without cytokinesis. This change starts trichome differentiation; trichome size and branching complexity are determined by endoreduplication cycle count, hence defining important features for stress resilience [49]. Recent studies show that, along with nuclear expansion with trichome morphogenesis, histone acetyltransferases like GCN5 and ubiquitin-mediated proteolysis of cell cycle inhibitors dynamically control this process [50,51]. Phytohormones, particularly gibberellins (GAs) and jasmonates (JAs), influence trichome density by connecting developmental cues with stimulation from the environment. GA signaling induces trichome initiation by degrading DELLA repressors via the GID1 receptor, releasing inhibition on trichome-promoting factors [52] (Figure 8A). JA, on the other hand, balances defense priority with growth by altering trichome elongation through MYC transcription factors [53].
The interaction between these pathways provides adaptive plasticity, allowing plants to enhance trichome-mediated defenses in response to biotic or abiotic stress while preserving developmental homeostasis [54]. The C2H2 zinc finger transcription factors GIS, GIS2, and ZFP8, which direct trichome patterning across many plant organs, are fundamental members of this regulatory network. Acting upstream of important regulators like GLABRA1 (GL1), GIS, and GIS2 mostly control trichome initiation on inflorescence stems and branches, integrating GA and cytokinin signals [41]. However, ZFP8 controls trichome development on leaves by mediating cytokinin responses downstream of GL3 and TRY [
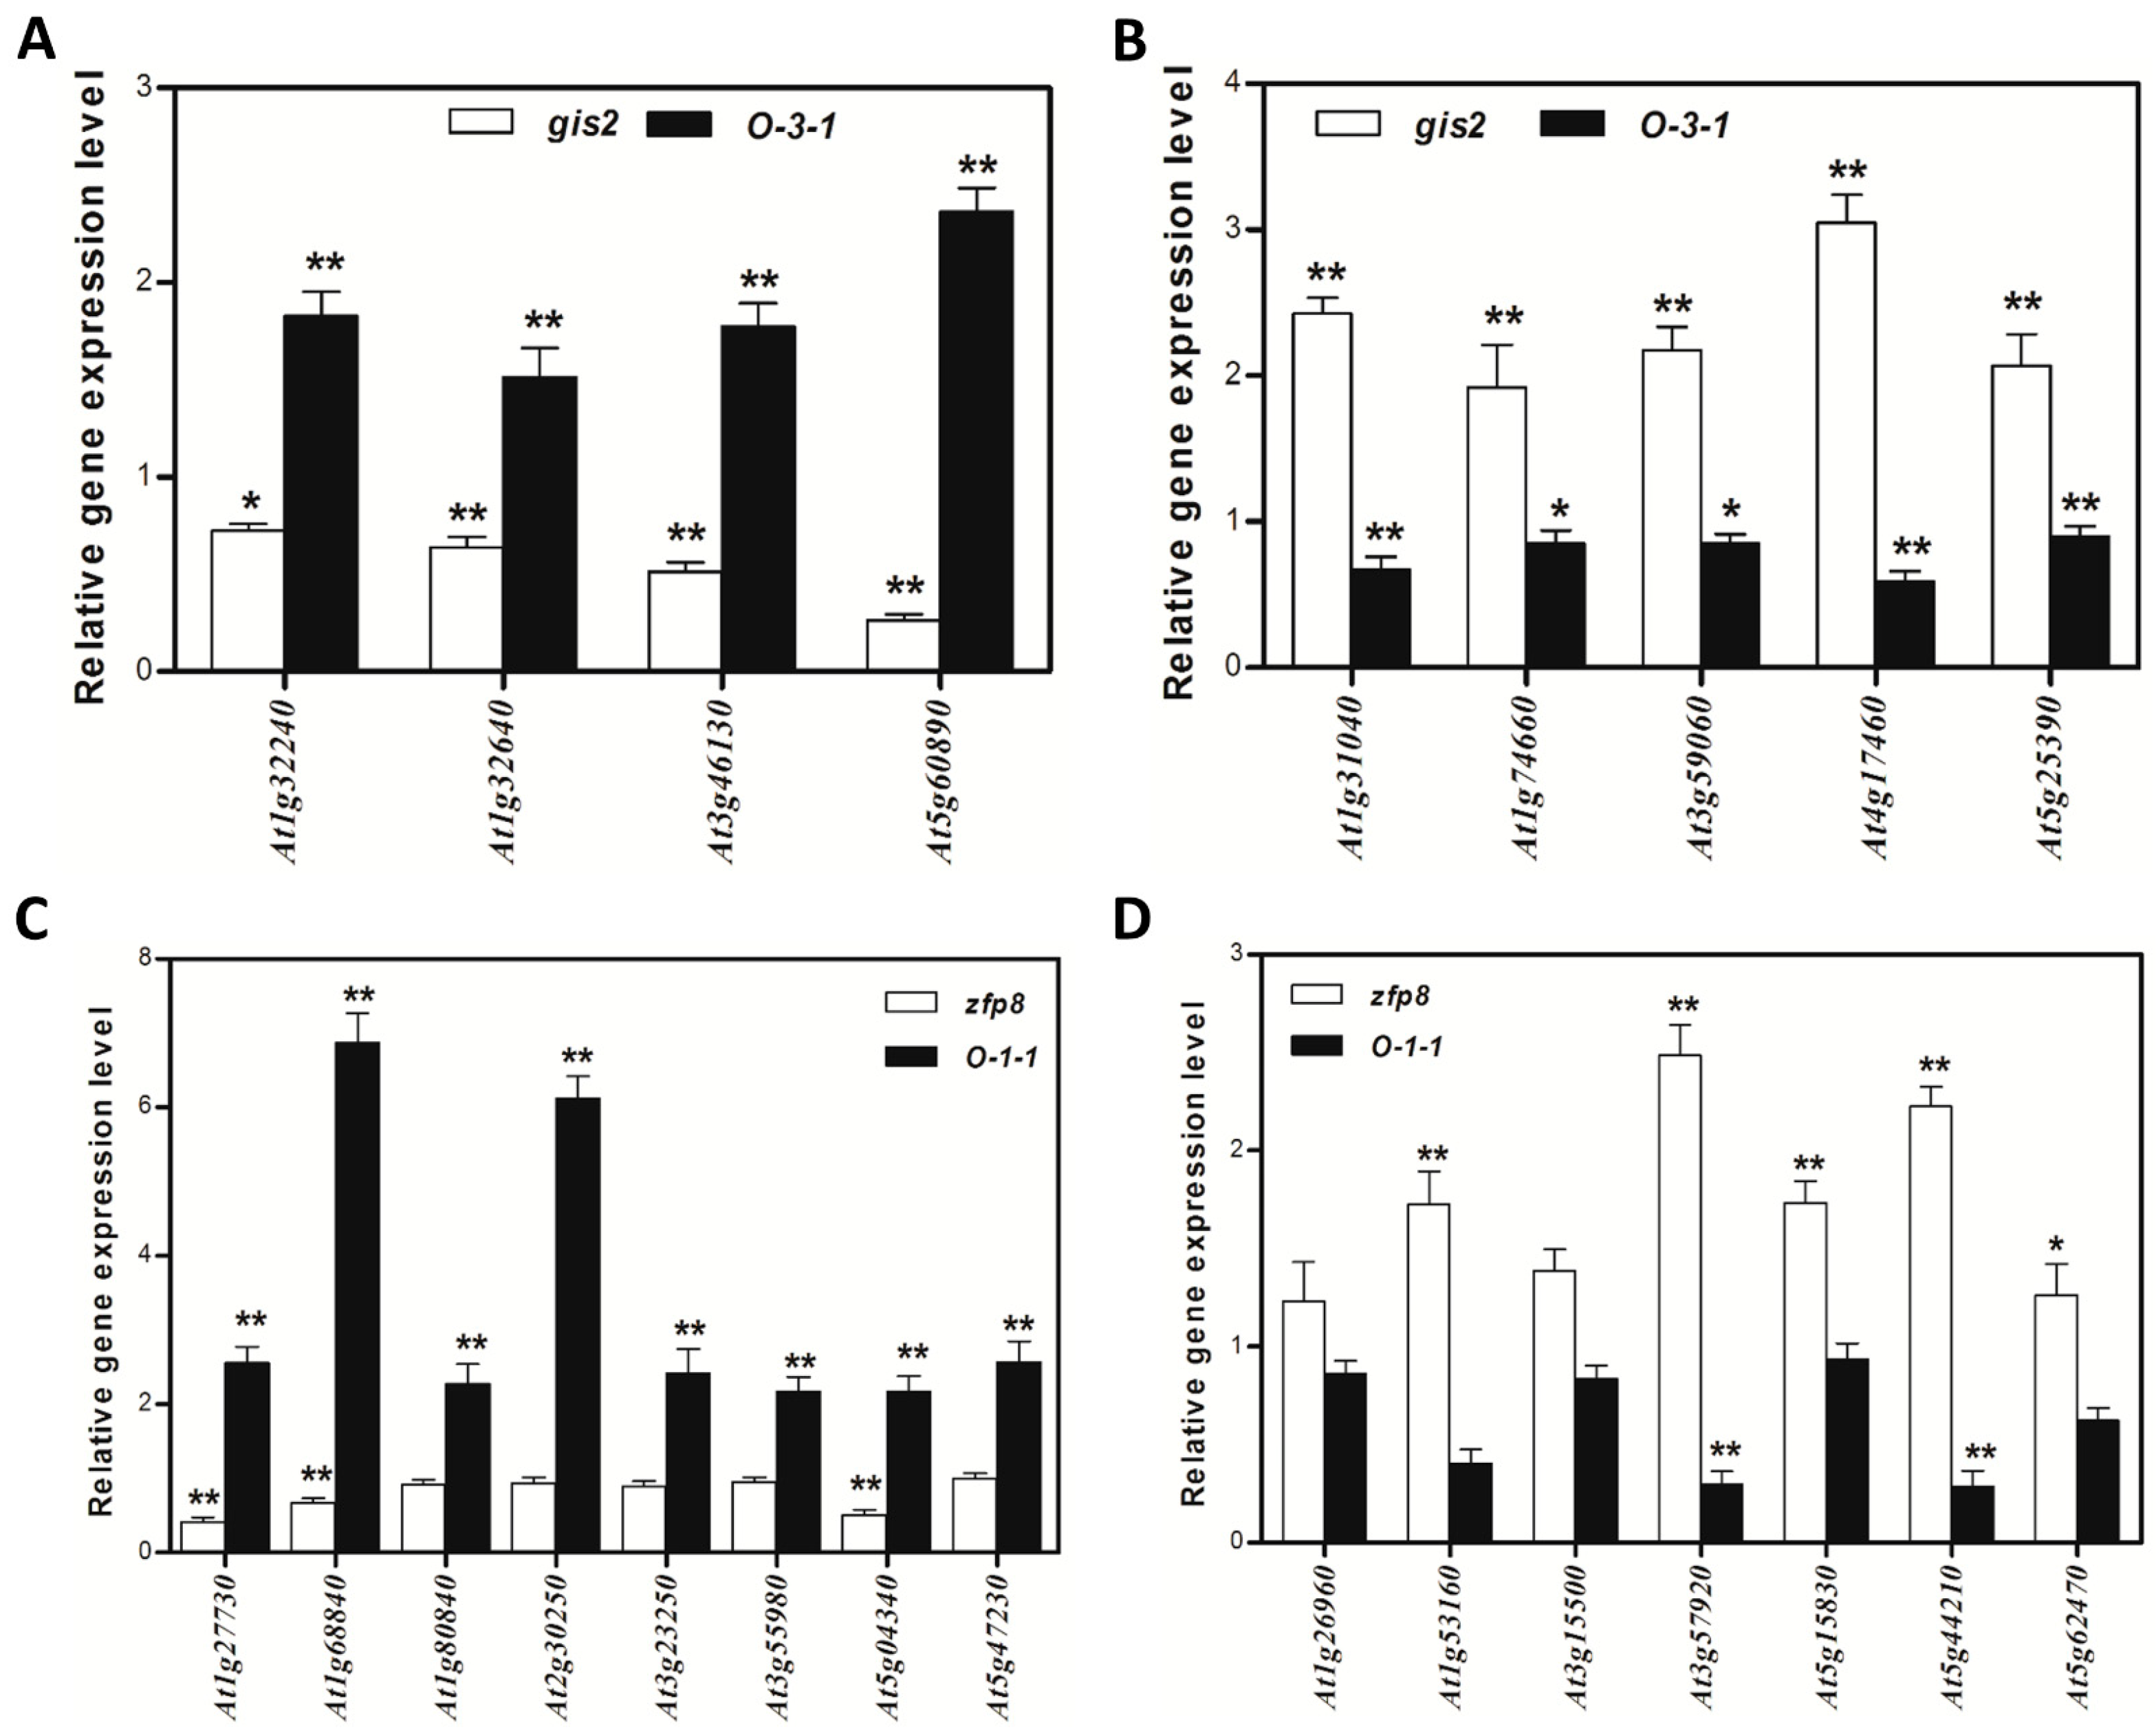
38]. Our findings extend this paradigm by demonstrating that GIS2 and ZFP8 exhibit bifunctional regulatory roles, directly activating stress-adaptive genes (e.g., SQE5; Figure 7A,B, Table 1) while repressing senescence-associated markers (e.g., SEN1; Figure 7C,D, 
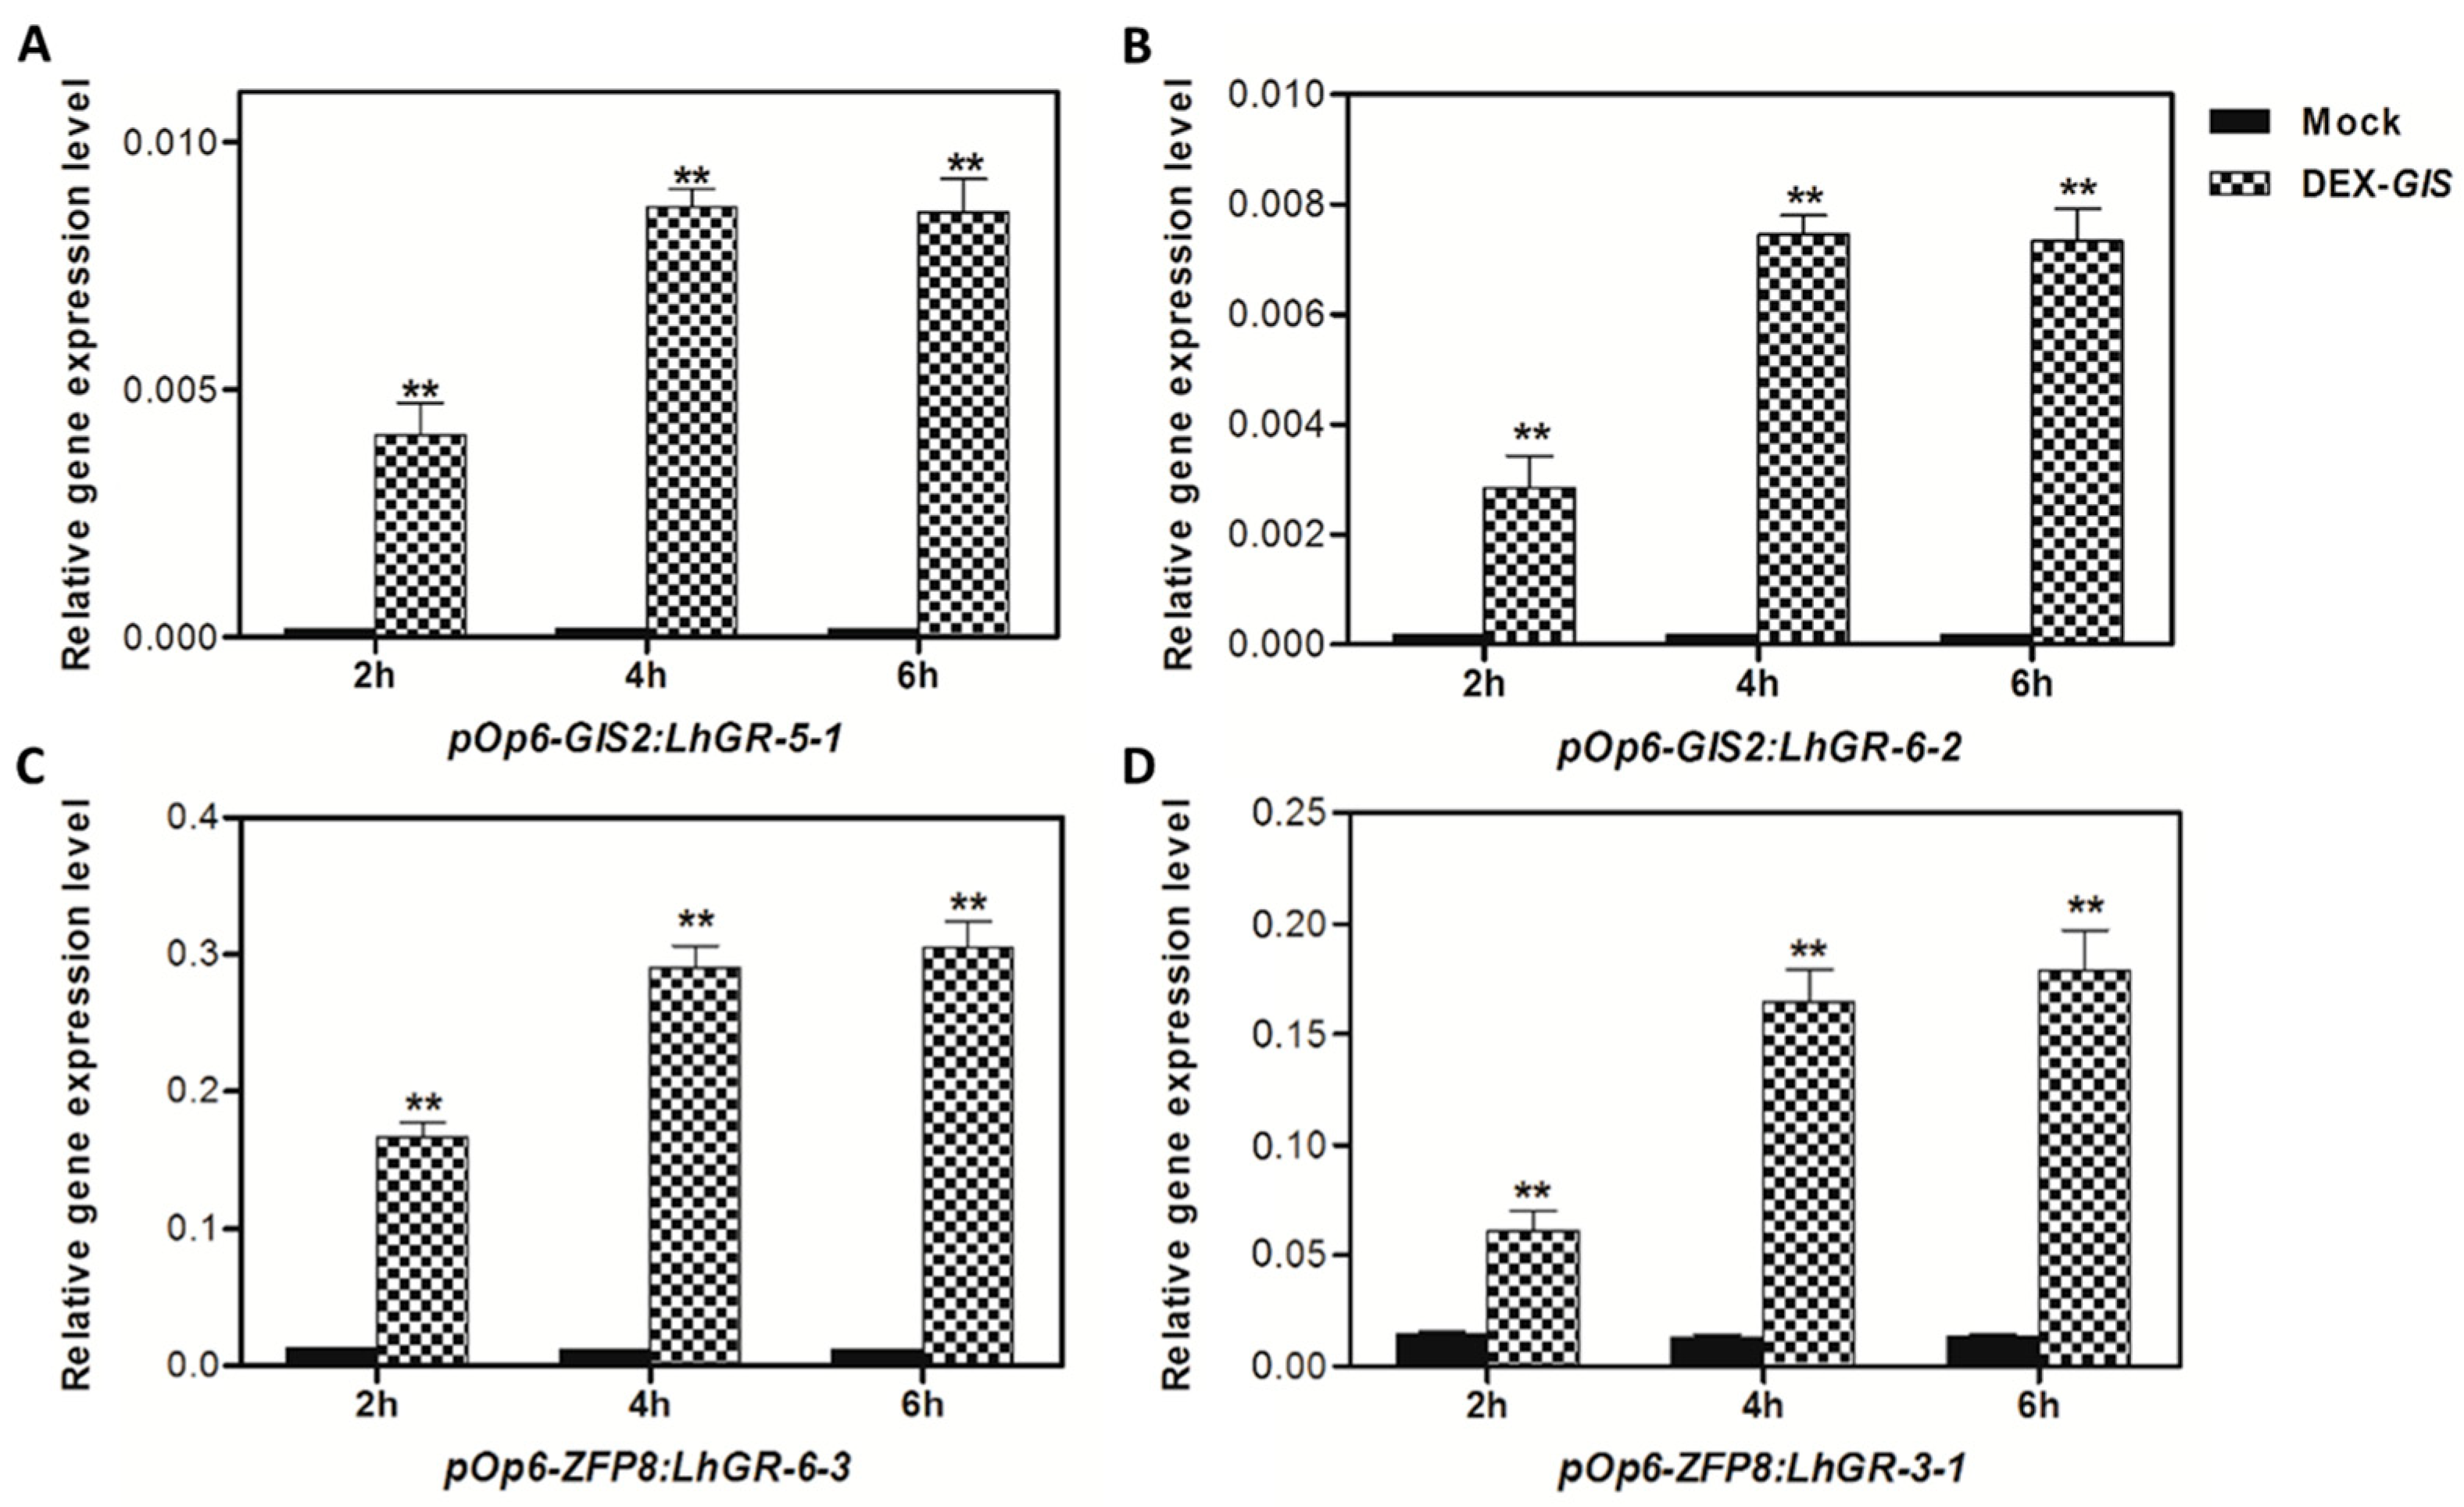
Table 2). Spatial specificity is evident: GIS2 predominantly functions in inflorescence stems (Figure 1A,B and Figure 6C,D), where GA stabilizes its protein (Figure 8A) and upregulates SQE5 (Figure 8B), whereas ZFP8 governs leaf trichomes through cytokinin/ABA pathways (Figure 5C and Figure 9A,B). This divergence mirrors evolutionary sub-functionalization, as seen in cotton homologs, where ZFP8 homologs regulate fiber development [
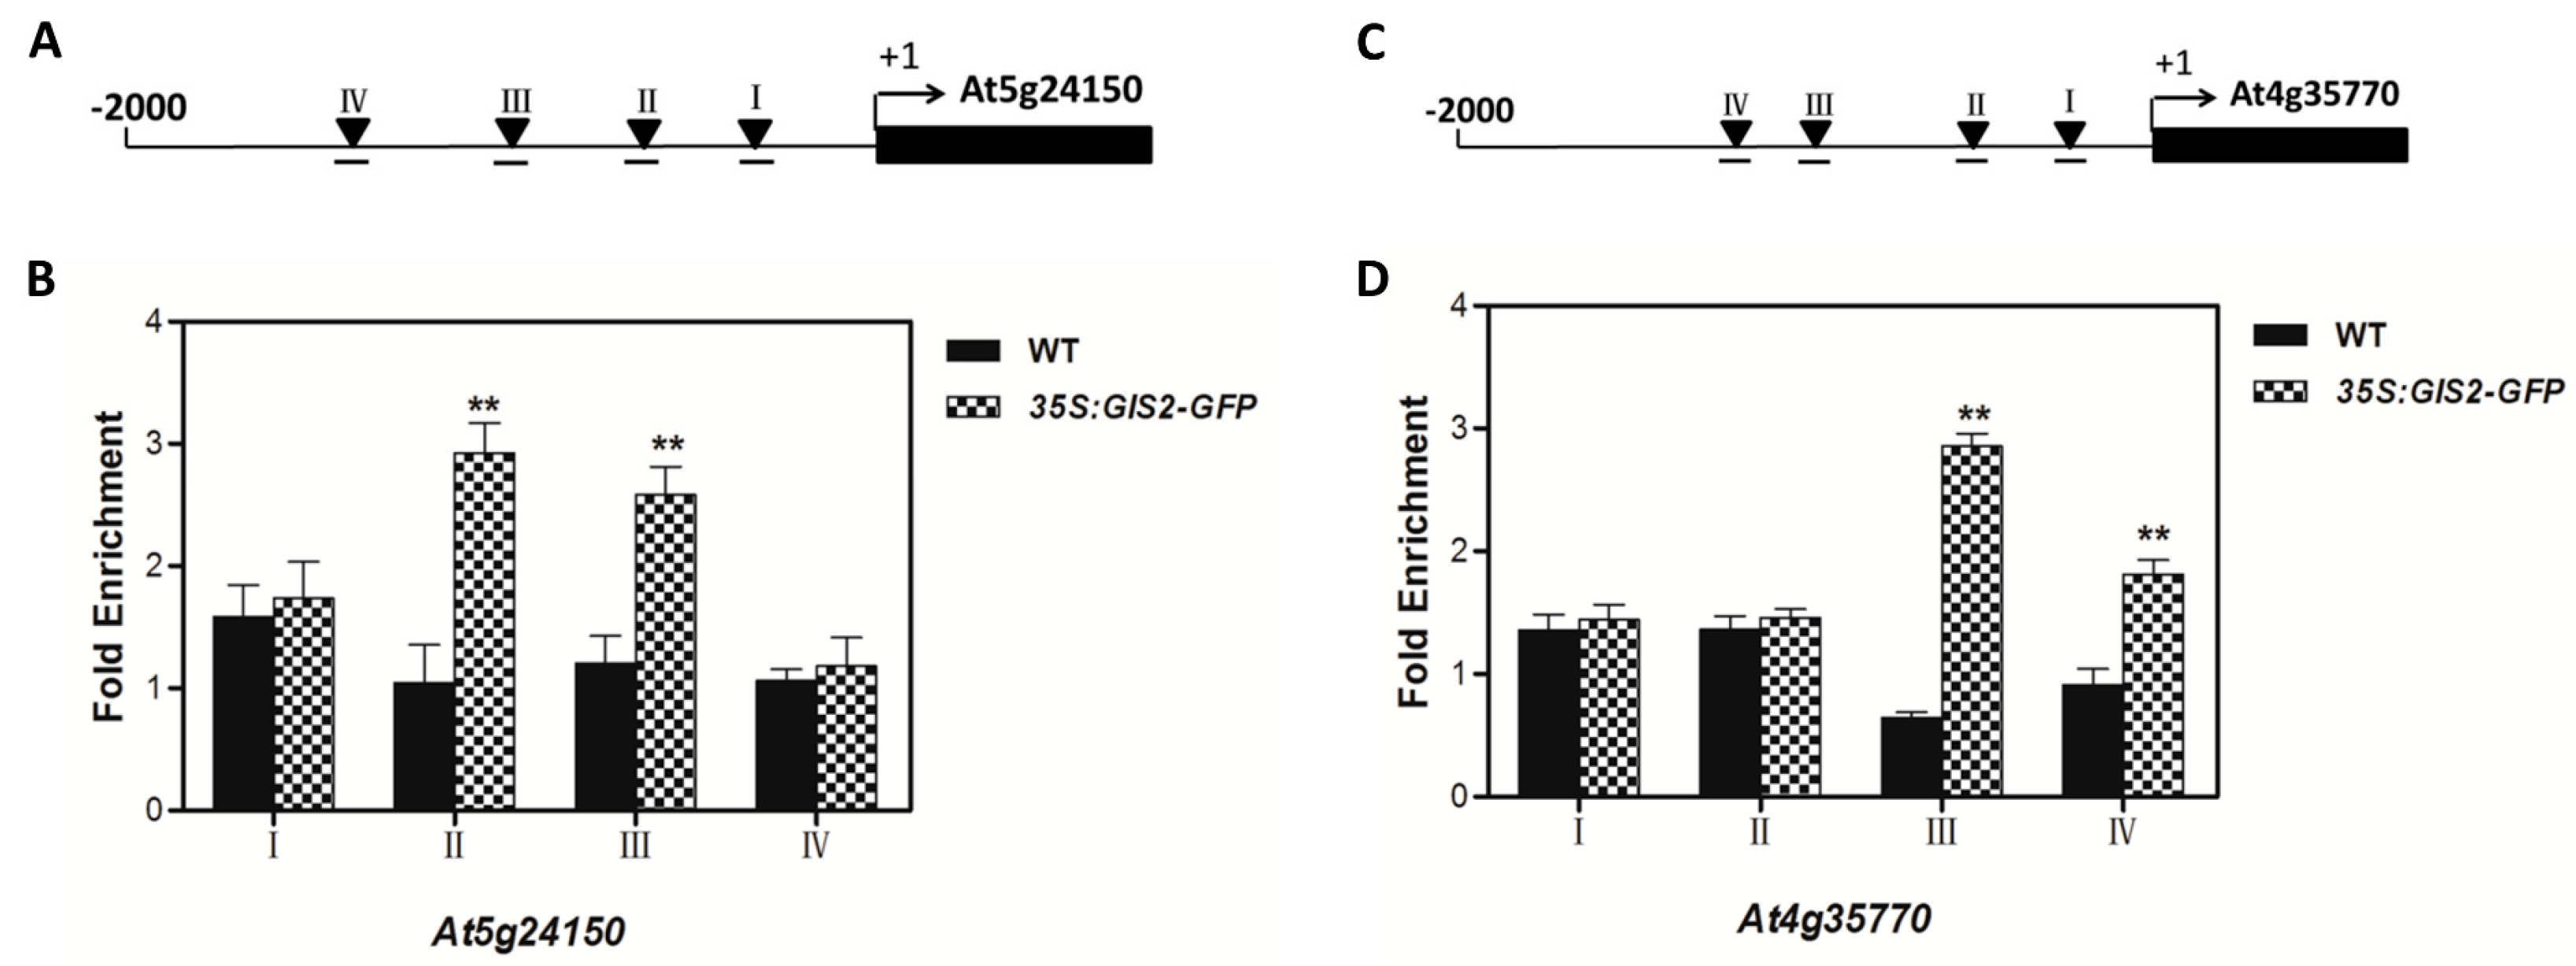
55]. The integration of hormonal cues (e.g., GA-induced GIS2 protein accumulation) and environmental signals (e.g., nutrient stress) suggests that these transcription factors balance developmental programs with stress adaptation. While ChIP-qPCR supports GIS2 binding to At5g24150 and At4g35770 promoters, future work will apply EMSA and yeast one-hybrid assays as used in our previous studies to further validate these interactions [41,56].
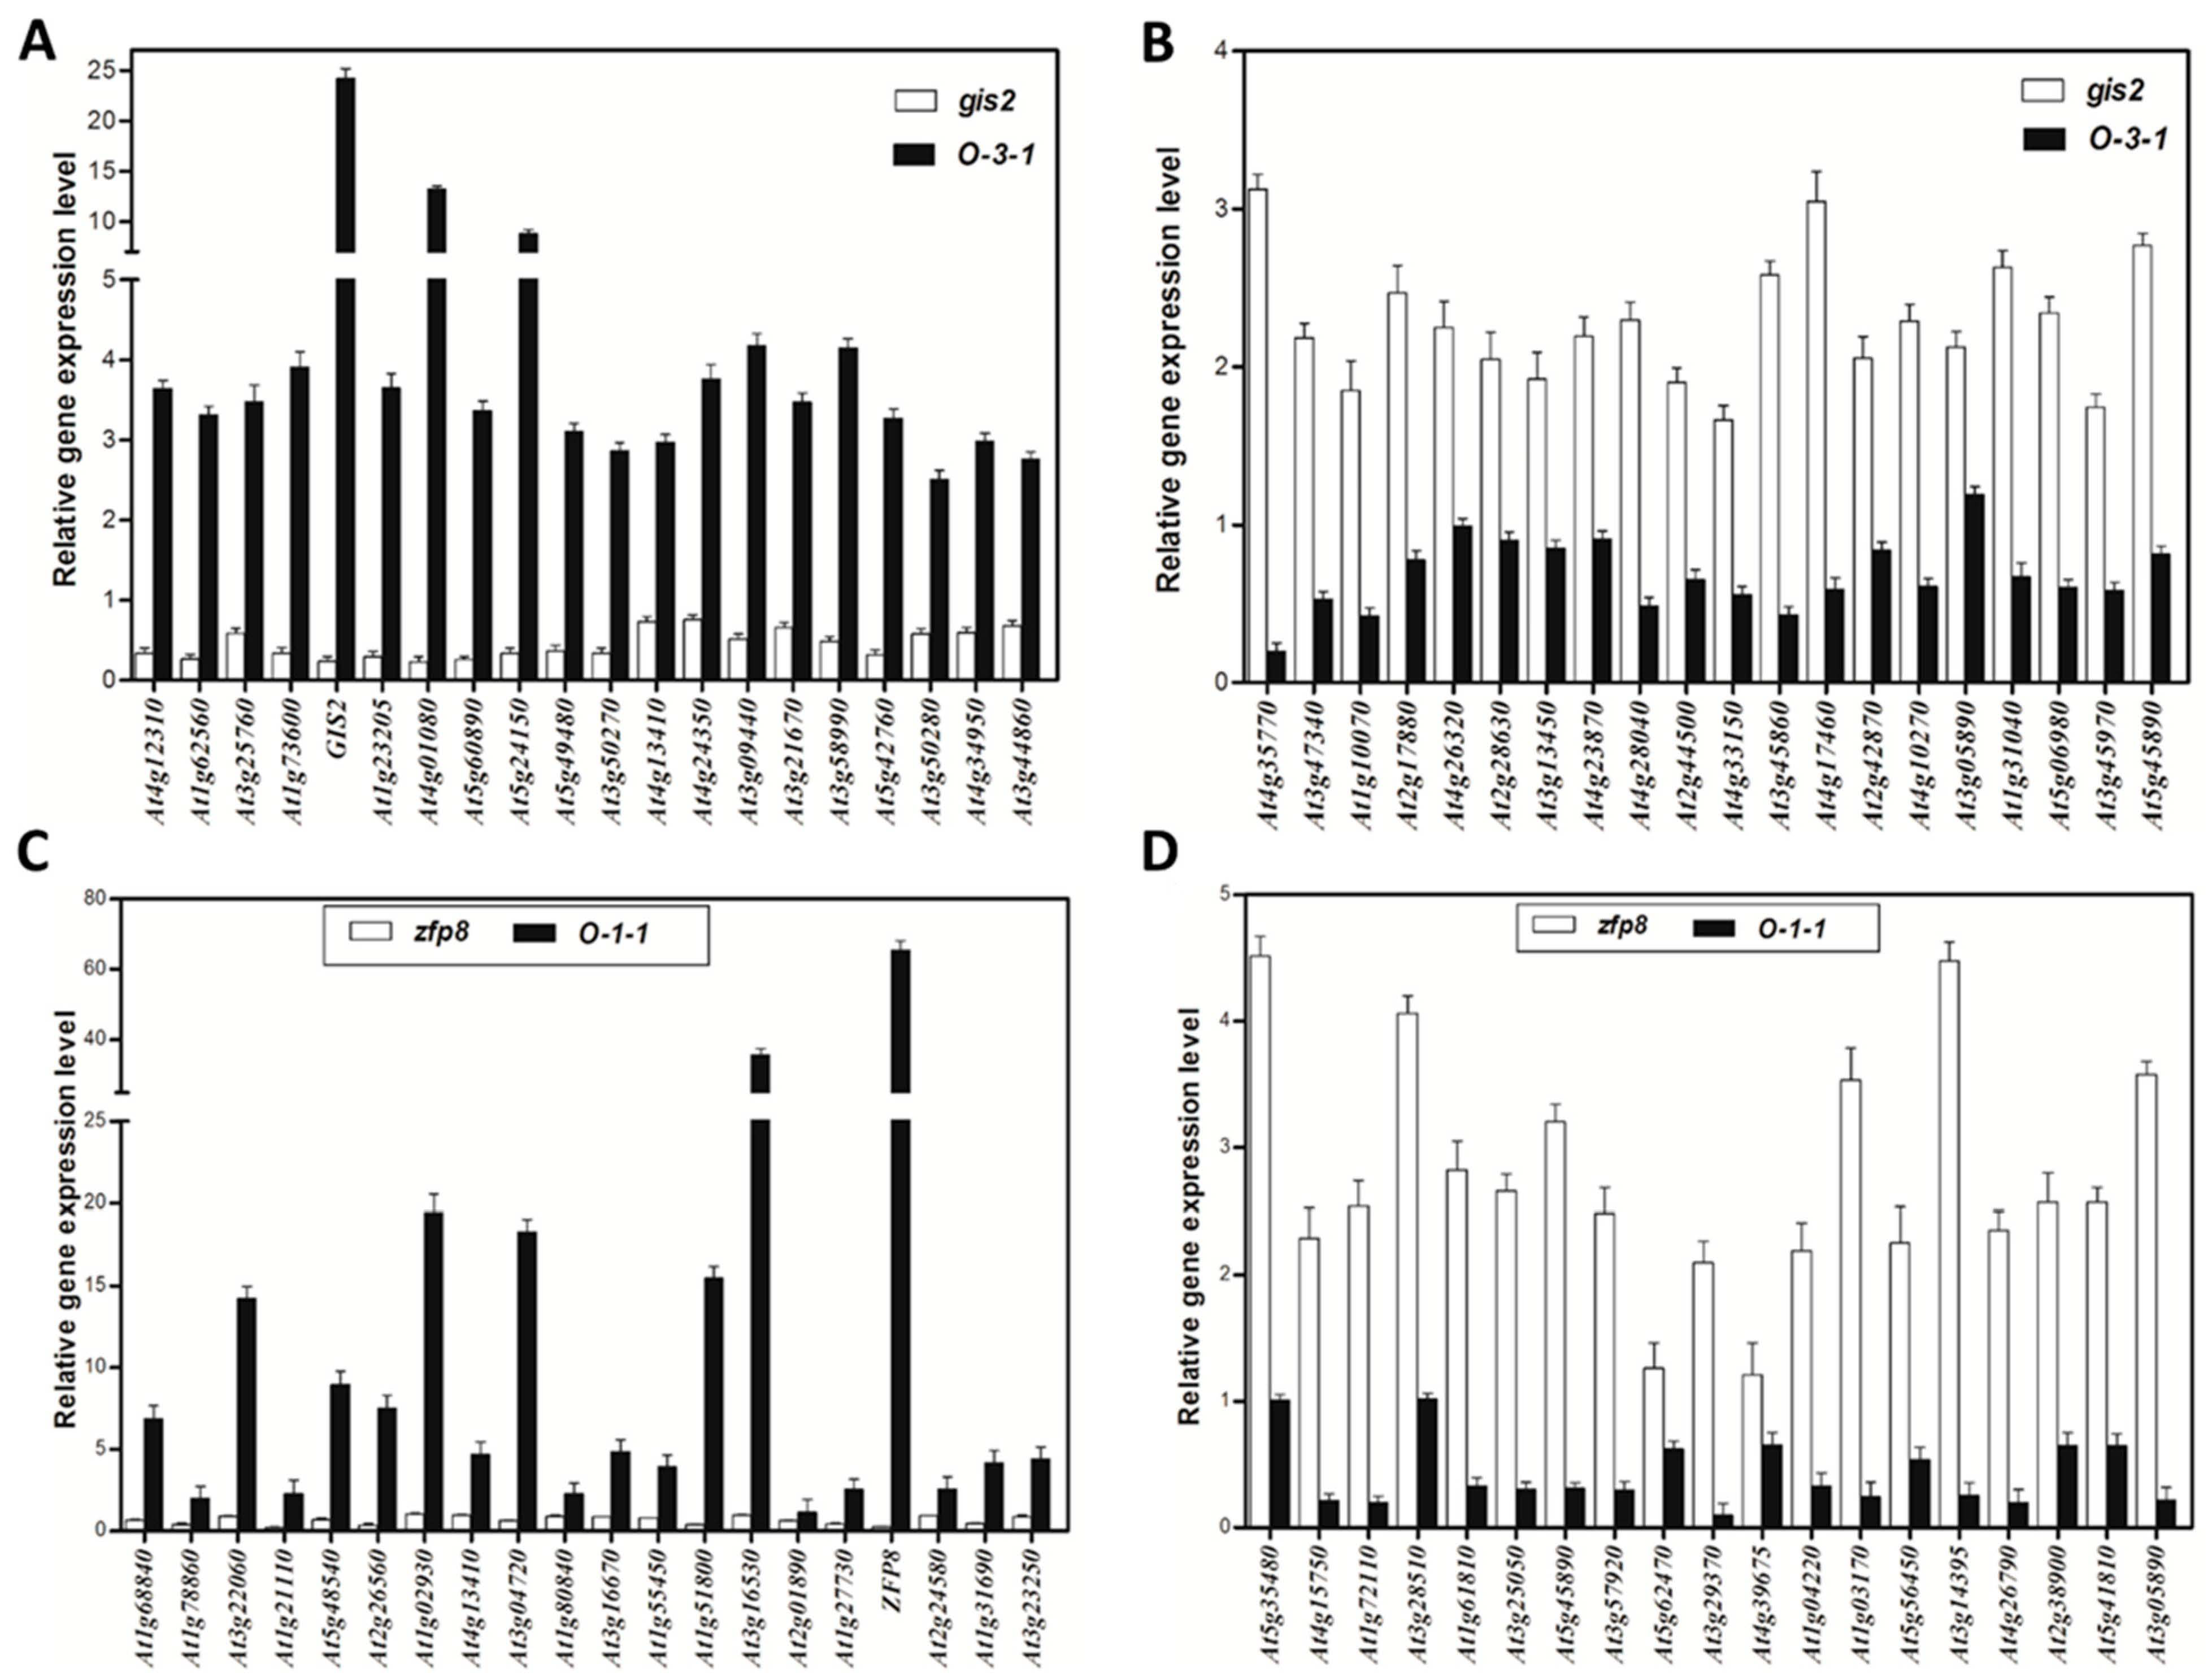
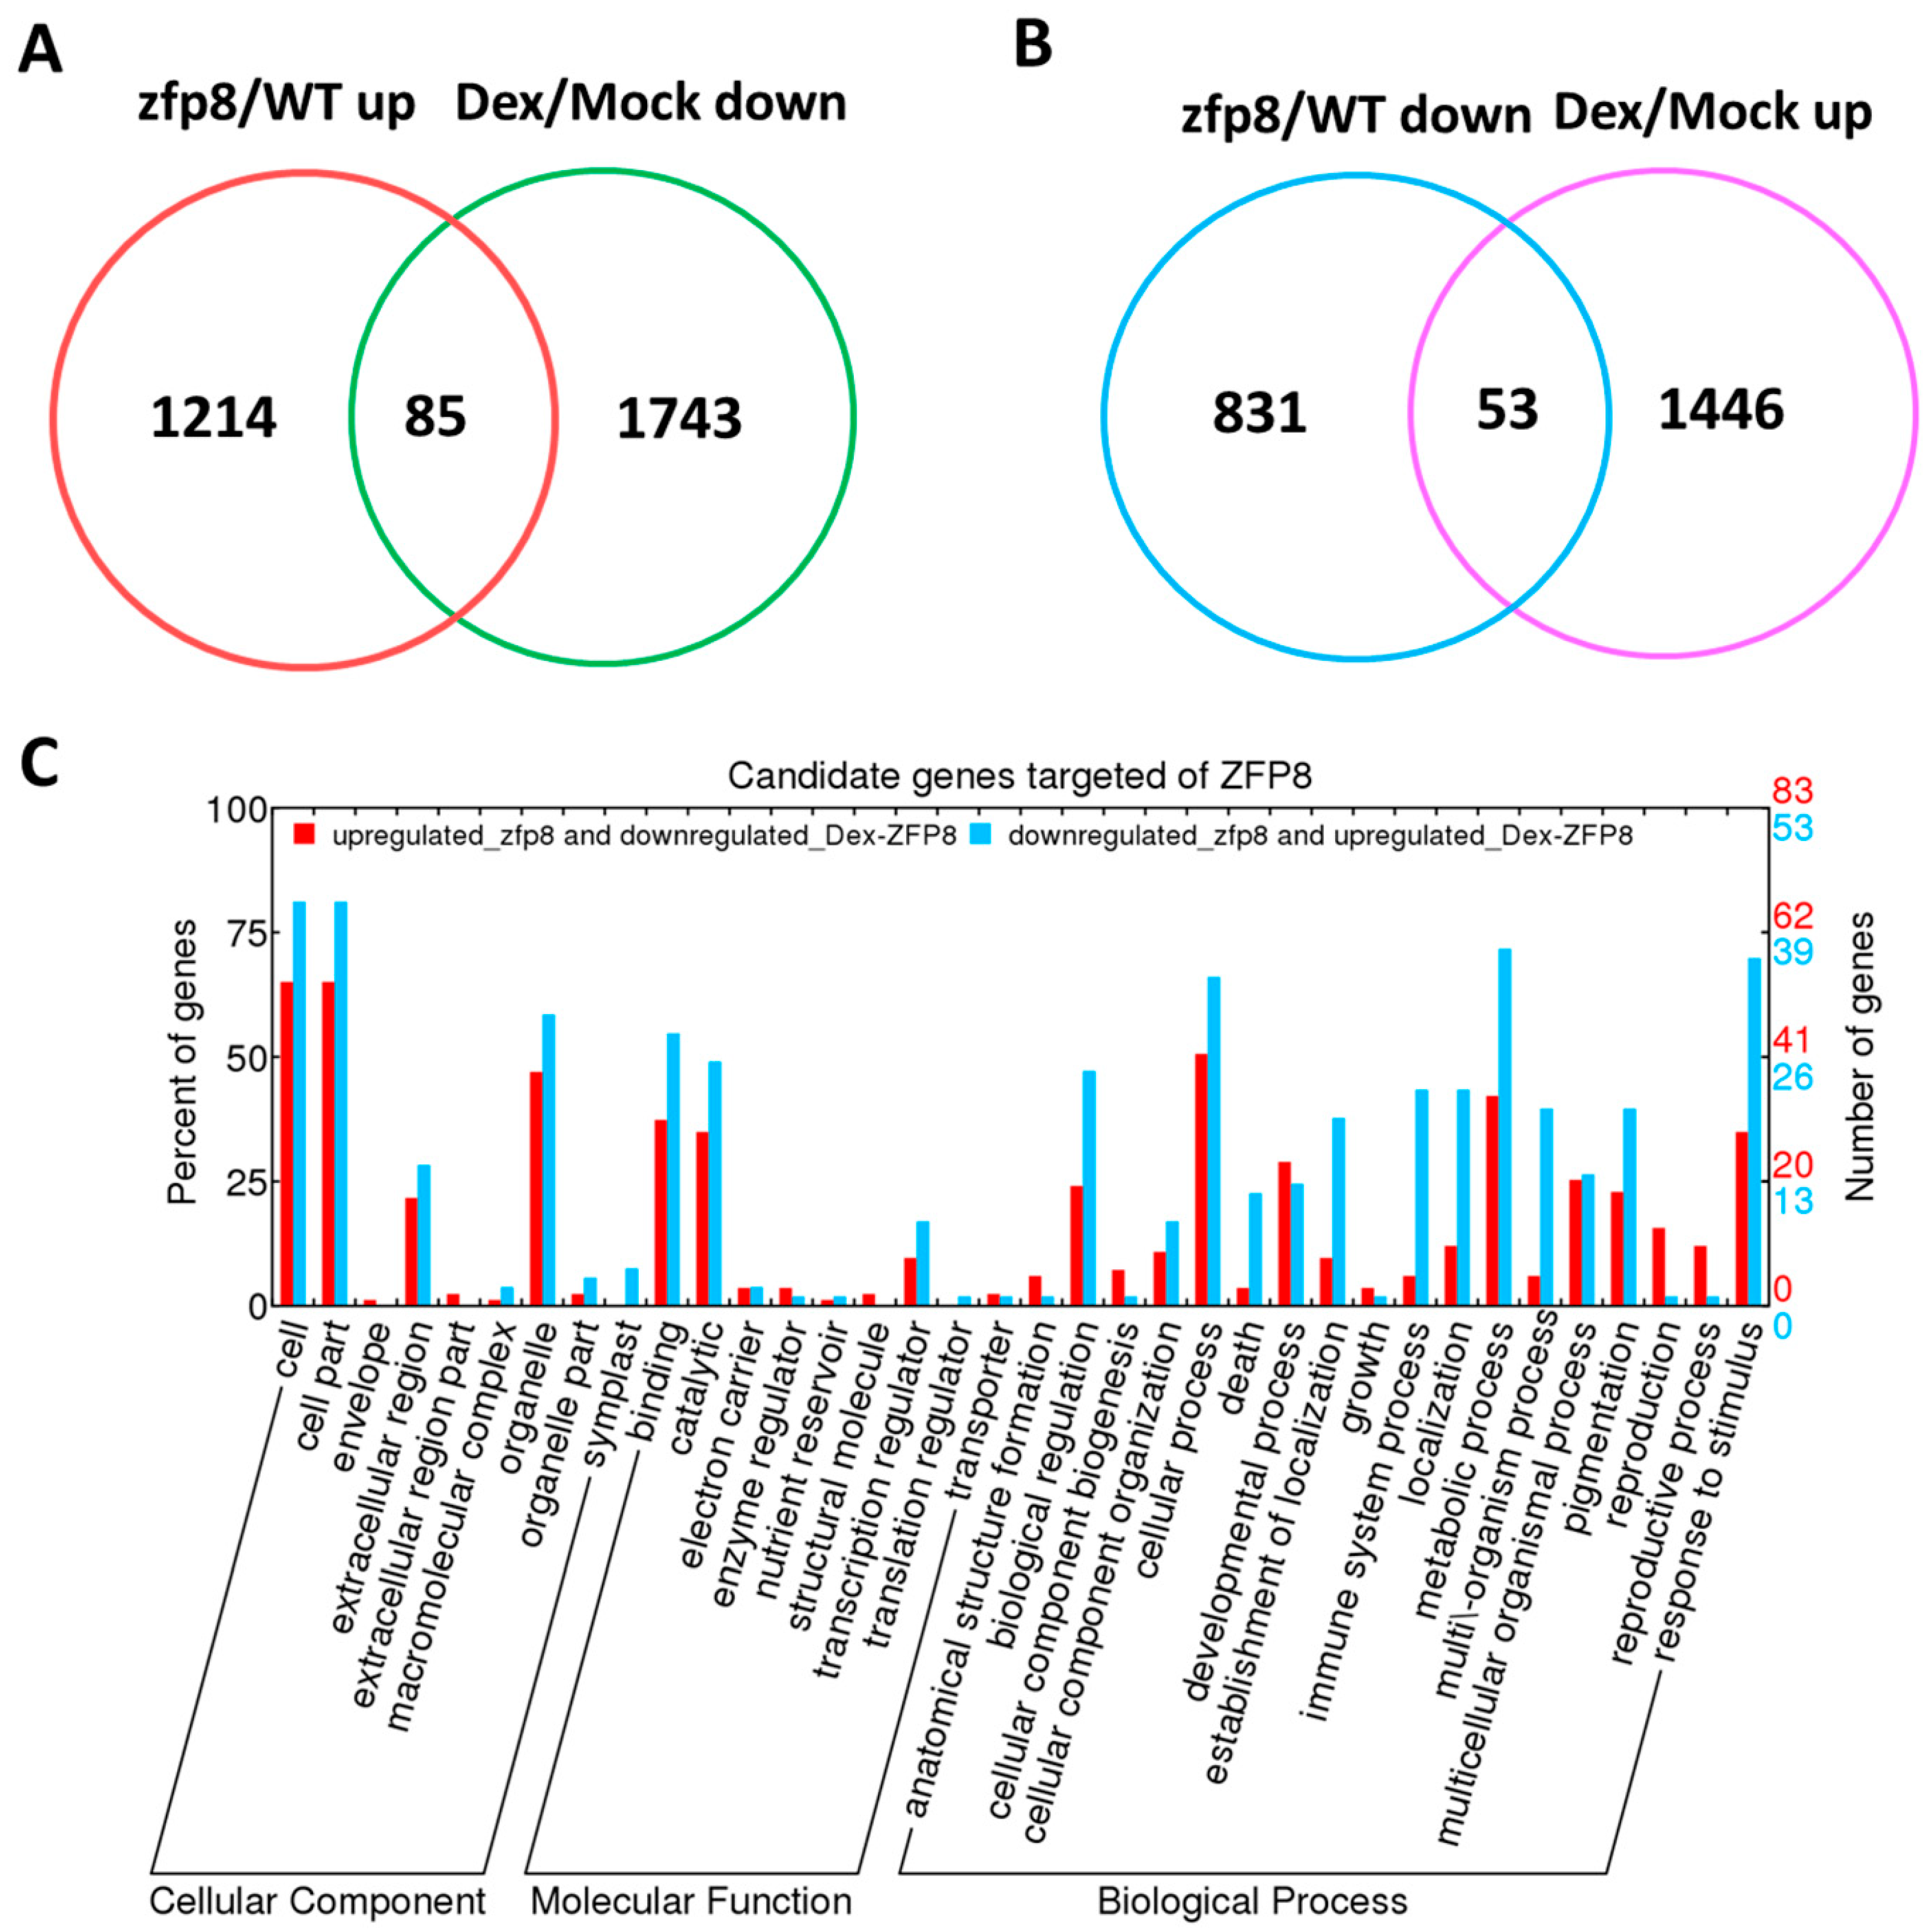
Transcriptomic analyses and dexamethasone-inducible overexpression systems demonstrate that GIS2 and ZFP8 control trichome development by overlapping but spatially different mechanisms. Microarray profiling of gis2 and zfp8 mutants revealed 142 and 138 target genes, respectively (Figure 3 and Figure 5), enhanced in catalytic activity, metabolic control, and stress adaptation—processes fundamental for trichome-mediated abiotic resilience. Notably, GIS2 and ZFP8 exhibit bifunctional regulatory roles, activating subsets of genes (e.g., SQE5 and PR-4) while repressing others (e.g., SEN1 and 
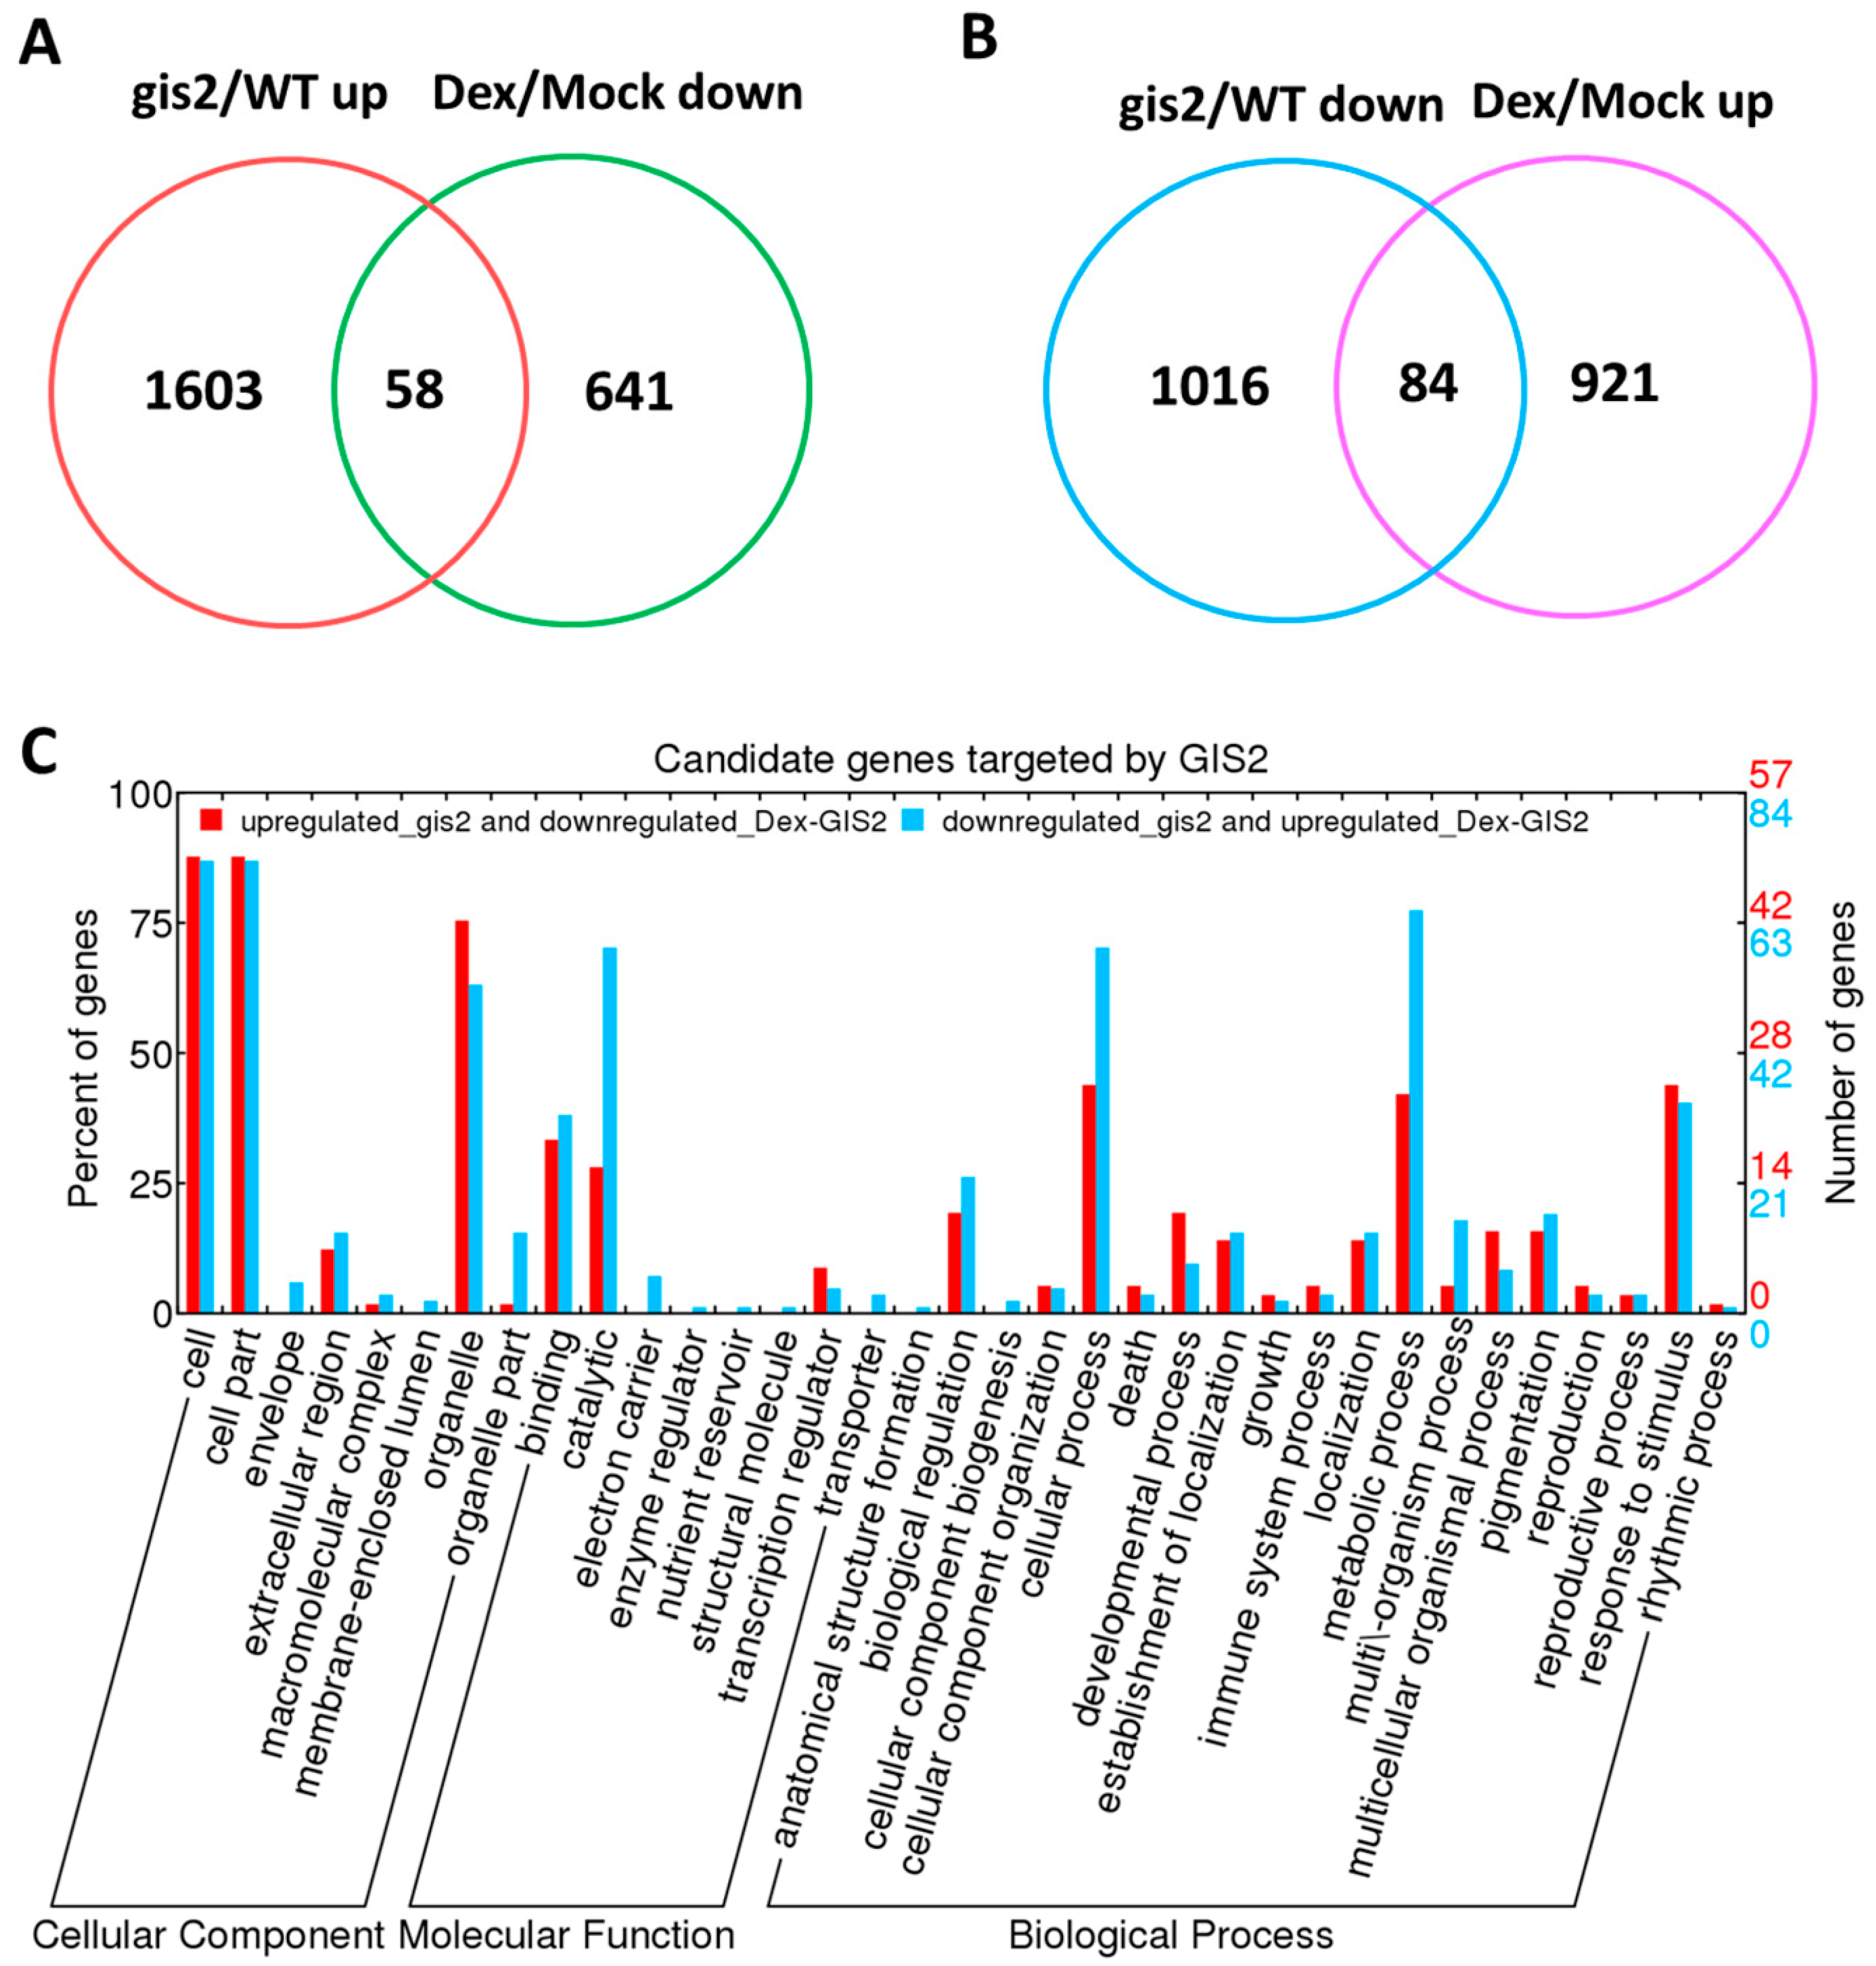
SPL15) to balance trichome differentiation with broader physiological demands (Figure 2, Figure 3, Figure 4, Figure 5, Figure 6 and Figure 7, Table 1, Table 2, Table 3 and 
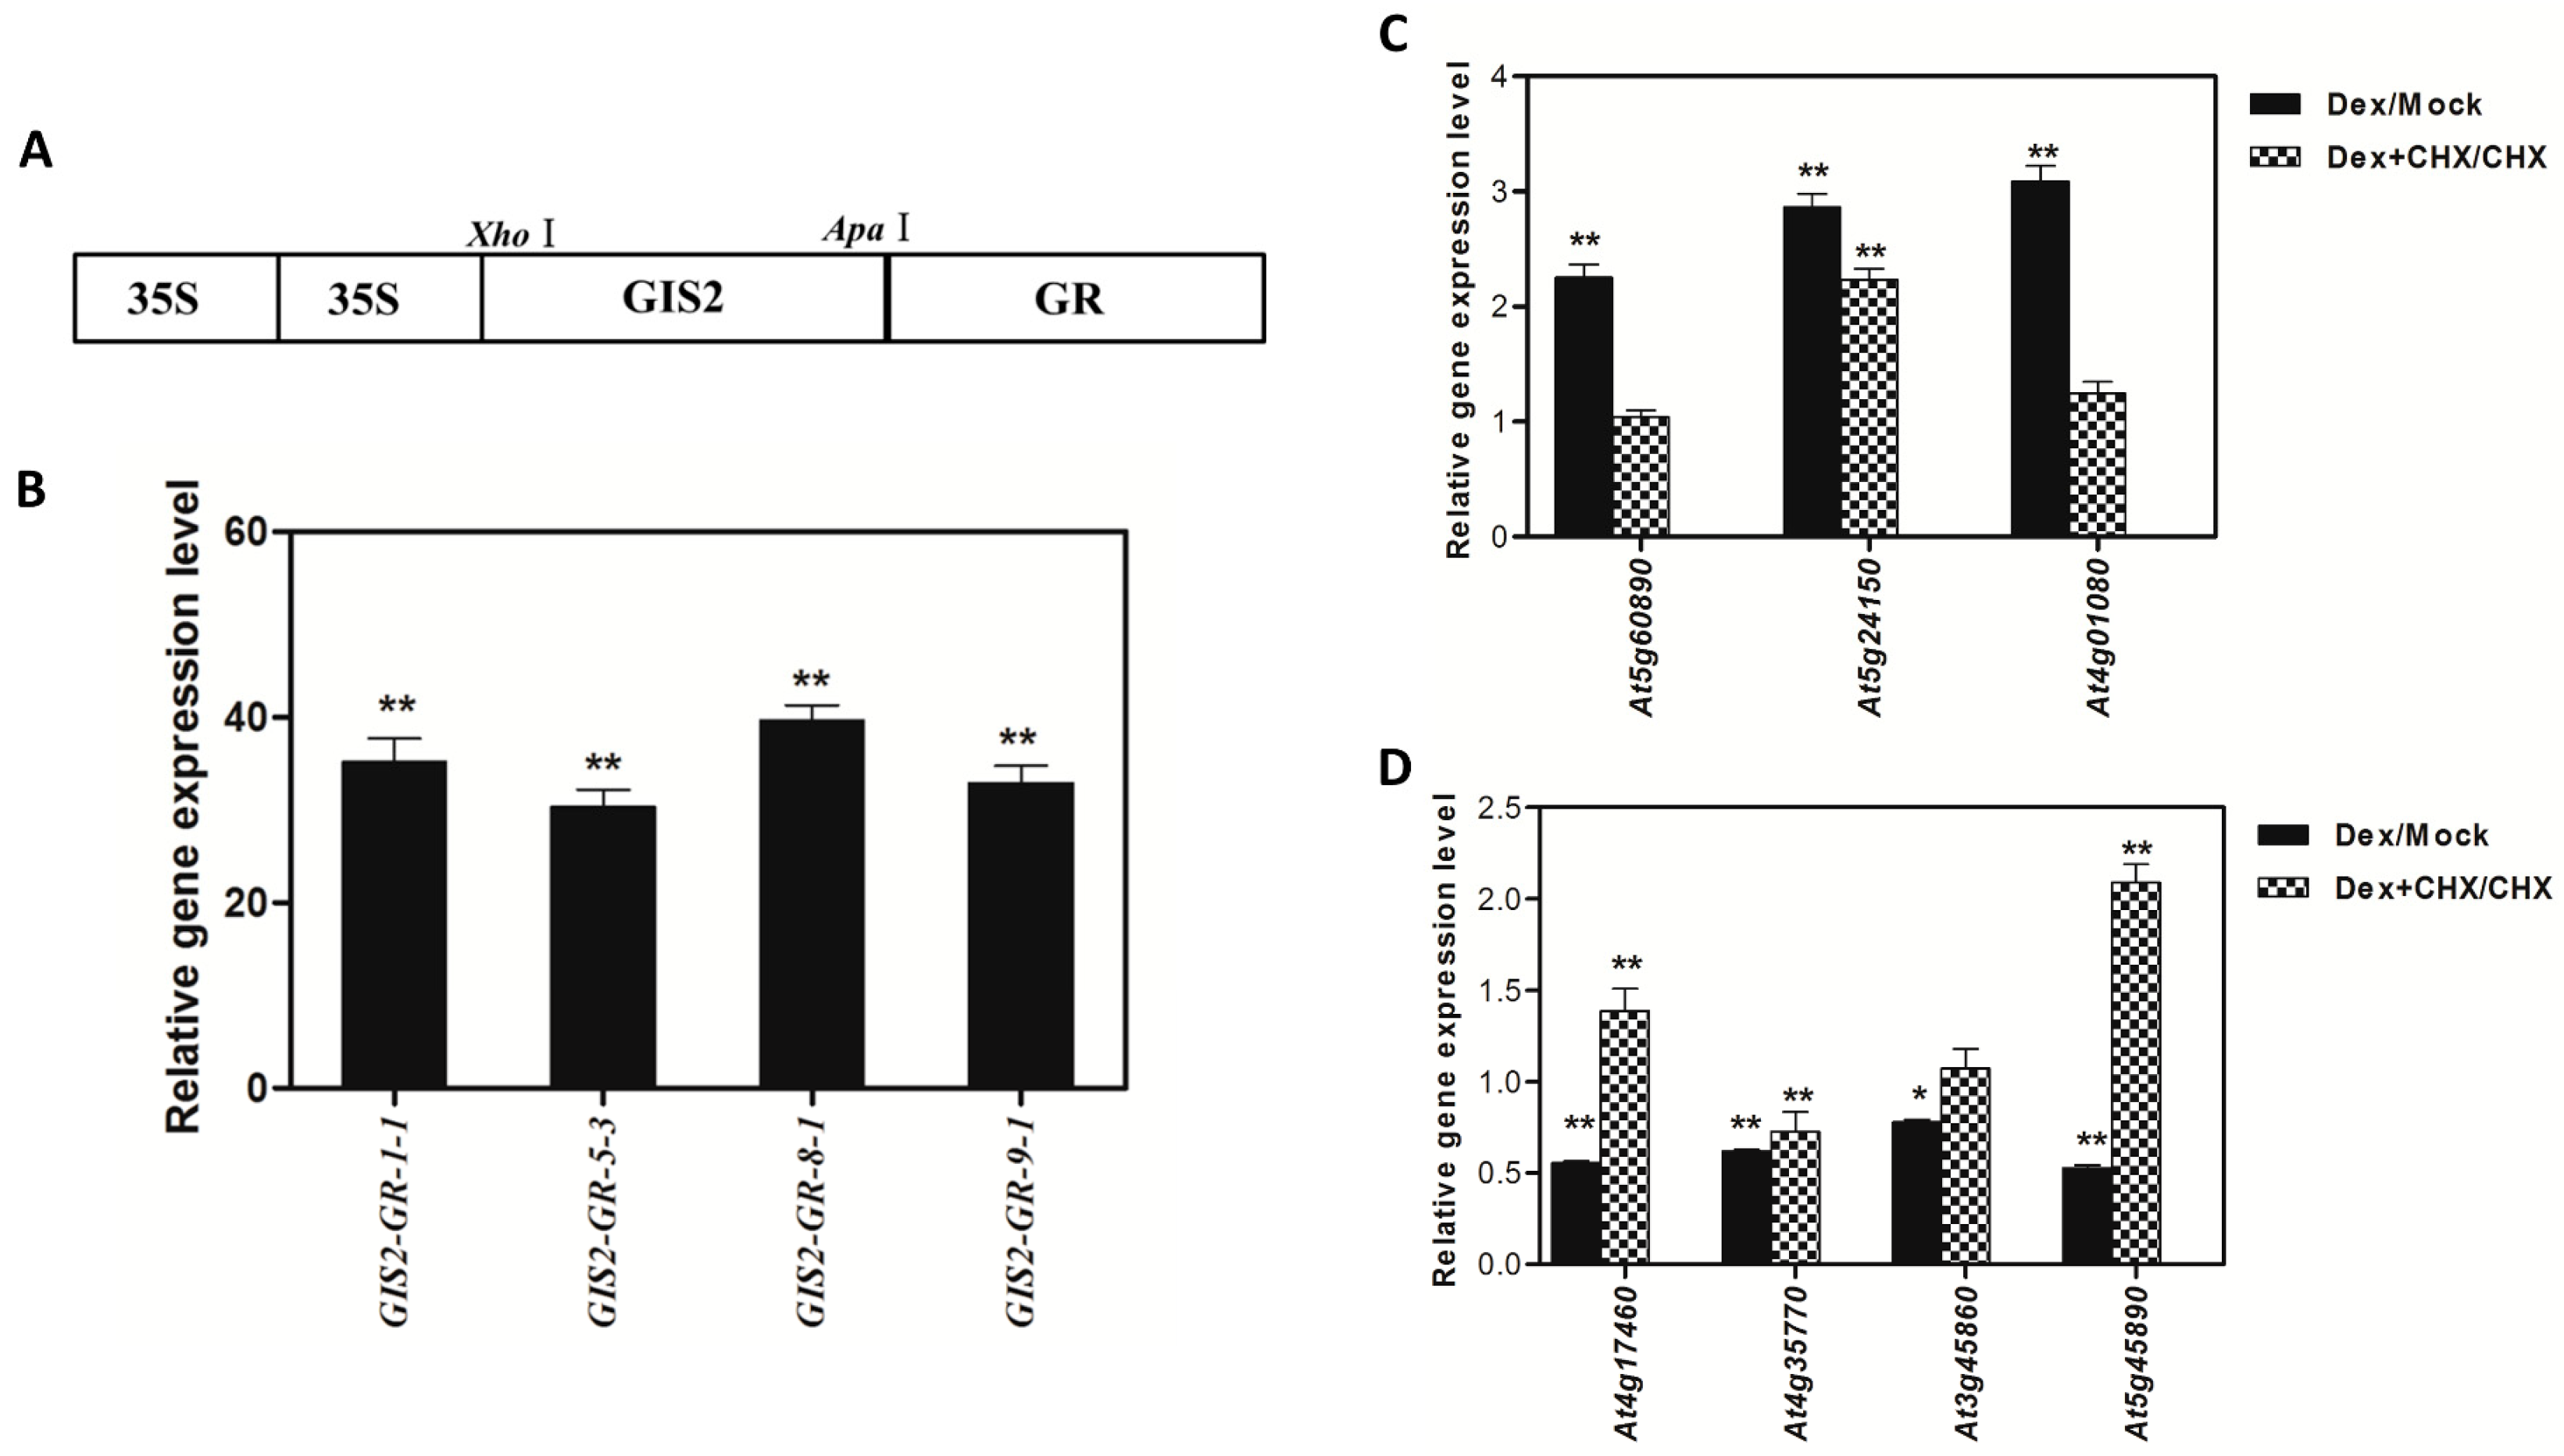
Table 4). For instance, GIS2 directly activates At5g24150 (SQE5), a sterol biosynthesis enzyme critical for drought tolerance (Figure 7A,B), while repressing At4g35770 (SEN1), a senescence marker regulated by ABA and phosphate starvation (Figure 7C,D). This dual functionality positions GIS2 as a molecular integrator linking trichome morphogenesis to stress adaptation—a mechanism conserved in homologs like GIS3, which enhances trichome initiation across tissues [39,41].
ChIP assays confirmed the direct binding of GIS2 to conserved C2H2 motifs in the promoters of SQE5 and SEN1 (Figure 7), establishing its role as a transcriptional hub. Similarly, ZFP8 modulates stress-responsive targets such as PR-4 (pathogenesis-related protein) and SPL15 (squamosa promoter-binding protein), the latter co-regulated by GIS (Figure 2D and Figure 9B; Table 8). This regulatory overlap suggests functional convergence, particularly in coordinating trichome development with phase transitions. For example, SPL15 is a mediator of shoot meristem phase transitions [57], which is repressed by both GIS2 and ZFP8 (Figure 4D), implying synchronized timing of trichome patterning and reproductive growth. Recent studies in cotton homologs further underscore the conserved role of ZFP8 in fiber development and photosynthetic efficiency [55], suggesting evolutionary selection for stress-responsive trichome regulation.
The spatial and functional divergence between GIS2 and ZFP8 raises questions about redundancy and crosstalk. Does SPL15 act as a central hub, synchronizing trichome development and flowering? Do interactions with TOE1/TOE2 transcription factors [39] enable compensatory regulation under stress? Addressing these questions requires comparative analyses of DNA-binding landscapes across tissues and conditions. CRISPR-based editing or single-cell transcriptomics [58] could resolve spatiotemporal dynamics of these networks in crops like cotton, where trichome density correlates with drought tolerance. Furthermore, elucidating the ecological roles of SQE5 (sterol-mediated drought resilience) and PR-4 (antifungal defense) could inform strategies to engineer crops with optimized trichome traits. By bridging mechanistic insights from Arabidopsis (Figure 1, Figure 2, Figure 3, Figure 4, Figure 5, Figure 6, Figure 7, Figure 8 and Figure 9) with translational applications, this work advances both basic research and agricultural innovation in a changing climate.
The regulatory overlap between ZFP8 and GIS2 is evidenced by their common targets, such as At3g04720 (PR-4) and At3g57920 (SPL15), the latter serving as a crucial integrator of developmental signals at the shoot apical meristem [57]. While ZFP8 primarily directs trichome formation on stem leaves [38], its targets are enriched in ABA signaling and drought defense pathways (Figure 9A), supporting trichome roles in stress mitigation [41]. Conversely, GIS2 links trichome development to sterol metabolism via SQE5 (Figure 7A,B) and senescence regulation via SEN1 (Figure 7C,D), suggesting broader roles in growth-phase transitions. This functional divergence is suggested by tissue-enriched expression and regulatory profiles: GIS2 showed elevated expression and downstream activation in inflorescence stems (Figure 1A,B and Figure 6C,D), while ZFP8-associated gene ontology terms and target enrichment were more prominent in leaf-related stress pathways (Figure 5C and Figure 9A,B). However, further studies using tissue-specific reporters or functional assays are needed to confirm precise spatial regulation. ZFP8 regulation of SPL15, a key mediator of phase transitions and flowering (Figure 4D; Table 8), suggests it may coordinate trichome development with reproductive timing [57]. While GIS2 did not appear to directly regulate SPL15, its overlap with ZFP8 in targeting other developmental genes points to potential functional convergence. GA signaling stabilizes GIS2 protein (Figure 8A), which coincides with increased expression of its downstream target SQE5 (Figure 8B), a sterol biosynthesis gene associated with drought adaptation [41]. This suggests that GA may indirectly enhance GIS2-mediated transcriptional regulation. SEN1 repression by GIS2 appears independent of GA signaling (Figure 8B). Given previous reports linking SEN1 to ABA and phosphate starvation responses [43,44], its regulation may involve alternative hormonal or nutrient-responsive pathways, highlighting the potential for context-dependent control. Likewise, ZFP8’s interaction with stress-responsive TFs such as AT1G68840 (RAV2) and AT2G30250 (WRKY25) (Figure 4C,D; Table 7) expands its role beyond trichomes to abiotic adaptation. Recent research shows that these TFs interact with TOE1/TOE2 transcription factors [39] to integrate environmental cues with GA and cytokinin signals, optimizing trichome patterning. This aligns with broader evidence that C2H2 TFs act as nodal points in hormonal crosstalk, balancing developmental precision with stress resilience [59].
The spatial and functional divergence between GIS2 and ZFP8 raises questions about redundancy or crosstalk. Does SPL15 function as a central hub, synchronizing trichome development and flowering? Do TOE1/TOE2 interactions facilitate compensatory regulation under stress? Addressing these questions necessitates comparative analyses of their binding landscapes across tissues and conditions. Furthermore, exploring the ecological relevance of key target genes such as SQE5, previously associated with drought tolerance [42], and PR-4, known for its role in pathogen defense [59], may provide insights to guide crop engineering strategies. While our study supports their transcriptional regulation by GIS2 and ZFP8, physiological validation under stress conditions remains a goal for future work. These mechanisms can be better understood with the help of new tools made possible by recent developments in single-cell transcriptomics and CRISPR-based spatial profiling [58], which combine basic discoveries with agricultural innovations.
Our study establishes GIS2 and ZFP8 as central regulators integrating developmental and environmental cues to modulate trichome patterning. Their bifunctional roles as transcriptional activators and repressors—evidenced by targets such as SQE5 (sterol biosynthesis and drought adaptation) and SEN1 (senescence and ABA/phosphate signaling)—position them at the intersection of trichome morphogenesis and stress adaptation. Spatial specificity (inflorescence stems vs. leaves) and target divergence enable functional specialization, with GIS2 coordinating GA-dependent SQE5 activation and ABA-mediated SEN1 repression, while ZFP8 regulates stress-responsive pathways like PR-4 and SPL15 (Figure 2, Figure 7, Figure 8 and Figure 9). These findings extend the known roles of GIS family proteins by linking trichome development to drought resilience via SQE5 and pathogen defense via PR-4. Future studies leveraging CRISPR-based editing or single-cell transcriptomics could dissect the spatiotemporal dynamics of these networks in crops like cotton or maize, where trichome density correlates with stress tolerance. By resolving how GIS2 and ZFP8 balance redundancy and specialization, this work provides a framework to engineer crops with optimized epidermal traits, addressing yield stability in climate-variable environments.

4. Materials and Methods

4.1. Plant Materials and Growth Conditions

All experiments used Arabidopsis thaliana ecotype Columbia (Col-0). The homozygous gis2 mutant, 35S:GIS2 overexpression line (O-3-1), zfp8 mutant, and 35S:ZFP8 overexpression line (O-1-1) were utilized. Seeds were surface-sterilized with 5% (v/v) sodium hypochlorite for 7 min, rinsed five times with sterile distilled water, and stratified on Murashige and Skoog (MS) medium at 4 °C in darkness for 3 days. Seedlings were grown in a controlled environment chamber (20–22 °C, 16/8 h light/dark cycle, photosynthetic active radiation (PAR) at 90–120 µmol m−2 s−1, 68–78% humidity). Plants were transferred to soil at the 2–3 true leaf stage. Primary stems (3–5 cm in length) were harvested from 23–25-day-old plants (rosette stage), with three biological replicates (1 g per replicate) per genotype, and immediately frozen in liquid nitrogen. For transgenic selection, MS medium supplemented with 50 mg/L kanamycin (for pH2GW7-pOp6 constructs) or 20 mg/L hygromycin (for pK7WGY2 constructs) was used. Resistant seedlings were transferred to soil, and leaf tissue was collected for genomic DNA extraction one week later.

4.2. Gene Cloning and Vector Construction

Gene cloning utilized the Gateway® system (Invitrogen). GIS2 and ZFP8 coding sequences were amplified from cDNA using primers containing SalI/NotI restriction sites:
  • GIS2: 5′-CGGTCGACATGAAGACTTATGATTTCAT-3′ (forward),
  • 5′-AAGCGGCCGCGAGAGGCGTAGATCCAAAC-3′ (reverse).
  • ZFP8: 5′-CGGTCGACATGGACGAAACCAACGGAC-3′ (forward),
  • 5′-AAGCGGCCGCGAGAGATGAAGATCGAG-3′ (reverse).
PCR products were cloned into pENTR-1A and recombined into destination vectors pH2GW7-pOp6 (kanamycin resistance), pK7WGY2 (hygromycin resistance), or pK7WGY2-GR (for glucocorticoid receptor fusions) via LR reaction. The 35S:GIS2-GR construct included a C-terminal GFP tag for ChIP validation and was generated using primers with XhoI/ApaI sites. Constructs were introduced into Agrobacterium tumefaciens GV3101 via electroporation and transformed into Arabidopsis via the floral dip method [60]. The pH2GW7-pOp6-GIS2 and pH2GW7-pOp6-ZFP8 vectors were transformed into CaMV35S::LhGR (4c-S5) and Col-0 plants, respectively [61].

4.3. RNA Extraction and Transcriptomic Profiling

Total RNA was isolated from Arabidopsis tissues using TRIzol® reagent (Invitrogen (Waltham, MA, USA)) following the manufacturer’s protocol. RNA integrity was verified via agarose gel electrophoresis, and genomic DNA contamination was removed using DNase I (Thermo Scientific). For quantitative real-time PCR (qRT-PCR), 1.5 µg RNA was reverse-transcribed with M-MLV reverse transcriptase (Promega (Madison, WI, USA)). Diluted cDNA (1:4) was amplified using SYBR® Green PCR Master Mix (Takara (Shiga, Japan)) on a Stratagene Mx3005P thermocycler under the following conditions: 95 °C for 1 min, followed by 40 cycles of 95 °C for 5 sec and 60 °C for 20 sec. UBQ10 served as the internal control, with three technical replicates per sample. Relative expression levels were calculated using the 2−ΔΔCt method [62].
For transcriptomic analysis, total RNA from primary stems of wild type (WT), gis2, zfp8, pOp6:GIS2:LhGR-2-2 (DEX-treated), pOp6:ZFP8:LhGR-6-3 (DEX-treated), and mock-treated controls (three biological replicates per condition) was hybridized to Affymetrix Arabidopsis ATH1 Genome Arrays. Data were processed with Affymetrix® Microarray Suite 5.0, normalized via the RMA algorithm [63], and analyzed using a fold-change threshold of >1.5 or <0.67 with a Benjamini–Hochberg adjusted q-value < 0.01. Hierarchical clustering and heatmaps were generated using MeV.

4.4. Dexamethasone-Inducible Expression of GIS2 and ZFP8

DEX induction combined with CHX treatment was used to identify candidate genes potentially regulated directly at the transcriptional level as we describe before [33,41]. For dexamethasone (DEX) induction, transgenic lines (pH2GW7-pOp6-GIS2 or pH2GW7-pOp6-ZFP8 in the CaMV35S::LhGR background) were selected on MS medium containing 50 mg/L kanamycin and 20 mg/L hygromycin. CHX inhibits de novo protein synthesis, allowing identification of primary transcriptional responses that do not require intermediate protein production. Lines showing high DEX-inducible expression via qRT-PCR (e.g., pOp6-GIS2:LhGR-5-1 and pOp6-ZFP8:LhGR-6-3) were retained. At the 3–5 cm primary stem stage, plants were sprayed with 10 µM DEX (Sigma-Aldrich, St. Louis, MO, USA; now part of Merck, headquartered in Darmstadt, Germany) and 0.015% (v/v) Silwet L-77, while mock controls received 0.015% Silwet L-77 and 0.033% (v/v) ethanol. Primary stems (1 g per replicate) were harvested at 2 h, 4 h, and 6 h post-treatment (Figure 1), flash-frozen in liquid nitrogen, and stored at −80 °C.
For 35S:GIS2-GR transgenic lines in the gis2 mutant background, DEX and cycloheximide (CHX) treatments were performed. Plants were treated twice with 10 µM DEX, mock (0.015% Silwet L-77), 10 µM DEX + 20 µM CHX (Sigma-Aldrich), or 20 µM CHX, with a 4 h interval between treatments. Samples were collected 2 h after the second spray for RNA extraction and expression analysis (Figure 6C,D).

4.5. Gibberellic Acid (GA3) Treatment

35S:GIS2-GFP transgenic plants, wild type (Col-0), and ga1-3 mutants were treated at the primary stem stage (~5 cm in length) by spraying with 100 µM GA3 (Sigma-Aldrich) dissolved in 0.02% (v/v) ethanol and 0.015% Silwet L-77 or mock control (solvent only). Primary stems were harvested at 4 h and 6 h post-treatment (Figure 8B), with three biological replicates (1 g per replicate). Samples were immediately frozen in liquid nitrogen and stored at −80 °C until analysis. For Western blotting, total protein was extracted from GA3-treated 35S:GIS2-GFP plants at 4 h and 8 h post-treatment (Figure 8A).

4.6. Chromatin Immunoprecipitation (ChIP) Assay

ChIP assays were performed using two independent protocols. For the first method, chromatin was isolated using the EpiQuik™ Plant ChIP Kit (Epigentek, Farmingdale, NY, USA). Immunoprecipitated DNA was analyzed by ChIP-qPCR with primers targeting four promoter fragments per gene (At5g24150/SQE5 and At4g35770/SEN1) (Supplementary Table S1). For the second protocol, 1–3 g of 35S:GIS2-GFP stem tissue was vacuum-infiltrated with 1% formaldehyde for 10 min, followed by quenching with 2 M glycine. Fixed tissues were homogenized in extraction buffer (0.4 M sucrose, 10 mM Tris-HCl pH 8.0, 10 mM MgCl2, 5 mM β-mercaptoethanol, 0.1 mM PMSF, 1× protease inhibitor cocktail [Roche]). Chromatin was sonicated to 500–800 bp fragments using a Bioruptor® (5 cycles: 15 s ON, 60 s OFF). After pre-clearing with protein A-agarose, supernatants were incubated overnight with 2.5 µL anti-GFP antibody (Abmart, Shanghai, China) or anti-HA antibody (Abmart; negative control). Immune complexes were washed sequentially and eluted in 0.1 M NaHCO3, 1% SDS. Crosslinks were reversed at 65 °C overnight, followed by Proteinase K digestion. DNA was purified and analyzed by qPCR using β-Tubulin2 as the internal reference [64]. Enriched promoter fragments (II and III for At5g24150; III and IV for At4g35770) were validated against input controls (Figure 7B,D). Enrichment values were normalized to input DNA. Anti-HA was used as a negative control antibody to ensure specificity.

4.7. Western Blot Analysis

Total protein was extracted by homogenizing 0.1–0.3 g of frozen stem tissue in liquid nitrogen and suspending the powder in 3× volume (w/v) of extraction buffer (100 mM Tris-Cl pH 8.0, 2% SDS, 5 mM EGTA, 10 mM EDTA, 2% β-mercaptoethanol, 1 mM PMSF, 1× protease inhibitor cocktail [Roche]). Lysates were incubated at 65 °C for 10 min to solubilize proteins, followed by centrifugation at 13,000× g for 15 min at 4 °C. Supernatants were collected, and 15 µL of protein per sample was denatured in Laemmli buffer (0.5 M Tris-Cl pH 6.8, 25% glycerol, 10% SDS, 0.5% bromophenol blue) at 95 °C for 4 min. Proteins were separated on 12% SDS-PAGE gels at 60 V for 30 min and then 100 V until the dye front migrated and transferred to nitrocellulose membranes using a semi-dry transfer system (Bio-Rad, Hercules, CA, USA) at 15 V for 50 min. Membranes were blocked overnight at 4 °C in 5% non-fat milk in PBST (1× PBS, 0.1% Tween-20) and probed with anti-GFP primary antibody (Abmart, 1:1000 dilution) for 1 h at room temperature. After four washes with PBST, membranes were incubated with HRP-conjugated secondary antibody (Abmart, 1:5000 dilution) for 1 h. Signals were detected using SuperSignal™ West Dura Extended Duration Substrate (Thermo Scientific, Waltham, MA, USA; part of Thermo Fisher Scientific) and imaged on a ChemiDoc™ XRS+ System (Bio-Rad). β-Tubulin (Abmart, 1:2000) served as a loading control (Figure 8A).

4.8. Statistical Analysis

Microarray data were processed using Affymetrix® Microarray Suite 5.0, normalized via the RMA algorithm [63], and analyzed with a fold-change threshold of >1.5 or <0.67 and a Benjamini–Hochberg adjusted q-value < 0.01. For qRT-PCR, three biological replicates (independent plant samples) and three technical replicates (per cDNA sample) were analyzed. Relative expression levels were calculated using the 2−ΔΔCt method [62,65], with significance determined by two-tailed Student’s t-test (p < 0.05). ChIP-qPCR data were normalized to β-Tubulin2 and input controls, with significance assessed via one-way ANOVA followed by Tukey’s post hoc test (p < 0.05). Hierarchical clustering and heatmaps were generated in MeV (MultiExperiment Viewer; open-source software originally developed at Dana-Farber Cancer Institute, Boston, MA, USA) using Euclidean distance and average linkage. All statistical analyses were performed in GraphPad Prism 9.0, and data are presented as mean ± SD unless stated otherwise. For Western blot quantification, band intensities were normalized to β-Tubulin using Image Lab™ Software (developed by Bio-Rad Laboratories, Hercules, CA, USA).

5. Conclusions

This study explores the dual roles of GIS2 and ZFP8 as transcriptional regulators potentially coordinating trichome development with stress adaptation in Arabidopsis. Using transcriptomic profiling, ChIP assays, and hormone responsiveness tests, we found evidence that GIS2 may positively regulate SQE5, linking sterol biosynthesis to drought tolerance, and negatively influence SEN1, potentially delaying senescence via ABA signaling. Conversely, ZFP8 was associated with the regulation of stress-responsive targets like PR-4, suggesting a role in connecting trichome function to pathogen defense. Spatial specificity with GIS2 active in inflorescence stems and ZFP8 in leaves indicates functional divergence, while shared targets such as SPL15 suggest possible evolutionary conservation. GA was observed to stabilize GIS2 and coincide with SQE5 induction, whereas SEN1 repression appeared to occur independently of GA, indicating context-dependent regulatory mechanisms. These findings contribute to the understanding of C2H2 zinc finger proteins as transcriptional integrators balancing developmental precision and environmental responsiveness. By clarifying promoter-specific DNA associations and hormone-linked expression trends, this work offers a foundation for future strategies to engineer crops with improved stress resilience and integrates fundamental plant biology with applied agricultural research.

Supplementary Materials

The following supporting information can be downloaded at: https://www.mdpi.com/article/10.3390/ijms26157265/s1.

Author Contributions

Conceptualization, M.U.Y. and Y.G.; methodology, M.U.Y., L.S. and C.Y.; software, not applicable; validation, M.U.Y., L.S. and C.Y.; formal analysis, M.U.Y., L.S. and C.Y.; investigation, M.U.Y., L.S. and C.Y.; resources, B.L.; data curation, M.U.Y.; writing—original draft preparation, M.U.Y.; writing—review and editing, Y.G.; visualization, M.U.Y.; supervision, Y.G.; project administration, Y.G.; funding acquisition, Y.G. All authors have read and agreed to the published version of the manuscript.

Funding

This research was funded by the National Natural Science Foundation of China, Grant No. 32370339, and the China Postdoctoral Science Foundation, Grant No. 2024M752816.

Institutional Review Board Statement

Not applicable.

Informed Consent Statement

Not applicable.

Data Availability Statement

The data presented in this study are available on request from the corresponding author.

Conflicts of Interest

The authors declare no conflicts of interest.

Abbreviations

The following abbreviations are used in this manuscript:
ABAAbscisic Acid
CHXCycloheximide
ChIPChromatin Immunoprecipitation
CKCytokinin
DEXDexamethasone
GAGibberellic Acid
GFPGreen Fluorescent Protein
qRT-PCRQuantitative Real-Time Polymerase Chain Reaction
SQE5Squalene Monooxygenase 5
SEN1Senescence-Associated Gene 1
TFTranscription Factor

References

  1. Hülskamp, M.; Miséra, S.; Jürgens, G. Genetic dissection of trichome cell development in Arabidopsis. Cell 1994, 76, 555–566. [Google Scholar] [CrossRef] [PubMed]
  2. Szymanski, D.B.; Lloyd, A.M.; Marks, M.D. Progress in the molecular genetic analysis of trichome initiation and morphogenesis in Arabidopsis. Trends Plant Sci. 2000, 5, 214–219. [Google Scholar] [CrossRef] [PubMed]
  3. Yasin, M.U.; Liu, Y.; Wu, M.; Chen, N.; Gan, Y. Regulatory mechanisms of trichome and root hair development in Arabidopsis. Plant Mol. Biol. 2025, 115, 14. [Google Scholar] [CrossRef]
  4. Han, G.; Li, Y.; Yang, Z.; Wang, C.; Zhang, Y.; Wang, B. Molecular mechanisms of plant trichome development. Front. Plant Sci. 2022, 13, 910228. [Google Scholar] [CrossRef] [PubMed]
  5. Payne, C.T.; Zhang, F.; Lloyd, A.M. GL3 encodes a bHLH protein that regulates trichome development in Arabidopsis through interaction with GL1 and TTG1. Genetics 2000, 156, 1349–1362. [Google Scholar] [CrossRef] [PubMed]
  6. Schellmann, S.; Schnittger, A.; Kirik, V.; Wada, T.; Okada, K.; Beermann, A.; Thumfahrt, J.; Jürgens, G.; Hülskamp, M. TRIPTYCHON and CAPRICE mediate lateral inhibition during trichome and root hair patterning in Arabidopsis. EMBO J. 2002, 21, 5036–5046. [Google Scholar] [CrossRef]
  7. Hung, F.Y.; Chen, J.H.; Feng, Y.R.; Lai, Y.C.; Yang, S.; Wu, K. Arabidopsis JMJ29 is involved in trichome development by regulating the core trichome initiation gene GLABRA3. Plant J. 2020, 103, 1735–1743. [Google Scholar] [CrossRef]
  8. Wang, Y.; Tian, H.; Wang, W.; Wang, X.; Zheng, K.; Hussain, S.; Lin, R.; Wang, T.; Wang, S. The carboxyl-terminus of TRANSPARENT TESTA GLABRA1 is critical for its functions in Arabidopsis. Int. J. Mol. Sci. 2021, 22, 10039. [Google Scholar] [CrossRef]
  9. Pesch, M.; Hülskamp, M. One, two, three… models for trichome patterning in Arabidopsis? Curr. Opin. Plant Biol. 2009, 12, 587–592. [Google Scholar] [CrossRef]
  10. Balkunde, R.; Deneer, A.; Bechtel, H.; Zhang, B.; Herberth, S.; Pesch, M.; Jaegle, B.; Fleck, C.; Hülskamp, M. Identification of the trichome patterning core network using data from weak ttg1 alleles to constrain the model space. Cell Rep. 2020, 33, 108497. [Google Scholar] [CrossRef]
  11. Zhang, B.; Deneer, A.; Fleck, C.; Hülskamp, M. Quantitative analysis of MBW complex formation in the context of trichome patterning. Front. Plant Sci. 2024, 15, 1331156. [Google Scholar] [CrossRef]
  12. Bouyer, D.; Geier, F.; Kragler, F.; Schnittger, A.; Pesch, M.; Wester, K.; Balkunde, R.; Timmer, J.; Fleck, C.; Hülskamp, M. Two-dimensional patterning by a trapping/depletion mechanism: The role of TTG1 and GL3 in Arabidopsis trichome formation. PLoS Biol. 2008, 6, e141. [Google Scholar] [CrossRef] [PubMed]
  13. Gan, Y.; Liu, C.; Yu, H.; Broun, P. Integration of cytokinin and gibberellin signalling by Arabidopsis transcription factors GIS, ZFP8 and GIS2 in the regulation of epidermal cell fate. Development 2007, 134, 2073–2081. [Google Scholar] [CrossRef] [PubMed]
  14. Gan, Y.; Yu, H.; Peng, J.; Broun, P. Genetic and molecular regulation by DELLA proteins of trichome development in Arabidopsis. Plant Physiol. 2007, 145, 1031–1042. [Google Scholar] [CrossRef]
  15. Greenboim-Wainberg, Y.; Maymon, I.; Borochov, R.; Alvarez, J.; Olszewski, N.; Ori, N.; Eshed, Y.; Weiss, D. Cross talk between gibberellin and cytokinin: The Arabidopsis GA response inhibitor SPINDLY plays a positive role in cytokinin signaling. Plant Cell 2005, 17, 92–102. [Google Scholar] [CrossRef]
  16. Zhang, P.; Liu, F.; Abdelrahman, M.; Song, Q.; Wu, F.; Li, R.; Wu, M.; Herrera-Estrella, L.; Tran, L.S.P.; Xu, J. ARR1 and ARR12 modulate arsenite toxicity responses in Arabidopsis roots by transcriptionally controlling the actions of NIP1; 1 and NIP6; 1. Plant J. 2024, 120, 1536–1551. [Google Scholar] [CrossRef]
  17. Qi, T.; Song, S.; Ren, Q.; Wu, D.; Huang, H.; Chen, Y.; Fan, M.; Peng, W.; Ren, C.; Xie, D. The Jasmonate-ZIM-domain proteins interact with the WD-Repeat/bHLH/MYB complexes to regulate Jasmonate-mediated anthocyanin accumulation and trichome initiation in Arabidopsis thaliana. Plant Cell 2011, 23, 1795–1814. [Google Scholar] [CrossRef]
  18. Li, Y.; Sun, A.; Wu, Q.; Zou, X.; Chen, F.; Cai, R.; Xie, H.; Zhang, M.; Guo, X. Comprehensive genomic survey, structural classification and expression analysis of C 2 H 2-type zinc finger factor in wheat (Triticum aestivum L.). BMC Plant Biol. 2021, 21, 380. [Google Scholar] [CrossRef] [PubMed]
  19. Shuai, Y.; Feng, G.; Yang, Z.; Liu, Q.; Han, J.; Xu, X.; Nie, G.; Huang, L.; Zhang, X. Genome-wide identification of C2H2-type zinc finger gene family members and their expression during abiotic stress responses in orchardgrass (Dactylis glomerata). Genome 2022, 64, 189–203. [Google Scholar] [CrossRef]
  20. Kubo, K.-i.; Sakamoto, A.; Kobayashi, A.; Rybka, Z.; Kanno, Y.; Nakagawa, H.; Nishino, T.; Takatsuji, H. Cys2/His2 zinc-finger protein family of petunia: Evolution and general mechanism of target-sequence recognition. Nucleic Acids Res. 1998, 26, 608–615. [Google Scholar] [CrossRef]
  21. Krishna, S.S.; Majumdar, I.; Grishin, N.V. Structural classification of zinc fingers: Survey and summary. Nucleic Acids Res. 2003, 31, 532–550. [Google Scholar] [CrossRef] [PubMed]
  22. Englbrecht, C.C.; Schoof, H.; Böhm, S. Conservation, diversification and expansion of C2H2 zinc finger proteins in the Arabidopsis thaliana genome. BMC Genom. 2004, 5, 39. [Google Scholar] [CrossRef]
  23. Liao, X.; Wang, L.; Zhu, S.; Zheng, F.; Yang, C. Identification, genomic organization, and expression profiles of single C2H2 zinc finger transcription factors in tomato (Solanum lycopersicum). J. Appl. Genet. 2021, 62, 1–15. [Google Scholar] [CrossRef]
  24. Zuo, Z. From motif to function: Inferring the functions of long zinc finger proteins through combinatorial selection. bioRxiv 2022. [Google Scholar] [CrossRef]
  25. Li, M.; Dong, X.; Long, G.; Zhang, Z.; Han, C.; Wang, Y. Genome-wide analysis of Q-Type C2H2 ZFP genes in response to biotic and abiotic stresses in Sugar Beet. Biology 2023, 12, 1309. [Google Scholar] [CrossRef]
  26. Wang, D.; Qiu, Z.; Xu, T.; Yao, S.; Chen, M.; Li, Q.; Agassin, R.H.; Ji, K. Transcriptomic identification of potential C2H2 zinc finger protein transcription factors in Pinus massoniana in response to biotic and abiotic stresses. Int. J. Mol. Sci. 2024, 25, 8361. [Google Scholar] [CrossRef] [PubMed]
  27. Liu, Y.; Khan, A.R.; Azhar, W.; Wong, C.E.; Li, Y.; Huang, Y.; Cao, X.; Liu, Z.; Gan, Y. Cys2/His2-type zinc finger proteins regulate plant growth and development. Crit. Rev. Plant Sci. 2022, 41, 351–363. [Google Scholar] [CrossRef]
  28. Sakai, H.; Medrano, L.J.; Meyerowitz, E.M. Role of SUPERMAN in maintaining Arabidopsis floral whorl boundaries. Nature 1995, 378, 199–203. [Google Scholar] [CrossRef]
  29. Lyu, T.; Cao, J. Cys2/His2 zinc-finger proteins in transcriptional regulation of flower development. Int. J. Mol. Sci. 2018, 19, 2589. [Google Scholar] [CrossRef]
  30. Hirakawa, T.; Tanno, S.; Ohara, K. N-acetylglutamic acid alleviates oxidative stress based on histone acetylation in plants. Front. Plant Sci. 2023, 14, 1165646. [Google Scholar] [CrossRef] [PubMed]
  31. Yang, K.; Li, C.-Y.; An, J.-P.; Wang, D.-R.; Wang, X.; Wang, C.-K.; You, C.-X. The C2H2-type zinc finger transcription factor MdZAT10 negatively regulates drought tolerance in apple. Plant Physiol. Biochem. 2021, 167, 390–399. [Google Scholar] [CrossRef]
  32. Gan, Y.; Kumimoto, R.; Liu, C.; Ratcliffe, O.; Yu, H.; Broun, P. GLABROUS INFLORESCENCE STEMS modulates the regulation by gibberellins of epidermal differentiation and shoot maturation in Arabidopsis. Plant Cell 2006, 18, 1383–1395. [Google Scholar] [CrossRef]
  33. Zhou, Z.; An, L.; Sun, L.; Zhu, S.; Xi, W.; Broun, P.; Yu, H.; Gan, Y. Zinc finger protein5 is required for the control of trichome initiation by acting upstream of zinc finger protein8 in Arabidopsis. Plant Physiol. 2011, 157, 673–682. [Google Scholar] [CrossRef] [PubMed]
  34. Silverstone, A.L.; Mak, P.Y.A.; Martinez, E.C.; Sun, T.-p. The new RGA locus encodes a negative regulator of gibberellin response in Arabidopsis thaliana. Genetics 1997, 146, 1087–1099. [Google Scholar] [CrossRef] [PubMed]
  35. Zeng, J.; Yang, L.; Tian, M.; Xie, X.; Liu, C.; Ruan, Y. SDG26 is involved in trichome control in Arabidopsis thaliana: Affecting phytohormones and adjusting accumulation of H3K27me3 on genes related to trichome growth and development. Plants 2023, 12, 1651. [Google Scholar] [CrossRef] [PubMed]
  36. Gan, L.; Xia, K.; Chen, J.-G.; Wang, S. Functional characterization of TRICHOMELESS2, a new single-repeat R3 MYB transcription factor in the regulation of trichome patterning in Arabidopsis. BMC Plant Biol. 2011, 11, 176. [Google Scholar] [CrossRef]
  37. Zhou, Z.; Sun, L.; Zhao, Y.; An, L.; Yan, A.; Meng, X.; Gan, Y. Z inc F inger P rotein 6 (ZFP 6) regulates trichome initiation by integrating gibberellin and cytokinin signaling in A rabidopsis thaliana. New Phytol. 2013, 198, 699–708. [Google Scholar] [CrossRef]
  38. Zhang, A.; Liu, Y.; Yu, C.; Huang, L.; Wu, M.; Wu, J.; Gan, Y. Zinc finger protein 1 (ZFP1) is involved in trichome initiation in Arabidopsis thaliana. Agriculture 2020, 10, 645. [Google Scholar] [CrossRef]
  39. Liu, Y.; Yang, S.; Khan, A.R.; Gan, Y. TOE1/TOE2 interacting with GIS to control trichome development in Arabidopsis. Int. J. Mol. Sci. 2023, 24, 6698. [Google Scholar] [CrossRef]
  40. Kannangara, R.; Branigan, C.; Liu, Y.; Penfield, T.; Rao, V.; Mouille, G.; Höfte, H.; Pauly, M.; Riechmann, J.L.; Broun, P. The transcription factor WIN1/SHN1 regulates cutin biosynthesis in Arabidopsis thaliana. Plant Cell 2007, 19, 1278–1294. [Google Scholar] [CrossRef]
  41. Sun, L.; Zhang, A.; Zhou, Z.; Zhao, Y.; Yan, A.; Bao, S.; Yu, H.; Gan, Y. GLABROUS INFLORESCENCE STEMS 3 (GIS 3) regulates trichome initiation and development in Arabidopsis. New Phytol. 2015, 206, 220–230. [Google Scholar] [CrossRef]
  42. Posé, D.; Castanedo, I.; Borsani, O.; Nieto, B.; Rosado, A.; Taconnat, L.; Ferrer, A.; Dolan, L.; Valpuesta, V.; Botella, M.A. Identification of the Arabidopsis dry2/sqe1-5 mutant reveals a central role for sterols in drought tolerance and regulation of reactive oxygen species. Plant J. 2009, 59, 63–76. [Google Scholar] [CrossRef]
  43. Lim, P.O.; Kim, Y.; Breeze, E.; Koo, J.C.; Woo, H.R.; Ryu, J.S.; Park, D.H.; Beynon, J.; Tabrett, A.; Buchanan-Wollaston, V.; et al. Overexpression of a chromatin architecture-controlling AT-hook protein extends leaf longevity and increases the post-harvest storage life of plants. Plant J. 2007, 52, 1140–1153. [Google Scholar] [CrossRef]
  44. Fischer-Kilbienski, I.; Miao, Y.; Roitsch, T.; Zschiesche, W.; Humbeck, K.; Krupinska, K. Nuclear targeted AtS40 modulates senescence associated gene expression in Arabidopsis thaliana during natural development and in darkness. Plant Mol. Biol. 2010, 73, 379–390. [Google Scholar] [CrossRef] [PubMed]
  45. Wu, P.; Ma, L.; Hou, X.; Wang, M.; Wu, Y.; Liu, F.; Deng, X.W. Phosphate starvation triggers distinct alterations of genome expression in Arabidopsis roots and leaves. Plant Physiol. 2003, 132, 1260–1271. [Google Scholar] [CrossRef] [PubMed]
  46. Liu, B.; Lee, Y.-R.J. Spindle assembly and mitosis in plants. Annu. Rev. Plant Biol. 2022, 73, 227–254. [Google Scholar] [CrossRef]
  47. Sablowski, R.; Carnier Dornelas, M. Interplay between cell growth and cell cycle in plants. J. Exp. Bot. 2014, 65, 2703–2714. [Google Scholar] [CrossRef]
  48. Rawat, S.S.; Laxmi, A. Sugar signals pedal the cell cycle! Front. Plant Sci. 2024, 15, 1354561. [Google Scholar] [CrossRef]
  49. Zhou, L.H.; Liu, S.B.; Wang, P.F.; Lu, T.J.; Xu, F.; Genin, G.M.; Pickard, B.G. The Arabidopsis trichome is an active mechanosensory switch. Plant Cell Environ. 2017, 40, 611–621. [Google Scholar] [CrossRef]
  50. Kotak, J.; Saisana, M.; Gegas, V.; Pechlivani, N.; Kaldis, A.; Papoutsoglou, P.; Makris, A.; Burns, J.; Kendig, A.L.; Sheikh, M.; et al. The histone acetyltransferase GCN5 and the transcriptional coactivator ADA2b affect leaf development and trichome morphogenesis in Arabidopsis. Planta Int. J. Plant Biol. 2018, 248, 613–628. [Google Scholar] [CrossRef] [PubMed]
  51. Xue, B.; Zhang, C.; Wang, Y.; Liu, L.; Wang, W.; Schiefelbein, J.; Yu, F.; An, L. HECT-type ubiquitin ligase KAKTUS mediates the proteasome-dependent degradation of cyclin-dependent kinase inhibitor KRP2 during trichome morphogenesis in Arabidopsis. Plant J. 2023, 116, 871–886. [Google Scholar] [CrossRef]
  52. Hark, A.T.; McCain, E.R. The histone acetyltransferase GCN5 and the transcriptional coactivator ADA2b affect trichome initiation in Arabidopsis thaliana. Micropublication Biol. 2019. [Google Scholar] [CrossRef]
  53. Fukazawa, J.; Mori, K.; Ando, H.; Mori, R.; Kanno, Y.; Seo, M.; Takahashi, Y. Jasmonate inhibits plant growth and reduces gibberellin levels via microRNA5998 and transcription factor MYC2. Plant Physiol. 2023, 193, 2197–2214. [Google Scholar] [CrossRef]
  54. Wang, L.; Ma, C.; Wang, S.; Yang, F.; Sun, Y.; Tang, J.; Luo, J.; Wu, J. Ethylene and jasmonate signaling converge on gibberellin catabolism during thigmomorphogenesis in Arabidopsis. Plant Physiol. 2024, 194, 758–773. [Google Scholar] [CrossRef]
  55. Liu, Y.; Ma, X.; Li, Y.; Yang, X.; Cheng, W. Zinc Finger Protein8 (GhZFP8) regulates the initiation of trichomes in Arabidopsis and the development of fiber in cotton. Plants 2024, 13, 492. [Google Scholar] [CrossRef]
  56. Yang, C.; Sun, L.; Yasin, M.U.; Zulqarnain, H.; Ali, B.; Liu, Y.; Liu, B.; Gan, Y. GIS mediates GA signaling to directly target the expression of SPL15 to regulate trichome development in Arabidopsis thaliana. Plant Physiol. Biochem. 2025, 225, 109975. [Google Scholar] [CrossRef]
  57. Hyun, Y.; Richter, R.; Vincent, C.; Martinez-Gallegos, R.; Porri, A.; Coupland, G. Multi-layered regulation of SPL15 and cooperation with SOC1 integrate endogenous flowering pathways at the Arabidopsis shoot meristem. Dev. Cell 2016, 37, 254–266. [Google Scholar] [CrossRef]
  58. Gulati, G.S.; D’Silva, J.P.; Liu, Y.; Wang, L.; Newman, A.M. Profiling cell identity and tissue architecture with single-cell and spatial transcriptomics. Nat. Rev. Mol. Cell Biol. 2025, 26, 11–31. [Google Scholar] [CrossRef] [PubMed]
  59. Jesús-Pires, C.d.; Ferreira-Neto, J.R.C.; Oliveira-Silva, R.L.d.; Silva, J.B.d.; Silva, M.D.d.; Costa, A.F.d.; Benko-Iseppon, A.M. Genome-Wide Identification and Stress Responses of Cowpea Thaumatin-like Proteins: A Comprehensive Analysis. Plants 2024, 13, 3245. [Google Scholar] [CrossRef] [PubMed]
  60. Clough, S.J.; Bent, A.F. Floral dip: A simplified method for Agrobacterium-mediated transformation of Arabidopsis thaliana. Plant J. 1998, 16, 735–743. [Google Scholar] [CrossRef] [PubMed]
  61. Craft, J.; Samalova, M.; Baroux, C.; Townley, H.; Martinez, A.; Jepson, I.; Tsiantis, M.; Moore, I. New pOp/LhG4 vectors for stringent glucocorticoid-dependent transgene expression in Arabidopsis. Plant J. 2005, 41, 899–918. [Google Scholar] [CrossRef]
  62. Gan, Y.; Filleur, S.; Rahman, A.; Gotensparre, S.; Forde, B.G. Nutritional regulation of ANR1 and other root-expressed MADS-box genes in Arabidopsis thaliana. Planta 2005, 222, 730–742. [Google Scholar] [CrossRef]
  63. Qazi, K.; Anwar, T. Comparative Analysis of R and Mathematica Package for Differential Gene Expression Analysis Using Microarray Dataset on Pancreatic Cancer: Comparative Analysis of R and Mathematica Package. Pak. Biomed. J. 2023, 6, 21–26. [Google Scholar] [CrossRef]
  64. Jun, J.H.; Ha, C.M.; Fletcher, J.C. BLADE-ON-PETIOLE1 coordinates organ determinacy and axial polarity in Arabidopsis by directly activating ASYMMETRIC LEAVES2. Plant Cell 2010, 22, 62–76. [Google Scholar] [CrossRef] [PubMed]
  65. Ionascu, A.; Ecovoiu, A.A.; Chifiriuc, M.C.; Ratiu, A.C. qDATA-an R application implementing a practical framework for analyzing quantitative Real-Time PCR data. BioTechniques 2024, 76, 559–573. [Google Scholar] [CrossRef] [PubMed]
Figure 1. The expression of GIS2 and ZFP8 in the main stem after treatment with DEX for 2 h, 4 h, and 6 h. (A) The expression of GIS2 in transgenic pOp6:GIS2-5-1 line. (B) The expression of GIS2 in transgenic pOp6:GIS2-6-2 line. (C) The expression of ZFP8 in transgenic pOp6-ZFP8:LhGR-6-3 line. (D) The expression of ZFP8 in transgenic pOp6-ZFP8:LhGR-3-1 line. Note: The relative gene expression value was calculated by using UBQ10 as the housekeeping gene against the wild type. Error bars represent standard error. The t-test was calculated at 1% (p < 0.01 with significant level **) probability.
Ijms 26 07265 g001
Figure 2. The relative expression of 40 selected genes in the main stem of gis2, 35S:GIS2 (O-3-1), zfp8, and 35S:ZFP8 (O-1-1) compared to the wild type (WT). (A) The expression of 20 lowest expressed genes among 142 genes in gis2/WT microarray data. (B) The expression of 20 most highly expressed genes among 142 genes in gis2/WT microarray data. (C) The expression of 20 lowest expressed genes among 138 genes in zfp8/WT microarray data. (D) The expression of 20 most highly expressed genes among 138 genes in zfp8/WT microarray data. Note: The relative gene expression value was calculated by using UBQ10 as the housekeeping gene against the wild type. Error bars represent standard error.
Ijms 26 07265 g002
Figure 3. The downstream genes regulated by GIS2 identified through microarray assay. (A) Upregulated genes in gis2/WT VS downregulated genes in DEX-induced GIS2/mock. (B) Downregulated genes in gis2/WT VS upregulated genes in DEX-induced GIS2/mock. (C) Candidate genes regulated by GIS2 by GO category analyses.
Ijms 26 07265 g003
Figure 4. The relative expression of nine selected transcriptional factors in the main stem of gis2 and 35S:GIS2 (O-8), and the relative expression of fifteen selected transcriptional factors in the main stem of zfp8 and 35S:ZFP8 (O-1-1). (A) The relative expression of 4 transcriptional factors positively regulated by GIS2. (B) The relative expression of 5 transcriptional factors negatively regulated by GIS2. (C) The relative expression of 8 transcriptional factors positively regulated by ZFP8. (D) The relative expression of 7 transcriptional factors negatively regulated by ZFP8. Note: The relative gene expression value was calculated by using UBQ10 as the housekeeping gene against the wild type. Error bars represent standard error. The t-test was calculated at either 5% (p < 0.05 with significant level *) or at 1% (p < 0.01 with significant level **) probability.
Ijms 26 07265 g004
Figure 5. The downstream genes regulated by ZFP8 identified through microarray assay. (A) Upregulated genes in zfp8/WT vs. downregulated genes in DEX-induced ZFP8/mock. (B) Downregulated genes in zfp8/WT vs. upregulated genes in DEX-induced ZFP8/mock. (C) Candidate 138 (85 + 53) genes regulated by ZFP8 by GO category analyses.
Ijms 26 07265 g005
Figure 6. The relative gene expression of GIS2 in four 35S:GIS2-GR::gis2 transgenic lines compared to the wild type (WT), and the relative gene expression of candidate genes regulated by GIS2 after treatment with DEX/mock and DEX + CHX/CHX. (A) The vector diagram of 35S:GIS2-GR. (B) The relative gene expression of GIS2. (C) The relative gene expression of At5g24150, At4g01080, and At5g60890 positively regulated by GIS2. (D) The relative gene expression of At4g17460, At4g35770, At3g45860, and At5g45890 negatively regulated by GIS2. Note: The value was calculated by using UBQ10 as the housekeeping gene against wild type. Error bars represent standard error. The t-test was calculated at either 5% (p < 0.05 with significant level *) or at 1% (p < 0.01 with significant level **).
Ijms 26 07265 g006
Figure 7. ChIP analysis of At5g24150 promoter regions bound by GIS2 and At4g35770 promoter regions bound by GIS2. (A) Schematic diagram of the At5g24150 promoter. The arrowheads indicate the sites containing either a single mismatch or a perfect match from the consensus binding sequence A[AG/CT]CN AC for C2H2 zinc finger proteins. (B) Quantitative real-time PCR assay of DNAs after ChIP. (C) Schematic diagram of the At4g35770 promoter. The arrowheads indicate the sites containing either a single mismatch or a perfect match from the consensus binding sequence A[AG/CT]CN AC for C2H2 zinc finger proteins. (D) Quantitative real-time PCR assay of DNAs after ChIP. Error bars represent standard error. The t-test was calculated at 1% (p < 0.01 with significant level **).
Ijms 26 07265 g007
Figure 8. The protein expression of GIS2 and the gene expression of At5g24150 and At4g35770 after treatment with 100 µM GA. (A) Detection of GIS2 protein after 4 h and 8 h GA (100 µM) treatment by Western blotting. (B) The relative gene expression of At5g24150 and At4g35770 in inflorescence organs of wild type and ga1-3 after GA (100 µM) treatment for 4 h and 6 h. Note: The value was calculated by using UBQ10 as the housekeeping gene against the wild type. Error bars represent standard error.
Ijms 26 07265 g008
Figure 9. Gene ontology (GO) analysis of significant genes regulated by ZFP8 involved in biological processes. (A) GO analysis of the significant genes upregulated by ZFP8. (B) GO analysis of the significant genes downregulated by ZFP8.
Ijms 26 07265 g009
Table 1. The 20 lowest expressed genes among 142 genes in gis2/WT microarray data.
Gene IDDescription of Genesgis2/WTDex/Mock
At4g12310Flavonoid 3,5-hydroxylase -like protein0.261.73
At1g62560Similar to flavin-containing monooxygenase0.271.60
At3g25760Hypothetical protein0.272.60
At1g73600Phosphoethanolamine N-methyltransferase0.281.62
At5g06650 *Zinc finger-like protein0.291.58
At1g23205Unknown protein0.312.87
At4g01080Hypothetical protein0.312.31
At5g60890Myb transcription factor homolog (ATR1)0.331.65
At5g24150Squalene monooxygenase0.343.28
At5g49480NaCl-inducible Ca2+-binding protein-like0.352.70
At3g50270Anthranilate N-hydroxycinnamoyl/benzoyltransferase0.351.74
At4g13410Putative protein Cyclic beta-1-3-glucan synthase0.352.05
At4g24350Putative protein storage protein0.371.74
At3g09440Heat-shock protein (At-hsc70-3)0.371.74
At3g21670Nitrate transporter0.371.79
At3g589903-isopropylmalate dehydratase-like protein0.381.50
At5g42760Putative protein similar to unknown protein0.381.55
At3g50280Anthranilate N-hydroxycinnamoyl/benzoyltransferase0.401.55
At4g34950Putative protein0.411.55
At3g44860AtPP -like protein0.413.03
The “*” represents GIS2 gene.
Table 2. The 20 most highly expressed genes among 142 genes in gis2/WT microarray data.
Gene IDDescription of Genesgis2/WT Dex/Mock
At4g35770Senescence-associated protein30.62 0.40
At3g47340Glutamine-dependent asparagine synthetase9.73 0.51
At1g10070Similar to branched-chain amino acid aminotransferase6.68 0.60
At2g17880Putative DnaJ protein5.57 0.53
At4g26320Putative protein4.93 0.62
At2g28630Putative fatty acid elongase3.32 0.57
At3g13450Branched-chain alpha-keto acid dehydrogenase3.26 0.49
At4g23870Putative protein predicted proteins3.22 0.44
At4g28040Medicago nodulin N21-like protein MtN21 gene3.22 0.61
At2g44500Similar to axi 1 protein from Nicotiana tabacum2.82 0.65
At4g33150Lysine-ketoglutarate reductase/saccharopine2.81 0.60
At3g45860Protein kinase—like receptor-like protein kinase RLK32.79 0.44
At4g17460Homeobox-leucine zipper protein HAT1 (hd-zip protein 1)2.76 0.52
At2g42870Unknown protein2.51 0.52
At4g10270Probable wound-induced protein wound-induced protein2.50 0.43
At3g05890Low-temperature and salt-responsive protein2.46 0.46
At1g31040Hypothetical protein predicted by gene finder2.45 0.60
At5g06980Unknown protein2.39 0.44
At3g45970Putative protein cim1 induced allergen2.30 0.54
At5g45890Senescence-specific cysteine protease SAG122.08 0.11
Table 3. The 20 lowest expressed genes of 138 genes in zfp8/WT microarray data.
Gene IDDescription of Geneszfp8/WT Dex/Mock
At1g68840Putative DNA-binding protein (RAV2-like)0.241.75
At1g78860Hypothetical protein predicted0.441.89
At3g22060Unknown protein0.44 3.58
At1g21110O-methyltransferase0.47 1.79
At5g4854033 kDa secretory protein-like0.50 4.12
At2g26560Similar to latex allergen from Hevea brasiliensis0.50 1.73
At1g02930Glutathione S-transferase0.52 1.85
At4g13410Putative protein Cyclic beta-1-3-glucan synthase0.54 1.60
At3g04720Similar to wound-induced protein (WIN2) precursor0.54 1.70
At1g80840Putative similar to WRKY transcription factor0.55 1.83
At3g16670Unknown protein0.56 1.52
At1g55450Similar to embryo-abundant protein0.57 1.55
At1g51800Receptor protein kinase0.59 1.88
At3g16530Putative lectin similar to lectin0.59 2.37
At2g01890Putative purple acid phosphatase0.59 1.51
At1g27730Salt-tolerance zinc finger protein0.59 2.16
At2g41940 *C2H2-type zinc finger protein0.60 24.21
At2g24580Putative sarcosine oxidase0.60 1.56
At1g31690Putative similar to copper amine oxidase0.61 2.65
At3g23250MYB-related transcription factor0.61 1.66
The “*” represents ZFP8 gene.
Table 4. The 20 most highly expressed genes of 138 genes in zfp8/WT microarray data.
Gene IDDescription of Geneszfp8/WT Dex/Mock
At5g35480Unknown protein3.91 0.36
At4g15750Hypothetical protein2.57 0.38
At1g72110Hypothetical protein2.55 0.60
At3g28510Putative mitochondrial protein2.27 0.61
At1g61810Putative similar to beta-glucosidase2.16 0.47
At3g25050Endoxyloglucan transferase2.15 0.55
At5g45890Senescence-specific cysteine protease SAG122.04 0.27
At3g57920Squamosa promoter-binding protein1.97 0.61
At5g62470MYB96 transcription factor-like protein1.92 0.63
At5g30426Putative protein1.85 0.61
At3g29370Expressed protein1.85 0.42
At4g39675Expressed protein1.82 0.42
At1g04220Putative beta-ketoacyl-CoA synthase1.82 0.64
At1g03170Hypothetical protein predicted by gene finder1.80 0.65
At5g56450ADP/ATP translocase-like protein1.79 0.62
At3g14395Expressed protein1.76 0.56
At4g26790Putative APG protein proline-rich protein APG1.71 0.49
At2g38900Putative protease inhibitor1.71 0.51
At5g41810Unknown protein1.71 0.63
At3g05890Low-temperature and salt-responsive protein (LTI6B) 1.70 0.54
Table 5. Predicted transcriptional factors among 142 candidate genes positively regulated by GIS2.
Gene IDTranscription FactorDescription of Genes
At5g06650 *C2H2Zinc finger (C2H2 type) family protein
AT1G32240GARP-G2-likeMYB family transcription factor (KAN2)
AT1G32640bHLHBasic helix-loop-helix (bHLH) protein (RAP-1)
AT3G46130MYBMYB family transcription factor (MYB48)
AT5G60890MYBReceptor-like protein kinase (ATR1) (MYB34)
The “*” represents GIS2 gene.
Table 6. Predicted transcriptional factors among 142 candidate genes negatively regulated by GIS2.
Gene IDTranscription FactorDescription of Genes
AT1G31040PLATZZinc-binding protein-related
AT1G74660ZF-HDZinc finger homeobox family protein
AT3G59060bHLHBasic helix-loop-helix (bHLH) family protein
AT4G17460HBHomeobox-leucine zipper protein 1 (HAT1)
AT5G25390AP2-EREBPEncodes a member of the ERF (ethylene response factor) subfamily B-6 of ERF/AP2 family.
Table 7. Predicted transcriptional factors among 138 candidate genes positively regulated by ZFP8.
Gene IDTranscription FactorDescription of Genes
AT1G27730C2H2Identical to salt-tolerance zinc finger protein (ZAT10)
AT1G68840AP2-EREBPDNA-binding protein RAV2 (RAV2)/AP2
AT1G80840WRKYSimilar to WRKY transcription factor
AT2G30250WRKYWRKY family transcription factor(WRKY25)
AT3G23250MYBMYB family transcription factor (MYB15)
AT3G55980C3HZinc finger (CCCH-type) family protein
AT2G41940 *C2H2Zinc finger (C2H2 type) family protein
AT5G04340C2H2Zinc finger (C2H2 type) family protein
AT5G47230AP2-EREBPEncodes a member of the ERF (ethylene response factor)
The “*” represents ZFP8 gene.
Table 8. Predicted transcriptional factors among 138 candidate genes negatively regulated by ZFP8.
Gene IDTranscription FactorDescription of Genes
AT1G26960HBHomeobox-leucine zipper protein
AT1G53160SBPSquamosa promoter-binding protein-like 4 (SPL4)
AT3G15500NACNo apical meristem (NAM) family protein (NAC3)
AT3G57920SBPSimilar to squamosa promoter binding protein-like 9
AT5G15830bZIPSimilar to common plant regulatory factor
AT5G44210AP2-EREBPEncodes a member of the ERF (ethylene response factor) subfamily
AT5G62470MYBMYB family transcription factor (MYB96)
Disclaimer/Publisher’s Note: The statements, opinions and data contained in all publications are solely those of the individual author(s) and contributor(s) and not of MDPI and/or the editor(s). MDPI and/or the editor(s) disclaim responsibility for any injury to people or property resulting from any ideas, methods, instructions or products referred to in the content.

