Abstract
Drug resistance remains a critical barrier to effective treatment in several cancers, particularly triple-negative breast cancer (TNBC). Estrogen receptor α36 (ERα36), a variant of the estrogen receptor in ER-negative breast cancer cells, plays important roles in cancer cell proliferation. We investigated the role of ERα36 in regulating multidrug resistance protein 1 (MDR1) in MDA-MB-231 human breast cancer cells. The activation of ERα36 by BSA-conjugated estradiol (BSA-E2) increased cell viability under Adriamycin exposure, suggesting its involvement in promoting drug resistance. BSA-E2 treatment significantly reduced the intracellular rhodamine-123 levels by activating the MDR1 efflux function, which was linked to increased MDR1 transcription and protein expression. The mechanical ERα36-mediated BSA-E2-induced activation of EGFR and downstream signaling via c-Src led to an activation of the Akt/ERK pathways and transcription factors, NF-κB and CREB. Additionally, ERα36 is involved in activating Wnt/β-catenin pathways to induce MDR1 expression. The silencing of ERα36 inhibited the BSA-E2-induced phosphorylation of Akt and ERK, thereby reducing MDR1 expression via downregulation of NF-κB and CREB as well as Wnt/β-catenin signaling. These findings demonstrated that ERα36 promotes MDR1 expression through multiple non-genomic signaling cascades, including Akt/ERK-NF-κB/CREB and Wnt/β-catenin pathways, and highlight the role of ERα36 as a promising target to enhance chemotherapeutic efficacy in TNBC.
1. Introduction
Breast cancer presents as a global disease burden, ranking as the most prevalent cancer in women and the second most frequently diagnosed cancer overall [1]. Despite significant advancements in early detection and therapeutic strategies, treatment resistance remains a critical challenge in clinical oncology. Among various breast cancer subtypes, triple-negative breast cancer (TNBC) accounts for approximately 15–20% of all breast cancer cases and is mainly observed in younger women [2]. TNBC is defined by the lack of estrogen receptors (particularly estrogen receptor 66 alpha, ERα66), progesterone receptors (PRs), and human epidermal growth factor receptor 2 (HER2) expression in tumor cells. This absence of conventional therapeutic targets classified TNBC as receptor-negative, contributing to its poor prognosis and limited treatment options [3,4]. In clinical practice, chemotherapy remains the mainstay of systemic treatment for TNBC because it does not respond to endocrine therapies or HER2-targeted agents. Unfortunately, TNBC often develops multidrug resistance (MDR) and shows poor long-term outcomes [5].
The majority of breast tissue is hormone-dependent, especially on estradiol, and is controlled by estrogen secretion. Given this dependency, estrogen signaling is critically involved in the development and metastasis of breast cancer through genomic and non-genomic signaling pathways [6,7]. This signaling is mediated by estrogen receptors (ERs), primarily Erα and Erβ. These receptors are ligand-activated transcription factors that, upon binding to 17β-estradiol (E2)—the predominant estrogen in the body—form homo- or heterodimers (E2-ER complexes). These complexes then translocate to the nucleus to initiate the transcription of target genes via the genomic pathway [8]. In parallel, a rapid non-genomic pathway can be triggered by E2 binding to ERs located at the membrane or in the cytoplasm. Upon binding, it triggers kinase cascade activation and intracellular calcium signaling such as phosphatidylinositide3-kinase/protein kinase B (PI3K/Akt), mitogen-activated protein kinase/extracellular regulated kinase (MAPK/ERK), and cAMP/PKA pathways [9]. These activations influence multiple cellular processes like proliferation, migration, and survival [9,10,11].
In recent years, research attention has turned to alternative isoforms of ERs as potential targets for treating TNBC, which lacks the classical ERα66. Among ER isoforms, ERα36 has gained attention due to its distinct localization and function. ERα36 is a 36 kDa splice variant of ERα66 that lacks both transactivation domains AF-1 and AF-2 and possesses distinct N- and C-termini [12,13]. Unlike ERα66, ERα36 is primarily found at the plasma membrane and in the cytoplasm, where it mediates a rapid membrane-initiated non-genomic estrogen signaling pathway [14,15]. Through this pathway, ERα36 is linked to the imitation of MAPK and PI3K/Akt signaling cascades. Previous studies have demonstrated that MAPK and Akt activation are correlated with cell growth and proliferation as well as the invasion and metastasis of various cancers [16,17,18,19]. Notably, ERα36 is frequently co-expressed with membrane proteins, such as the epidermal growth factor receptor (EGFR), in TNBC cells. This co-expression contributes to tumor growth through the formation of proto-oncogene tyrosine protein kinase (Src)/EGFR signaling complexes [20,21,22]. Elevated ERα36 expression is particularly observed in ER-negative, TNBC, and HER2-positive breast cancers [20,23,24]. In TNBC tumors, ERα36 is correlated with drug resistance, suboptimal responses to chemotherapy, and the promotion of epithelial–mesenchymal transition (EMT). Clinical data indicate that patients whose tumors lack ERα36 expression respond more favorably to chemotherapy than those with ERα36-positive tumors [25]. Chaudhri et al. demonstrated that ERα36 enhances the proliferation of breast cancer cells by regulating the expression of adhesion molecules and proteins involved in EMT [26].
Multidrug resistance plays a critical role in limiting the efficacy of breast cancer treatment and contributes substantially to therapeutic failure. A key mechanism underlying MDR involves ATP-binding cassette (ABC) family transporters, also known as multidrug resistance transporters, which actively mediate drug efflux in cancer cells [27]. The ATP-dependent pumps enable cancer cells to evade cytotoxic effects by limiting intracellular drug accumulation. Alternative model suggests that P-glycoprotein (P-gp), encoded by the MDR1 gene, may function as a flippase, transporting substrates from the cytosolic side to the external leaflet of the lipid bilayer [28,29]. Elevated MDR1 (P-gp) expression promotes the active efflux of various hydrophobic anticancer drugs, ultimately reducing the efficacy of chemotherapy [30]. The transcription of MDR1 is tightly regulated by various transcription factors. Among these, nuclear factor-κB (NF-κB), cAMP response elements (CREB), and β-catenin have been shown to bind to regulatory elements within the MDR1 promoter and enhance its transcription [31]. These factors are known to be activated by membrane-initiated signaling pathways. For example, the activation of NF-κB through pathways involving Src kinase, PI3K/Akt, or MAPKs leads to IκB phosphorylation and degradation, which enables NF-κB nuclear translocation and the subsequent activation of genes involved in inflammation, survival, and drug resistance [32,33]. MDR1 activation was reported to occur through NF-κB activation, linking inflammatory and survival signaling to drug resistance in cancer cells [34,35]. Emerging evidence indicates that ER signaling and the Wnt/β-catenin pathways converge to enhance MDR1 expression. Both ERα and β-catenin can directly activate MDR1 transcription via binding to its promoter region. In MCF7 breast cancer cells, the interaction of ERα with WW domain-binding protein 2 (WBP2) actively modulates MDR1 expression and contributes to doxorubicin resistance [36]. Meanwhile, the Wnt/β-catenin signal is triggered in doxorubicin-induced MDR cancer cells, where β-catenin associates with the CREB binding protein (CBP) to drive MDR1 expression in an MEK/ERK-dependent manner [37]. While biologically relevant crosstalk between ER and Wnt/β-catenin signaling has been implicated in fostering chemoresistance, the direct molecular synergy between these pathways in the regulation of MDR1 has not been fully evaluated.
Although ERα36 is important for the tumorigenesis and progression in breast cancer, the specific mechanisms through which it contributes to MDR1 expression in TNBC remain poorly understood. Addressing this gap, we aimed to elucidate the role of ERα36 in regulating MDR1 expression in MDA-MB-231 breast cancer cells, with a particular focus on its potential crosstalk with the Wnt/β-catenin pathway. Delineating this relationship may provide insights into overcoming drug resistance in aggressive cancer subtypes.
2. Results
2.1. BSA-E2 Modulates Adriamycin Resistance by Enhancing MDR1-Mediated Efflux
Adriamycin (also known as doxorubicin) is a widely used chemotherapeutic agent, especially for treating breast cancer, leukemia, lymphomas, and sarcomas. However, Adriamycin resistance poses a major obstacle to effective cancer therapy. In ER-positive tumors, estrogen signaling is known to influence drug response. To specifically assess the involvement of membrane estrogen receptor signaling in Adriamycin-induced cytotoxicity, we employed BSA-conjugated estradiol (BSA-E2), which is membrane-impermeable and thus selectively activates membrane-associated estrogen receptors without triggering the genomic signaling pathway. By assessing cell viability following co-treatment with Adriamycin and BSA-E2, we realized that BSA-E2 increased the cell viability of MDA-MB-231 cells while it attenuated the cytotoxicity caused by Adriamycin (Figure 1A,B). Because Adriamycin-induced drug resistance is often associated with increased MDR1 expression, we further investigated whether treatment with BSA-E2 suppresses the expression of MDR1 using Rhodamine-123 (Rh-123) accumulation assays. Figure 1C shows that treatment with verapamil, an MDR1 inhibitor, efficiently increased the accumulation of the Rh123 fluorescent signal, indicating that MDR1 is associated with drug resistance. Cells treated with BSA-E2 showed a notable reduction in intracellular Rh-123 levels, suggesting that BSA-E2 likely increases MDR1 activity or expression, thereby promoting drug efflux and potentially contributing to drug resistance.
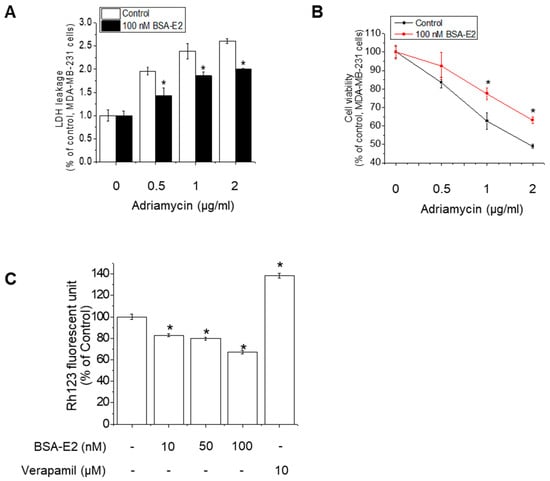
Figure 1.
BSA-E2 modulates Adriamycin resistance by enhancing MDR1-mediated efflux. (A) The effect of BSA-E2 on Adriamycin-induced cytotoxicity. Cells were pretreated with 100 nM of BSA-E2 for 24 h, followed by incubation with various concentrations of Adriamycin (0.5–2 µg/mL) for 48 h. Cell cytotoxicity was determined by LDH assay. (B) Cell viability was measured by the MTT assay. (C) Effect of BSA-E2 on intracellular Rh-123 accumulation. Cells were pretreated with BSA-E2 (0–100 nM) or 10 µM of verapamil for 48 h and then exposed to 5 µM of Rh-123 for 90 min. The intracellular Rh-123 accumulation was quantified based on fluorescence intensity. Data shown are the means ± SD from three independent experiments. * significantly different from the control at p < 0.01.
2.2. BSA-E2 Increases MDR1 Expression in MDA-MB-231 Cells
Since the development of the MDR1 phenotype in cancer cells is linked to MDR1 overexpression, we further examined the change in MDR1 mRNA levels upon treatment with BSA-E2 using RT-PCR. BSA-E2 treatment significantly increased the mRNA level of MDR1 in a time- and concentration-dependent manner (Figure 2A,B). Together, Western blot exhibited an elevated protein level of MDR1 (Figure 2C,D; quantified in Supplementary Figure S1A,B). Taken together, these data suggest that BSA-E2 promotes MDR1 expression in MDA-MB-231 cells.
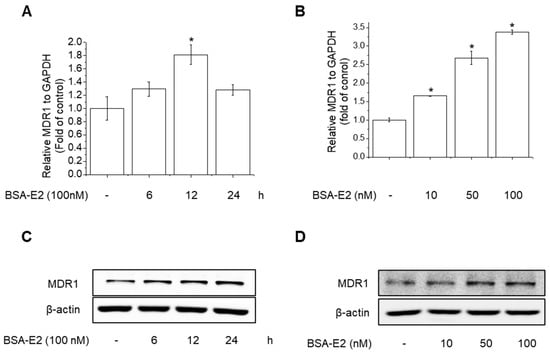
Figure 2.
BSA-E2 induces MDR1 expression in MDA-MB-231 cells. Cells were treated with 100 nM of BSA-E2 for 6–24 h (A) or with BSA-E2 (10–100 nM) for 12 h (B). mRNA levels were measured by qRT-PCR. MDR1 protein expression was determined by Western blot. (C) Cells were treated with 100 nM of BSA-E2 for 24 h. (D) Cells were treated with BSA-E2 (10–100 nM) for 24 h. Data shown are the means ± SD from three independent experiments. * significantly different from the control at p < 0.01.
2.3. BSA-E2 Induces MDR1 Expression via Activation of NF-κB and CREB Phosphorylation
MDR1 expression is governed by a variety of transcription factors, including NF-κB, particularly the p65 (RelA) subunit, and CREB, in which CREB binds to the cAMP response element to modulate the expression of MDR1 in breast cancer cells [38,39]. To investigate whether CREB and NF-κB activation are involved in Erα36-mediated MDR1 expression in MDA-MB-231 cells, we examined the activation of CREB and NF-κB in response to BSA-E2 treatment. BSA-E2 significantly increased CREB and NF-κB phosphorylation in a time- and concentration-dependent manner (Figure 3A,B; quantified in Supplementary Figure S2A,B). To further clarify the effects of BSA-E2 on NF-κB and CREB in BSA-E2-induced MDR1 expression, specific inhibitors, Bay 11-7082 (an NF-κB inhibitor) and 666-15 (a CREB inhibitor), were used. Pretreatment with Bay-117082 and 666-15 suppressed BSA-E2-induced MDR1 expression (Figure 3C,D; quantified in Supplementary Figure S2C,D). These results suggest that the transcriptional activity of NF-κB and CREB is important for BSA-E2-mediated regulation of MDR1 in MDA-MB-231 cells.
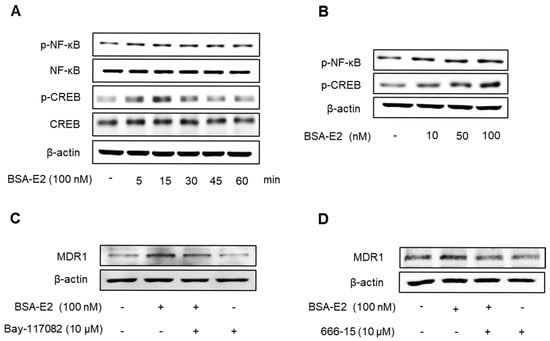
Figure 3.
BSA-E2 enhances the MDR1 level via the activation of NF-κB and CREB phosphorylation. Cells were treated with 100 nM of BSA-E2 for 5–60 min (A) or with BSA-E2 (10–100 nM) for 15 min (B). p-NF-κB and p-CREB protein levels were determined by Western blot. (C) The MDR1 protein level was determined by Western blot in cells pretreated with the NF-κB inhibitor, Bay-117082 (10 µM) for 1 h, followed by 100 nM of BSA-E2 for 24 h. (D) The MDR1 protein level was determined by Western blot in cells pretreated with the CREB inhibitor, 666-15 (10 µM) for 1 h, followed by 100 nM of BSA-E2 for 24 h.
2.4. Akt/ERK Signaling Pathway Is Important for ERα36-Mediated MDR1 Expression
Given that NF-κB and CREB are regulated through the Akt and ERK signaling pathways, we next investigated whether BSA-E2 influences the activation of these upstream pathways. Cells treated with BSA-E2 exhibited an increase in the phosphorylation of Akt and ERK in a manner dependent on both time and concentration (Figure 4A,B; quantified in Supplementary Figure S3A,B). Interestingly, pretreatment of LY294002 (a PI3K/Akt inhibitor) and PD98059 (an ERK inhibitor) inhibited CREB and NF-κB phosphorylation as well as the expression of MDR1 (Figure 4C,D; quantified in Supplementary Figure S3C,D). These findings indicate that Akt and ERK activity are crucial for MDR1 upregulation by BSA-E2.
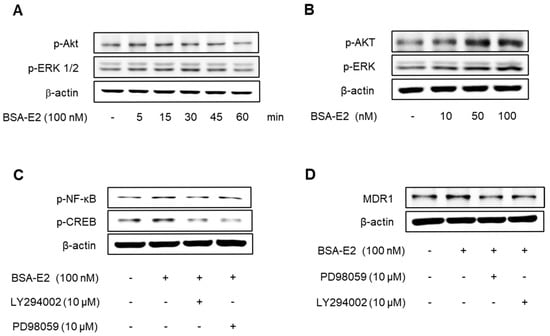
Figure 4.
The Akt/ERK signaling pathway is important for the ERα36-mediated regulation of MDR1 expression. Cells were treated with 100 nM of BSA-E2 for 5–60 min (A) or BSA-E2 (10−100 nM) for 15 min (B). p-Akt and p-ERK protein levels were determined by Western blot. (C) Cells were pretreated with 10 µM of LY294002 and 10 µM of PD98059 for 1 h, followed by treatment with 100 nM of BSA-E2 for 24 h. The MDR1 protein level was determined by Western blot. (D) Cells were pretreated with 10 µM of LY294002 and 10 µM of PD98059 for 1 h and then treated with 100 nM of BSA-E2 for 15 min. CREB and NF-κB protein levels were analyzed by Western blot.
2.5. BSA-E2 Activates EGFR/Src-Akt/ERK Signaling to Induce MDR1 Expression
Following the observed activation of Akt and ERK, we explored whether EGFR and Src—known upstream regulators of these pathways—are also activated in response to BSA-E2. As shown in Figure 5A,B, BSA-E2 induced the phosphorylation of EGFR and Src in MDA-MB-231 cells (the band density was quantified in Supplementary Figure S4A,B). Pretreatment with AG1478 (an EGFR inhibitor) or PP2 (a Src inhibitor) attenuated the BSA-E2-induced expression of MDR1 and the phosphorylation of Akt, ERK, CREB, and NF-κB (Figure 5C,D; quantified in Supplementary Figure S5C,D), suggesting that the activation of EGFR and Src plays a key upstream role in regulating MDR1 expression.
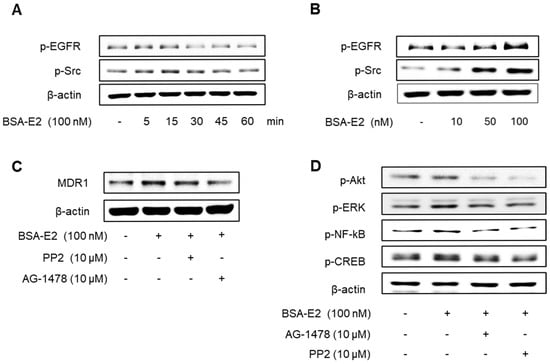
Figure 5.
Effect of BSA-E2 on MDR1 expression with the Src/EGFR signaling pathway. Cells were treated with 100 nM of BSA-E2 for 5−60 min (A) or BSA-E2 (10, 50, 100) for 5 min (B). p-Src and p-EGFR protein levels were determined by Western blot. (C) Cells were pretreated with 10 µM of PP2 and 10 µM of AG1478 for 1 h, followed by treatment with 100 nM of BSA-E2 for 24 h. MDR1 protein levels were assessed by Western blot. (D) Cells were pretreated with 10 µM of AG1478 and 10 µM of PP2 for 1 h and then treated with 100 BSA-E2 for 30 min. Phosphorylation of Akt, ERK, NF-κB, and CREB was detected by Western blot.
2.6. ERα36 Mediates BSA-E2-Induced Drug Resistance and Cell Survival in MDA-MB-231 Cells
Given the established role of membrane-associated signaling in BSA-E2-induced MDR1 expression, we next investigated whether ERα36 contributes to this regulation by monitoring the cell viability and cytotoxicity in the ERα36 knocked down cells in response to Adriamycin. ERα36 knocked down cells (ERα36 KD) exhibited a notable decrease in cytotoxicity and viability compared with wild-type cells (Control) (Figure 6A). To further investigate the role of ERα36 in BSA-E2-induced drug resistance, we assessed the cell viability and cytotoxicity following treatment with 100 nM of BSA-E2. In ERα36-knockdown cells, BSA-E2 had no effect; however, in wild-type cells, BSA-E2 treatment led to a marked reduction in the cytotoxicity and a corresponding increase in cell viability (Figure 6B,C). Additionally, the downregulation of ERα36 influenced the expression of multidrug resistance genes and proteins, as indicated by Rh-123 accumulation. Treatment with BSA-E2 did not alter the intracellular level of Rh-123 in ERα36 KD cells, whereas a decrease was observed in wild-type cells, suggesting that ERα36 is required for BSA-E2-induced drug efflux activity, likely through the upregulation of multidrug resistance proteins. Collectively, these findings indicate that ERα36 contributes to drug resistance and cell survival in MDA-MB-231 cells.
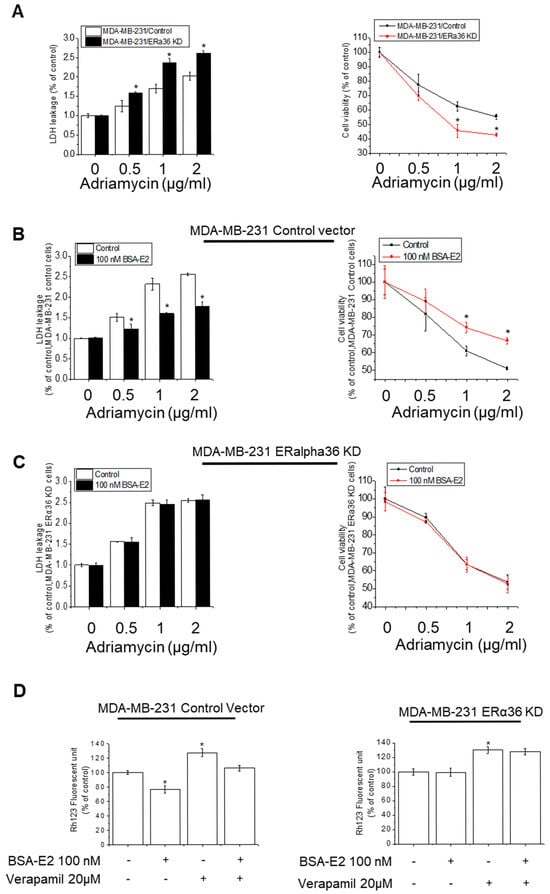
Figure 6.
ERα36 is important for BSA-E2-induced drug resistance and cell survival. (A) Wild-type cells (MDA-MB-231/Control) and ERα36-knockdown cells (MDA-MB-231/ERα36KD) were treated with 0.5 to 2 µg/mL of Adriamycin for 48 h. The effect of ERα36 deletion on the cytotoxicity of Adriamycin in MDA-MB-231 cells was assessed by LDH assays and MTT assays. (B) Wild-type cells (MDA-MB-231/Control) and ERα36-knockdown cells (MDA-MB-231/ERα36KD) (C) were pretreated with 100 nM of BSA-E2 for 24 h, followed by incubation with 0.5 to 2 µg/mL of Adriamycin for 48 h. LDH and MTT assays were used to determine cytotoxicity. (D). Rh-123 assays with wild-type cells (MDA-MB-231/Control) and ERα36-knockdown cells (MDA-MB-231/ERα36KD). Data are expressed as mean ± SD of three independent experiments. * significantly different from control cells, p < 0.01.
2.7. ERα36 Is Important for Mediating BSA-E2-Induced MDR1 Expression Through Akt/ERK and NF-κB/CREB Signaling Pathway
We next explored the role of ERα36 in regulating signaling pathways involved in BSA-E2-induced MDR1 expression. ERα36 KD cells exhibited a markedly lower level of the MRD1 protein compared with wild-type cells (Figure 7A; quantified in Supplementary Figure S5A). Notably, BSA-E2 treatment failed to induce MRD1 expression in ERα36 KD cells, in contrast to the response observed in control cells. In addition, the ERα36 knockdown suppressed BSA-E2-induced phosphorylation of NF-κB, CREB, Akt, EGFR, and Src (Figure 7B–D; quantified in Supplementary Figure S5B–D). These results demonstrate that ERα36 is located on the plasma membrane and mediates BSA-E2-stimulated Akt/ERK activation through the Src/EGFR signaling pathway, resulting in increased MDR1 expression.
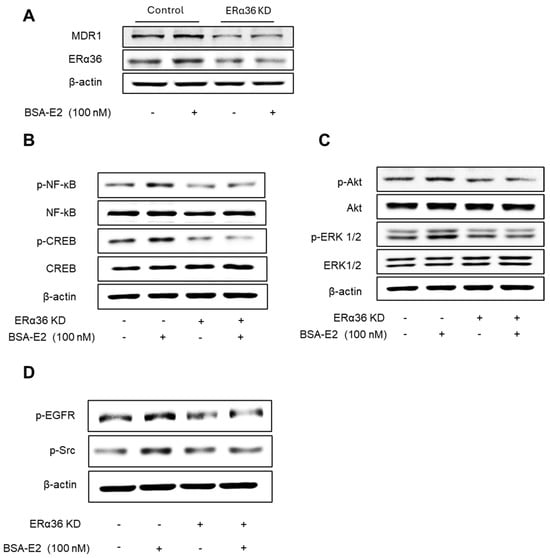
Figure 7.
Effect of ERα36 on the protein expression of MDR1 and the phosphorylation of NF-κB, CREB, Src, EGFR, Akt, and ERK. (A) Cells were treated with 100 nM of BSA-E2 for 24 h in control vector cells and ERα36 knockdown. MDR1 and ERα36 protein levels were determined by Western blot. (B) Effect of ERα36 knockdown on NF-κB and CREB activation. Cells were treated with 100 nM of BSA-E2 for 15 min. p-NF-κB, NF-κB, p-CREB, and CREB protein levels were determined by Western blot. (C) Effect of ERα36 knockdown on the phosphorylation of Akt and ERK. Cells were treated with 100 nM of BSA-E2 for 15 min. p-AKT, Akt, p-ERK, and ERK protein levels were determined by Western blot. (D) Control and ERα36-knockdown cells were treated with 100 nM of BSA-E2 for 5 min, and p-EGFR and p-Src were detected by Western blot.
2.8. ERα36 Mediates BSA-E2-Induced Activation of Wnt/β-Catenin Signaling and MDR1 Expression
Emerging evidence suggests that the NF-κB/CREB signaling pathways interact functionally with the Wnt/β-catenin pathway to modulate gene expression. Therefore, we investigated whether ERα36 mediates its downstream effects through the activation of the Wnt/β-catenin signaling pathway. Treatment with BSA-E2 significantly increased the β-catenin levels (Figure 8A; quantified in Supplementary Figure S6A), while pretreatment with FH-535, a Wnt/β-catenin inhibitor, downregulated the expression of MDR1 (Figure 8B and Figure S6B), suggesting that Wnt/β-catenin signaling plays a role in the regulation of MDR1. Notably, BSA-E2 treatment altered GSK3β phosphorylation, with a marked increase observed at 5 min post-treatment (Figure 8C and Figure S6C). This phosphorylation was abolished upon ERα36 knockdown (Figure 8D and Figure S6D). These data together reveal that the BSA-E2 activates the Wnt/β-catenin signaling pathway through an ERα36-dependent mechanism.
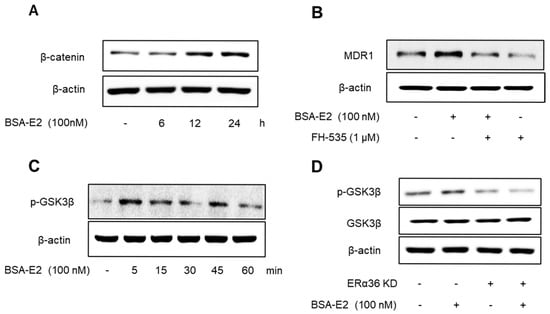
Figure 8.
ERα36 is involved in BSA-E2-induced activation of the Wnt/β-catenin pathway to modulate MDR1 expression. (A) Cells were pretreated with 100 nM of BSA-E2 for 6−24 h, and the β-catenin protein level was determined by Western blot. (B) MDR1 expression was evaluated in cells pretreated with the Wnt/β-catenin inhibitor, FH-535 (1 µM) for 1 h and 100 nM of BSA-E2 for 24 h. (C) Cells were treated with 100 nM of BSA-E2 for 5−60 min, and the phosphorylation of GSK3β was determined by Western blot. (D) Control and ERα36-knockdown cells were treated with 100 nM of BSA-E2 for 24 h. p-GSK3 and GSK3β protein levels were analyzed by Western blot.
3. Discussion
P-glycoprotein, the product of the MDR1 gene, has received great interest for its contribution to multidrug resistance in numerous cancer types [40]. The overexpression of MDR1 is a major obstacle to effective cancer chemotherapy. Moreover, its role in enabling cancer cells to evade chemotherapy-induced apoptosis has been demonstrated in several cellular models, particularly in breast cancer cells, including TNBC [40,41]. TNBC characterized by a high expression of ERα36 has increased drug resistance, which leads to cell proliferation, metastasis, and malignancy, suggesting the potential significance of ERα36 status in predicting patient response to chemotherapy [25]. In this study, we provide evidence that ERα36 contributes to the acquisition of chemoresistance in TNBC by upregulating MDR1 expression through a non-genomic pathway.
The activation of ERα36 by BSA-E2 significantly inhibited Adriamycin-induced cytotoxicity and markedly increased MDR1 expression. Furthermore, treatment with BSA-E2 triggered the MDR1-dependent drug efflux evaluated by the reduced accumulation of its substrate, Rh-123. On the other hand, the silencing of ERα36 attenuated BSA-E2-induced MDR1 expression and no longer exhibited effects on the suppression of Adriamycin-induced lethality. This suggests the contribution of ERα36 to estrogen-mediated drug resistance through the upregulation of MDR1. In the context of MDR1 regulation, we explored the involvement of ERα36 in multiple interconnected signaling pathways.
3.1. ERα36-Akt/ERK/CREB and NF-κB Pathway
MDR1 transcription is under the control of multiple transcription factors, such as NF-κB, CRE, AP-1, SP1, and PXR [42,43]. Our data demonstrate that BSA-E2 activates multiple non-genomic signaling pathways, notably the Akt/ERK/CREB and NF-κB axes. The inhibition of Akt or ERK suppressed BSA-E2-induced MDR1 expression. Moreover, these effects were significantly attenuated upon the knockdown of ERα36, indicating that this receptor mediates the upstream activation of these kinases. The Akt and ERK pathways are well-established regulators of cell survival and drug resistance [19,44]. Furthermore, MDR1 transcription is directly regulated by CREB and NF-κB through their binding to specific sites in the distal promoter region of the MDR1 gene [35]. Phosphorylated CREB binds to its promoter region and enhances MDR1 transcription. Similarly, NF-κB, especially the p65 (RelA) subunit, plays a critical role in MDR1 regulation. Upon activation by cellular stress or chemotherapeutic agents, p65 translocates to the nucleus and binds to a consensus κB motif in the first intron of the MDR1 gene, promoting its transcriptional activation [35,45]. This mechanism contributes to decreased intracellular drug accumulation and treatment failure in various cancer types. These results collectively support a model in which ERα36 activates the Akt/ERK signaling to drive MDR1 regulation, contributing to enhanced drug resistance.
3.2. ERα36-EGFR/Src Signaling
We observed that BSA-E2 treatment rapidly induces phosphorylation of both EGFR and Src, whereas this signal is altered in ERα36 knockdown, suggesting a cross-correlation of action between EGFR and ERα36. ERα36 activates membrane-mediated estrogen signaling in association with EGFR and Src, resulting in the regulation of MDR1 expression through the Akt and ERK signaling pathways. Indeed, a linkage between EGFR and ERα36 expression in carcinoma cells was determined, indicating that ERα36 influences the activation of extracellular signaling involved in EGFR/Src [16,44], probably through the interaction with membrane proteins of breast cancer cells. In particular, Src has been shown to serve as a key intermediary in this process by facilitating EGFR phosphorylation in response to estrogenic stimuli. Our data support this mechanism, implicating EGFR and Src as early effectors in the ERα36 signaling axis, ultimately contributing to MDR1 regulation.
3.3. ERα36-Wnt/β-Catenin Pathway
Beyond classical kinase signaling, our data implicate the Wnt/β-catenin pathway as a downstream effector of ERα36 in promoting MDR1 expression. The enhanced β-catenin protein levels and phosphorylation of GSK3β suggest that ERα36 plays roles in the activation of canonical Wnt signaling, which has been widely linked to tumor progression and multidrug resistance. It has been reported that the activation of the Wnt/β-catenin pathway enhances ABC transporter transcription, thereby contributing to chemoresistance across multiple cancer types [37,46]. In particular, the β-catenin/T-cell factor 4 transcriptional complex has been shown to directly target the MDR1 gene and increase MDR1 expression [47]. Furthermore, consistent with previous studies [48,49], our data demonstrated that the transactivation of MDR1 can be inhibited by the pharmacological suppression of upstream regulators. Specifically, the inhibition of Src by PP2 and β-catenin by FH535 or the silencing of ERα36 effectively prevents MDR1 expression, suggesting functional crosstalk between ER signaling and Wnt/β-catenin signaling pathways. Collectively, our data suggest that ERα36 simultaneously engages kinase cascades and developmental pathways like Wnt/β-catenin to orchestrate a coordinated response that enhances drug efflux and promotes resistance.
Taken together, our study reveals that ERα36 serves as a central hub in coordinating non-genomic estrogen signaling, promoting MDR1 expression and resistance to Adriamycin. These effects are mediated through the activation of multiple pathways—Akt/ERK/CREB, NF-κB, and Wnt/β-catenin—as well as through interactions with EGFR. Importantly, the knockdown of ERα36 abolished most of these downstream events, confirming its essential role in this network. Our finding provides molecular evidence that a single receptor, like ERα36, can orchestrate diverse downstream oncogenic pathways. This highlights its potential as a therapeutic target to simultaneously overcome various mechanisms of drug resistance during treatment. Although our study focuses on breast cancer cells, particularly TNBC, the role of ERα36 may extend beyond this context. Previous studies have reported ERα36 expression in other cancer types, including lung, gastric, and endometrial cancers, suggesting its broader involvement in tumor biology. Future comparative studies are necessary to determine the generalizability of this mechanism. In addition, validation using animal models would be critical to investigate how ERα36 knockdown influences key tumor behaviors within the complex tumor microenvironments. Models such as patient-derived xenograft (PDX) or orthotopic mouse models could offer physiologically relevant settings that closely mimic patient responses to chemotherapy [50]. Furthermore, innovative drug delivery platforms, such as nanoparticle-based therapeutics, represent promising strategies to effectively target ERα36 in resistant cancer types [51].
These findings not only elucidate a new mechanism of estrogen-induced multidrug resistance in breast cancer but also point to ERα36 as a potential therapeutic target, particularly in tumors that are ERα-negative but still responsive to estrogen at the membrane level. Future studies may focus on identifying specific inhibitors of ERα36 or targeting its associated pathways to overcome resistance and improve chemotherapeutic efficacy.
4. Materials and Methods
4.1. Chemicals and Reagents
Dulbecco’s modified Eagle’s medium (DMEM), fetal bovine serum (FBS), penicillin–streptomycin, and trypsin were purchased from Welgene (Gyeongsan, South Korea). Antibodies against ERα36 were purchased from Alpha Diagnostic International Inc. (San Antonio, TX, USA). BSA-conjugated estradiol (BSA-E2) was obtained from Sigma-Aldrich (St. Louis, MO, USA). The following primary antibodies from Cell Signaling Technology (Danvers, MA, USA) were used at a 1:1000 dilution: MDR1 (Cat#13342S), p-EGFR (Tyr1068 specific, Cat#2234S), EGFR (Cat#2232L), p-c-Src (Tyr416 specific, Cat#2101S), p-Akt (Ser472 specific, Cat#9271), Akt (Cat#9272S), p-ERK (Thr202/Tyr204 specific, Cat#9101), ERK (Cat#9102), p-NF-κB p65 (Ser536 specific, Cat#3033)), NF-κB p65 (Cat#8242), CREB (Cat#4820), p-CREB (Ser133 specific, Cat#9198). HRP-conjugated anti-rabbit (Cat#sc-2357) or anti-mouse (Cat#sc-2005) secondary antibodies from Santa Cruz Biotechnology (Dallas, TX, USA) were used at a 1:5000 dilution. Verapamil, rhodamine, and Adriamycin were purchased from the Sigma Chemical Company (St. Louis, MO, USA). RNAiso was purchased from Takara Bio (Shiga, Japan). Antibody against β-actin was purchased from Santa Cruz Biotechnology (Santa Cruz, CA, USA). 3-(4,5-Dimethylthiazol-2-yl)-2,5-diphenyltetrazolium bromide, a tetrazole) (MTT) was purchased from USB Corporation (Cleveland, OH). All other commercially available chemicals used were of the highest purity.
4.2. Cell Culture and Cell Viability Assays
The human breast cancer cell line MDA-MB-231 was provided by the American Type Culture Collection (ATCC, Manassas, VA, USA). Cells were grown in DMEM supplemented with 10% FBS, 2 mM L-glutamine, 100 U/mL of penicillin, and 100 μg/mL streptomycin at 37 °C in an atmosphere containing 5% CO2. To assess cell viability, cells were plated in 48-well plates at 2 × 10⁴ cells/well, and 100 nM of BSA-E2 was added to each well after 24 h incubation. The MTT and LDH assays were performed as described previously [52]. Briefly, cells were treated with MTT for 1 h, and formazan crystals were solubilized with DMSO. Absorbance was measured at 570 nm with a Biotek Synergy HT microplate reader (BioTek Instruments, Winooski, VT, USA). LDH activity in the supernatant was determined at 490 nm.
4.3. Lentiviral Vector Production and Transduction
Lentiviral ERα36 shRNA vectors (HSH859L-1-LVRU6GP) for ERα36 knockdown and lentiviral control (CSHCTR00-LVRU6GP) vectors were purchased from Genecopoeia (Rockville, MD, USA). Following the manufacturer’s instructions, all lentiviral titers were produced using a Lenti-PacTM FIV Expression Packaging Kit (Genecopoeia, MD, USA). ERα36-knockdown stable cell lines were generated by transducing MDA-MB-231 cells with purified virus, followed by a selection of stable pools of cells using 5 μg/mL of puromycin (Sigma-Aldrich, St. Louis, MO, USA).
4.4. RNA Extraction and qRT-PCR
Total RNA was extracted from harvested cell pellets containing approximately 1 × 10⁶ MDA-MB-231 cells using RNAiso Plus (total RNA extraction reagent; Takara Bio, Shiga, Japan). After RNA isolation, cDNA was synthesized using the BioFact RT Series kit (BioFact, Daejeon, Korea). The qRT-PCR results were analyzed using Bio-Rad CFX Connect Real-Time PCR software, version 1.4.1 (Bio-Rad Laboratories, Hercules, CA, USA). The PCR primers were used as follows. The expression was normalized with the endogenous control, glyceraldehyde 3-phosphate dehydrogenase (GAPDH). MDR1 (NM_001348945.2) forward: 5′-GCTGTCAAGGAAGCCAATGCCT-3′, MDR1 (NM_001348945.2) reverse: 5′-TGCAATGGCGATCCTCTGCTTC-3′; GAPDH (NM_001256799.3) forward: 5′-GTCTCCTCTGACTTCAACAGCG-3′, GAPDH (NM_001256799.3) reverse: 5′-ACCACCCTGTTGCTGTAGCCAA-3′.
4.5. Western Blotting
Western blotting was performed according to the standard protocol [31]. Briefly, approximately 1 × 10⁷ cells were harvested and lysed using CETi lysis buffer (TransLab, Daejeon, Korea). An equal amount of total protein was separated by sodium dodecyl sulfate polyacrylamide gel electrophoresis (SDS-PAGE) and transferred onto a nitrocellulose membrane. The membranes were blocked using skim milk for 1 h. Subsequently, primary antibodies were incubated at 4 °C overnight, and secondary antibodies were incubated at RT for 2 h. The membrane was exposed using the Hisol ECL Plus detection kit (Biofact, Daejeon, Korea).
4.6. Rhodamine-123 Accumulation Assay
Cells were plated onto 24-well plates (at 105 cells/well) and pretreated with 10−100 nM of BSA-E2 and 20 μM of verapamil for 48 hr. Verapamil was used as a positive control for MDR inhibition [53]. Following pretreatment, cells were cultured in medium containing 5 μM of Rh-123 for 90 min, protected from light. Cells were trypsinized, washed twice with ice-cold PBS, and resuspended in 1 mL of PBS. Intracellular Rh123 accumulation was measured by fluorescence at 488 nm excitation and 530 nm emission using a BioTek Synergy HT microplate reader (BioTek Instruments, Winooski, VT, USA).
4.7. Statistical Analysis
All experiments were performed in triplicate. The data are reported as mean ± SD of independent experiments. The Shapiro–Wilk test was used for data normality. The statistical evaluation of the results was performed using one-way ANOVA. The Tukey–Kramer test was used for multi-group comparisons. Statistical significance was defined as p < 0.01.
5. Conclusions
In summary, this study demonstrates that ERα36 contributes to drug resistance in TNBC cells by promoting MDR1 expression through multiple non-genomic pathways, including Akt/ERK, NF-κB, CREB, and Wnt/β-catenin. These findings expand the functional repertoire of ERα36 beyond tumor growth and suggest its involvement in regulating key resistance mechanisms, positioning it as a potential therapeutic target in drug-resistant breast cancers.
Supplementary Materials
The following supporting information can be downloaded at: https://www.mdpi.com/article/10.3390/ijms26157200/s1.
Author Contributions
Conceptualization, H.-G.J.; methodology, G.-H.L. and M.M.U.P.; validation, G.-H.L., M.M.U.P., S.-Y.L. and H.-G.J.; formal analysis, M.M.U.P. and G.-H.L.; investigation, G.-H.L.; resources.; data curation, M.M.U.P., G.-H.L., A.T.N.B. and S.-Y.L.; writing—original draft preparation, A.T.N.B.; writing—review and editing, A.T.N.B., S.-Y.L. and H.-G.J.; visualization, supervision, project administration, H.-G.J.; funding acquisition, H.-G.J. All authors have read and agreed to the published version of the manuscript.
Funding
This work was supported by the National Research Foundation of Korea (NRF) grant funded by the Korea government (MSIT) (RS-2024-00353812 and RS-2022-NR070856).
Institutional Review Board Statement
Not applicable.
Informed Consent Statement
Not applicable.
Data Availability Statement
Data is contained within the article.
Conflicts of Interest
The authors declare no conflicts of interest.
Abbreviations
The following abbreviations are used in this manuscript:
| Akt | Protein kinase B |
| BSA-E2 | BSA-conjugated estradiol |
| CREB | cAMP-responsive element binding protein |
| CBP | CREB binding protein |
| EGFR | Epidermal growth factor receptor |
| EMT | Epithelial–mesenchymal transition |
| ERs | Estrogen receptors |
| Erα66 | Estrogen receptor 66 alpha |
| Erα36 | Estrogen receptor 36 alpha |
| ERK | Extracellular Signal-Regulated kinase |
| HER2 | Human epidermal growth factor receptor 2 |
| MAPK | Mitogen-activated protein kinase |
| MDR1 | Multidrug resistance 1 |
| NF-κB | Nuclear factor-κB |
| P-glycoprotein | P-gp |
| PR | Progesterone receptors |
| PI3K | Phosphatidylinositide3-kinase |
| Rh-123 | Rhodamine 123 |
| Src | Proto-oncogene tyrosine protein kinase |
| TNBC | Triple-negative breast cancer |
| WBP2 | WW domain-binding protein 2 |
References
- Kolak, A.; Kamińska, M.; Sygit, K.; Budny, A.; Surdyka, D.; Kukiełka-Budny, B.; Burdan, F. Primary and secondary prevention of breast cancer. Ann. Agric. Environ. Med. 2017, 24, 549–553. [Google Scholar] [CrossRef] [PubMed]
- Carey, L.A.; Perou, C.M.; Livasy, C.A.; Dressler, L.G.; Cowan, D.; Conway, K.; Karaca, G.; Troester, M.A.; Tse, C.K.; Edmiston, S.; et al. Race, breast cancer subtypes, and survival in the Carolina Breast Cancer Study. JAMA 2006, 295, 2492–2502. [Google Scholar] [CrossRef] [PubMed]
- Bianchini, G.; Balko, J.M.; Mayer, I.A.; Sanders, M.E.; Gianni, L. Triple-negative breast cancer: Challenges and opportunities of a heterogeneous disease. Nat. Rev. Clin. Oncol. 2016, 13, 674–690. [Google Scholar] [CrossRef] [PubMed]
- Foulkes, W.D.; Smith, I.E.; Reis-Filho, J.S. Triple-negative breast cancer. N. Engl. J. Med. 2010, 363, 1938–1948. [Google Scholar] [CrossRef] [PubMed]
- Dent, R.; Trudeau, M.; Pritchard, K.I.; Hanna, W.M.; Kahn, H.K.; Sawka, C.A.; Lickley, L.A.; Rawlinson, E.; Sun, P.; Narod, S.A. Triple-negative breast cancer: Clinical features and patterns of recurrence. Clin. Cancer Res. 2007, 13, 4429–4434. [Google Scholar] [CrossRef] [PubMed]
- Pedram, A.; Razandi, M.; Lewis, M.; Hammes, S.; Levin, E.R. Membrane-localized estrogen receptor α is required for normal organ development and function. Dev. Cell 2014, 29, 482–490. [Google Scholar] [CrossRef] [PubMed]
- Pedram, A.; Razandi, M.; Blumberg, B.; Levin, E.R. Membrane and nuclear estrogen receptor α collaborate to suppress adipogenesis but not triglyceride content. FASEB J. 2016, 30, 230–240. [Google Scholar] [CrossRef] [PubMed]
- Björnström, L.; Sjöberg, M. Mechanisms of estrogen receptor signaling: Convergence of genomic and nongenomic actions on target genes. Mol. Endocrinol. 2005, 19, 833–842. [Google Scholar] [CrossRef] [PubMed]
- Clusan, L.; Ferrière, F.; Flouriot, G.; Pakdel, F. A Basic Review on Estrogen Receptor Signaling Pathways in Breast Cancer. Int. J. Mol. Sci. 2023, 24, 6834. [Google Scholar] [CrossRef] [PubMed]
- Levin, E.R. Cellular functions of plasma membrane estrogen receptors. Steroids 2002, 67, 471–475. [Google Scholar] [CrossRef] [PubMed]
- Vasudevan, N.; Pfaff, D.W. Non-genomic actions of estrogens and their interaction with genomic actions in the brain. Front. Neuroendocrinol. 2008, 29, 238–257. [Google Scholar] [CrossRef] [PubMed]
- Wang, Z.; Zhang, X.; Shen, P.; Loggie, B.W.; Chang, Y.; Deuel, T.F. Identification, cloning, and expression of human estrogen receptor-α36, a novel variant of human estrogen receptor-α66. Biochem. Biophys. Res. Commun. 2005, 336, 1023–1027. [Google Scholar] [CrossRef] [PubMed]
- Flouriot, G.; Brand, H.; Denger, S.; Metivier, R.; Kos, M.; Reid, G.; Sonntag-Buck, V.; Gannon, F. Identification of a new isoform of the human estrogen receptor-α (hER-α) that is encoded by distinct transcripts and that is able to repress hER-α activation function 1. EMBO J. 2000, 19, 4688–4700. [Google Scholar] [CrossRef] [PubMed]
- Wang, Z.; Zhang, X.; Shen, P.; Loggie, B.W.; Chang, Y.; Deuel, T.F. A variant of estrogen receptor-α, hER-α36: Transduction of estrogen-and antiestrogen-dependent membrane-initiated mitogenic signaling. Proc. Natl. Acad. Sci. USA 2006, 103, 9063–9068. [Google Scholar] [CrossRef] [PubMed]
- Su, X.; Xu, X.; Li, G.; Lin, B.; Cao, J.; Teng, L. ER-α36: A novel biomarker and potential therapeutic target in breast cancer. Onco Targets Ther. 2014, 7, 1525–1533. [Google Scholar] [CrossRef] [PubMed][Green Version]
- Lin, S.L.; Yan, L.Y.; Zhang, X.T.; Yuan, J.; Li, M.; Qiao, J.; Wang, Z.Y.; Sun, Q.Y. ER-α36, a variant of ER-α, promotes tamoxifen agonist action in endometrial cancer cells via the MAPK/ERK and PI3K/Akt pathways. PLoS ONE 2010, 5, e9013. [Google Scholar] [CrossRef] [PubMed]
- Tong, J.S.; Zhang, Q.H.; Wang, Z.B.; Li, S.; Yang, C.R.; Fu, X.Q.; Hou, Y.; Wang, Z.Y.; Sheng, J.; Sun, Q.Y. ER-α36, a novel variant of ER-α, mediates estrogen-stimulated proliferation of endometrial carcinoma cells via the PKCδ/ERK pathway. PLoS ONE 2010, 5, e15408. [Google Scholar] [CrossRef] [PubMed]
- Fresno Vara, J.A.; Casado, E.; de Castro, J.; Cejas, P.; Belda-Iniesta, C.; González-Barón, M. PI3K/Akt signalling pathway and cancer. Cancer Treat. Rev. 2004, 30, 193–204. [Google Scholar] [CrossRef] [PubMed]
- Vivanco, I.; Sawyers, C.L. The phosphatidylinositol 3-kinase AKT pathway in human cancer. Nat. Rev. Cancer 2002, 2, 489–501. [Google Scholar] [CrossRef] [PubMed]
- Vranic, S.; Gatalica, Z.; Deng, H.; Frkovic-Grazio, S.; Lee, L.M.J.; Gurjeva, O.; Wang, Z.Y. ER-α36, a novel isoform of ER-α66, is commonly over-expressed in apocrine and adenoid cystic carcinomas of the breast. J. Clin. Pathol. 2011, 64, 54–57. [Google Scholar] [CrossRef] [PubMed]
- Maa, M.C.; Leu, T.H.; McCarley, D.J.; Schatzman, R.C.; Parsons, S.J. Potentiation of epidermal growth factor receptor-mediated oncogenesis by c-Src: Implications for the etiology of multiple human cancers. Proc. Natl. Acad. Sci. USA 1995, 92, 6981–6985. [Google Scholar] [CrossRef] [PubMed]
- Zhang, X.; Meng, J.; Wang, Z.Y. A switch role of Src in the biphasic EGF signaling of ER-negative breast cancer cells. PLoS ONE 2012, 7, e41613. [Google Scholar] [CrossRef] [PubMed]
- Lee, L.M.J.; Cao, J.; Deng, H.; Chen, P.; Gatalica, Z.; Wang, Z.Y. ER-α36, a novel variant of ER-α, is expressed in ER-positive and-negative human breast carcinomas. Anticancer Res. 2008, 28, 479–483. [Google Scholar] [CrossRef] [PubMed]
- Pelekanou, V.; Notas, G.; Kampa, M.; Tsentelierou, E.; Radojicic, J.; Leclercq, G.; Castanas, E.; Stathopoulos, E.N. ERα36, a new variant of the ERα is expressed in triple negative breast carcinomas and has a specific transcriptomic signature in breast cancer cell lines. Steroids 2012, 77, 928–934. [Google Scholar] [CrossRef] [PubMed]
- Zhang, J.; Li, G.; Li, Z.; Yu, X.; Zheng, Y.; Jin, K.; Wang, H.; Gong, Y.; Sun, X.; Teng, X.; et al. Estrogen-independent effects of ER-α36 in ER-negative breast cancer. Steroids 2012, 77, 666–673. [Google Scholar] [CrossRef] [PubMed]
- Chaudhri, R.A.; Olivares-Navarrete, R.; Cuenca, N.; Hadadi, A.; Boyan, B.D.; Schwartz, Z. Membrane estrogen signaling enhances tumorigenesis and metastatic potential of breast cancer cells via estrogen receptor-α36 (ERα36). J. Biol. Chem. 2012, 287, 7169–7181. [Google Scholar] [CrossRef] [PubMed]
- Gottesman, M.M.; Fojo, T.; Bates, S.E. Multidrug resistance in cancer: Role of ATP-dependent transporters. Nat. Rev. Cancer 2002, 2, 48–58. [Google Scholar] [CrossRef] [PubMed]
- Gottesman, M.M.; Pastan, I. Biochemistry of multidrug resistance mediated by the multidrug transporter. Annu. Rev. Biochem. 1993, 62, 385–427. [Google Scholar] [CrossRef] [PubMed]
- Van Helvoort, A.; Smith, A.J.; Sprong, H.; Fritzsche, I.; Schinkel, A.H.; Borst, P.; van Meer, G. MDR1 P-glycoprotein is a lipid translocase of broad specificity, while MDR3 P-glycoprotein specifically translocates phosphatidylcholine. Cell 1996, 87, 507–517. [Google Scholar] [CrossRef] [PubMed]
- Krishna, R.; Mayer, L.D. Multidrug resistance (MDR) in cancer: Mechanisms, reversal using modulators of MDR and the role of MDR modulators in influencing the pharmacokinetics of anticancer drugs. Eur. J. Pharm. Sci. 2000, 11, 265–283. [Google Scholar] [CrossRef] [PubMed]
- Katayama, K.; Noguchi, K.; Sugimoto, Y. Regulation of P-Glycoprotein/ABCB1/MDR1 in human cancer cells. New J. Sci. 2014, 2014, 476974. [Google Scholar] [CrossRef]
- Ashkenazi, A.; Dixit, V.M. Death receptors: Signaling and modulation. Science 1998, 281, 1305–1308. [Google Scholar] [CrossRef] [PubMed]
- Perkins, N.D. Integrating cell-signalling pathways with NF-kappaB and IKK function. Nat. Rev. Mol. Cell Biol. 2007, 8, 49–62. [Google Scholar] [CrossRef] [PubMed]
- Ros, J.E.; Schuetz, J.D.; Geuken, M.; Streetz, K.; Moshage, H.; Kuipers, F.; Manns, M.P.; Jansen, P.L.; Trautwein, C.; Müller, M. Induction of Mdr1b expression by tumor necrosis factor-α in rat liver cells is independent of p53 but requires NF-kappaB signaling. Hepatology 2001, 33, 1425–1431. [Google Scholar] [CrossRef] [PubMed]
- Kuo, M.T.; Liu, Z.; Wei, Y.; Lin-Lee, Y.C.; Tatebe, S.; Mills, G.B.; Unate, H. Induction of human MDR1 gene expression by 2-acetylaminofluorene is mediated by effectors of the phosphoinositide 3-kinase pathway that activate NF-kappaB signaling. Oncogene 2002, 21, 1945–1954. [Google Scholar] [CrossRef] [PubMed]
- Chen, S.; Wang, H.; Li, Z.; You, J.; Wu, Q.W.; Zhao, C.; Tzeng, C.M.; Zhang, Z.M. Interaction of WBP2 with ERα increases doxorubicin resistance of breast cancer cells by modulating MDR1 transcription. Br. J. Cancer 2018, 119, 182–192. [Google Scholar] [CrossRef] [PubMed]
- Xia, Z.; Guo, M.; Liu, H.; Jiang, L.; Li, Q.; Peng, J.; Li, J.D.; Shan, B.; Feng, P.; Ma, H. CBP-dependent Wnt/β-catenin signaling is crucial in regulation of MDR1 transcription. Curr. Cancer Drug Targets 2015, 15, 519–532. [Google Scholar] [CrossRef] [PubMed]
- Abdin, S.M.; Tolba, M.F.; Zaher, D.M.; Omar, H.A. Nuclear factor-κB signaling inhibitors revert multidrug-resistance in breast cancer cells. Chem. Biol. Interact. 2021, 340, 109450. [Google Scholar] [CrossRef] [PubMed]
- Han, E.H.; Kim, H.G.; Hwang, Y.P.; Choi, J.H.; Im, J.H.; Park, B.; Yang, J.H.; Jeong, T.C.; Jeong, H.G. The role of cyclooxygenase-2-dependent signaling via cyclic AMP response element activation on aromatase up-regulation by o, p’-DDT in human breast cancer cells. Toxicol. Lett. 2010, 198, 331–341. [Google Scholar] [CrossRef] [PubMed]
- Johnstone, R.W.; Ruefli, A.A.; Smyth, M.J. Multiple physiological functions for multidrug transporter P-glycoprotein? Trends Biochem. Sci. 2000, 25, 1–6. [Google Scholar] [CrossRef] [PubMed]
- Zyad, A.; Bénard, J.; Tursz, T.; Clarke, R.; Chouaib, S. Resistance to TNF-α and adriamycin in the human breast cancer MCF-7 cell line: Relationship to MDR1, MnSOD, and TNF gene expression. Cancer Res. 1994, 54, 825–831. [Google Scholar] [PubMed]
- Kim, H.G.; Hien, T.T.; Han, E.H.; Hwang, Y.P.; Choi, J.H.; Kang, K.W.; Kwon, K.I.; Kim, B.H.; Kim, S.K.; Song, G.Y.; et al. Metformin inhibits P-glycoprotein expression via the NF-κB pathway and CRE transcriptional activity through AMPK activation. Br. J. Pharmacol. 2011, 162, 1096–1108. [Google Scholar] [CrossRef] [PubMed]
- Ziemann, C.; Riecke, A.; Rüdell, G.; Oetjen, E.; Steinfelder, H.J.; Lass, C.; Kahl, G.F.; Hirsch-Ernst, K.I. The role of prostaglandin E receptor-dependent signaling via cAMP in Mdr1b gene activation in primary rat hepatocyte cultures. J. Pharmacol. Exp. Ther. 2006, 317, 378–386. [Google Scholar] [CrossRef] [PubMed]
- Zhang, X.T.; Kang, L.G.; Ding, L.; Vranic, S.; Gatalica, Z.; Wang, Z.Y. A positive feedback loop of ER-α36/EGFR promotes malignant growth of ER-negative breast cancer cells. Oncogene 2011, 30, 770–780. [Google Scholar] [CrossRef] [PubMed]
- Bentires-Alj, M.; Barbu, V.; Fillet, M.; Chariot, A.; Relic, B.; Jacobs, N.; Gielen, J.; Merville, M.P.; Bours, V. NF-kappaB transcription factor induces drug resistance through MDR1 expression in cancer cells. Oncogene 2003, 22, 90–97. [Google Scholar] [CrossRef] [PubMed]
- Corrêa, S.; Binato, R.; Du Rocher, B.D.; Castelo-Branco, M.T.L.; Pizzatti, L.; Abdelhay, E. Wnt/β-catenin pathway regulates ABCB1 transcription in chronic myeloid leukemia. BMC Cancer 2012, 12, 303. [Google Scholar] [CrossRef] [PubMed]
- Yamada, T.; Takaoka, A.S.; Naishiro, Y.; Hayashi, R.; Maruyama, K.; Maesawa, C.; Ochiai, A.; Hirohashi, S. Transactivation of the multidrug resistance 1 gene by T-cell factor 4/beta-catenin complex in early colorectal carcinogenesis. Cancer Res. 2000, 60, 4761–4766. [Google Scholar] [PubMed]
- Lim, J.C.; Kania, K.D.; Wijesuriya, H.; Chawla, S.; Sethi, J.K.; Pulaski, L.; Romero, I.A.; Couraud, P.O.; Weksler, B.B.; Hladky, S.B.; et al. Activation of beta-catenin signalling by GSK-3 inhibition increases p-glycoprotein expression in brain endothelial cells. J. Neurochem. 2008, 106, 1855–1865. [Google Scholar] [CrossRef] [PubMed]
- Liu, Y.Y.; Gupta, V.; Patwardhan, G.A.; Bhinge, K.; Zhao, Y.; Bao, J.; Mehendale, H.; Cabot, M.C.; Li, Y.T.; Jazwinski, S.M. Glucosylceramide synthase upregulates MDR1 expression in the regulation of cancer drug resistance through cSrc and β-catenin signaling. Mol. Cancer 2010, 9, 145. [Google Scholar] [CrossRef] [PubMed]
- Li, J.; Gu, A.; Tang, N.; Zengin, G.; Li, M.Y.; Liu, Y. Patient-derived xenograft models in pan-cancer: From bench to clinic. Interdiscip. Med. 2025, 3, e20250016. [Google Scholar] [CrossRef]
- Ma, P.; Wang, G.; Men, K.; Li, C.; Gao, N.; Li, L. Advances in clinical application of nanoparticle-based therapy for cancer treatment: A systematic review. Nano TransMed 2024, 3, 100036. [Google Scholar] [CrossRef]
- Chae, J.Y.; Lee, G.H.; Lee, S.Y.; Jeong, G.S.; Yun, H.Y.; Han, E.H.; Bui, A.T.N.; Jeong, H.G. Platycodin D reverses tumor necrosis factor-α-induced endothelial dysfunction by increasing nitric oxide through G protein-coupled estrogen receptor-mediated eNOS activity. Chem. Biol. Interact. 2025, 418, 111577. [Google Scholar] [CrossRef] [PubMed]
- Toffoli, G.; Simone, F.; Corona, G.; Raschack, M.; Cappelletto, B.; Gigante, M.; Boiocchi, M. Structure-activity relationship of verapamil analogs and reversal of multidrug resistance. Biochem. Pharmacol. 1995, 50, 1245–1255. [Google Scholar] [CrossRef] [PubMed]
Disclaimer/Publisher’s Note: The statements, opinions and data contained in all publications are solely those of the individual author(s) and contributor(s) and not of MDPI and/or the editor(s). MDPI and/or the editor(s) disclaim responsibility for any injury to people or property resulting from any ideas, methods, instructions or products referred to in the content. |
© 2025 by the authors. Licensee MDPI, Basel, Switzerland. This article is an open access article distributed under the terms and conditions of the Creative Commons Attribution (CC BY) license (https://creativecommons.org/licenses/by/4.0/).