

The Pharmacokinetic and Pharmacodynamic Relationship of Clinically Used Antiseizure Medications in the Maximal Electroshock Seizure Model in Rodents
 , , and
Abstract
1. Introduction
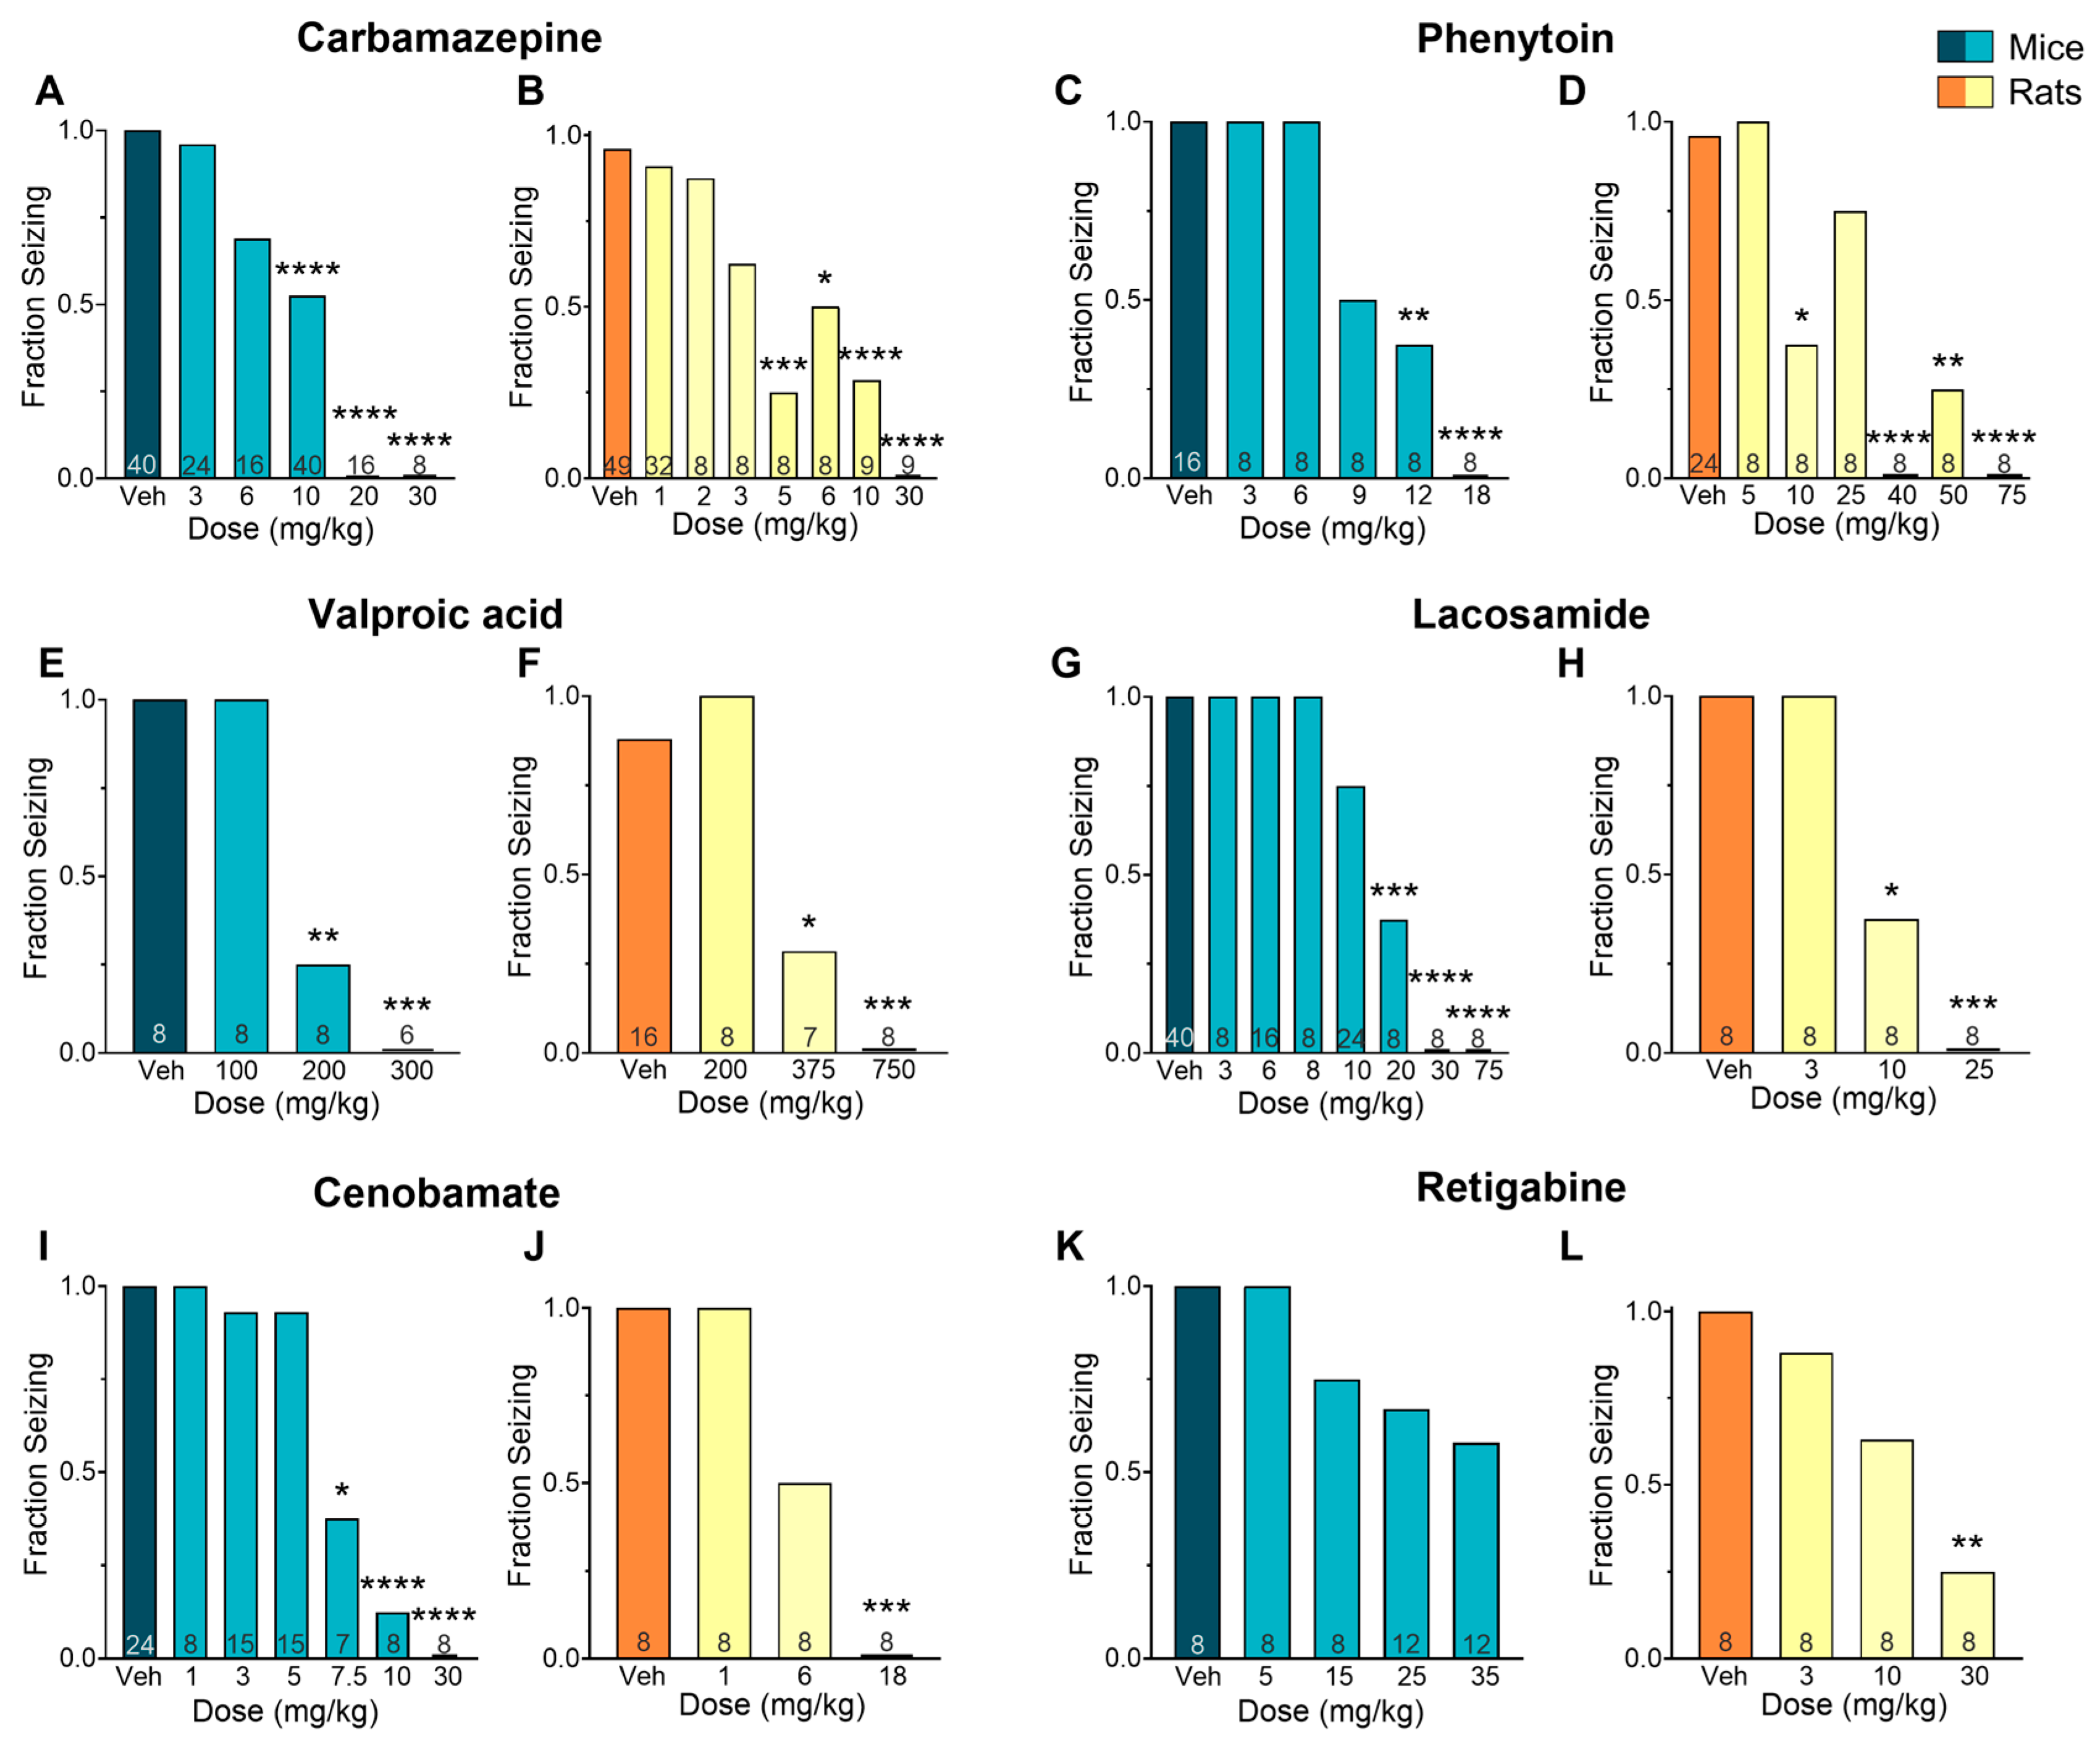
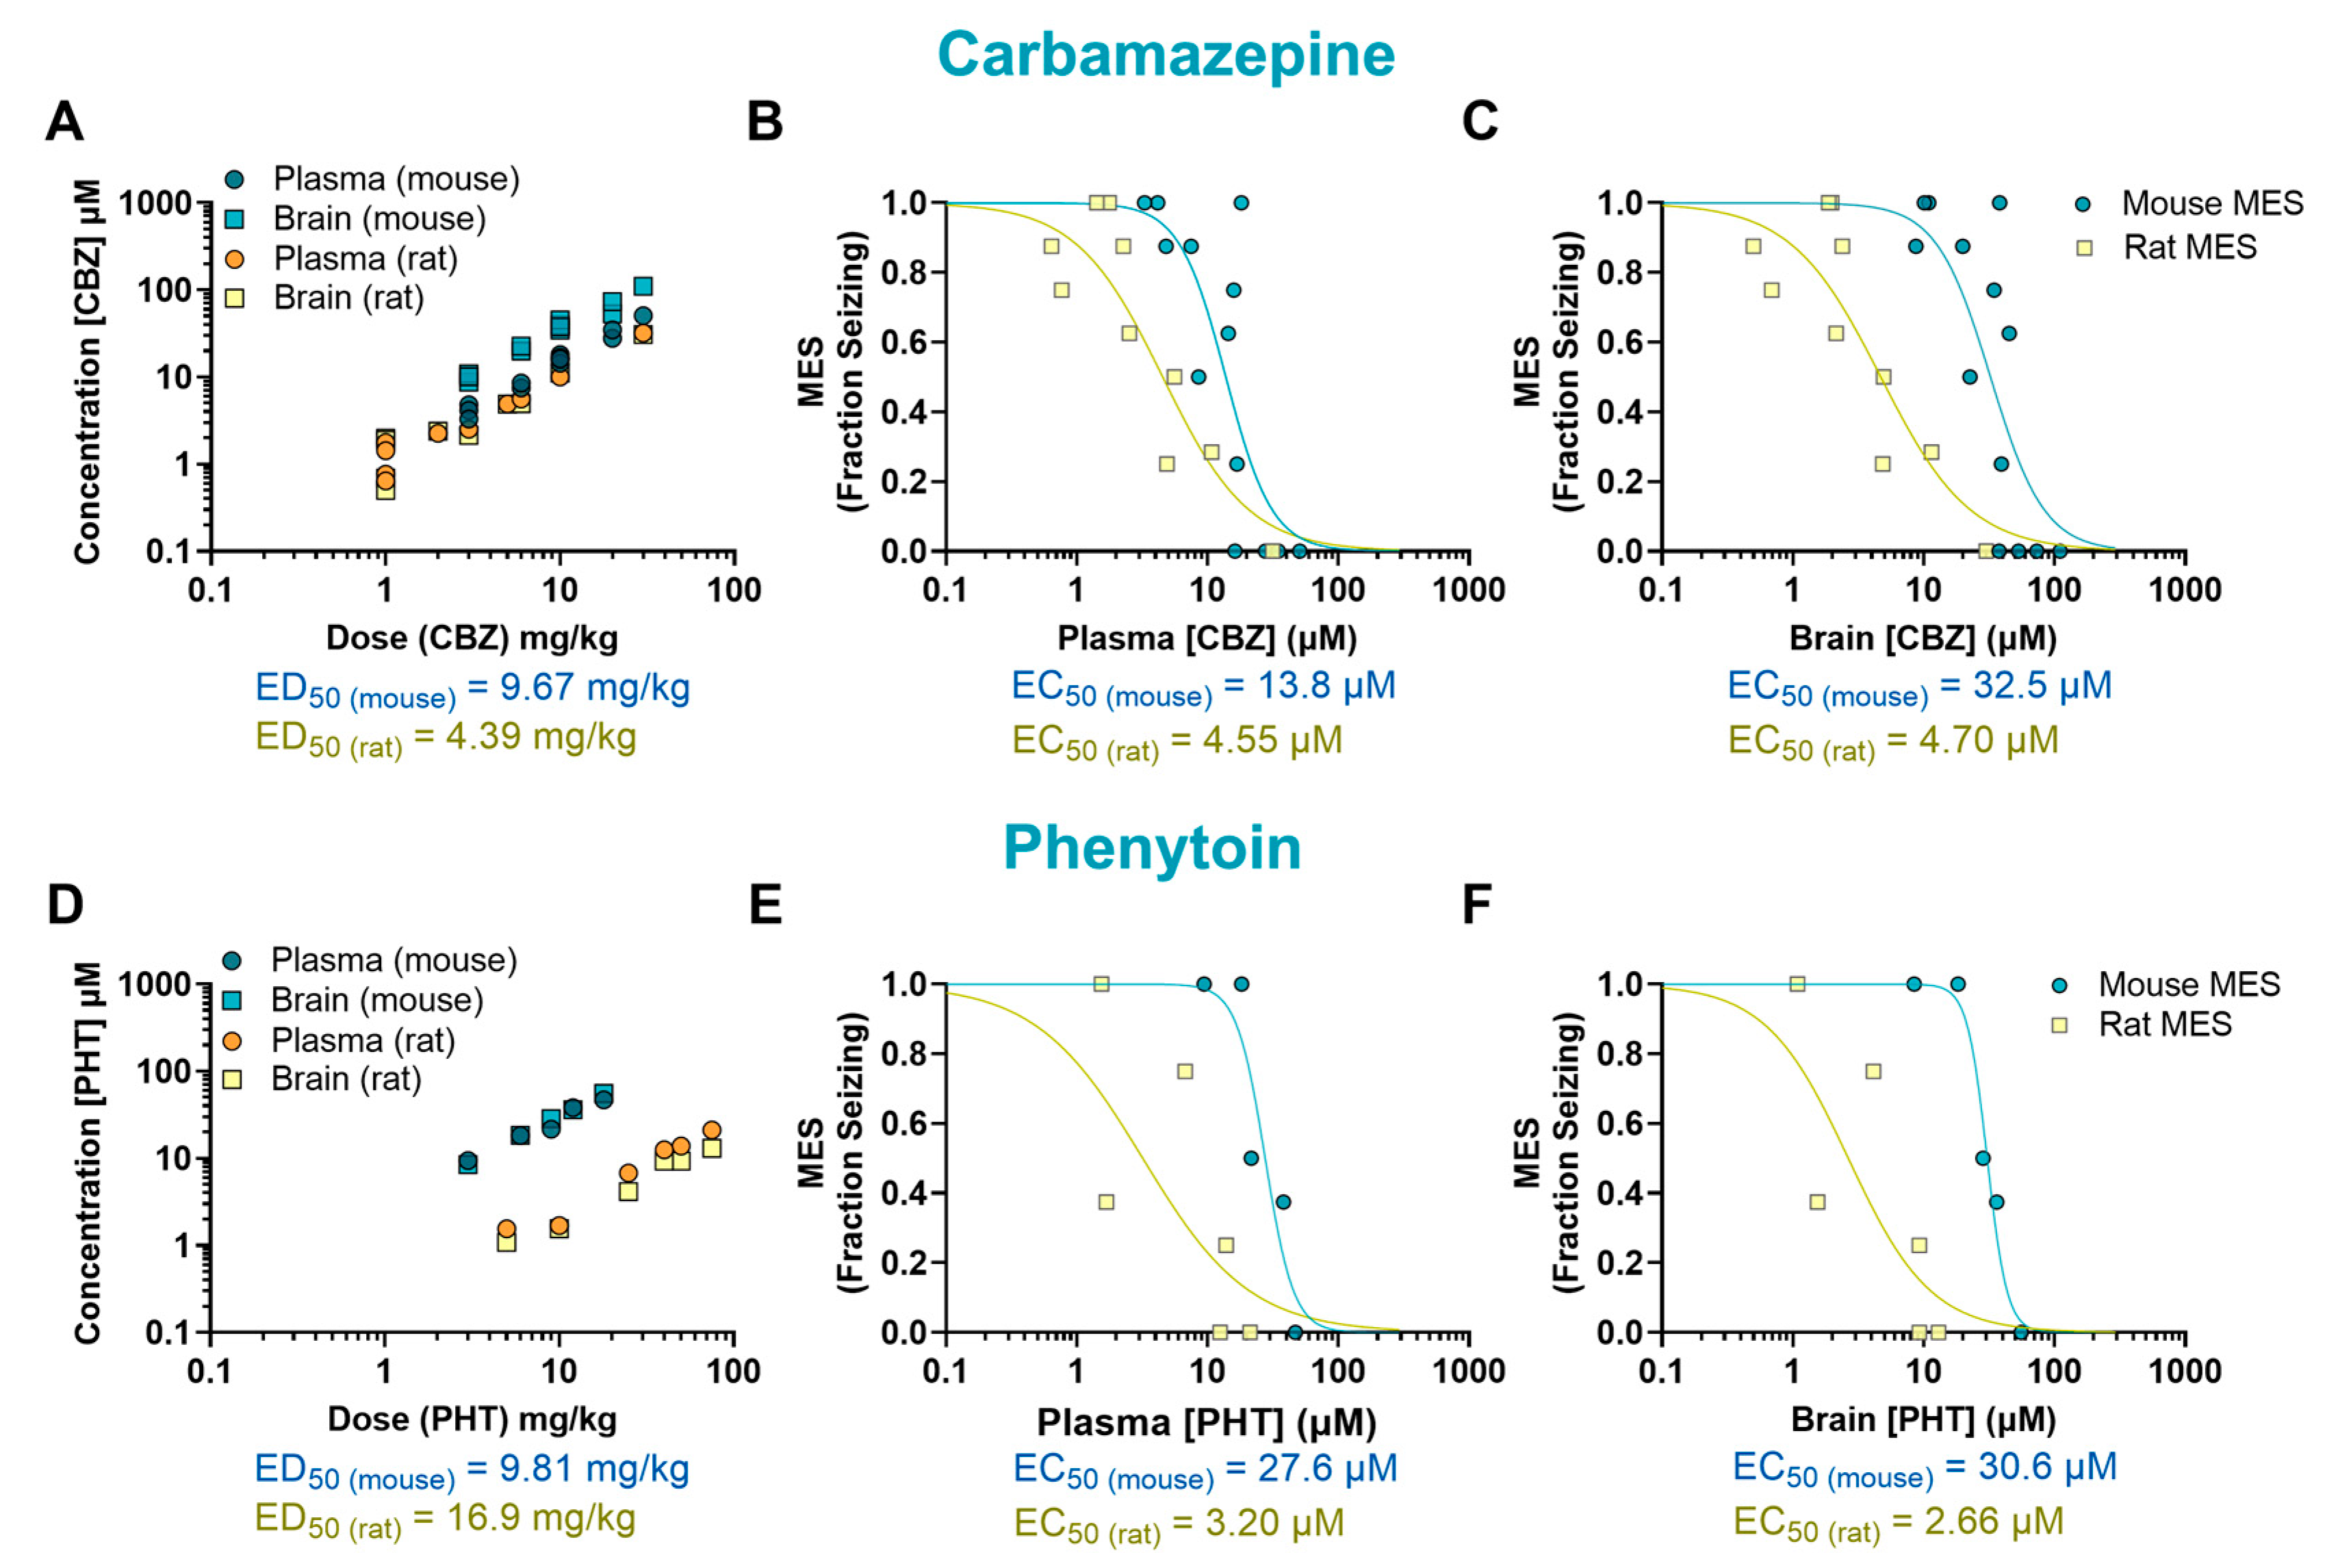
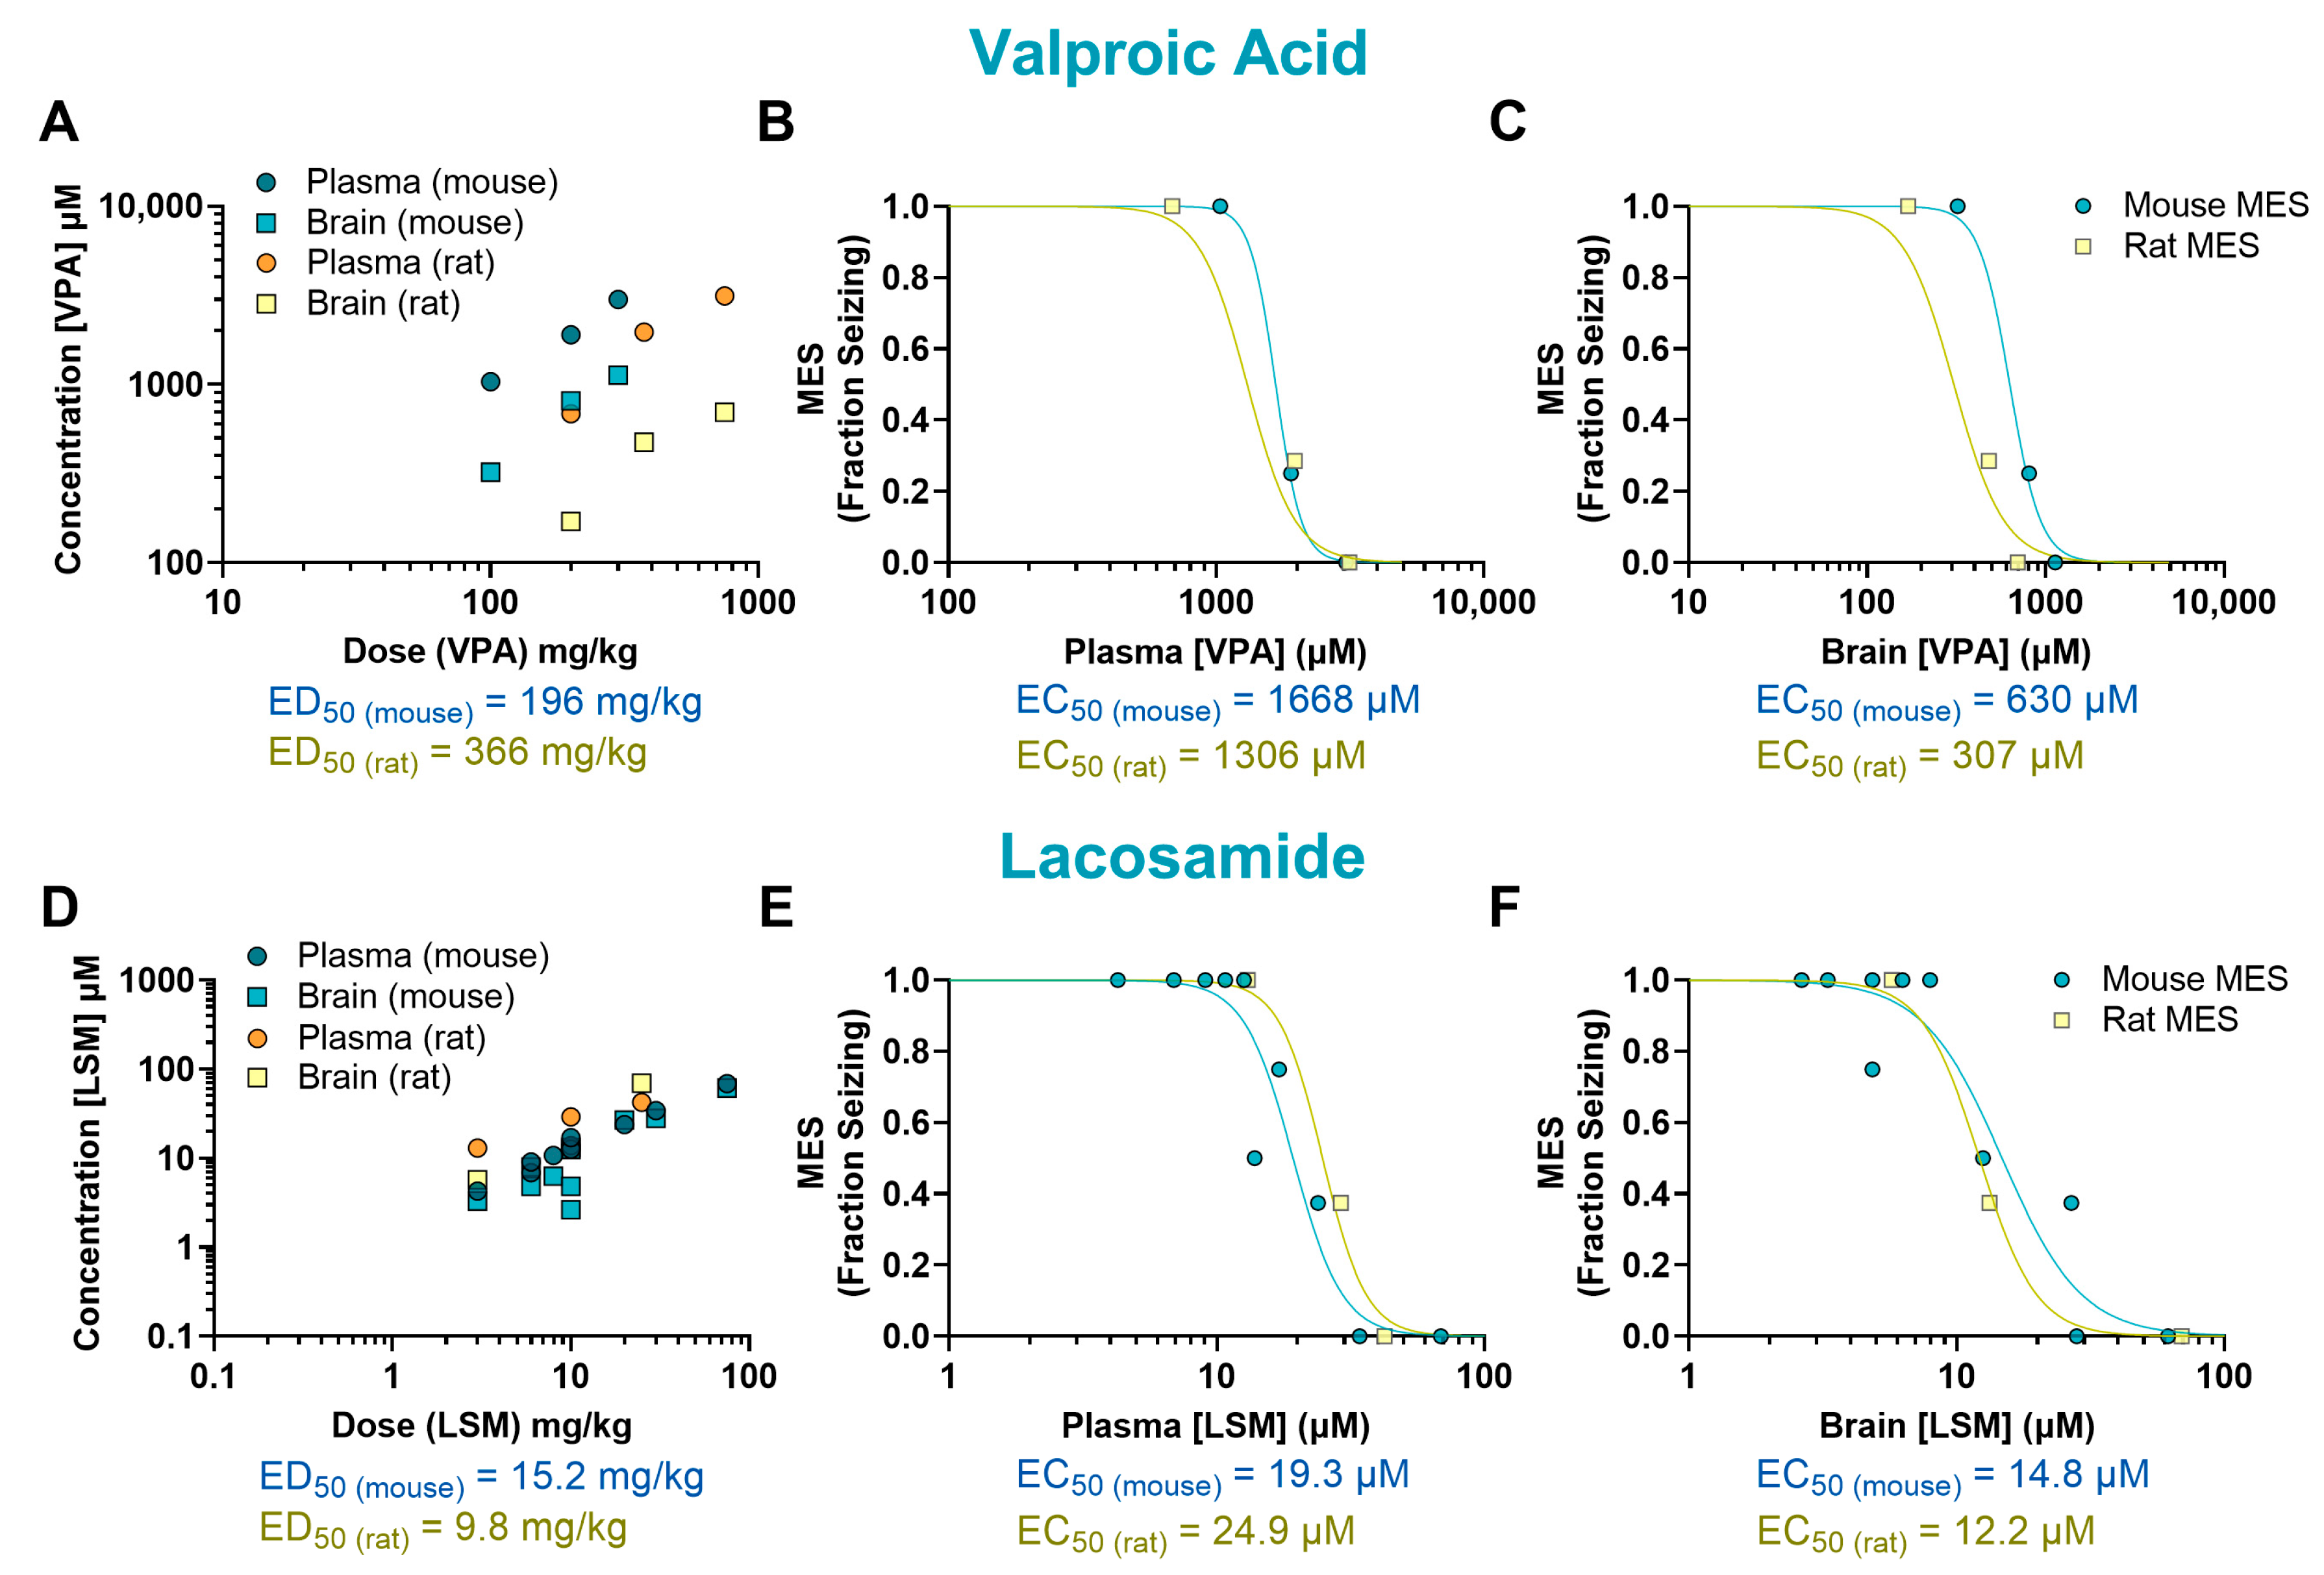
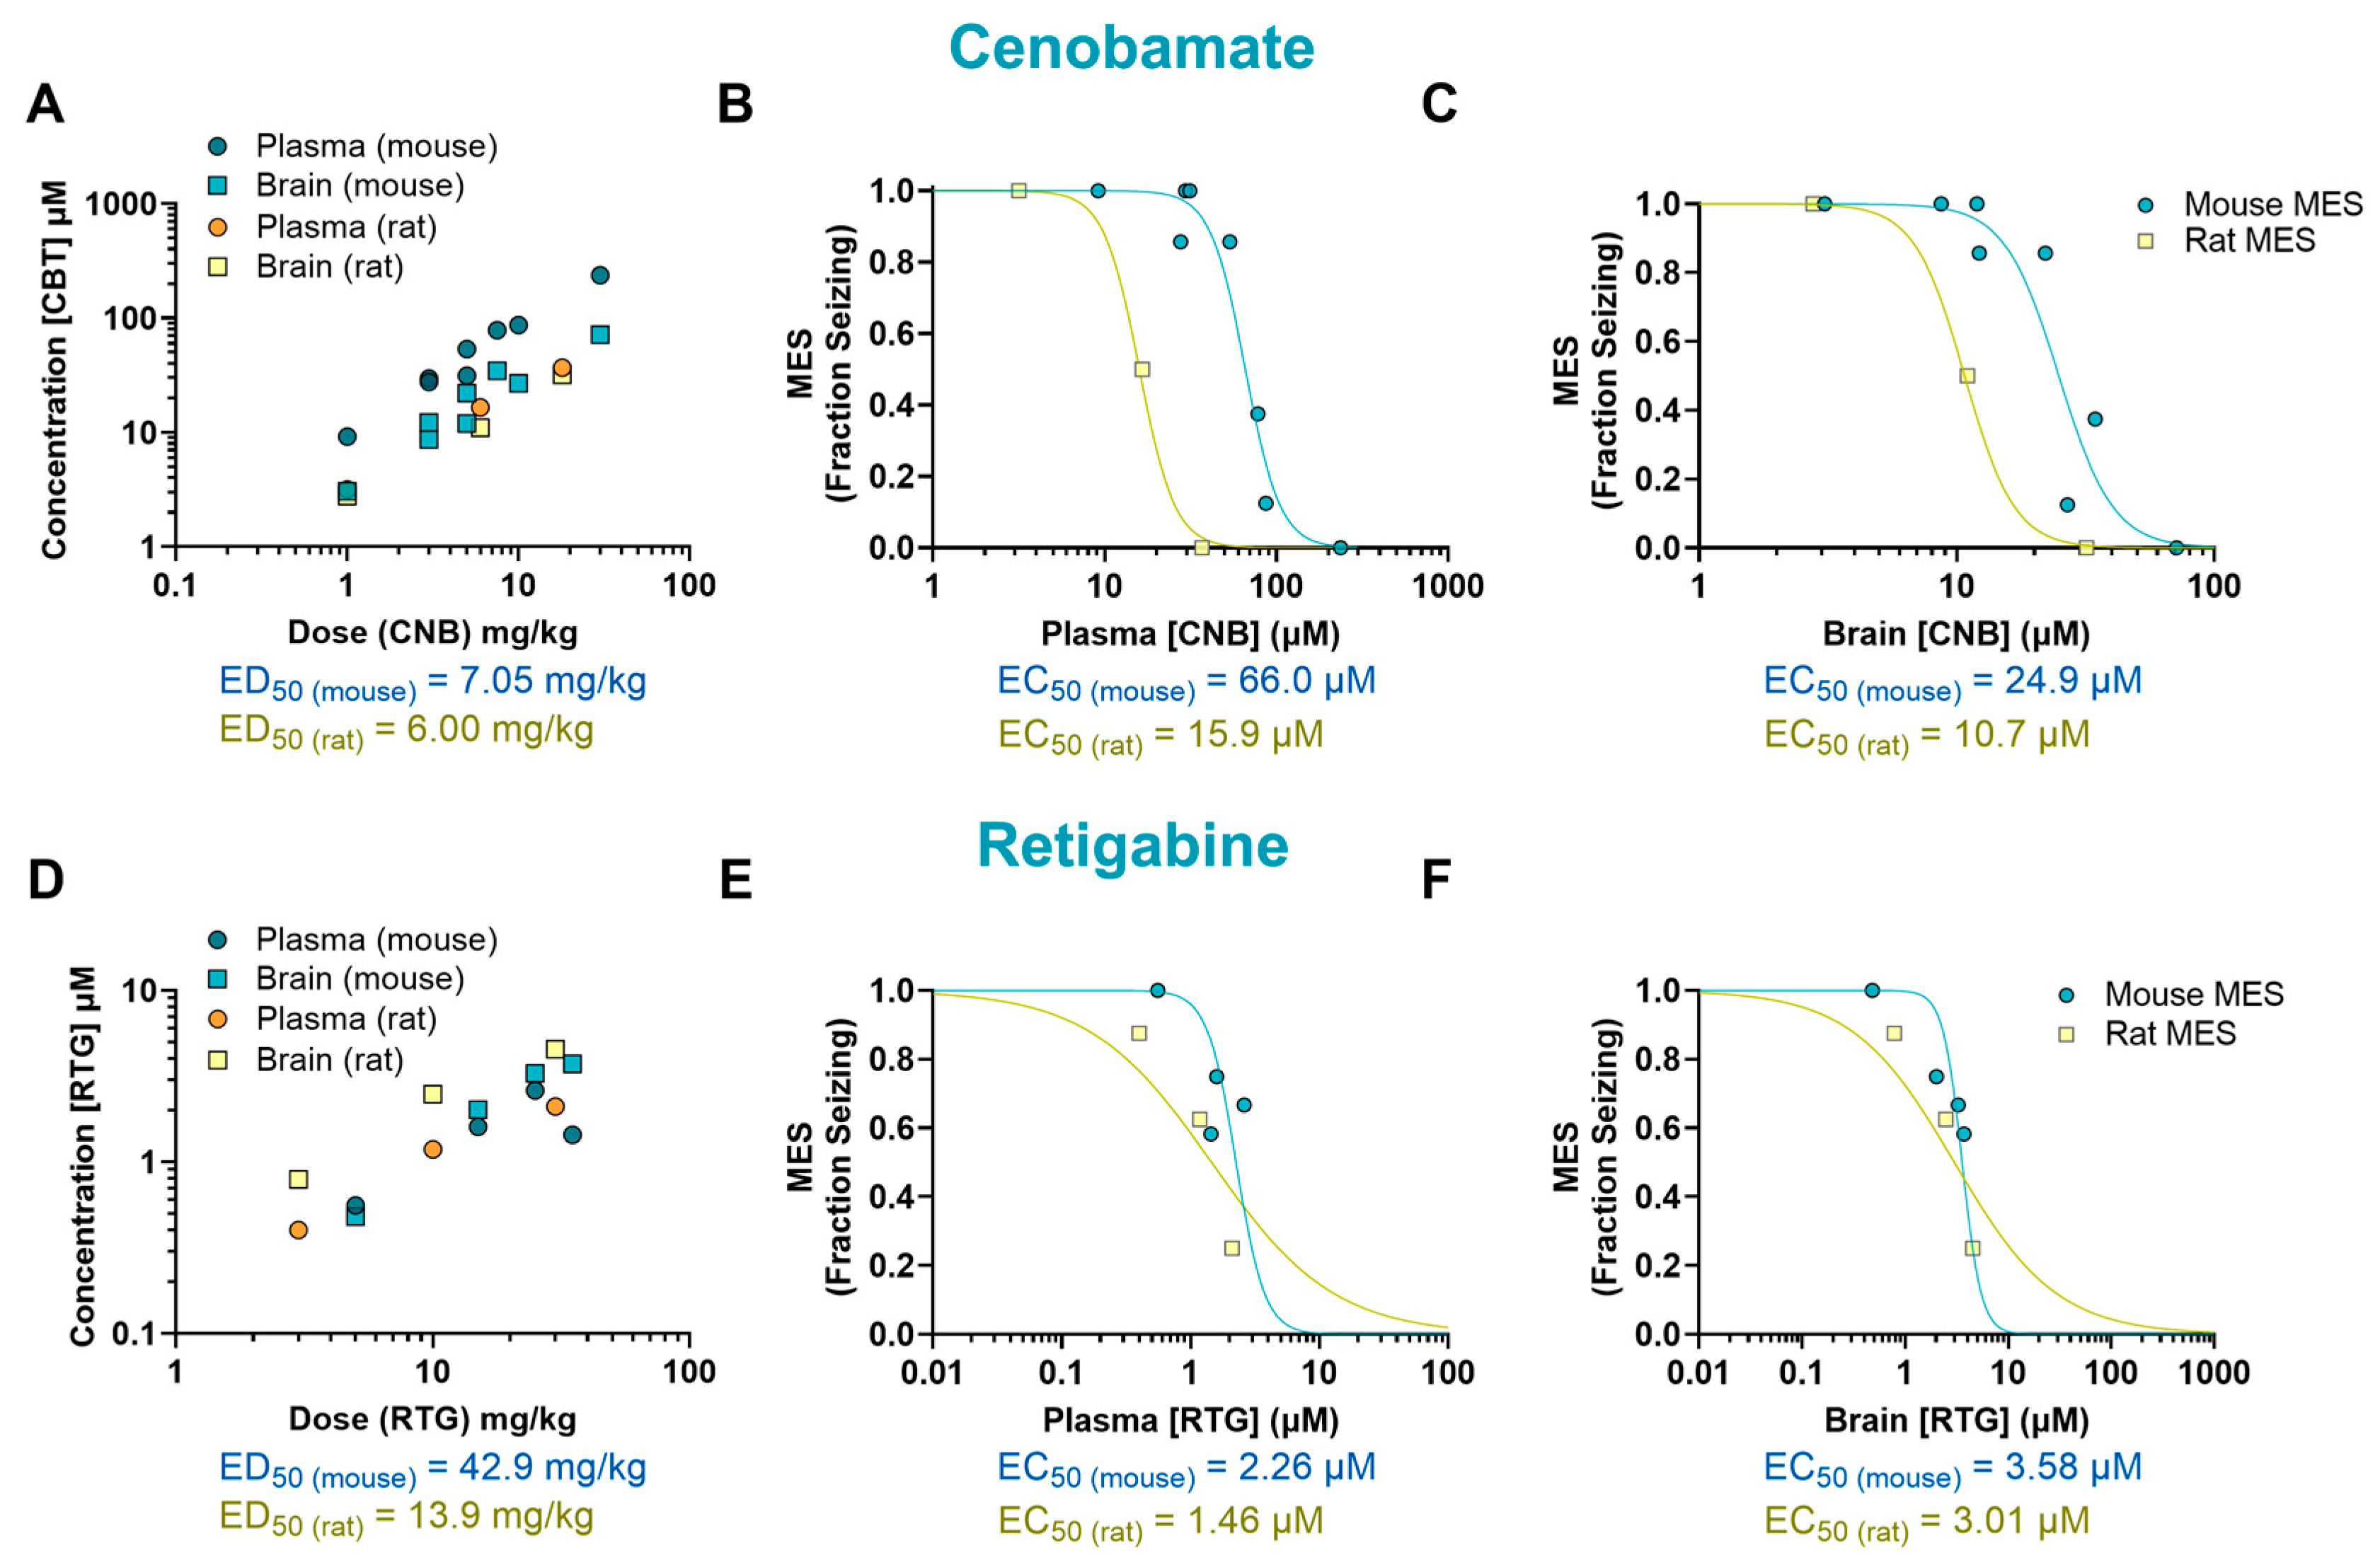
2. Results
3. Discussion
4. Materials and Methods
4.1. Animals
4.2. Drugs and Treatments
4.3. Alternating Current-Maximal Electroshock Seizure Assay (AC-MES)
4.4. Collection of Plasma and Brain Samples
4.5. Processing of Samples for Bioanalysis
4.5.1. Plasma Samples
4.5.2. Brain Samples
4.6. Bioanalysis Procedures
4.7. Data Processing and Analysis
- B = bottom and is set as 0.
- T = top and is set as 1.
- n = the Hill coefficient and is constrained to less than zero.
- IC50 = the concentration of a compound required for 50% inhibition in vitro.
Supplementary Materials
Author Contributions
Funding
Institutional Review Board Statement
Informed Consent Statement
Data Availability Statement
Acknowledgments
Conflicts of Interest
Abbreviations
| ASMs | Antiseizure medications |
| BBB | Blood–brain barrier |
| B/P | Brain-to-plasma |
| CNB | Cenobamate |
| CBZ | Carbamazepine |
| EC50 | Half-maximal effective concentration |
| ED50 | Median effective dose |
| GABA | γ-aminobutyric acid |
| LSM | Lacosamide |
| MES | Maximal electroshock seizure |
| PHT | Phenytoin |
| PK/PD | Pharmacokinetics/pharmacodynamics |
| RTG | Retigabine |
| SD | Sprague-Dawley |
| VPA | Valproic acid |
References
- Yuen, E.S.; Troconiz, I.F. Can pentylenetetrazole and maximal electroshock rodent seizure models quantitatively predict antiepileptic efficacy in humans? Seizure 2015, 24, 21–27. [Google Scholar] [CrossRef] [PubMed]
- Toman, J.E.; Swinyard, E.A.; Goodman, L.S. Properties of maximal seizures, and their alteration by anticonvulant drugs and other agents. J. Neurophysiol. 1946, 9, 231–239. [Google Scholar] [CrossRef] [PubMed]
- Castel-Branco, M.M.; Alves, G.L.; Figueiredo, I.V.; Falcao, A.C.; Caramona, M.M. The maximal electroshock seizure (MES) model in the preclinical assessment of potential new antiepileptic drugs. Methods Find. Exp. Clin. Pharmacol. 2009, 31, 101–106. [Google Scholar] [CrossRef] [PubMed]
- Lukawski, K.; Janowska, A.; Jakubus, T.; Czuczwar, S.J. Interactions between angiotensin AT1 receptor antagonists and second-generation antiepileptic drugs in the test of maximal electroshock. Fundam. Clin. Pharmacol. 2014, 28, 277–283. [Google Scholar] [CrossRef] [PubMed]
- Luszczki, J.J.; Trojnar, M.K.; Ratnaraj, N.; Patsalos, P.N.; Czuczwar, S.J. Interactions of stiripentol with clobazam and valproate in the mouse maximal electroshock-induced seizure model. Epilepsy Res. 2010, 90, 188–198. [Google Scholar] [CrossRef] [PubMed]
- Stepien, K.M.; Tomaszewski, M.; Luszczki, J.J.; Czuczwar, S.J. The interactions of atorvastatin and fluvastatin with carbamazepine, phenytoin and valproate in the mouse maximal electroshock seizure model. Eur. J. Pharmacol. 2012, 674, 20–26. [Google Scholar] [CrossRef] [PubMed]
- Bialer, M.; Twyman, R.E.; White, H.S. Correlation analysis between anticonvulsant ED50 values of antiepileptic drugs in mice and rats and their therapeutic doses and plasma levels. Epilepsy Behav. 2004, 5, 866–872. [Google Scholar] [CrossRef] [PubMed]
- Mensah, J.A.; Johnson, K.; Reilly, C.A.; Wilcox, K.S.; Rower, J.E.; Metcalf, C.S. Evaluating the efficacy of prototype antiseizure drugs using a preclinical pharmacokinetic approach. Epilepsia 2022, 63, 2937–2948. [Google Scholar] [CrossRef] [PubMed]
- Caccia, S.; Guiso, G.; Samanin, R.; Garattini, S. Species differences in clobazam metabolism and antileptazol effect. J. Pharm. Pharmacol. 1980, 32, 101–103. [Google Scholar] [CrossRef] [PubMed]
- Kulkarni, A.D.; Patel, H.M.; Surana, S.J.; Belgamwar, V.S.; Pardeshi, C.V. Brain-blood ratio: Implications in brain drug delivery. Expert. Opin. Drug Deliv. 2016, 13, 85–92. [Google Scholar] [CrossRef] [PubMed]
- Di, L.; Kerns, E.H.; Carter, G.T. Strategies to assess blood-brain barrier penetration. Expert. Opin. Drug Discov. 2008, 3, 677–687. [Google Scholar] [CrossRef] [PubMed]
- Di, L.; Rong, H.; Feng, B. Demystifying brain penetration in central nervous system drug discovery. Miniperspective. J. Med. Chem. 2013, 56, 2–12. [Google Scholar] [CrossRef] [PubMed]
- Zanatta, G.; Sula, A.; Miles, A.J.; Ng, L.C.T.; Torella, R.; Pryde, D.C.; DeCaen, P.G.; Wallace, B.A. Valproic acid interactions with the NavMs voltage-gated sodium channel. Proc. Natl. Acad. Sci. USA 2019, 116, 26549–26554. [Google Scholar] [CrossRef] [PubMed]
- Wilson, S.M.; Khanna, R. Specific binding of lacosamide to collapsin response mediator protein 2 (CRMP2) and direct impairment of its canonical function: Implications for the therapeutic potential of lacosamide. Mol. Neurobiol. 2015, 51, 599–609. [Google Scholar] [CrossRef] [PubMed]
- Roberti, R.; De Caro, C.; Iannone, L.F.; Zaccara, G.; Lattanzi, S.; Russo, E. Pharmacology of Cenobamate: Mechanism of Action, Pharmacokinetics, Drug-Drug Interactions and Tolerability. CNS Drugs 2021, 35, 609–618. [Google Scholar] [CrossRef] [PubMed]
- Wickenden, A.D.; Yu, W.; Zou, A.; Jegla, T.; Wagoner, P.K. Retigabine, a novel anti-convulsant, enhances activation of KCNQ2/Q3 potassium channels. Mol. Pharmacol. 2000, 58, 591–600. [Google Scholar] [CrossRef] [PubMed]
- Mula, M.; Kanner, A.M.; Jette, N.; Sander, J.W. Psychiatric Comorbidities in People With Epilepsy. Neurol. Clin. Pract. 2021, 11, e112–e120. [Google Scholar] [CrossRef] [PubMed]
- Mbizvo, G.K.; Bennett, K.; Simpson, C.R.; Duncan, S.E.; Chin, R.F.M. Epilepsy-related and other causes of mortality in people with epilepsy: A systematic review of systematic reviews. Epilepsy Res. 2019, 157, 106192. [Google Scholar] [CrossRef] [PubMed]
- Kwan, P.; Brodie, M.J. Early identification of refractory epilepsy. N. Engl. J. Med. 2000, 342, 314–319. [Google Scholar] [CrossRef] [PubMed]
- Chen, Z.; Brodie, M.J.; Liew, D.; Kwan, P. Treatment Outcomes in Patients with Newly Diagnosed Epilepsy Treated With Established and New Antiepileptic Drugs: A 30-Year Longitudinal Cohort Study. JAMA Neurol. 2018, 75, 279–286. [Google Scholar] [CrossRef] [PubMed]
- Eatock, J.; Baker, G.A. Managing patient adherence and quality of life in epilepsy. Neuropsychiatr. Dis. Treat. 2007, 3, 117–131. [Google Scholar] [CrossRef] [PubMed]
- Verrotti, A.; Tambucci, R.; Di Francesco, L.; Pavone, P.; Iapadre, G.; Altobelli, E.; Matricardi, S.; Farello, G.; Belcastro, V. The role of polytherapy in the management of epilepsy: Suggestions for rational antiepileptic drug selection. Expert. Rev. Neurother. 2020, 20, 167–173. [Google Scholar] [CrossRef] [PubMed]
- Abou-Khalil, B. Selecting Rational Drug Combinations in Epilepsy. CNS Drugs 2017, 31, 835–844. [Google Scholar] [CrossRef] [PubMed]
- Vajda, F.J.; Eadie, M.J. The clinical pharmacology of traditional antiepileptic drugs. Epileptic Disord. 2014, 16, 395–408. [Google Scholar] [CrossRef] [PubMed]
- Schmidt, D.; Schachter, S.C. Drug treatment of epilepsy in adults. Br. Med. J. 2014, 348, g254. [Google Scholar] [CrossRef] [PubMed]
- Loscher, W.; Fassbender, C.P.; Nolting, B. The role of technical, biological and pharmacological factors in the laboratory evaluation of anticonvulsant drugs. II. Maximal electroshock seizure models. Epilepsy Res. 1991, 8, 79–94. [Google Scholar] [CrossRef] [PubMed]
- Loscher, W.; Ferland, R.J.; Ferraro, T.N. The relevance of inter- and intrastrain differences in mice and rats and their implications for models of seizures and epilepsy. Epilepsy Behav. 2017, 73, 214–235. [Google Scholar] [CrossRef] [PubMed]
- Toutain, P.L.; Lees, P. Integration and modelling of pharmacokinetic and pharmacodynamic data to optimize dosage regimens in veterinary medicine. J. Vet. Pharmacol. Ther. 2004, 27, 467–477. [Google Scholar] [CrossRef] [PubMed]
- Lucas, A.J.; Sproston, J.L.; Barton, P.; Riley, R.J. Estimating human ADME properties, pharmacokinetic parameters and likely clinical dose in drug discovery. Expert. Opin. Drug Discov. 2019, 14, 1313–1327. [Google Scholar] [CrossRef] [PubMed]
- Loscher, W.; Gericke, B. Novel Intrinsic Mechanisms of Active Drug Extrusion at the Blood-Brain Barrier: Potential Targets for Enhancing Drug Delivery to the Brain? Pharmaceutics 2020, 12, 966. [Google Scholar] [CrossRef] [PubMed]
- Loryan, I.; Reichel, A.; Feng, B.; Bundgaard, C.; Shaffer, C.; Kalvass, C.; Bednarczyk, D.; Morrison, D.; Lesuisse, D.; Hoppe, E.; et al. Unbound Brain-to-Plasma Partition Coefficient, K(p,uu,brain)-a Game Changing Parameter for CNS Drug Discovery and Development. Pharm. Res. 2022, 39, 1321–1341. [Google Scholar] [CrossRef] [PubMed]
- Piredda, S.G.; Woodhead, J.H.; Swinyard, E.A. Effect of stimulus intensity on the profile of anticonvulsant activity of phenytoin, ethosuximide and valproate. J. Pharmacol. Exp. Ther. 1985, 232, 741–745. [Google Scholar] [CrossRef] [PubMed]
- White, H.S.; Johnson, M.; Wolf, H.H.; Kupferberg, H.J. The early identification of anticonvulsant activity: Role of the maximal electroshock and subcutaneous pentylenetetrazol seizure models. Ital. J. Neurol. Sci. 1995, 16, 73–77. [Google Scholar] [CrossRef] [PubMed]
- Loscher, W. Valproate: A reappraisal of its pharmacodynamic properties and mechanisms of action. Prog. Neurobiol. 1999, 58, 31–59. [Google Scholar] [CrossRef] [PubMed]
- Center for Drug Evaluation and Research. Pharmacology/Toxicology NDA Review and Evaluation: Cenobamate (YKP3089) NDA 212839; U.S. Food and Drug Administration: Silver Spring, MD, USA, 2019. [Google Scholar]
- Patsalos, P.N.; Berry, D.J.; Bourgeois, B.F.; Cloyd, J.C.; Glauser, T.A.; Johannessen, S.I.; Leppik, I.E.; Tomson, T.; Perucca, E. Antiepileptic drugs--best practice guidelines for therapeutic drug monitoring: A position paper by the subcommission on therapeutic drug monitoring, ILAE Commission on Therapeutic Strategies. Epilepsia 2008, 49, 1239–1276. [Google Scholar] [CrossRef] [PubMed]
- Johannessen Landmark, C.; Johannessen, S.I.; Patsalos, P.N. Therapeutic drug monitoring of antiepileptic drugs: Current status and future prospects. Expert. Opin. Drug Metab. Toxicol. 2020, 16, 227–238. [Google Scholar] [CrossRef] [PubMed]
- Patsalos, P.N.; Perucca, E. Clinically important drug interactions in epilepsy: Interactions between antiepileptic drugs and other drugs. Lancet Neurol. 2003, 2, 473–481. [Google Scholar] [CrossRef] [PubMed]
- Large, C.H.; Sokal, D.M.; Nehlig, A.; Gunthorpe, M.J.; Sankar, R.; Crean, C.S.; Vanlandingham, K.E.; White, H.S. The spectrum of anticonvulsant efficacy of retigabine (ezogabine) in animal models: Implications for clinical use. Epilepsia 2012, 53, 425–436. [Google Scholar] [CrossRef] [PubMed]
- Reimers, A.; Berg, J.A.; Burns, M.L.; Brodtkorb, E.; Johannessen, S.I.; Johannessen Landmark, C. Reference ranges for antiepileptic drugs revisited: A practical approach to establish national guidelines. Drug Des. Devel Ther. 2018, 12, 271–280. [Google Scholar] [CrossRef] [PubMed]
- Summerfield, S.G.; Yates, J.W.T.; Fairman, D.A. Free Drug Theory—No Longer Just a Hypothesis? Pharm. Res. 2022, 39, 213–222. [Google Scholar] [CrossRef] [PubMed]
- Colclough, N.; Ruston, L.; Wood, J.M.; MacFaul, P.A. Species differences in drug plasma protein binding. Med. Chem. Commun. 2014, 5, 963–967. [Google Scholar] [CrossRef]
- Charlier, B.; Coglianese, A.; De Rosa, F.; de Grazia, U.; Operto, F.F.; Coppola, G.; Filippelli, A.; Dal Piaz, F.; Izzo, V. The Effect of Plasma Protein Binding on the Therapeutic Monitoring of Antiseizure Medications. Pharmaceutics 2021, 13, 1208. [Google Scholar] [CrossRef] [PubMed]
- Furugen (43), A.; Nishimura, A.; Umazume, T.; Ishikawa, H.; Narumi, K.; Kobayashi, M. Simple and validated method to quantify lacosamide in human breast milk and plasma using UPLC/MS/MS and its application to estimate drug transfer into breast milk. J. Pharm. Health Care Sci. 2023, 9, 26. [Google Scholar] [CrossRef] [PubMed]
- Steinhoff, B.J.; Georgiou, D.; Dietmann, D.; Intravooth, T. Cenobamate Plasma Levels in Patients with Epilepsy: Correlation with Efficacy and Tolerability? J. Clin. Med. 2024, 13, 2757. [Google Scholar] [CrossRef] [PubMed]
- Italiano, D.; Perucca, E. Clinical pharmacokinetics of new-generation antiepileptic drugs at the extremes of age: An update. Clin. Pharmacokinet. 2013, 52, 627–645. [Google Scholar] [CrossRef] [PubMed]
- Patsalos, P.N.; Zugman, M.; Lake, C.; James, A.; Ratnaraj, N.; Sander, J.W. Serum protein binding of 25 antiepileptic drugs in a routine clinical setting: A comparison of free non-protein-bound concentrations. Epilepsia 2017, 58, 1234–1243. [Google Scholar] [CrossRef] [PubMed]


| Drug | Mechanism of Action | Species | ED50 (mg/kg) | EC50 (µM) Plasma | EC50 (µM) Brain | B/P Ratio |
|---|---|---|---|---|---|---|
| CBZ | Sodium channel blockade | Mouse | 9.67 | 13.8 | 32.5 | 2.36 |
| Rat | 4.39 | 4.55 | 4.70 | 1.03 | ||
| Mouse/rat fold | 2.20 | 3.03 | 6.91 | 2.28 | ||
| PHT | Sodium channel blockade | Mouse | 9.81 | 27.6 | 30.6 | 1.11 |
| Rat | 16.9 | 3.20 | 2.66 | 0.83 | ||
| Mouse/rat fold | 0.58 | 8.63 | 11.5 | 1.33 | ||
| VPA | GABA potentiation | Mouse | 196 | 1668 | 630 | 0.38 |
| Rat | 366 | 1306 | 307 | 0.24 | ||
| Mouse/rat fold | 0.54 | 1.28 | 2.05 | 1.61 | ||
| LSM | Sodium channel blockade/CRMP2 binder | Mouse | 15.2 | 19.3 | 14.8 | 0.77 |
| Rat | 9.80 | 24.9 | 12.2 | 0.49 | ||
| Mouse/rat fold | 1.55 | 0.78 | 1.21 | 1.57 | ||
| CNB | Sodium channel blockade/GABA potentiation suggested | Mouse | 7.05 | 66.0 | 24.9 | 0.38 |
| Rat | 6.00 | 15.9 | 10.7 | 0.67 | ||
| Mouse/rat fold | 1.18 | 4.15 | 2.33 | 0.56 | ||
| RTG | Kv7 potassium channel potentiator | Mouse | 42.9 | 2.26 | 3.58 | 1.58 |
| Rat | 13.9 | 1.46 | 3.01 | 2.06 | ||
| Mouse/rat fold | 3.09 | 1.55 | 1.19 | 0.77 |
| Drug | Mouse MES | Rat MES | ||
|---|---|---|---|---|
| Route | Pre-Treatment Time (h) | Route | Pre-Treatment Time (h) | |
| CBZ | PO | 0.5 | PO | 2 |
| PHT | IP | 1 | PO | 2 |
| VPA | IP | 0.25 | PO | 1 |
| LSM | PO | 2 | PO | 2 |
| CNB | PO | 2 | PO | 2 |
| RTG | PO | 0.5 | PO | 0.5 |
Disclaimer/Publisher’s Note: The statements, opinions and data contained in all publications are solely those of the individual author(s) and contributor(s) and not of MDPI and/or the editor(s). MDPI and/or the editor(s) disclaim responsibility for any injury to people or property resulting from any ideas, methods, instructions or products referred to in the content. |
© 2025 by the authors. Licensee MDPI, Basel, Switzerland. This article is an open access article distributed under the terms and conditions of the Creative Commons Attribution (CC BY) license (https://creativecommons.org/licenses/by/4.0/).
Share and Cite
Bettio, L.; Bankar, G.; Dubé, C.M.; Nelkenbrecher, K.; Filipovic, M.; Singh, S.; DeBoer, G.; Lee, S.; Lindgren, A.; Sojo, L.; et al. The Pharmacokinetic and Pharmacodynamic Relationship of Clinically Used Antiseizure Medications in the Maximal Electroshock Seizure Model in Rodents. Int. J. Mol. Sci. 2025, 26, 7029. https://doi.org/10.3390/ijms26157029
Bettio L, Bankar G, Dubé CM, Nelkenbrecher K, Filipovic M, Singh S, DeBoer G, Lee S, Lindgren A, Sojo L, et al. The Pharmacokinetic and Pharmacodynamic Relationship of Clinically Used Antiseizure Medications in the Maximal Electroshock Seizure Model in Rodents. International Journal of Molecular Sciences. 2025; 26(15):7029. https://doi.org/10.3390/ijms26157029
Chicago/Turabian StyleBettio, Luis, Girish Bankar, Celine M. Dubé, Karen Nelkenbrecher, Maja Filipovic, Sarbjot Singh, Gina DeBoer, Stephanie Lee, Andrea Lindgren, Luis Sojo, and et al. 2025. "The Pharmacokinetic and Pharmacodynamic Relationship of Clinically Used Antiseizure Medications in the Maximal Electroshock Seizure Model in Rodents" International Journal of Molecular Sciences 26, no. 15: 7029. https://doi.org/10.3390/ijms26157029
APA StyleBettio, L., Bankar, G., Dubé, C. M., Nelkenbrecher, K., Filipovic, M., Singh, S., DeBoer, G., Lee, S., Lindgren, A., Sojo, L., Dean, R., Johnson, J. P., Jr., & Weishaupt, N. (2025). The Pharmacokinetic and Pharmacodynamic Relationship of Clinically Used Antiseizure Medications in the Maximal Electroshock Seizure Model in Rodents. International Journal of Molecular Sciences, 26(15), 7029. https://doi.org/10.3390/ijms26157029