
Solvent Fractionation of Polygonum cuspidatum Sieb. et Zucc. for Antioxidant, Biological Activity, and Chromatographic Characterization


Abstract
1. Introduction
2. Results
2.1. Total Polyphenol and Flavonoid Contents of Solvent Fractions from P. cuspidatum
2.2. Antioxidant Activities (DPPH, ABTS Radical Scavenging Activity, and Ferric Reducing Antioxidant Power (FRAP) Assay) of Solvent Fractions from P. cuspidatum
2.3. Tyrosinase and Elastase Inhibitory Activities of Solvent Fractions from P. cuspidatum
2.4. α-Glucosidase and Lipase Inhibitory Activities of Solvent Fractions from P. cuspidatum
2.5. Antibacterial Activity of Solvent Fractions from P. cuspidatum Broth Against Selected Microbial Strains
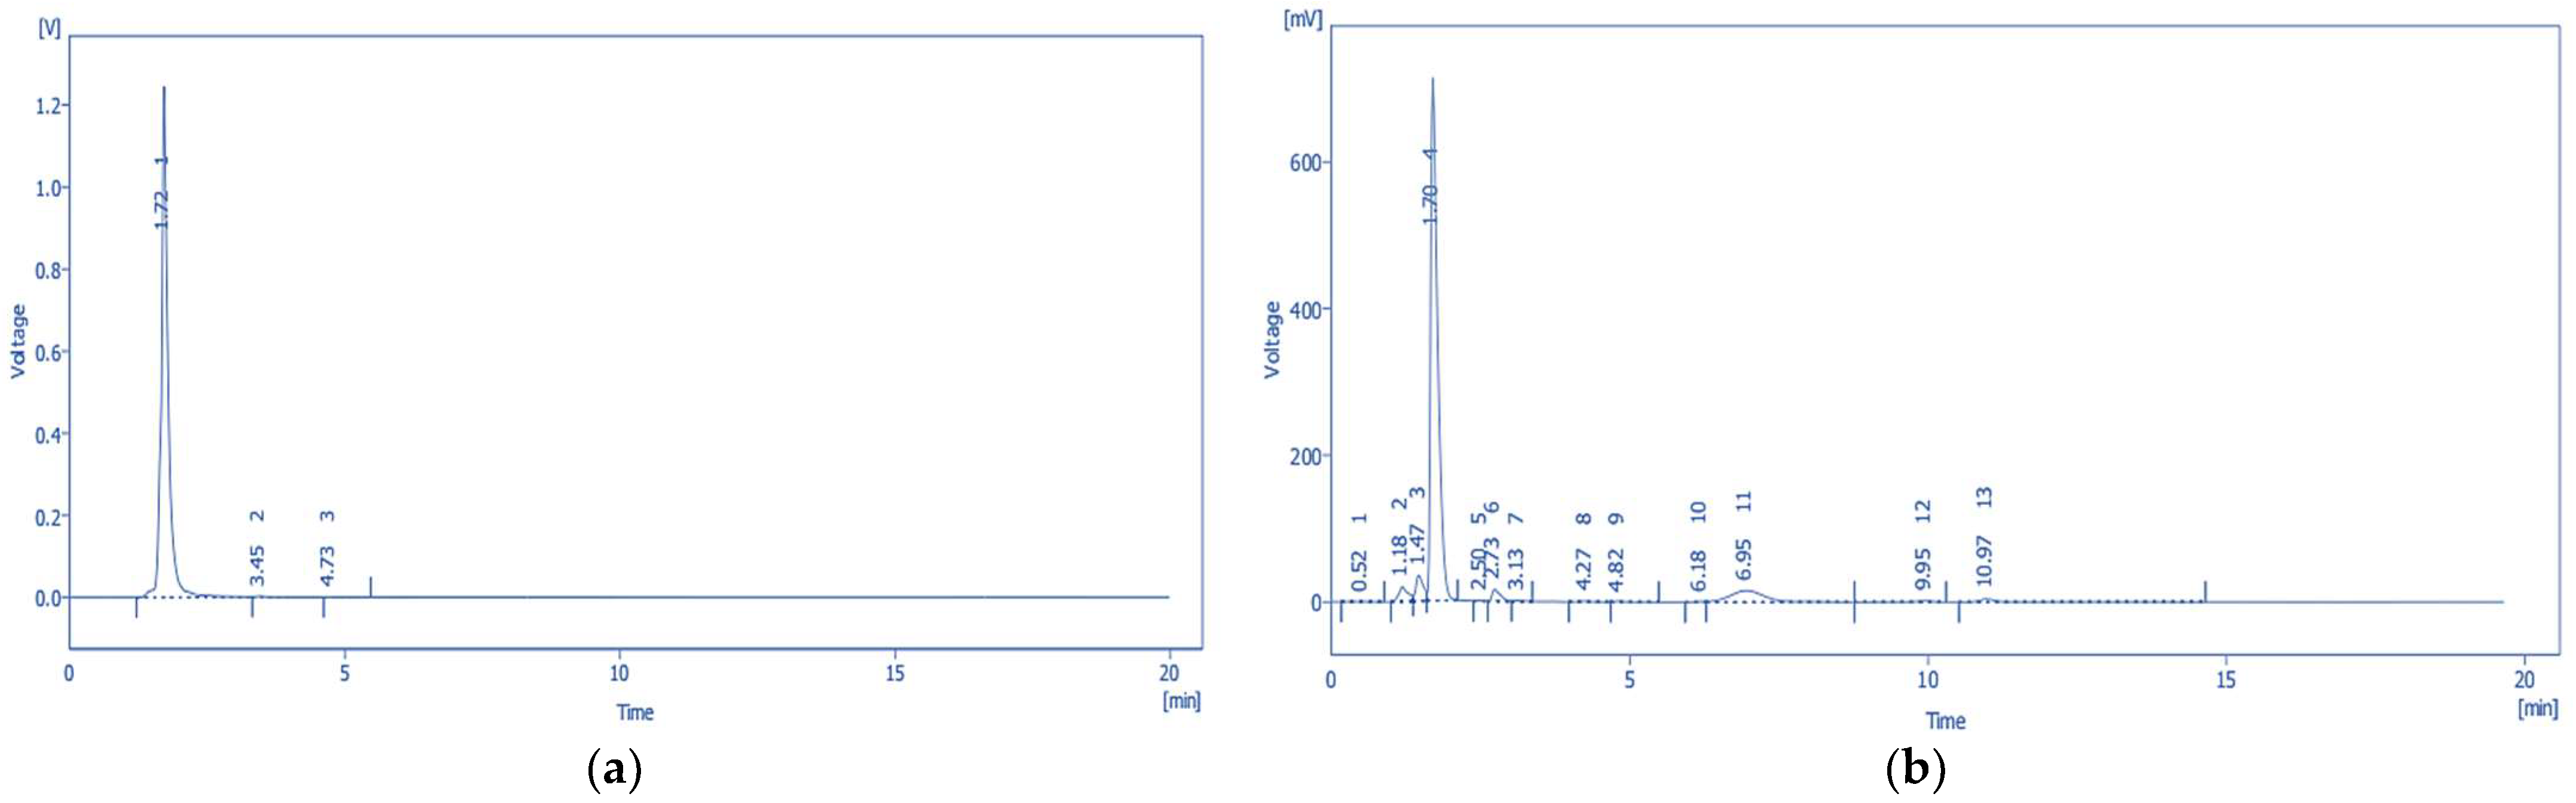
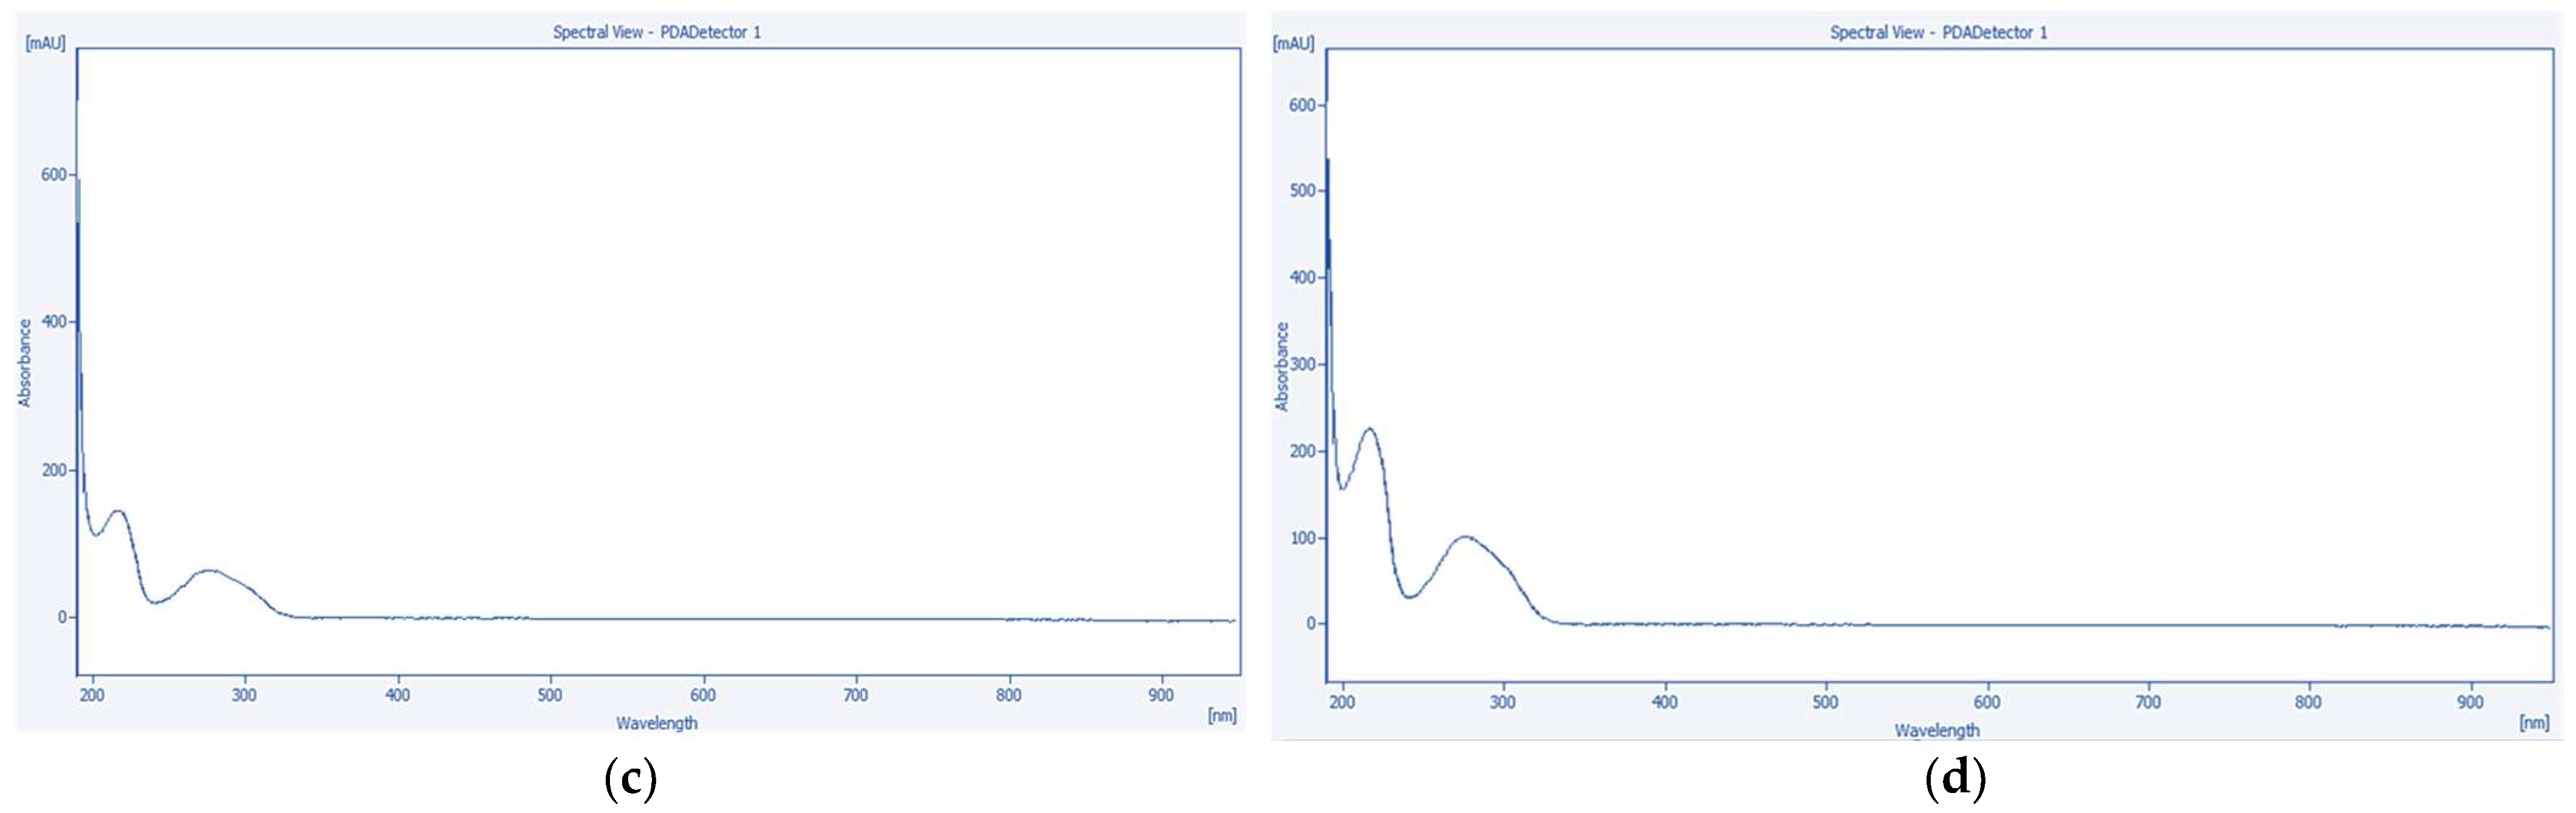
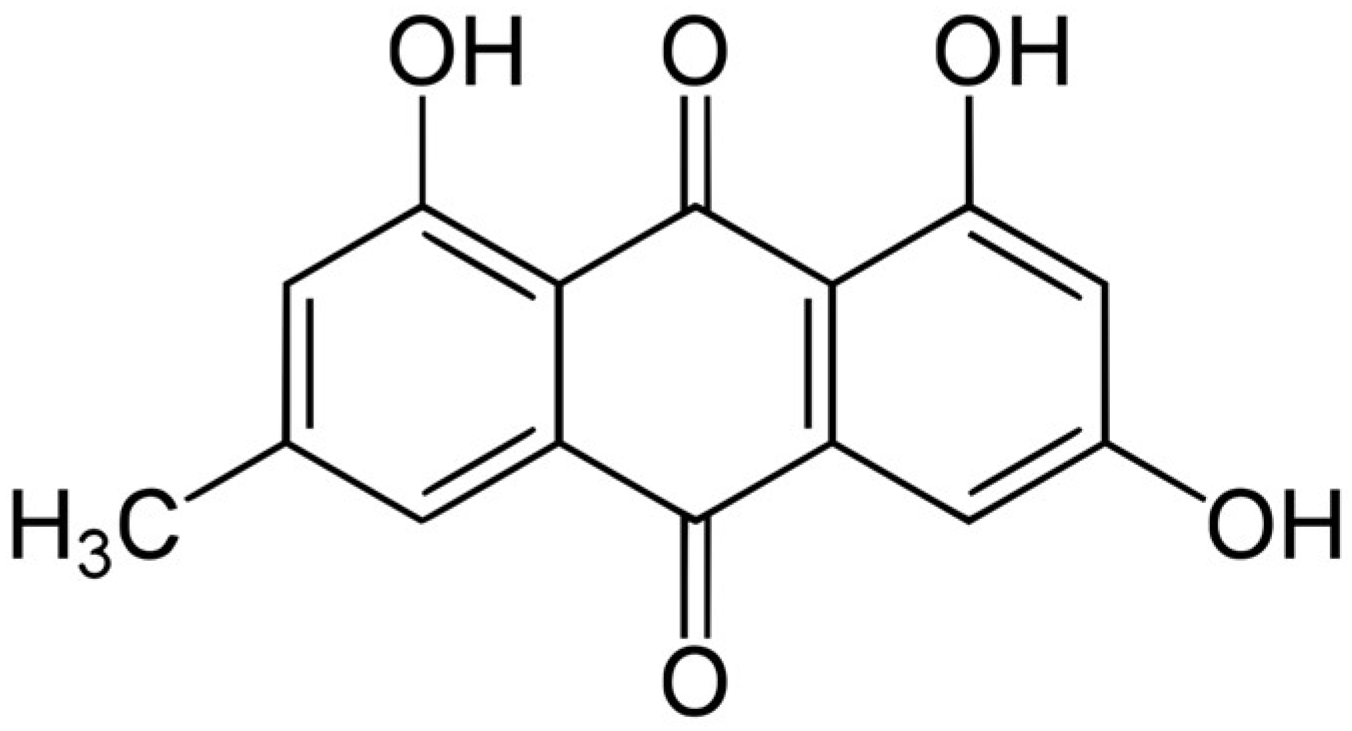
2.6. High-Performance Liquid Chromatography with Photodiode Array Detection (HPLC-PDA) Quantification of Tannic Acid and Emodin
2.6.1. Evaluation of Linearity, Sensitivity, and Precision
2.6.2. Evaluation of Method Precision and Accuracy
2.6.3. Quantitative Analysis of Tannic Acid and Emodin by HPLC-PDA
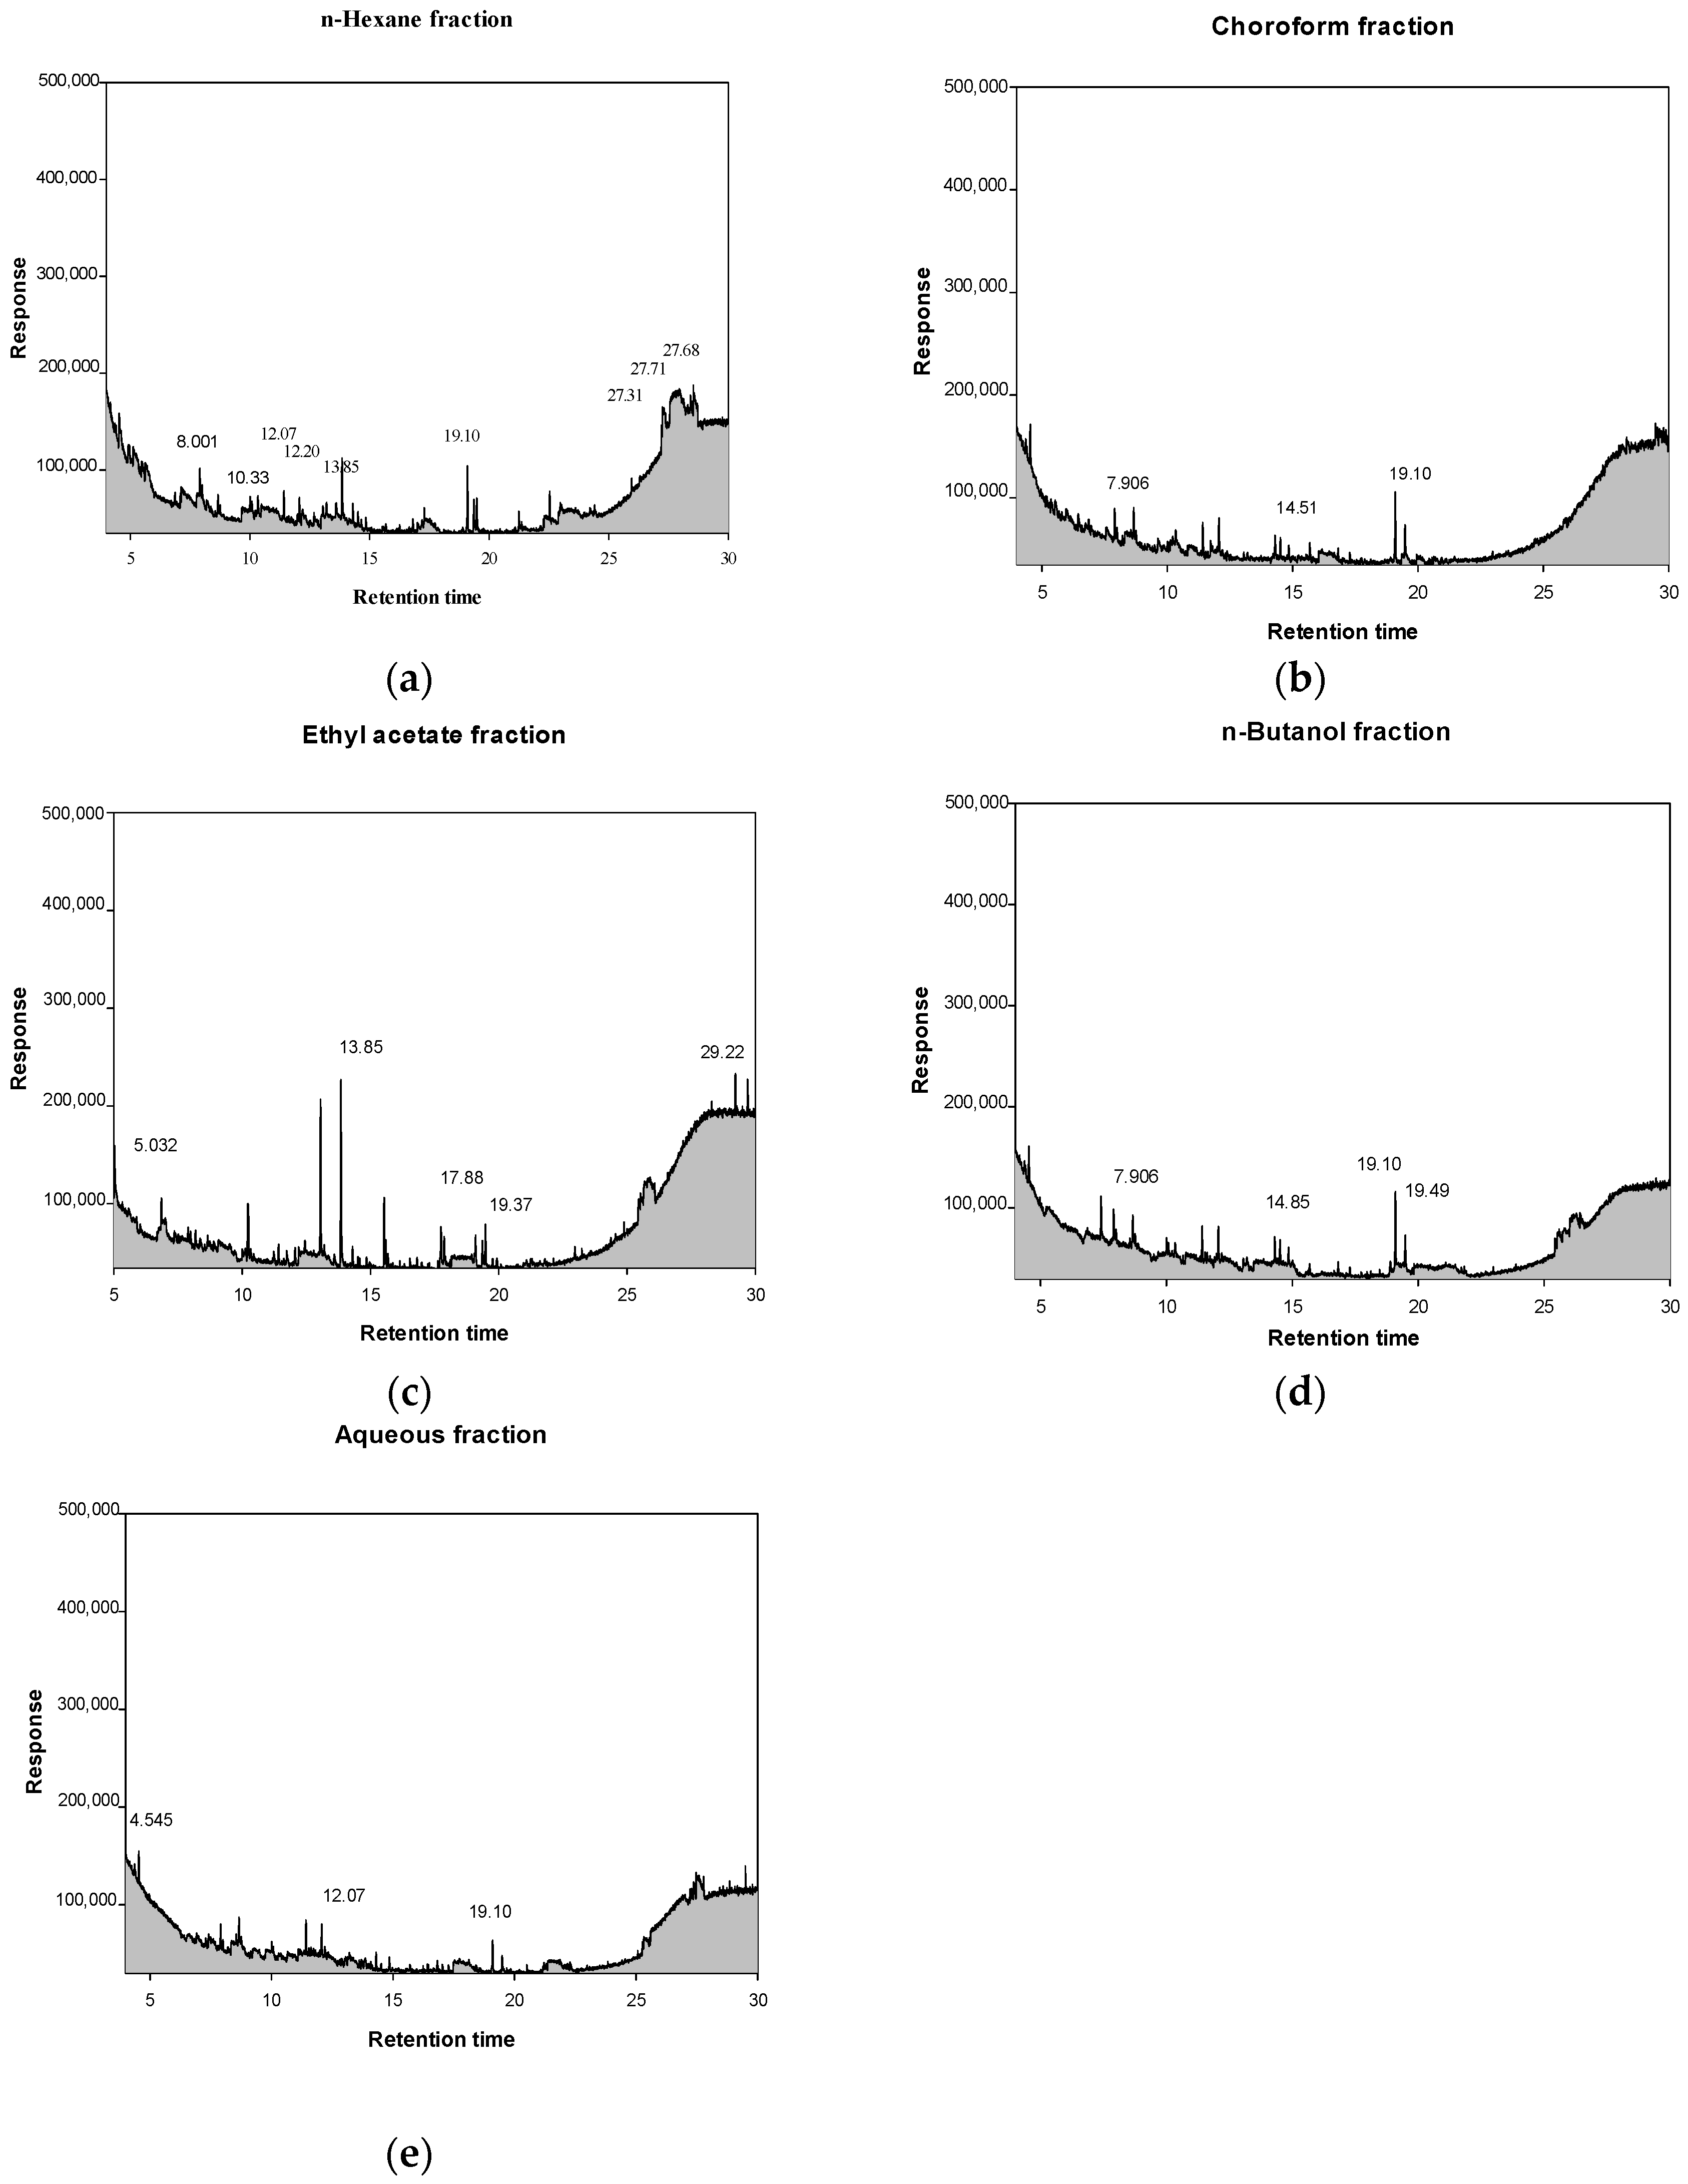
2.7. Comprehensive Gas Chromatography–Mass Spectrometry Detection GC–MSD Analysis of Solvent Fractions from P. cuspidatum
3. Discussion
4. Materials and Methods
4.1. Chemicals and Plant Material
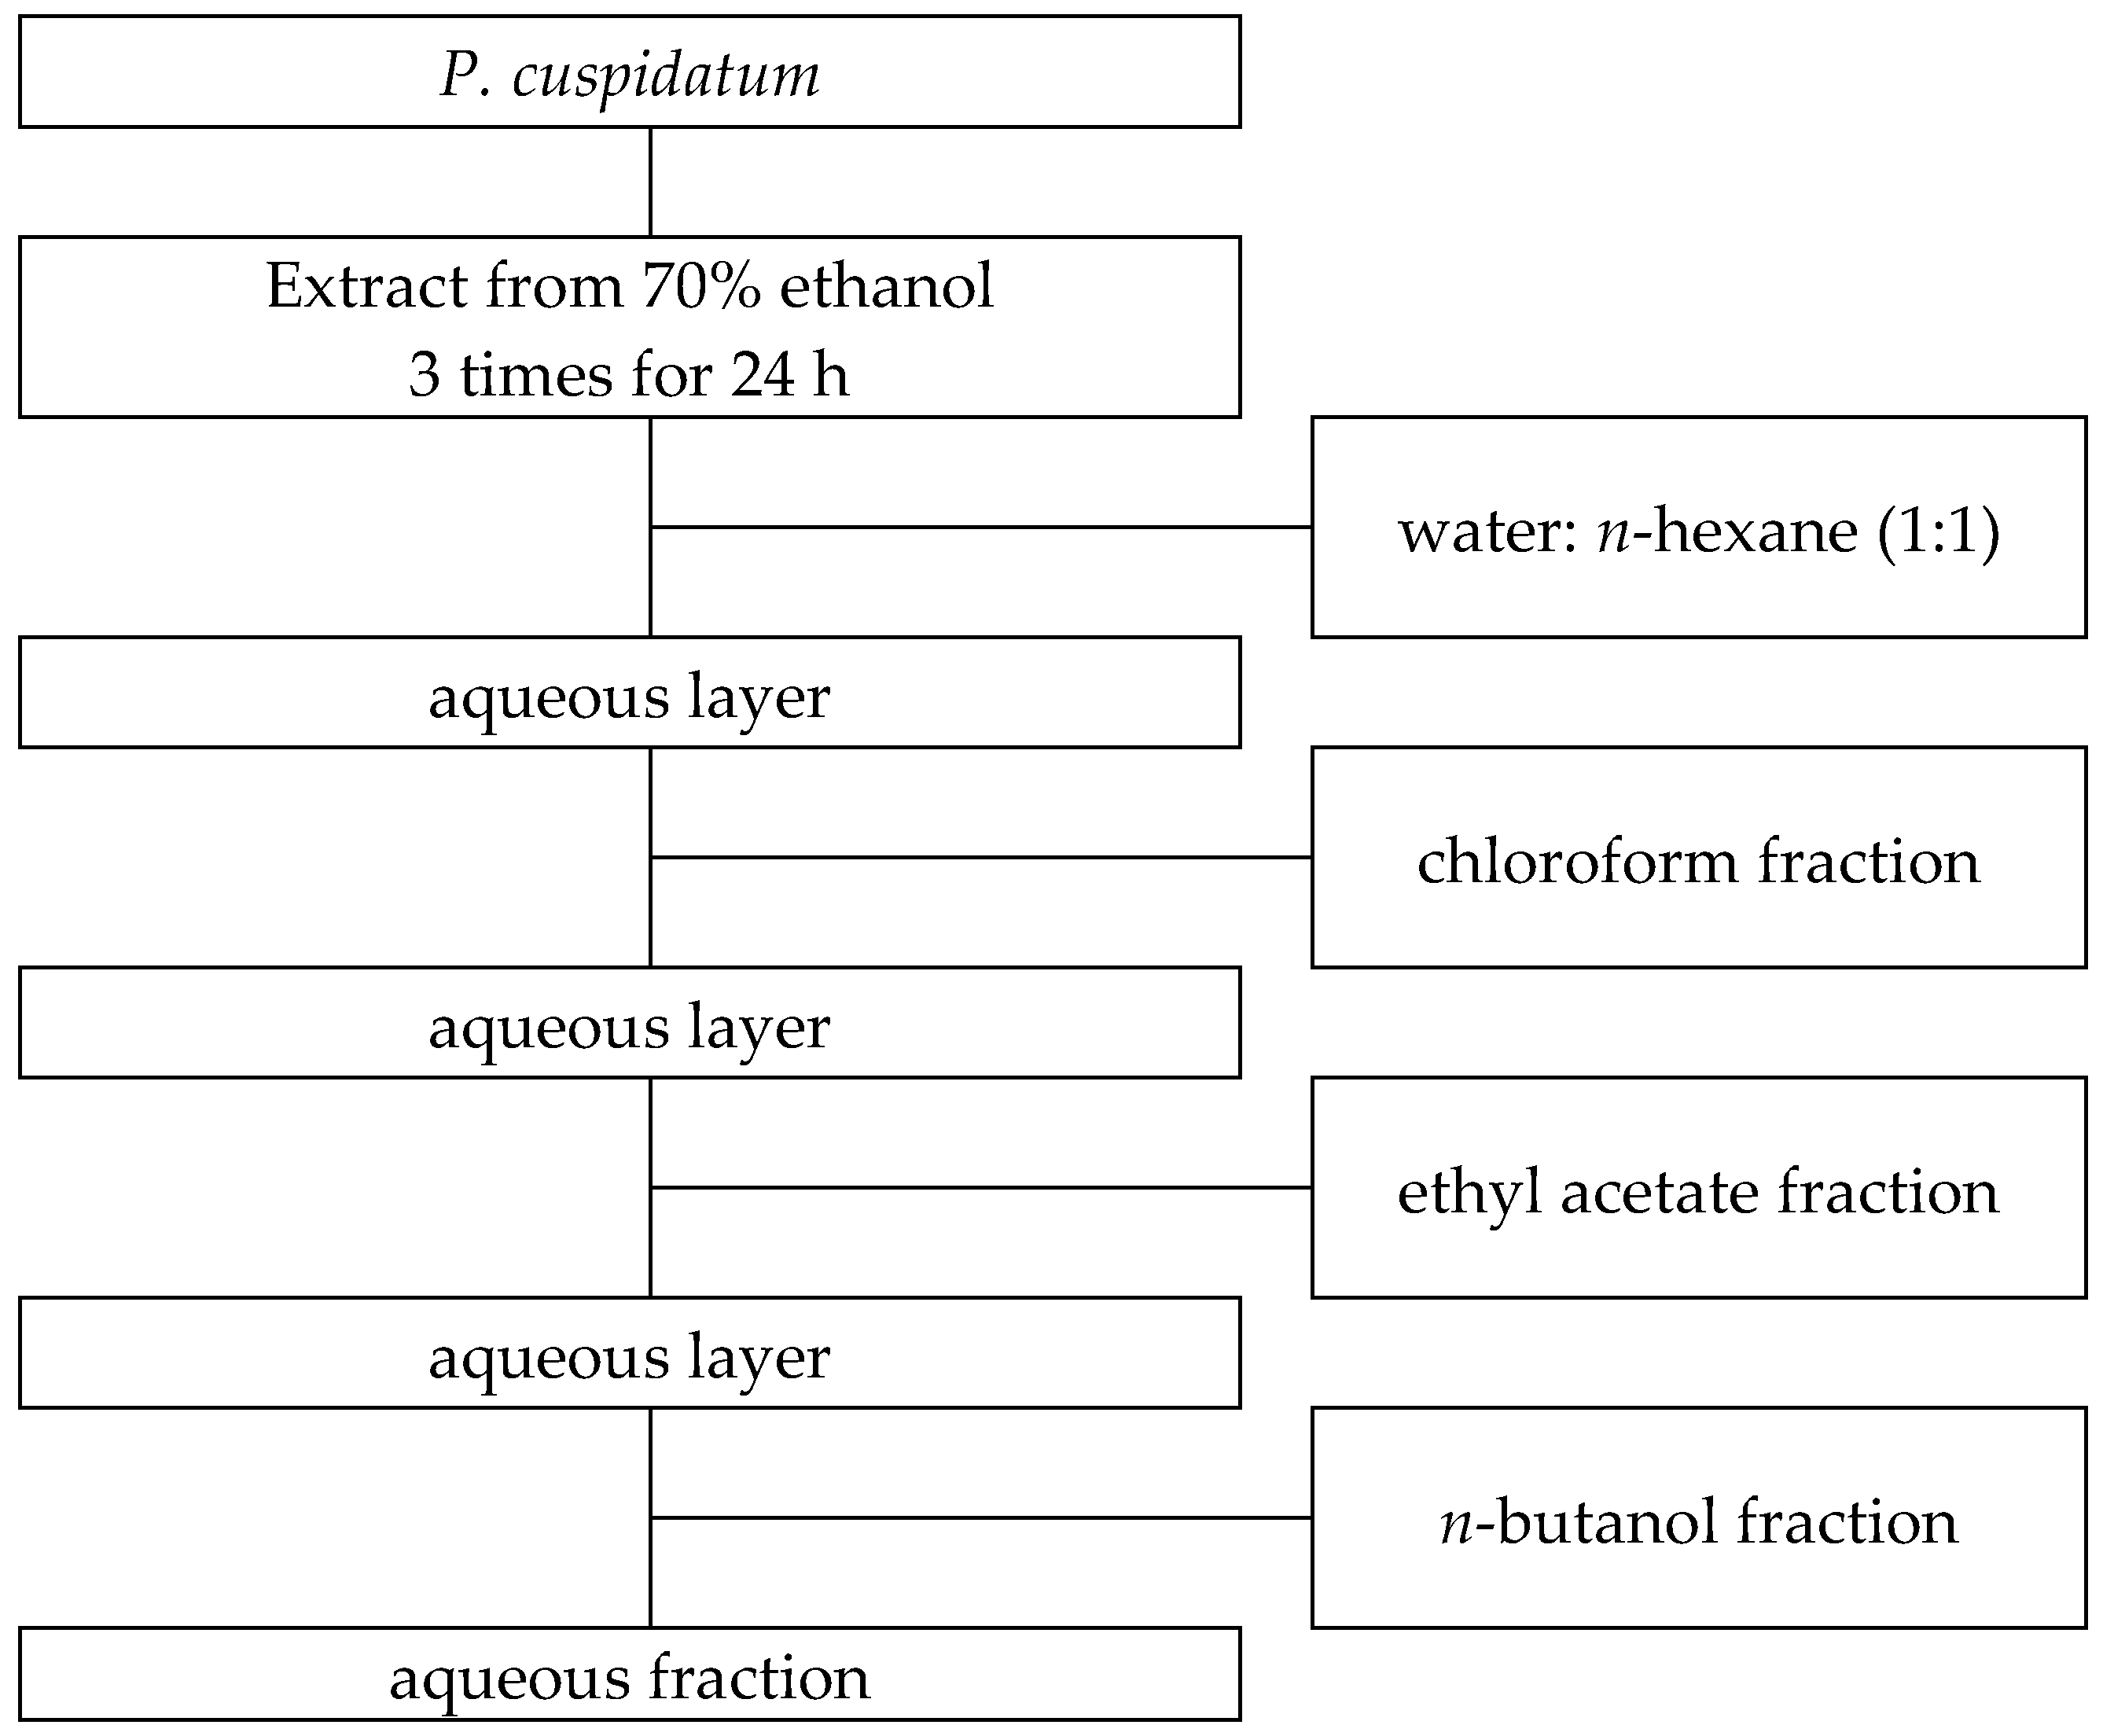
4.2. Extraction and Solvent Fractionation
4.3. Total Polyphenol and Flavonoid Contents of Solvent Fractions from P. cuspidatum
4.4. Antioxidant Activities (DPPH, ABTS Radical Scavenging Activity and Ferric Reducing Antioxidant Power (FRAP) Assay) of Solvent Fractions from P. cuspidatum
4.5. Tyrosinase and Elastase Inhibitory Activities of Solvent Fractions from P. cuspidatum
4.6. α-Glucosidase and Lipase Inhibitory Activities of Solvent Fractions from P. cuspidatum
4.7. Antibacterial Activities of Solvent Fractions from P. cuspidatum Broth Against Selected Microbial Strains
4.8. HPLC-PDA Quantification of Tannic Acid, and Emodin
4.9. HPLC-PDA Method Validation
4.9.1. Linearity, Sensitivity, and Precision
4.9.2. Accuracy and Specificity
4.10. GC–MSD Quantification of Solvent Fractions from P. cuspidatum
4.11. Statistical Analysis
5. Conclusions
Author Contributions
Funding
Institutional Review Board Statement
Informed Consent Statement
Data Availability Statement
Acknowledgments
Conflicts of Interest
References
- Hsu, C.Y.; Chan, Y.P. Antioxidant activity of extract from Polygonum. Biol. Res. 2007, 40, 13–21. [Google Scholar] [CrossRef]
- Shi, Y.; Zhang, T.; Wang, L.; Liu, X.; Li, H. Research progress on chemical constituents in roots and rhizomes of Polygonum cuspidatum and their pharmacological activities. Chin. Tradit. Herb. Drugs 2016, 47, 3055–3063. [Google Scholar]
- Kirino, A.; Nakahara, K.; Matsuura, M. Analysis and functionality of major polyphenolic components of Polygonum cuspidatum. J. Food Sci. Technol. 2012, 49, 99–105. [Google Scholar] [CrossRef] [PubMed]
- Peng, W.; Qin, R.; Li, X.; Zhou, H. Botany, phytochemistry, pharmacology, and potential application of Polygonum cuspidatum Sieb. et Zucc.: A review. J. Ethnopharmacol. 2013, 148, 729–745. [Google Scholar] [CrossRef]
- Quinty, V.; Morel, S.; Vallet, C.; Couteau, C.; Coiffard, L. Screening and evaluation of dermo-cosmetic activities of the invasive plant species Polygonum cuspidatum. Cosmetics 2022, 9, 83. [Google Scholar] [CrossRef]
- Fazary, A.E.; Ju, Y.H. Feruloyl esterases as biotechnological tools: Current and future perspectives. Acta Biochim. Biophys. Sin. 2007, 39, 811–828. [Google Scholar] [CrossRef]
- Wang, Y.; Zhao, L.; Cheng, X.; Ma, Y. Tissue-specific transcriptome analyses reveal candidate genes for stilbene, flavonoid and anthraquinone biosynthesis in the medicinal plant Polygonum cuspidatum. BMC Genom. 2021, 22, 353. [Google Scholar] [CrossRef]
- Jia, Y.; Liu, L.; Wu, X.; Zhao, W. Advances for pharmacological activities of Polygonum cuspidatum: A review. Phytother. Res. 2023, 37, 285–303. [Google Scholar]
- Sarma, A.D.; Mallick, A.R.; Ghosh, A.K. Free radicals and their role in different clinical conditions: An overview. Int. J. Pharma Sci. Res. 2010, 1, 185–192. [Google Scholar]
- Kim, Y.J.; Uyama, H.; Kobayashi, S. Autophagy induced by resveratrol suppresses α-MSH-induced melanogenesis. Biochem. Biophys. Res. Commun. 2014, 452, 161–167. [Google Scholar] [CrossRef]
- Li, H.; Zhang, Q.; Wang, C. Separation and purification of the main components from Polygonum cuspidatum and their anti-hyperuricemia effect. Chin. J. Nat. Med. 2021, 19, 641–649. [Google Scholar]
- Ito, Y. Golden rules and pitfalls in selecting optimum conditions for high-speed counter-current chromatography. J. Chromatogr. A 2005, 1065, 145–168. [Google Scholar] [CrossRef]
- Exarchou, V.; Godejohann, M.; van Beek, T.A.; Gerothanassis, I.P.; Vervoort, J. LC–UV–solid-phase extraction–NMR–MS combined with a cryogenic flow probe and its application to the identification of compounds present in Greek oregano. Anal. Chem. 2003, 75, 6288–6294. [Google Scholar] [CrossRef]
- Chua, L.S.; Lau, C.H.; Chew, C.Y.; Ismail, N.I.M. Solvent fractionation and acetone precipitation for crude saponins from Eurycoma longifolia extract. J. Appl. Res. Med. Aromat. Plants 2019, 12, 1416. [Google Scholar] [CrossRef]
- Sandoval-Acuña, C.; Ferreira, J.; Speisky, H. Polyphenols and mitochondria: An update on their increasingly emerging ROS-scavenging independent actions. Arch. Biochem. Biophys. 2014, 559, 75–90. [Google Scholar] [CrossRef] [PubMed]
- Agati, G.; Stefano, G.; Biricolti, S.; Tattini, M. Mesophyll distribution of antioxidant flavonoids in Ligustrum vulgare leaves under contrasting sunlight irradiance. Ann. Bot. 2009, 104, 853–861. [Google Scholar] [CrossRef] [PubMed]
- Gębalski, J.; Małkowska, M.; Wnorowska, S.; Gawenda-Kempczyńska, D.; Strzemski, M.; Wójciak, M.; Słomka, A.; Styczyński, J.; Załuski, D. Ethyl Acetate fraction from Eleutherococcus divaricatus root extract as a promising source of compounds with anti-hyaluronidase, anti-tyrosinase, and antioxidant activity but not anti-melanoma activity. Molecules 2024, 29, 3640. [Google Scholar] [CrossRef]
- Oh, D.Y.; Kim, H.S. Total flavonoid content and antioxidant activities of turmeric (Curcuma longa L.) extracts in Jindo, Korea. J. Environ. Sci. Int. 2019, 28, 393–401. [Google Scholar] [CrossRef]
- Brand-Williams, W.; Cuvelier, M.E.; Berset, C. Use of a Free radical method to evaluate antioxidant activity. LWT Food Sci. Technol. 1995, 28, 25–30. [Google Scholar] [CrossRef]
- Re, R.; Pellegrini, N.; Proteggente, A.; Pannala, A.; Yang, M.; Rice-Evans, C. Antioxidant activity applying an improved ABTS radical cation decolorization assay. Free Radic. Biol. Med. 1999, 26, 1231–1237. [Google Scholar] [CrossRef]
- Choi, J.S.; Kim, H.Y.; Seo, W.T.; Lee, J.H.; Cho, K.M. Roasting enhances antioxidant effect of bitter melon (Momordica charantia L.) increasing in flavan-3-ol and phenolic acid contents. Food Sci. Biotechnol. 2012, 21, 19–26. [Google Scholar] [CrossRef]
- Aydin, S.; Kadioğlu, G. Total phenolic content and antioxidant activity of Thymus vulgaris, Curcuma longa, propolis and their mixtures. J. Biol. Sci. 2022, 13, 13. [Google Scholar]
- Simunkova, M.; Barbierikova, Z.; Jomova, K.; Hudecova, L.; Lauro, P.; Alwasel, S.H.; Alhazza, I.; Rhodes, C.J.; Valko, M. Antioxidant vs. Prooxidant properties of the flavonoid, kaempferol, in the presence of Cu (II) Ions: A ROS-scavenging activity, fenton reaction and DNA damage study. Int. J. Mol. Sci. 2021, 22, 1619. [Google Scholar] [CrossRef]
- Sarma, P.; Kashyap, B.; Gurumayum, S.; Sarma, S.; Baruah, P.; Swargiary, D.; Saikia, A.; Deka, R.C.; Borah, J.C. Antihyperglycemic potential of quercetin-3-glucoside isolated from Leucaena leucocephala seedpods via the SIRT1/AMPK/GLUT4 signaling cascade. ACS Omega 2024, 9, 32429–32443. [Google Scholar] [CrossRef]
- Im, D.Y.; Lee, K.I. Tyrosinase inhibitory activity and melanin production inhibitory activity of the extract and fractions from Paeoniae Radix. Korean J. Pharmacogn. 2011, 42, 323–328. [Google Scholar]
- Wang, H.; Dong, Y.; Xiu, Z.L. Microwave-assisted aqueous two-phase extraction of piceid, resveratrol and emodin from Polygonum cuspidatum by ethanol/ammonium sulphate systems. Biotechnol. Lett. 2008, 30, 2079–2084. [Google Scholar] [CrossRef] [PubMed]
- Kim, Y.S.; Lee, E.B.; Yu, Y.J.; Kim, G.W.; Kim, W.J.; Choi, D.K. Ethyl acetate fraction from a Catalpa ovata G. Don extract inhibits α-MSH-induced melanogenesis through the cAMP/CREB pathway. Int. J. Mol. Sci. 2023, 25, 151. [Google Scholar] [CrossRef]
- Du, R.; Ye, L.; Chen, X.; Meng, Y.; Zhou, L.; Chen, Q.; Zheng, G.; Hu, J.; Shi, Z. Screening of key components for melanogenesis inhibition of Polygonum cuspidatum extract based on the spectrum–effect relationship and molecular docking. Molecules 2024, 29, 857. [Google Scholar] [CrossRef]
- Tundis, R.; Loizzo, M.R.; Menichini, F. Natural products as α-amylase and α-glucosidase inhibitors and their hypoglycaemic potential in the treatment of diabetes: An update. Mini Rev. Med. Chem. 2010, 10, 315–331. [Google Scholar] [CrossRef]
- Birari, R.B.; Bhutani, K.K. Pancreatic lipase inhibitors from natural sources: Unexplored potential. Drug Discov. Today 2007, 12, 879–889. [Google Scholar] [CrossRef]
- Kim, H.J.; Ha, S.C.; Park, S.W. Inhibition of tyrosinase and lipoxygenase activities by resveratrol and its derivatives from seeds of Paeonia lactiflora. Prev. Nutr. Food Sci. 2002, 7, 447–450. [Google Scholar] [CrossRef]
- Wang, R.; Fan, R.; Meng, T.; Wang, L. Exploration of the inhibitory mechanisms of trans-polydatin/resveratrol on α-glucosidase by multi-spectroscopic analysis, in silico docking and molecular dynamics simulation. Spectrochim. Acta A Mol. Biomol. Spectrosc. 2023, 299, 122866. [Google Scholar] [CrossRef]
- Chang, Y.X.; Ge, A.H.; Jiang, Y.; Azietaku, J.T.; Li, J.; Gao, X.-M. A bioactivity-based method for screening, identification of lipase inhibitors, and clarifying the effects of processing time on lipase inhibitory activity of Polygonum multiflorum. Evid. Based Complement. Altern. Med. 2016, 2016, 5965067. [Google Scholar] [CrossRef] [PubMed]
- Hintz, T.; Matthews, K.K.; Di, R. The use of plant antimicrobial compounds for food preservation. Biomed. Res. Int. 2015, 2015, 246264. [Google Scholar] [CrossRef]
- Lin, Y.T.; Labbe, R.G.; Shetty, K. Inhibition of Listeria monocytogenes in fish and meat systems by use of oregano and cranberry phytochemical synergies. Appl. Environ. Microbiol. 2004, 70, 5672–5678. [Google Scholar] [CrossRef]
- Qun, T.; Zhou, T.; Hao, J.; Wang, C.; Zhang, K.; Xu, J.; Wang, X.; Zhou, W. Antibacterial activities of anthraquinones: Structure–activity relationships and action mechanisms. RSC Med. Chem. 2023, 14, 1446–1471. [Google Scholar] [CrossRef]
- Alhumaid, S.; Al Mutair, A.; Alawi, Z.H.; Al-Omari, A. Antimicrobial susceptibility of gram-positive and gram-negative bacteria: A 5-year retrospective analysis at a multi-hospital healthcare system in Saudi Arabia. Antimicrob. Resist. Infect. Control 2021, 10, 36. [Google Scholar] [CrossRef]
- Lima, S.L.; Colombo, A.L.; de Almeida Júnior, J.N. Fungal cell wall: Emerging antifungals and drug resistance. Front. Microbiol 2019, 10, 2573. [Google Scholar] [CrossRef]
- Subramanian, M.; Goswami, M.; Chakraborty, S.; Jawali, N. Resveratrol induced inhibition of Escherichia coli proceeds via membrane oxidation and independent of diffusible reactive oxygen species generation. Redox Biol. 2014, 2, 865–872. [Google Scholar] [CrossRef]
- Deogratias, G.; Shadrack, D.M.; Munissi, J.J.E.; Kinunda, G.A.; Jacob, F.; Mtei, R.P.; Masalu, R.J.; Mwakyula, I.; Kiruri, L.W.; Nyandoro, S.S. Hydrophobic π-π stacking interactions and hydrogen bonds drive self-aggregation of luteolin in water. J. Mol. Graph. Model. 2022, 116, 108243. [Google Scholar] [CrossRef]
- Wu, Y.C.; Wu, P.; Li, Y.B.; Liu, T.C.; Zhang, L.; Zhou, Y.H. Natural deep eutectic solvents as new green solvents to extract anthraquinones from Rheum palmatum L. RSC Adv. 2018, 8, 15069–15077. [Google Scholar] [CrossRef] [PubMed]
- Folin, O.; Denis, W. On phosphotungstic-phosphomolybdic compounds as color reagents. J. Biol. Chem. 1912, 12, 239–243. [Google Scholar] [CrossRef]
- Jia, Z.S.; Tang, M.C.; Wu, J.M. The determination of flavonoid contents in mulberry and their scavenging effects on superoxide radicals. Food Chem. 1999, 64, 555–559. [Google Scholar] [CrossRef]
- Blois, M.S. Antioxidant determinations by the use of a stable free radical. Nature 1958, 181, 1199–1200. [Google Scholar] [CrossRef]
- Jeong, S.J.; Kim, K.H.; Yook, H.S. Whitening and antioxidant activities of solvent extracts from hot-air dried Allium hookeri. J. Korean Soc. Food Sci. Nutr. 2015, 44, 832–839. [Google Scholar] [CrossRef]
- Pellegrini, N.; Re, R.; Yang, M.; Rice-Evans, C. Screening of dietary carotenoids and carotenoid-rich fruit extracts for antioxidant activities applying 2,2′-azinobis (3-ethylbenzothiazoline-6-sulfonic acid) radical cation decolorization assay. Methods Enzymol. 1999, 299, 379–389. [Google Scholar]
- Kim, K.H.; Kim, H.J.; Byun, M.W.; Yook, H.S. Antioxidant and antimicrobial activities of ethanol extract from six vegetables containing different sulfur compounds. J. Korean Soc. Food Sci. Nutr. 2012, 41, 577–583. [Google Scholar] [CrossRef]
- Benzie, I.F.F.; Strain, J.J. The ferric reducing ability of plasma (FRAP) as a measure of “antioxidant power”: The FRAP assay. Anal. Biochem. 1996, 239, 70–76. [Google Scholar] [CrossRef]
- Choi, M.H.; Kim, K.H.; Yook, H.S. Antioxidant activity of fermented Kaempferia parviflora and inhibitory action against tyrosinase and elastase. J. Korean Soc. Food Sci. Nutr. 2018, 47, 1076–1084. [Google Scholar] [CrossRef]
- Eom, S.H.; Lee, S.H.; Yoon, N.Y.; Jung, W.K.; Jeon, Y.J.; Kim, S.K.; Lee, M.S.; Kim, Y.M. α-Glucosidase and α-amylase inhibitory activities of phlorotannins from Eisenia bicyclis. J. Sci. Food Agric. 2012, 92, 2084–2090. [Google Scholar] [CrossRef]
- Kim, J.H.; Kim, H.J.; Park, H.W.; Youn, S.H.; Choi, D.Y.; Shin, C.S. Development of inhibitors against lipase and α-glucosidase from derivatives of Monascus pigment. FEMS Microbiol. Lett. 2007, 276, 93–98. [Google Scholar] [CrossRef] [PubMed]
- Joshi, S.C.; Verma, A.R.; Mathela, C.S. Antioxidant and antibacterial activities of the leaf essential oils of Himalayan Lauraceae species. Food Chem Toxicol. 2010, 48, 37–40. [Google Scholar] [CrossRef]

| Solvent | Total Polyphenol Content (g GAE/g) 1 | Total Flavonoid Content (g QE/g) 2 |
|---|---|---|
| n-hexane fraction | 0.12 ± 0.00 c34 | 0.08 ± 0.00 c34 |
| chloroform fraction | 0.37 ± 0.01 b | 0.09 ± 0.00 c |
| ethyl acetate fraction | 0.53 ± 0.01 a | 0.19 ± 0.02 a |
| n-butanol fraction | 0.36 ± 0.02 b | 0.14 ± 0.01 b |
| aqueous fraction | 0.10 ± 0.01 d | 0.04 ± 0.00 d |
| Solvent | DPPH Radical Scavenging Activity IC50 (mg/mL) 1 | ABTS Radical Scavenging Activity IC50 (mg/mL) 1 | FRAP Value (mM Fe2+/mg) |
|---|---|---|---|
| n-hexane fraction | 0.25 ± 0.20 a23 | 0.64 ± 0.19 a23 | 0.22 ± 0.05 d23 |
| chloroform fraction | 0.07 ± 0.00 c | 0.14 ± 0.00 c | 1.84 ± 0.14 c |
| ethyl acetate fraction | 0.01 ± 0.00 d | 0.06 ± 0.00 d | 6.02 ± 0.30 a |
| n-butanol fraction | 0.02 ± 0.00 d | 0.13 ± 0.00 c | 2.95 ± 0.57 b |
| aqueous fraction | 0.10 ± 0.01 b | 0.51 ± 0.00 b | 0.32 ± 0.02 d |
| L-ascorbic acid | 0.01 ± 0.00 d | 0.06 ± 0.00 d | - |
| Solvent | Tyrosinase Inhibitory Activity (%) | Elastase Inhibitory Activity (%) |
|---|---|---|
| n-hexane fraction | 59.93 ± 1.95 c14 | 68.69 ± 1.31 bc14 |
| chloroform fraction | 53.60 ± 1.61 d | 64.65 ± 1.50 c |
| ethyl acetate fraction | 67.78 ± 2.50 a | 83.84 ± 1.64 a |
| n-butanol fraction | 61.64 ± 0.65 b | 74.75 ± 1.74 b |
| aqueous fraction | 56.31 ± 0.86 cd | 72.73 ± 0.60 bc |
| standard | 69.26 ± 0.10 e2 | 63.64 ± 0.59 c3 |
| Solvent | α-Glucosidase Inhibitory Activity (%) | Lipase Inhibitory Activity (%) |
|---|---|---|
| n-hexane fraction | 5.560 ± 0.59 d14 | 85.93 ± 1.00 b14 |
| chloroform fraction | 12.87 ± 0.15 c | 78.78 ± 2.16 c |
| ethyl acetate fraction | 65.14 ± 0.29 a | 85.79 ± 0.61 b |
| n-butanol fraction | 35.87 ± 0.56 b | 84.35 ± 0.77 b |
| aqueous fraction | 6.460 ± 0.40 d | 79.99 ± 0.70 c |
| standard | 34.83 ± 0.31 b2 | 98.18 ± 0.18 a3 |
| Microorganism | Solvent | 5 mg/disc | 10 mg/disc |
|---|---|---|---|
| Staphylococcus aureus | n-hexane fraction | 10.0 1 | 12.0 |
| chloroform fraction | - 2 | - | |
| ethyl acetate fraction | 17.0 | 19.5 | |
| n-butanol fraction | - | 10.0 | |
| aqueous fraction | 9.50 | 12.5 | |
| Escherichia coli | n-hexane fraction | - | - |
| chloroform fraction | - | - | |
| ethyl acetate fraction | - | 10.0 | |
| n-butanol fraction | - | - | |
| aqueous fraction | - | - | |
| Pseudomonas aeruginosa | n-hexane fraction | - | - |
| chloroform fraction | - | - | |
| ethyl acetate fraction | - | 10.0 | |
| n-butanol fraction | - | - | |
| aqueous fraction | - | - |
| Microorganism | n-Hexane Fraction | Chloroform Fraction | Ethyl Acetate Fraction | n-Butanol Fraction | Aqueous Fraction |
|---|---|---|---|---|---|
| Staphylococcus aureus | 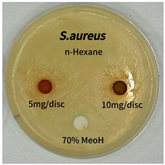 | 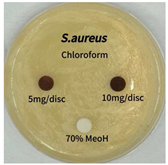 | 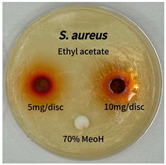 |  | 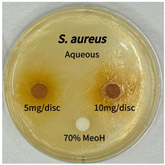 |
| Escherichia coli | 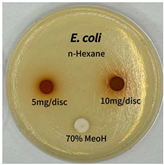 | 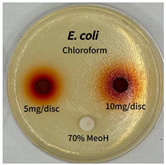 | 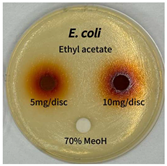 |  | 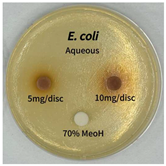 |
| Pseudomonas aeruginosa | 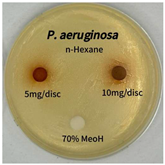 | 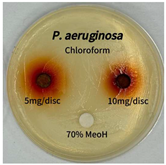 | 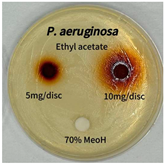 | 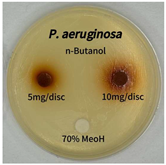 |  |
| Parameter | Tannic Acid | Emodin |
|---|---|---|
| λ 1 (nm) | 270 | 254 |
| tR 2 (min) | 1.72 | 7.96 |
| RSD 3 (%) | 0.01 | 0.01 |
| Linear range (ppm) | 25–500 | 25–500 |
| Regression equation 4 | Y = 30.43845X − 550.88152 | Y = 3.94432X + 33.84235 |
| r 2 5 | 0.9999 | 0.9995 |
| LOD (ppm) | 9.24 | 1.82 |
| LOQ (ppm) | 27.94 | 5.81 |
| Compound | Conc. 1 (ppm) | Analysis type | Measured Conc. 2 (ppm) | RSD 3 (%) | Accuracy 4 (%) | RSD (%) |
|---|---|---|---|---|---|---|
| Tannic acid | 25 | Intra-day (n = 3) | 27.53 | 0.03 | 81.78 | 0.01 |
| 50 | 45.45 | 0.02 | 97.60 | 0.03 | ||
| 75 | 73.80 | 0.03 | 103.5 | 0.04 | ||
| 25 | Inter-day (n = 3) | 29.14 | 0.01 | 91.82 | 0.02 | |
| 50 | 47.96 | 0.01 | 94.59 | 0.01 | ||
| 75 | 72.30 | 0.00 | 102.2 | 0.00 | ||
| Emodin | 25 | Intra-day (n = 3) | 23.23 | 0.38 | 99.19 | 0.57 |
| 50 | 49.80 | 0.29 | 106.3 | 0.23 | ||
| 75 | 78.14 | 0.16 | 101.0 | 0.18 | ||
| 25 | Inter-day (n = 3) | 24.17 | 0.05 | 102.0 | 0.09 | |
| 50 | 50.49 | 0.05 | 109.8 | 0.06 | ||
| 75 | 79.88 | 0.09 | 107.4 | 0.11 |
| Solvent | Tannic Acid (mg/g) | Emodin (mg/g) |
|---|---|---|
| n-hexane fraction | 0.028 ± 0.002 d12 | 0.028 ± 0.002 d |
| chloroform fraction | 0.105 ± 0.005 b | 0.105 ± 0.005 b |
| ethyl acetate fraction | 0.272 ± 0.004 a | 0.272 ± 0.004 a |
| n-butanol fraction | 0.044 ± 0.002 c | 0.044 ± 0.002 c |
| aqueous fraction | - 3 | - |
| Compound | tR 1 (min) | Chemical Class | Major Compounds (Relative Abundance, %) | Reported Biological Activity |
|---|---|---|---|---|
| n-hexane fraction | 8.001 | Flavonoids | 1-Benzopyrylium, 3,7-dihydroxy-2-(4-hydroxyphenyl) (2.52%) | Antibacterial |
| 10.33 | Biogenic amines | Histamine dihydrochloride (1.39%) | Antioxidant | |
| 12.07 | Nucleotide intermediates | 1H-Imidazole-4-carboxamide, 5-amino(AICAR) (1.60%) | Anti-inflammatory, Antioxidant | |
| 12.20 | Nitrogen heterocycles | 1,10-phenanthrolinium chloride (1.45%) | Antioxidant, Antibacterial | |
| 13.85 | Phthalate esters | 1,2-benzene-dicarboxylic acid, dimethyl ester (3.71%) | Antioxidant | |
| 19.10 | Spirocyclic diketones | 7,9-Di-tert-butyl-1-oxaspiro (4,5) deca-6,9-diene-2,8-dione (3.40%) | Antioxidant | |
| 27.31 | Organoarsenic compounds | Arsenous acid, tris(trimethylsilyl) ester (9.57%) | Antidiabetic | |
| 27.68 | Organosilicon compounds | methyltris(trimethylsiloxy)silane (11.94%) | Antibacterial | |
| 27.71 | Cyclic siloxanes | Cyclotrisiloxane, hexamethy (3.91%) | Antioxidant, Antibacterial | |
| chloroform fraction | 7.906 | Biogenic amines | Histamine dihydrochloride (5.54%) | Antioxidant |
| 14.51 | Phenolic antioxidants | 2,4-Di-tert-butylphenol (3.72%) | Antibacterial, Anti-inflammatory | |
| 19.10 | Spirocyclic diketones | 7,9-Di-tert-butyl-1-oxaspiro (4,5) deca-6,9-diene-2,8-dione (14.17%) | Antioxidant | |
| ethyl acetate fraction | 5.032 | Flavonoids | 1-Benzopyrylium, 3,7-dihydroxy-2-(4-hydroxyphenyl) (7.79%) | Antibacterial |
| 13.85 | Biogenic amines | Histamine dihydrochloride (20.76%) | Antioxidant | |
| 17.88 | Nucleotide intermediates | 1H-Imidazole-4-carboxamide, 5-amino(AICAR) (3.49%) | Anti-inflammatory, Antioxidant | |
| 19.37 | Nitrogen heterocycles | 1,10-phenanthrolinium chloride (3.61%) | Antioxidant, Antibacterial | |
| 29.22 | Phthalate esters | 1,2-benzene-dicarboxylic acid, dimethyl ester (2.99%) | Antioxidant | |
| n-butanol fraction | 7.906 | Biogenic amines | Histamine dihydrochloride (7.81%) | Antioxidant |
| 14.85 | Nucleotide intermediates | 1H-Imidazole-4-carboxamide, 5-amino(AICAR) (4.30%) | Anti-inflammatory, Antioxidant | |
| 19.10 | Quinones | 2,5-di-tert-butyl-1,4-benzoquinone (DTBBQ) (19.10%) | Antioxidant, Antibacterial | |
| 19.49 | Phthalate esters | Dibutyl phthalate (19.49%) | Antibacterial | |
| aqueous fraction | 4.545 | Nitrogen heterocycles | 1,10-phenanthrolinium chloride (13.70%) | Antioxidant, Antibacterial |
| 12.07 | Biogenic amines | Histamine dihydrochloride (13.96%) | Antioxidant | |
| 19.10 | Flavonoids | 1-Benzopyrylium, 3,7-dihydroxy-2-(4-hydroxyphenyl) (17.68%) | Antibacterial |
| Solvent | Yield (%, w/w 1) |
|---|---|
| n-hexane fraction | 3.03 |
| chloroform fraction | 9.61 |
| ethyl acetate fraction | 24.5 |
| n-butanol fraction | 8.59 |
| aqueous fraction | 32.8 |
| Microorganism | Media 1 | Temperature (°C) | |
|---|---|---|---|
| Staphylococcus aureus | NA/NB | 30 | |
| Escherichia coli | NA/NB | 30 | |
| Pseudomonas aeruginosa | NA/NB | 37 | |
Disclaimer/Publisher’s Note: The statements, opinions and data contained in all publications are solely those of the individual author(s) and contributor(s) and not of MDPI and/or the editor(s). MDPI and/or the editor(s) disclaim responsibility for any injury to people or property resulting from any ideas, methods, instructions or products referred to in the content. |
© 2025 by the authors. Licensee MDPI, Basel, Switzerland. This article is an open access article distributed under the terms and conditions of the Creative Commons Attribution (CC BY) license (https://creativecommons.org/licenses/by/4.0/).
Share and Cite
Cheng, Y.; Kang, Y.; Kim, W. Solvent Fractionation of Polygonum cuspidatum Sieb. et Zucc. for Antioxidant, Biological Activity, and Chromatographic Characterization. Int. J. Mol. Sci. 2025, 26, 7011. https://doi.org/10.3390/ijms26147011
Cheng Y, Kang Y, Kim W. Solvent Fractionation of Polygonum cuspidatum Sieb. et Zucc. for Antioxidant, Biological Activity, and Chromatographic Characterization. International Journal of Molecular Sciences. 2025; 26(14):7011. https://doi.org/10.3390/ijms26147011
Chicago/Turabian StyleCheng, Yuchen, Yuri Kang, and Woonjung Kim. 2025. "Solvent Fractionation of Polygonum cuspidatum Sieb. et Zucc. for Antioxidant, Biological Activity, and Chromatographic Characterization" International Journal of Molecular Sciences 26, no. 14: 7011. https://doi.org/10.3390/ijms26147011
APA StyleCheng, Y., Kang, Y., & Kim, W. (2025). Solvent Fractionation of Polygonum cuspidatum Sieb. et Zucc. for Antioxidant, Biological Activity, and Chromatographic Characterization. International Journal of Molecular Sciences, 26(14), 7011. https://doi.org/10.3390/ijms26147011