
Automated Workflow for High-Throughput LC–MS/MS Therapeutic Monitoring of Cannabidiol and 7-Hydroxy-cannabidiol in Patients with Epilepsy

 , ,
, ,  ,
,  ,
,  , , , , ,
Abstract
1. Introduction
2. Results
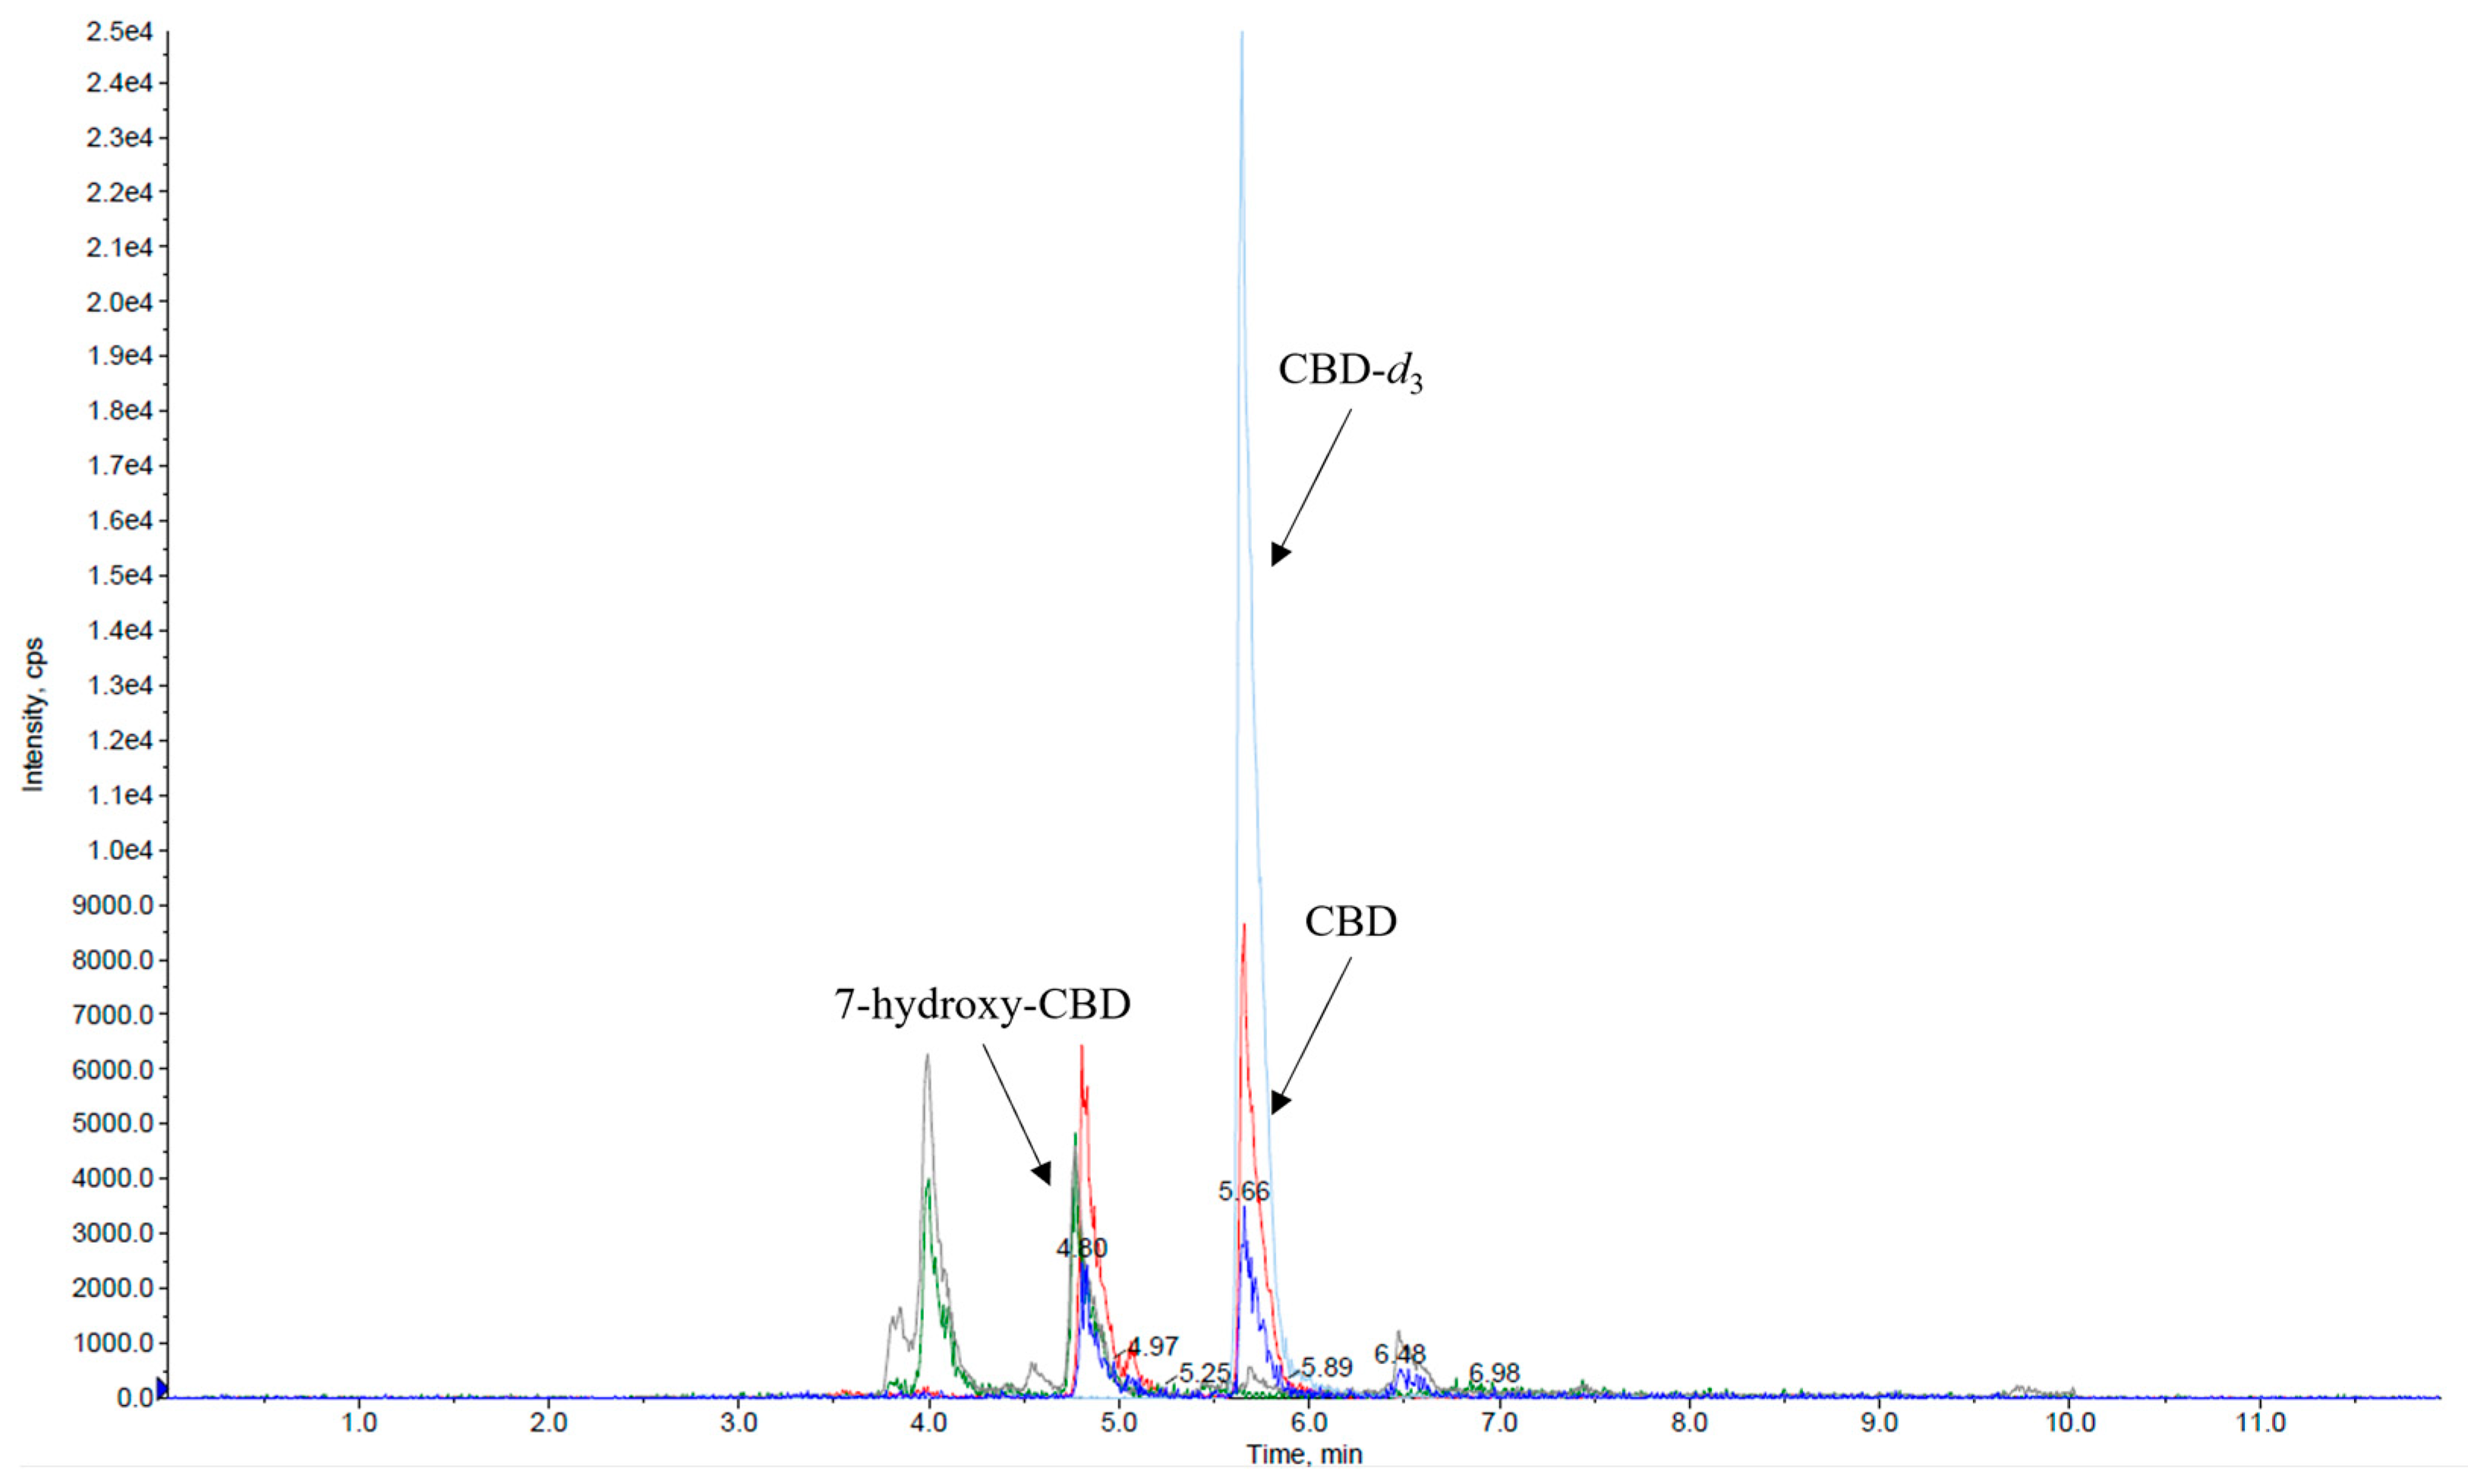
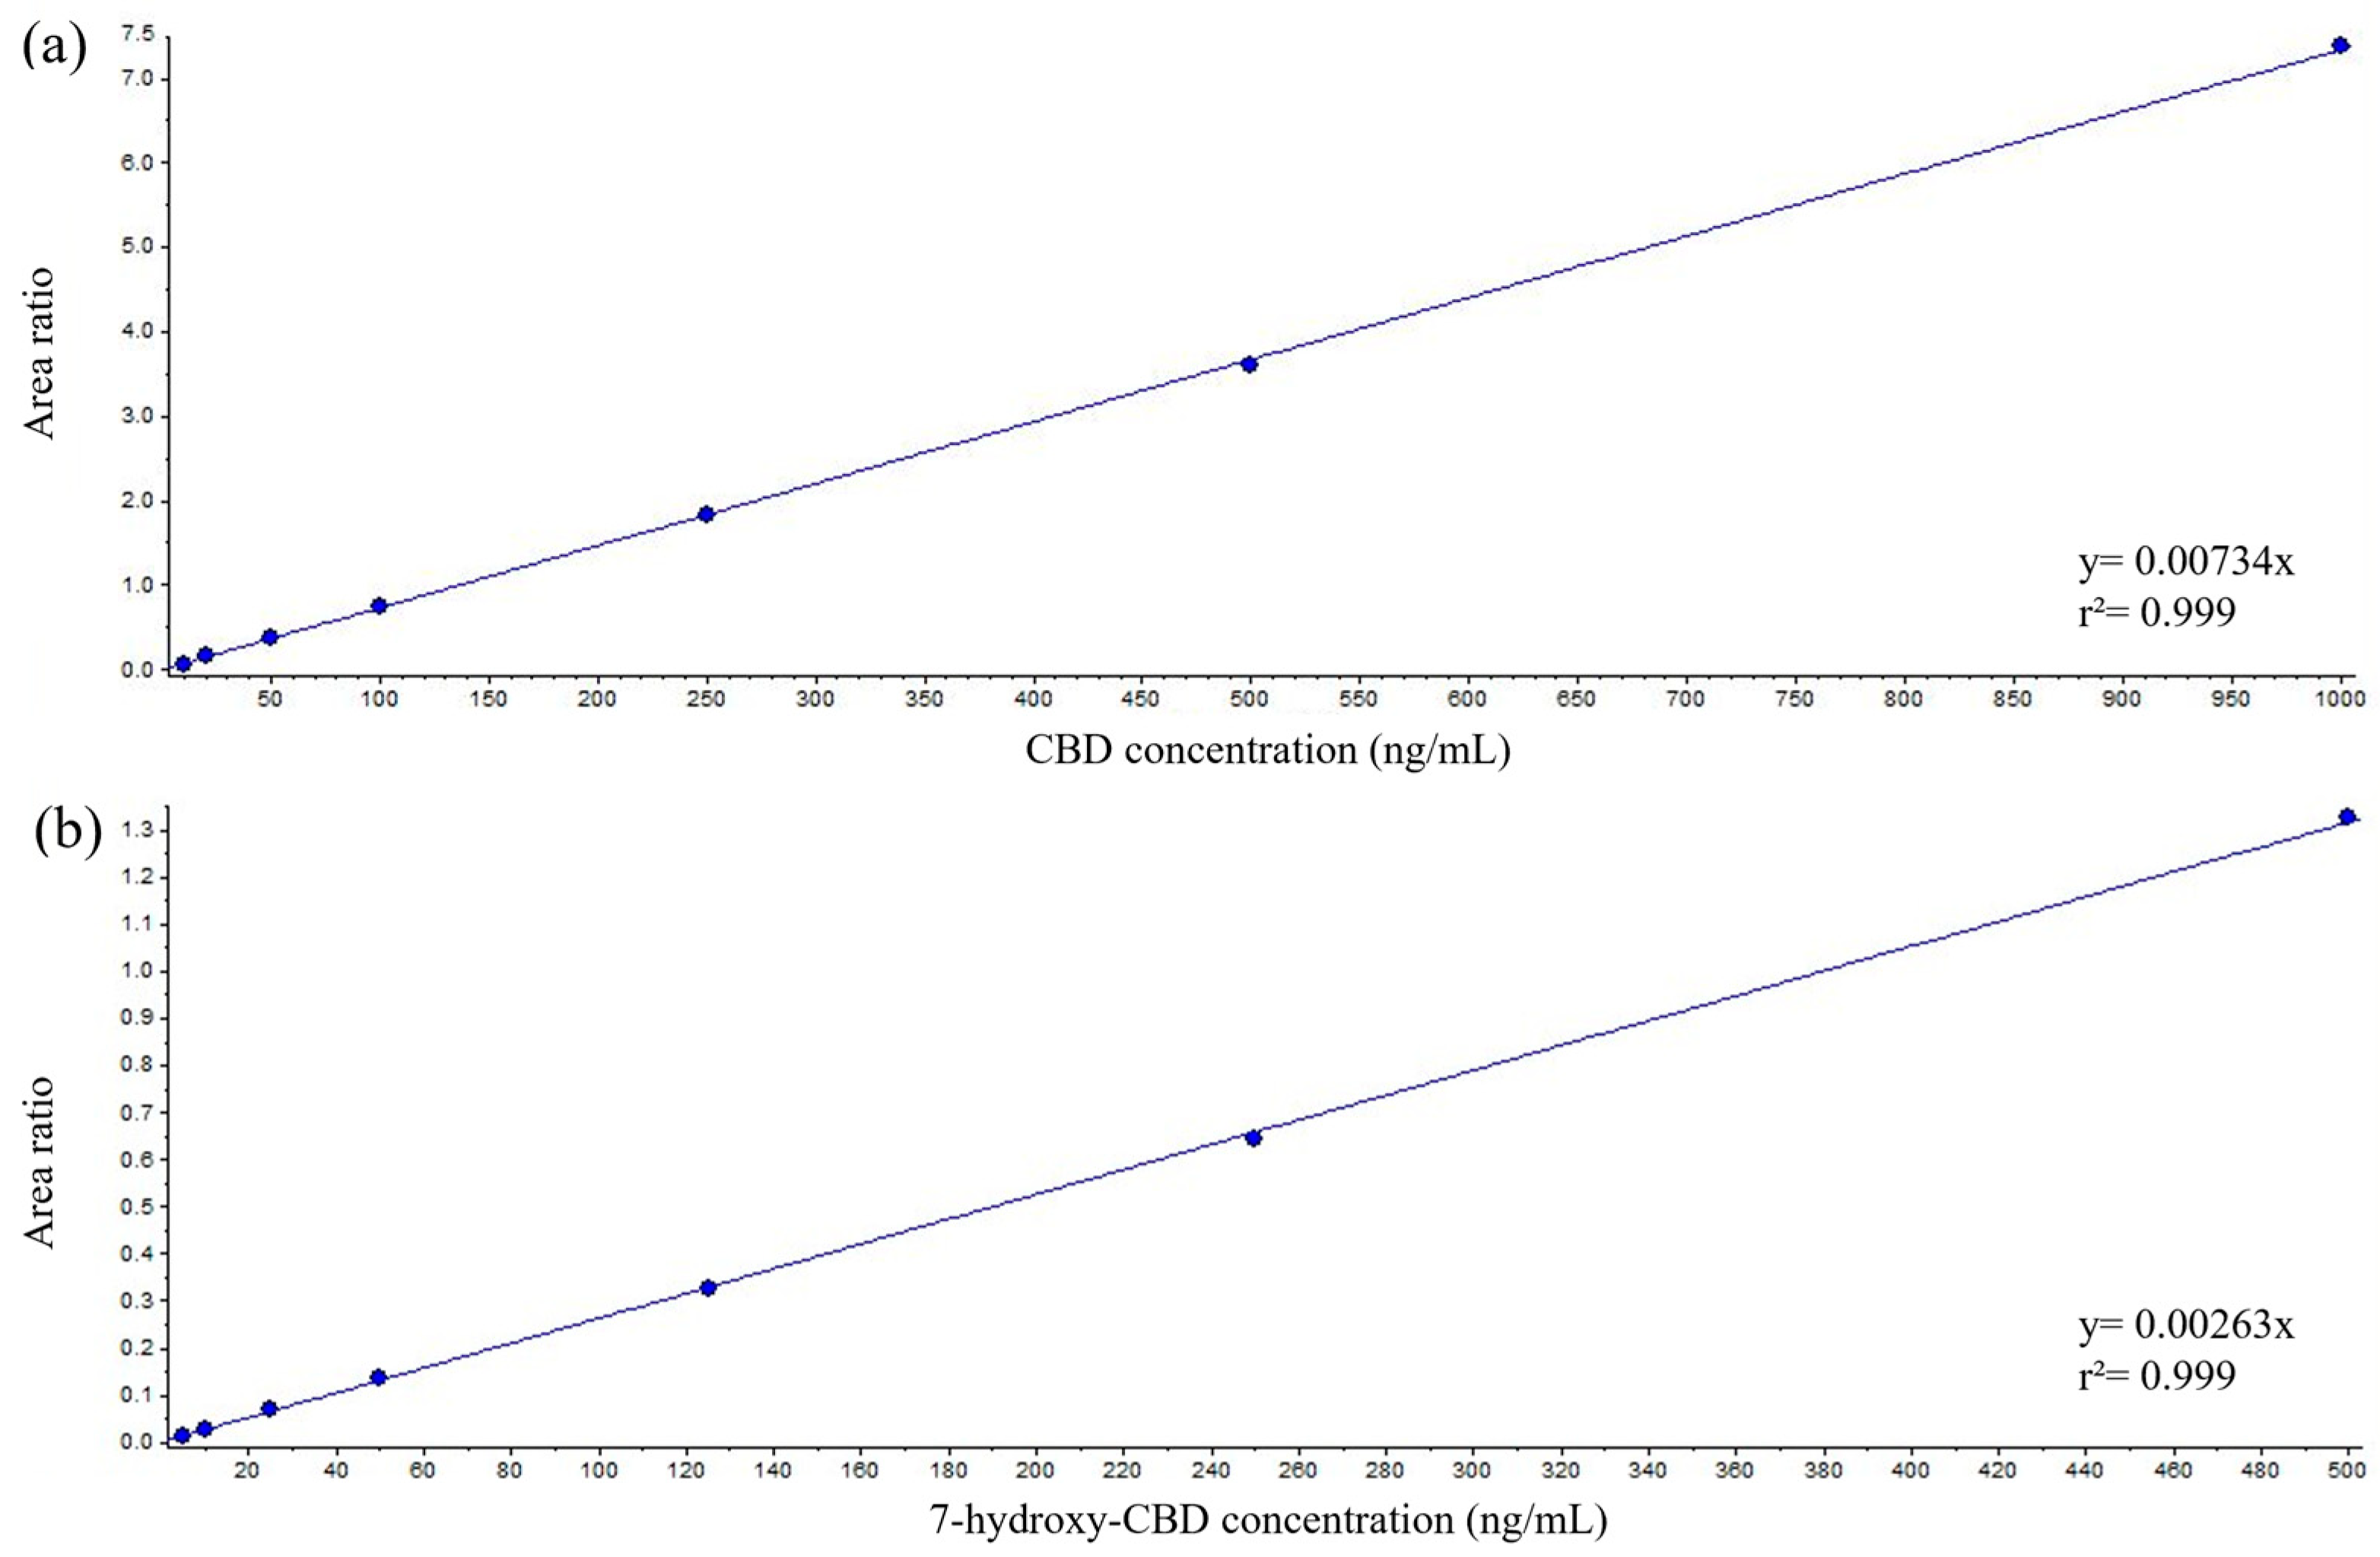
2.1. Manual Method

| Spiked Concentrations (ng/mL) | Measured (ng/mL) | Precision (%) | Accuracy (%) | Spiked Concentrations (ng/mL) | Measured (ng/mL) | Precision (%) | Accuracy (%) |
|---|---|---|---|---|---|---|---|
| Serum CBD | Intraday | Serum CBD | Interday | ||||
| 2.5 (LOQ) (n = 5) | 2.8 ± 0.1 | 4.5 | 111.8 | 2.5 (LOQ) (n = 10) | 2.8 ± 0.2 | 6.3 | 110.5 |
| 35 (QC1) (n = 5) | 35.3 ± 1 | 2.7 | 100.8 | 35 (QC1) (n = 20) | 34.2 ± 2.3 | 6.6 | 97.8 |
| 350 (QC2) (n = 5) | 327.6 ± 18.4 | 5.6 | 93.6 | 350 (QC2) (n = 20) | 336.4 ± 21 | 6.2 | 96.1 |
| 750 (QC3) (n = 5) | 693.6 ± 7 | 1 | 92.5 | 750 (QC3) (n = 20) | 735.2 ± 41.2 | 5.6 | 98 |
| Spiked Concentrations (ng/mL) | Measured (ng/mL) | Precision (%) | Accuracy (%) | Spiked Concentrations (ng/mL) | Measured (ng/mL) | Precision (%) | Accuracy (%) |
|---|---|---|---|---|---|---|---|
| Serum 7-Hydroxy-CBD | Intraday | Serum 7-Hydroxy-CBD | Interday | ||||
| 5 (LOQ) (n = 5) | 4.8 ± 0.3 | 6.5 | 95.4 | 5 (LOQ) (n = 10) | 4.6 ± 0.4 | 7.8 | 92.7 |
| 17.5 (QC1) (n = 5) | 18.4 ± 0.4 | 2 | 105.1 | 17.5 (QC1) (n = 20) | 17.5 ± 1.4 | 7.9 | 100.1 |
| 175 (QC2) (n = 5) | 164.8 ± 4.2 | 2.6 | 94.2 | 175 (QC2) (n = 20) | 165.4 ± 11.9 | 7.2 | 94.5 |
| 375 (QC3) (n = 5) | 354 ± 4.7 | 1.3 | 94.4 | 375 (QC3) (n = 20) | 360.6 ± 24.5 | 6.8 | 96.1 |
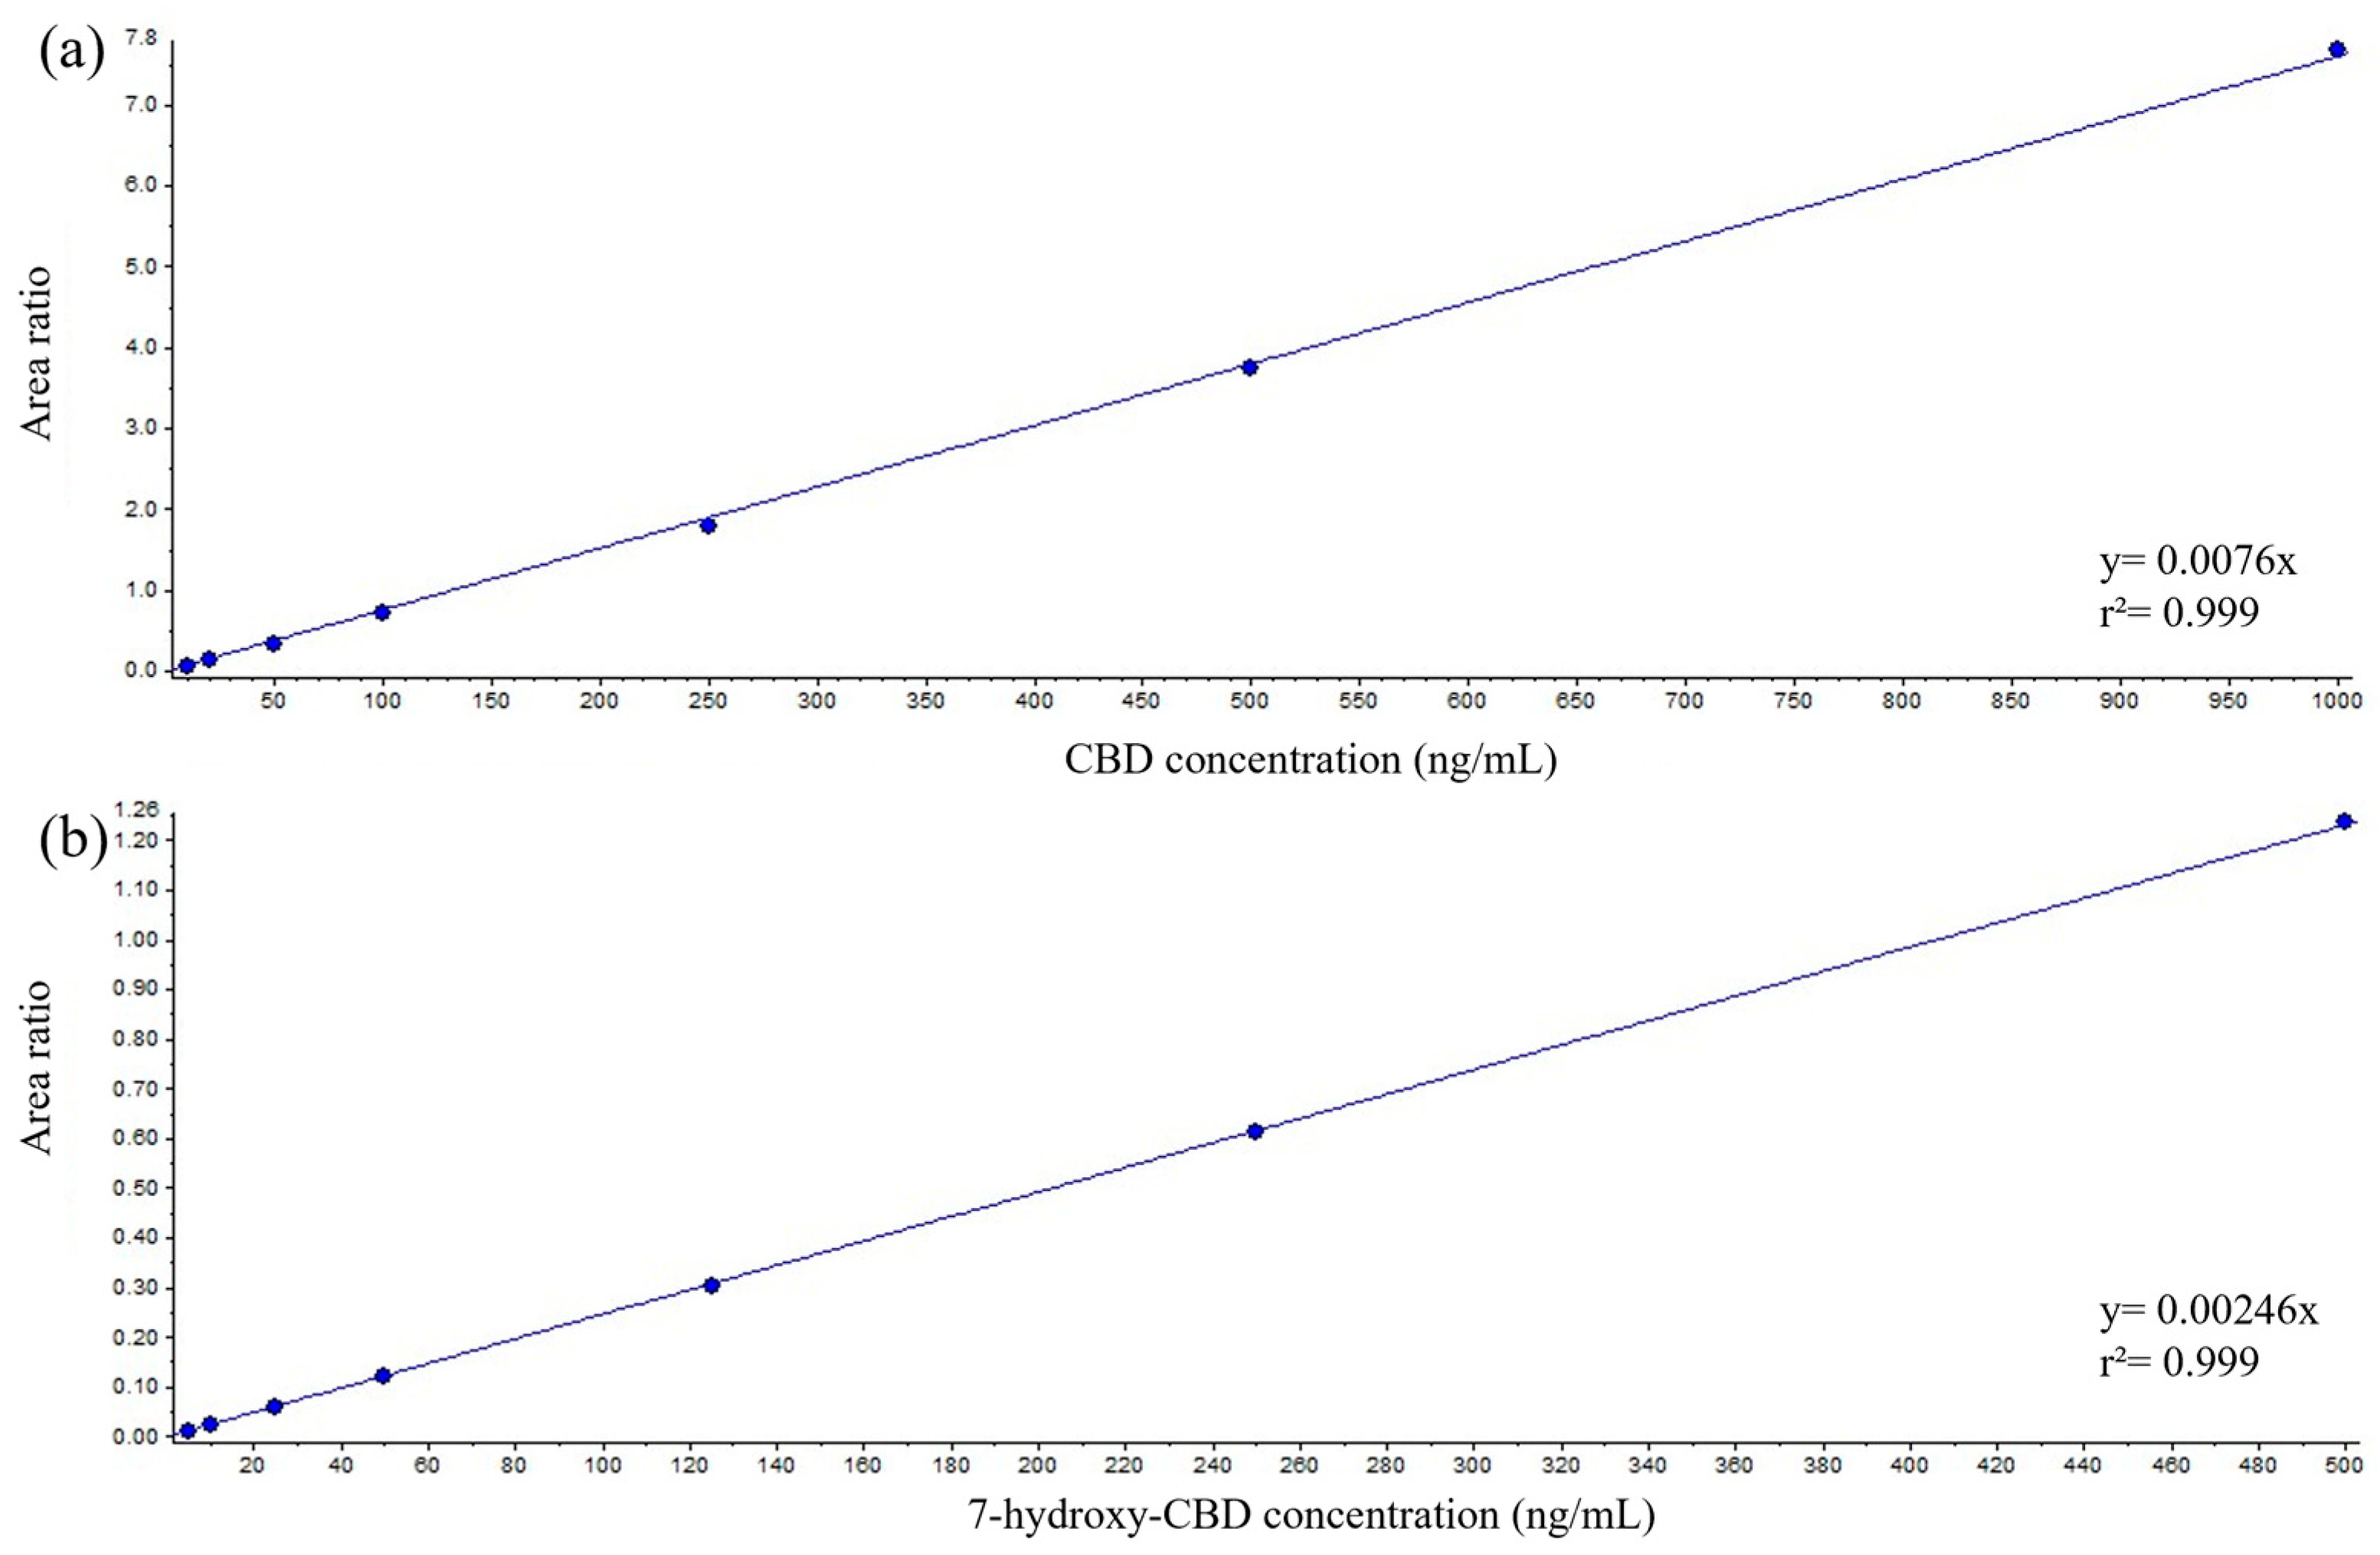
2.2. Automated Method
| Spiked Concentrations (ng/mL) | Measured (ng/mL) | Precision (%) | Accuracy (%) | Spiked Concentrations (ng/mL) | Measured (ng/mL) | Precision (%) | Accuracy (%) |
|---|---|---|---|---|---|---|---|
| Serum CBD | Intraday | Serum CBD | Interday | ||||
| 2.5 (LOQ) (n = 5) | 2.6 ± 0.3 | 11.5 | 105.3 | 2.5 (LOQ) (n = 10) | 2.7 ± 0.2 | 8.4 | 109.3 |
| 35 (QC1) (n = 5) | 30.8 ± 1 | 3.4 | 87.9 | 35 (QC1) (n = 20) | 32.6 ± 2.1 | 6.3 | 93.2 |
| 350 (QC2) (n = 5) | 308.4 ± 4.7 | 1.5 | 88.1 | 350 (QC2) (n = 20) | 329.9 ± 20.1 | 6.1 | 94.3 |
| 750 (QC3) (n = 5) | 688 ± 13.6 | 2 | 91.7 | 750 (QC3) (n = 20) | 718.3 ± 36.9 | 5.1 | 95.8 |
| Spiked Concentrations (ng/mL) | Measured (ng/mL) | Precision (%) | Accuracy (%) | Spiked Concentrations (ng/mL) | Measured (ng/mL) | Precision (%) | Accuracy (%) |
|---|---|---|---|---|---|---|---|
| Serum 7-Hydroxy-CBD | Intraday | Serum 7-Hydroxy-CBD | Interday | ||||
| 5 (LOQ) (n = 5) | 4.6 ± 0.3 | 6.6 | 91.9 | 5 (LOQ) (n = 10) | 4.8 ± 0.4 | 7.8 | 95.8 |
| 17.5 (QC1) (n = 5) | 16.7 ± 0.7 | 4.3 | 95.4 | 17.5 (QC1) (n = 20) | 18 ± 1.5 | 8.1 | 103 |
| 175 (QC2) (n = 5) | 174.4 ± 4.2 | 2.4 | 99.7 | 175 (QC2) (n = 20) | 175.6 ± 9.6 | 5.4 | 100.4 |
| 375 (QC3) (n = 5) | 356.6 ± 16.7 | 4.7 | 95.1 | 375 (QC3) (n = 20) | 374 ± 24.3 | 6.5 | 99.7 |
2.3. Matrix Effect
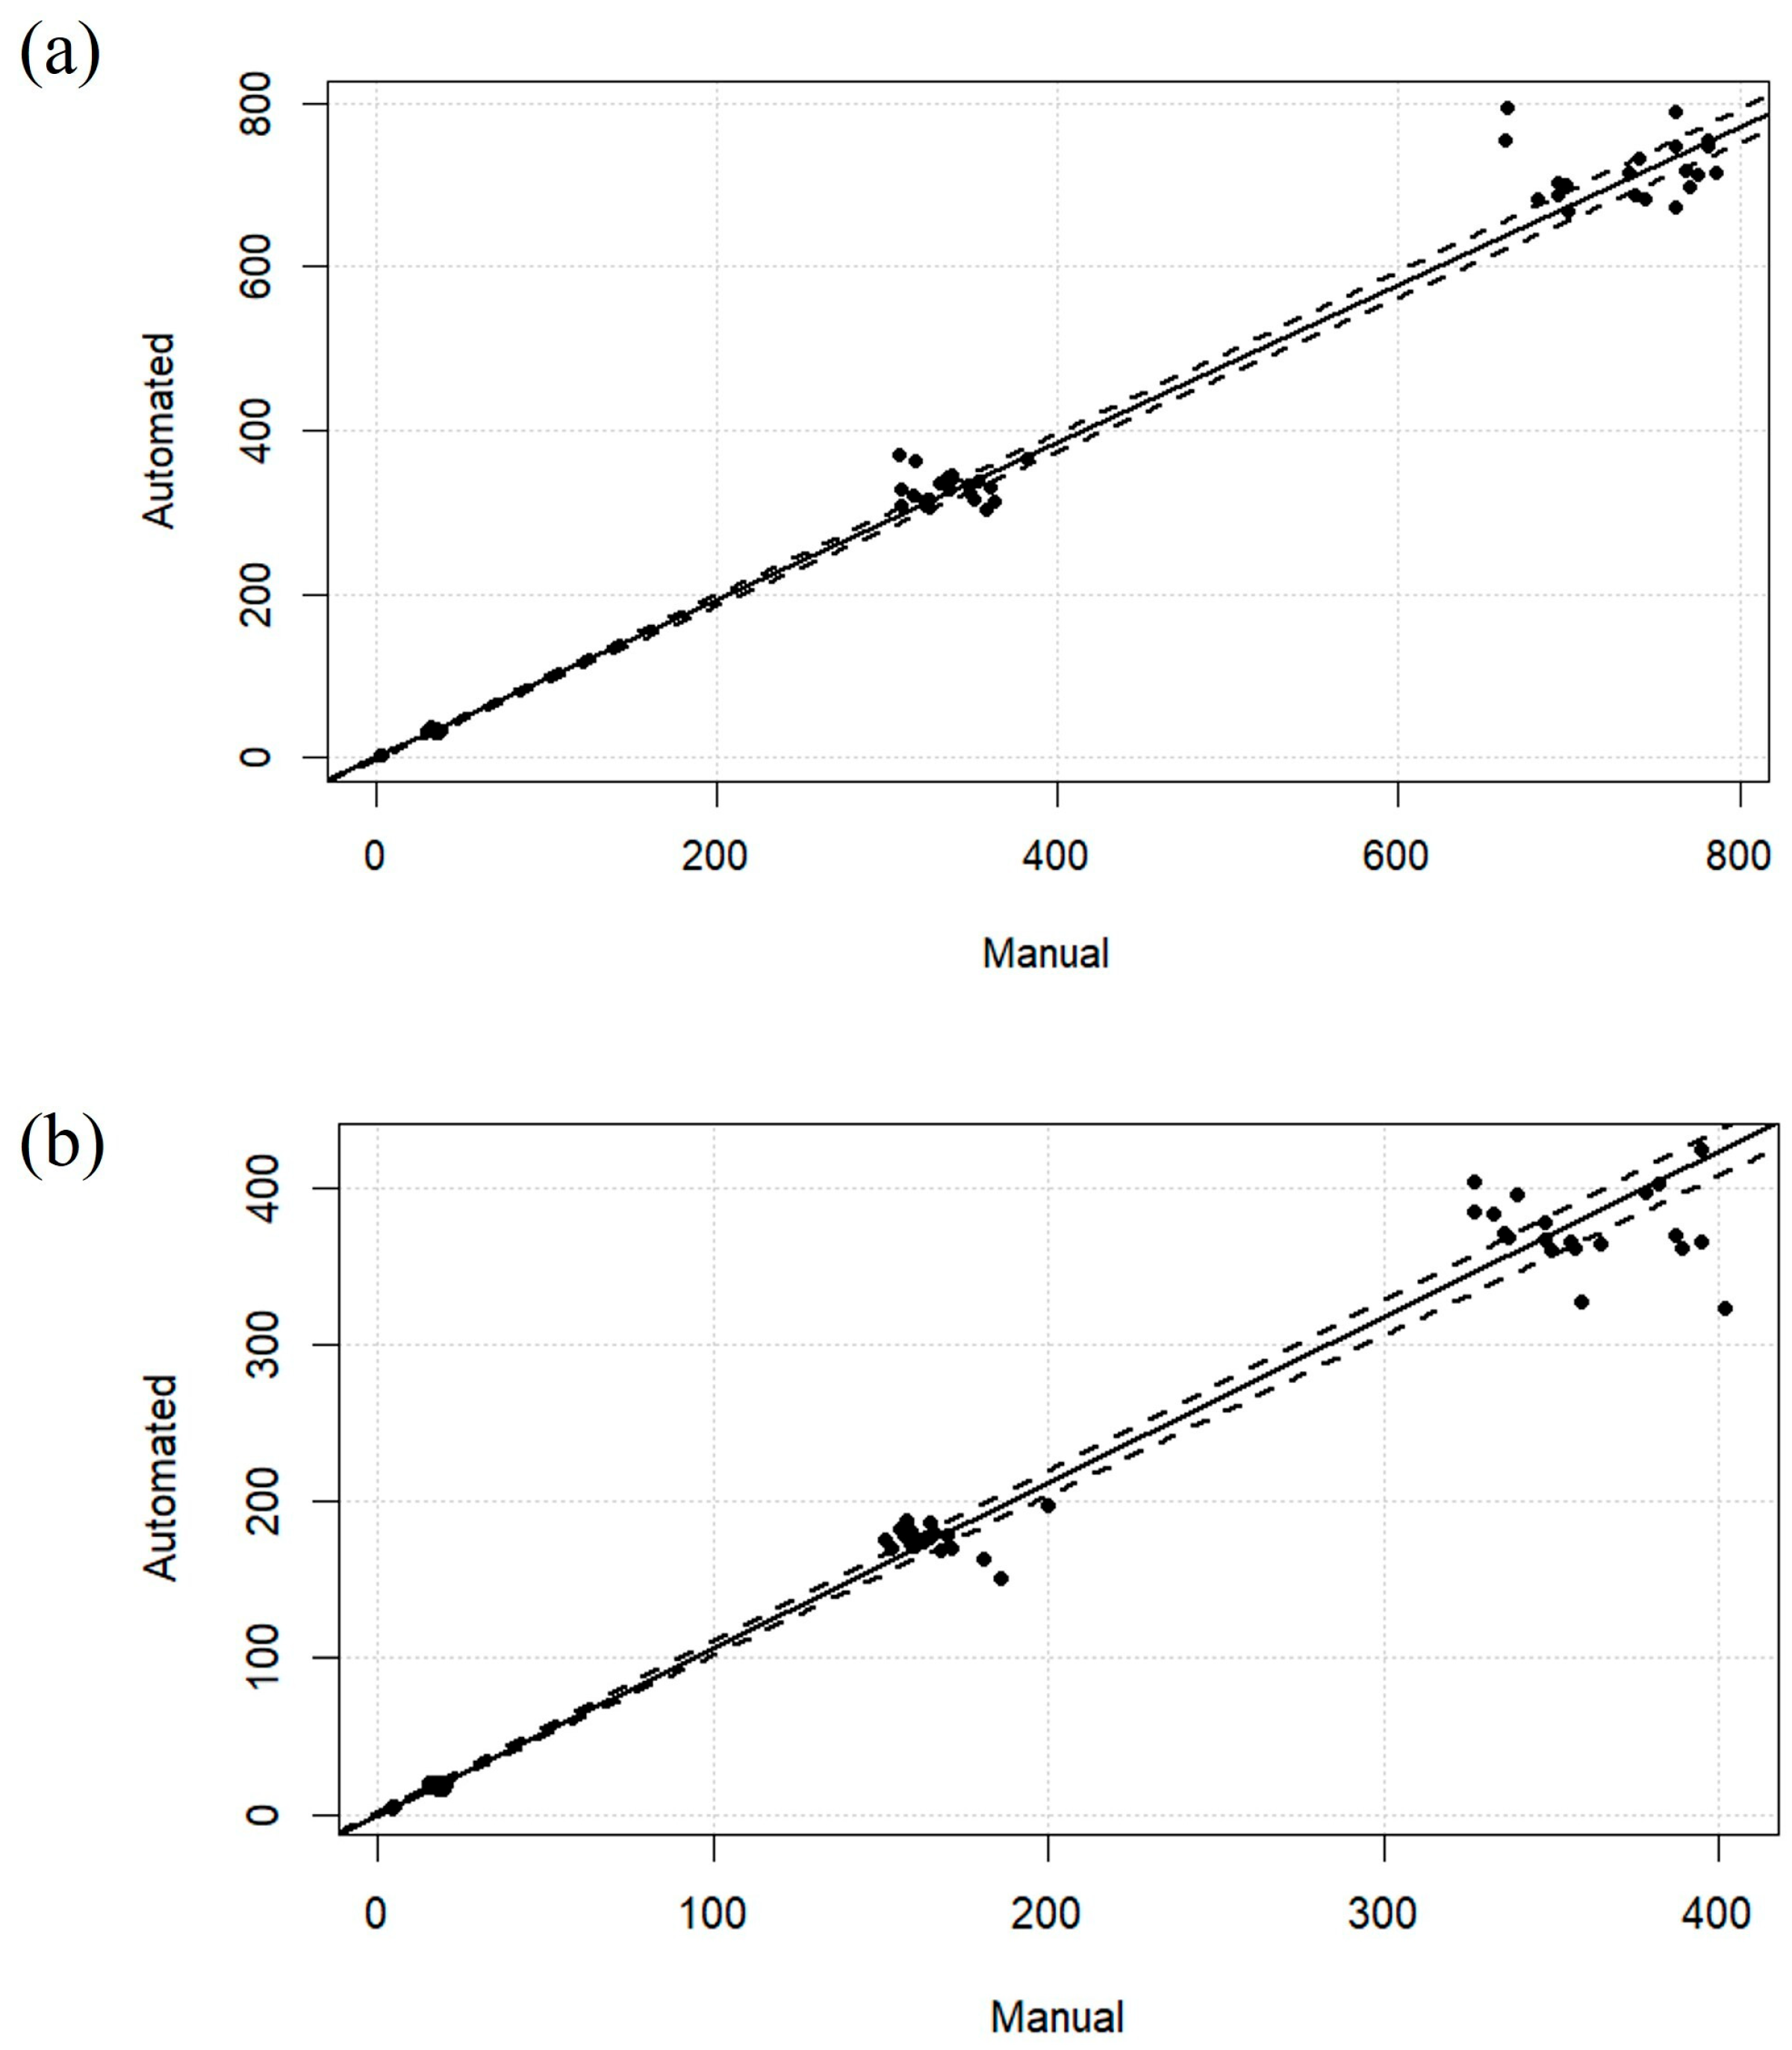
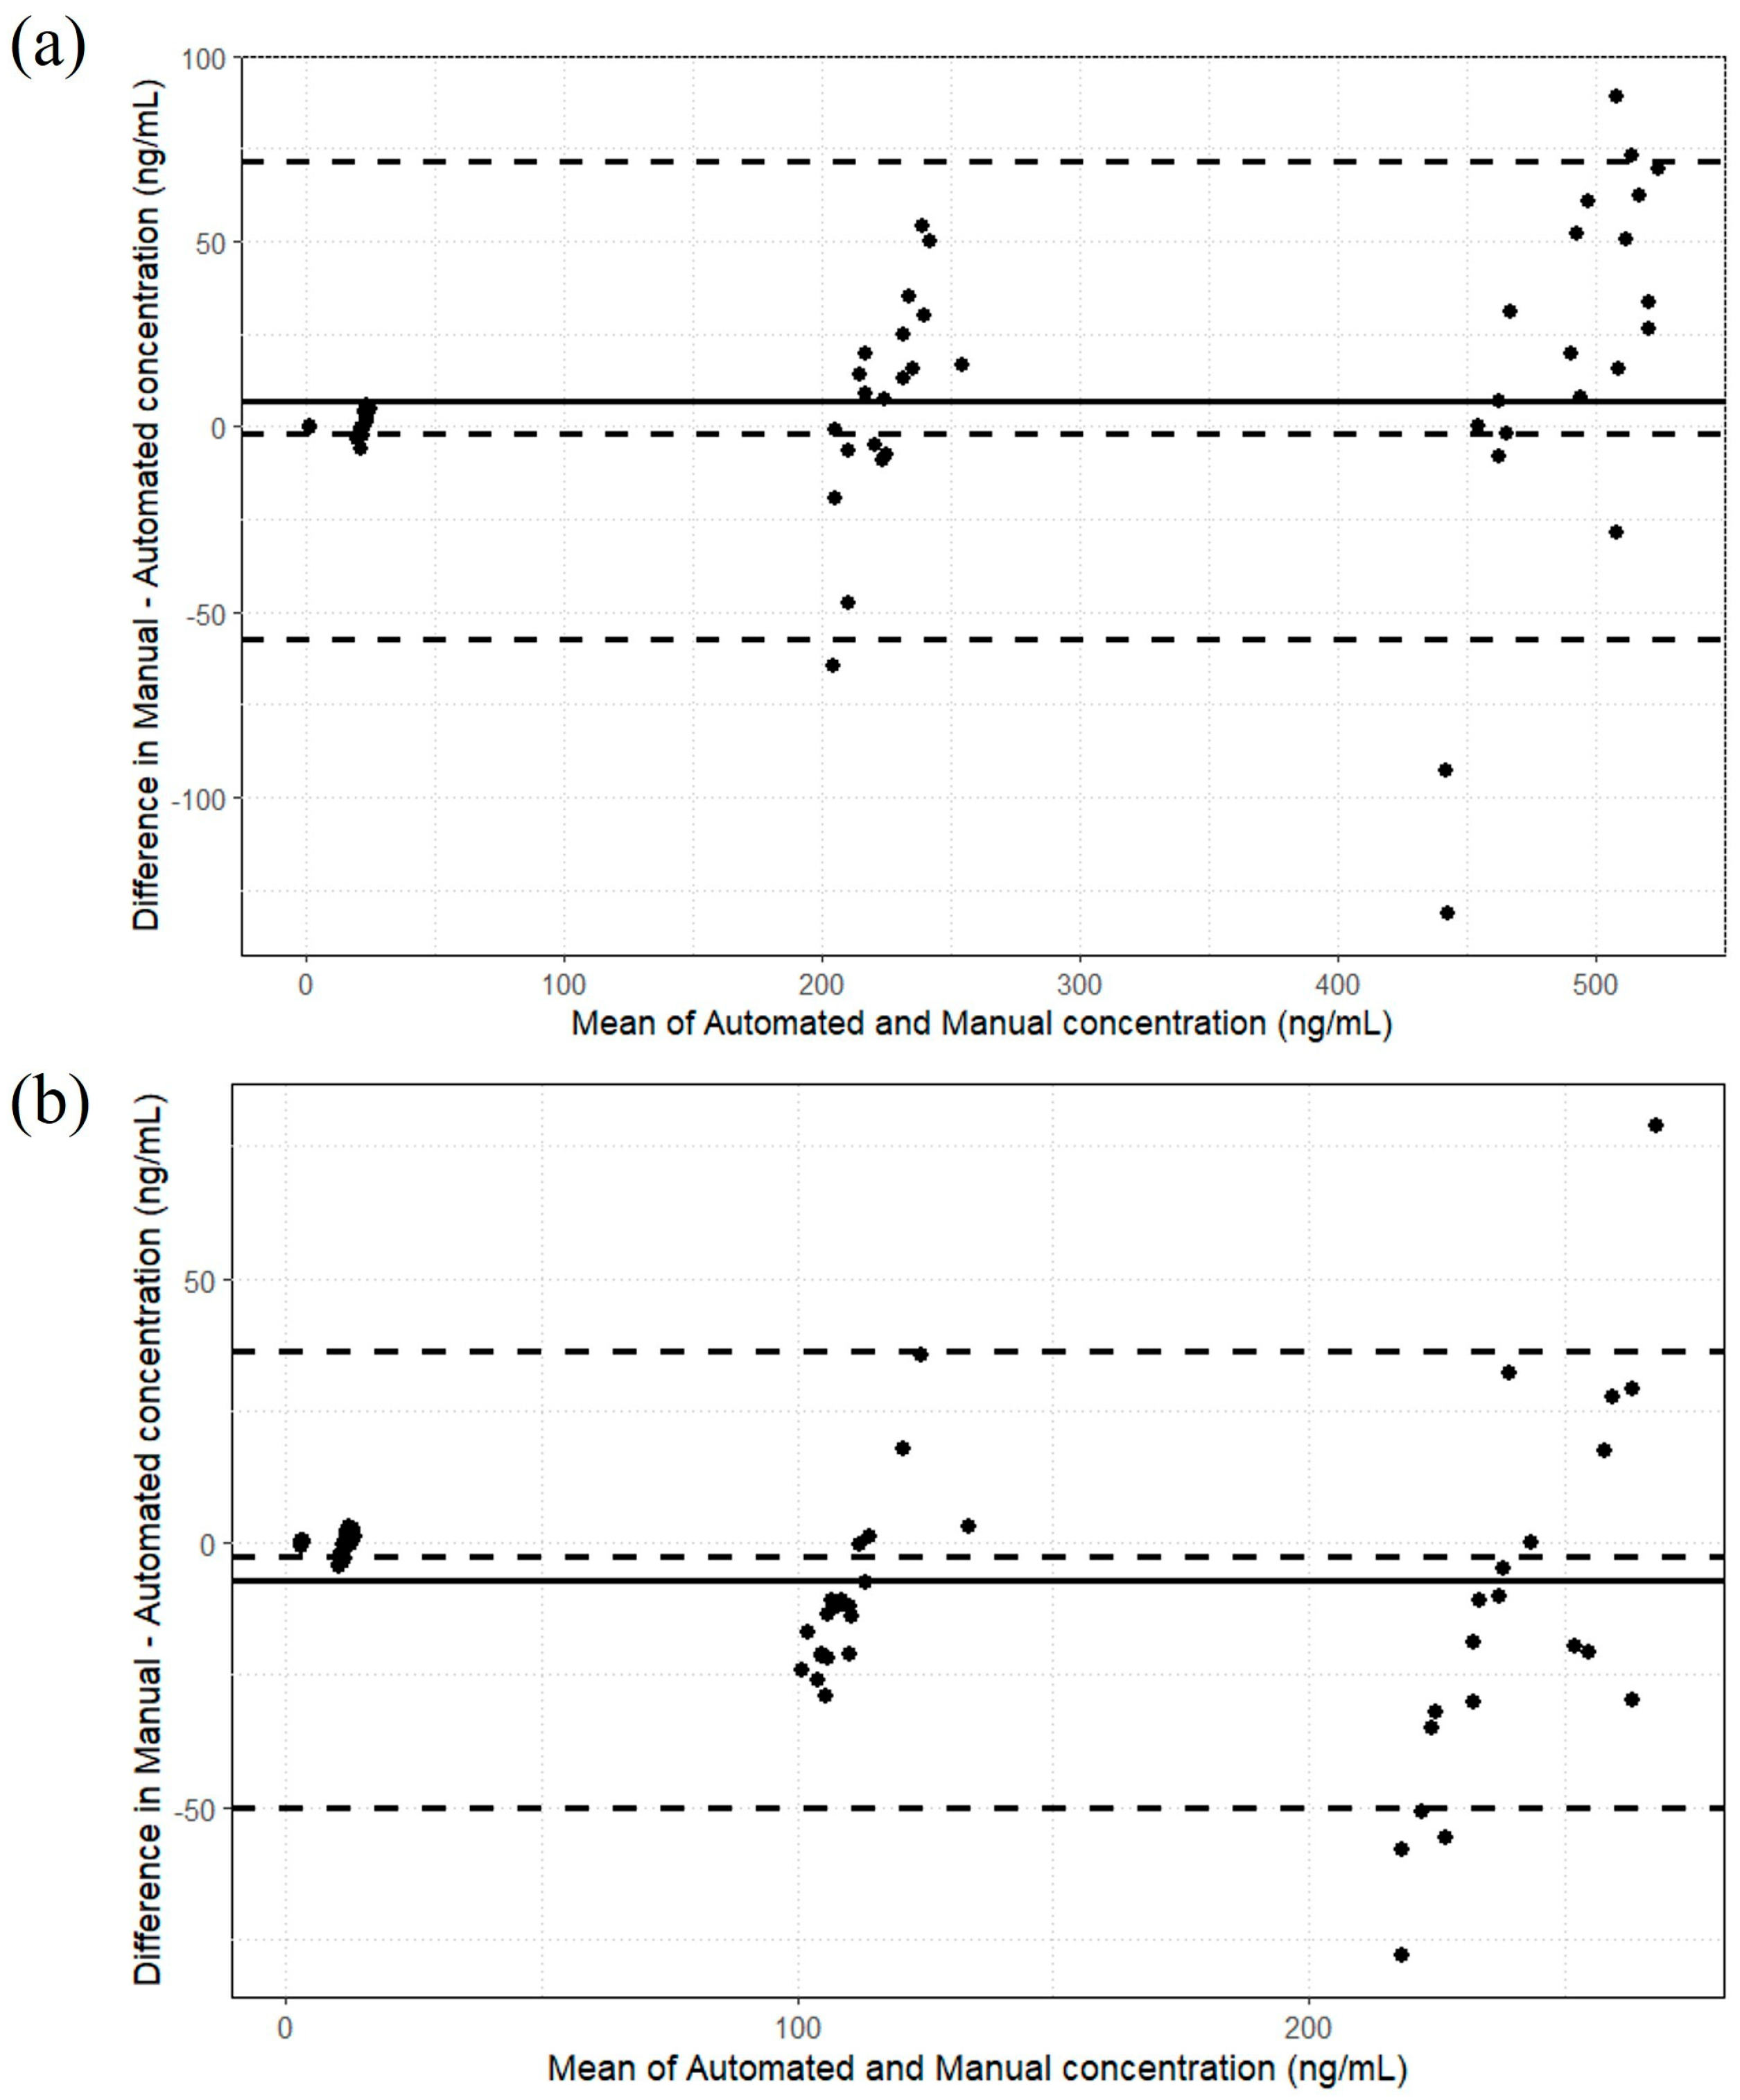
2.4. Analysis of Patient Samples and Comparison of Assay Performance Between Manual and Automated Sample Preparation Techniques
| Manual | Automated | ||||
|---|---|---|---|---|---|
| Patient Number | Dose of CBD (mg/kg/day) | CBD Concentration (ng/mL) | 7-Hydroxy-CBD Concentration (ng/mL) | CBD Concentration (ng/mL) | 7-Hydroxy-CBD Concentration (ng/mL) |
| 1 | 5 | 15 | 12 | 14 | 13 |
| 2 | 8.7 | 36 | 78 | 33 | 79 |
| 3 | 10.6 | 39 | 52 | 38 | 53 |
| 4 | 11.1 | 49 | 81 | 49 | 80 |
| 5 | 17.9 | 254 | 150 | 253 | 147 |
| 6 | 8.9 | 22 | 20 | 20 | 19 |

3. Discussion and Conclusions
4. Materials and Methods
4.1. Standards and Chemicals
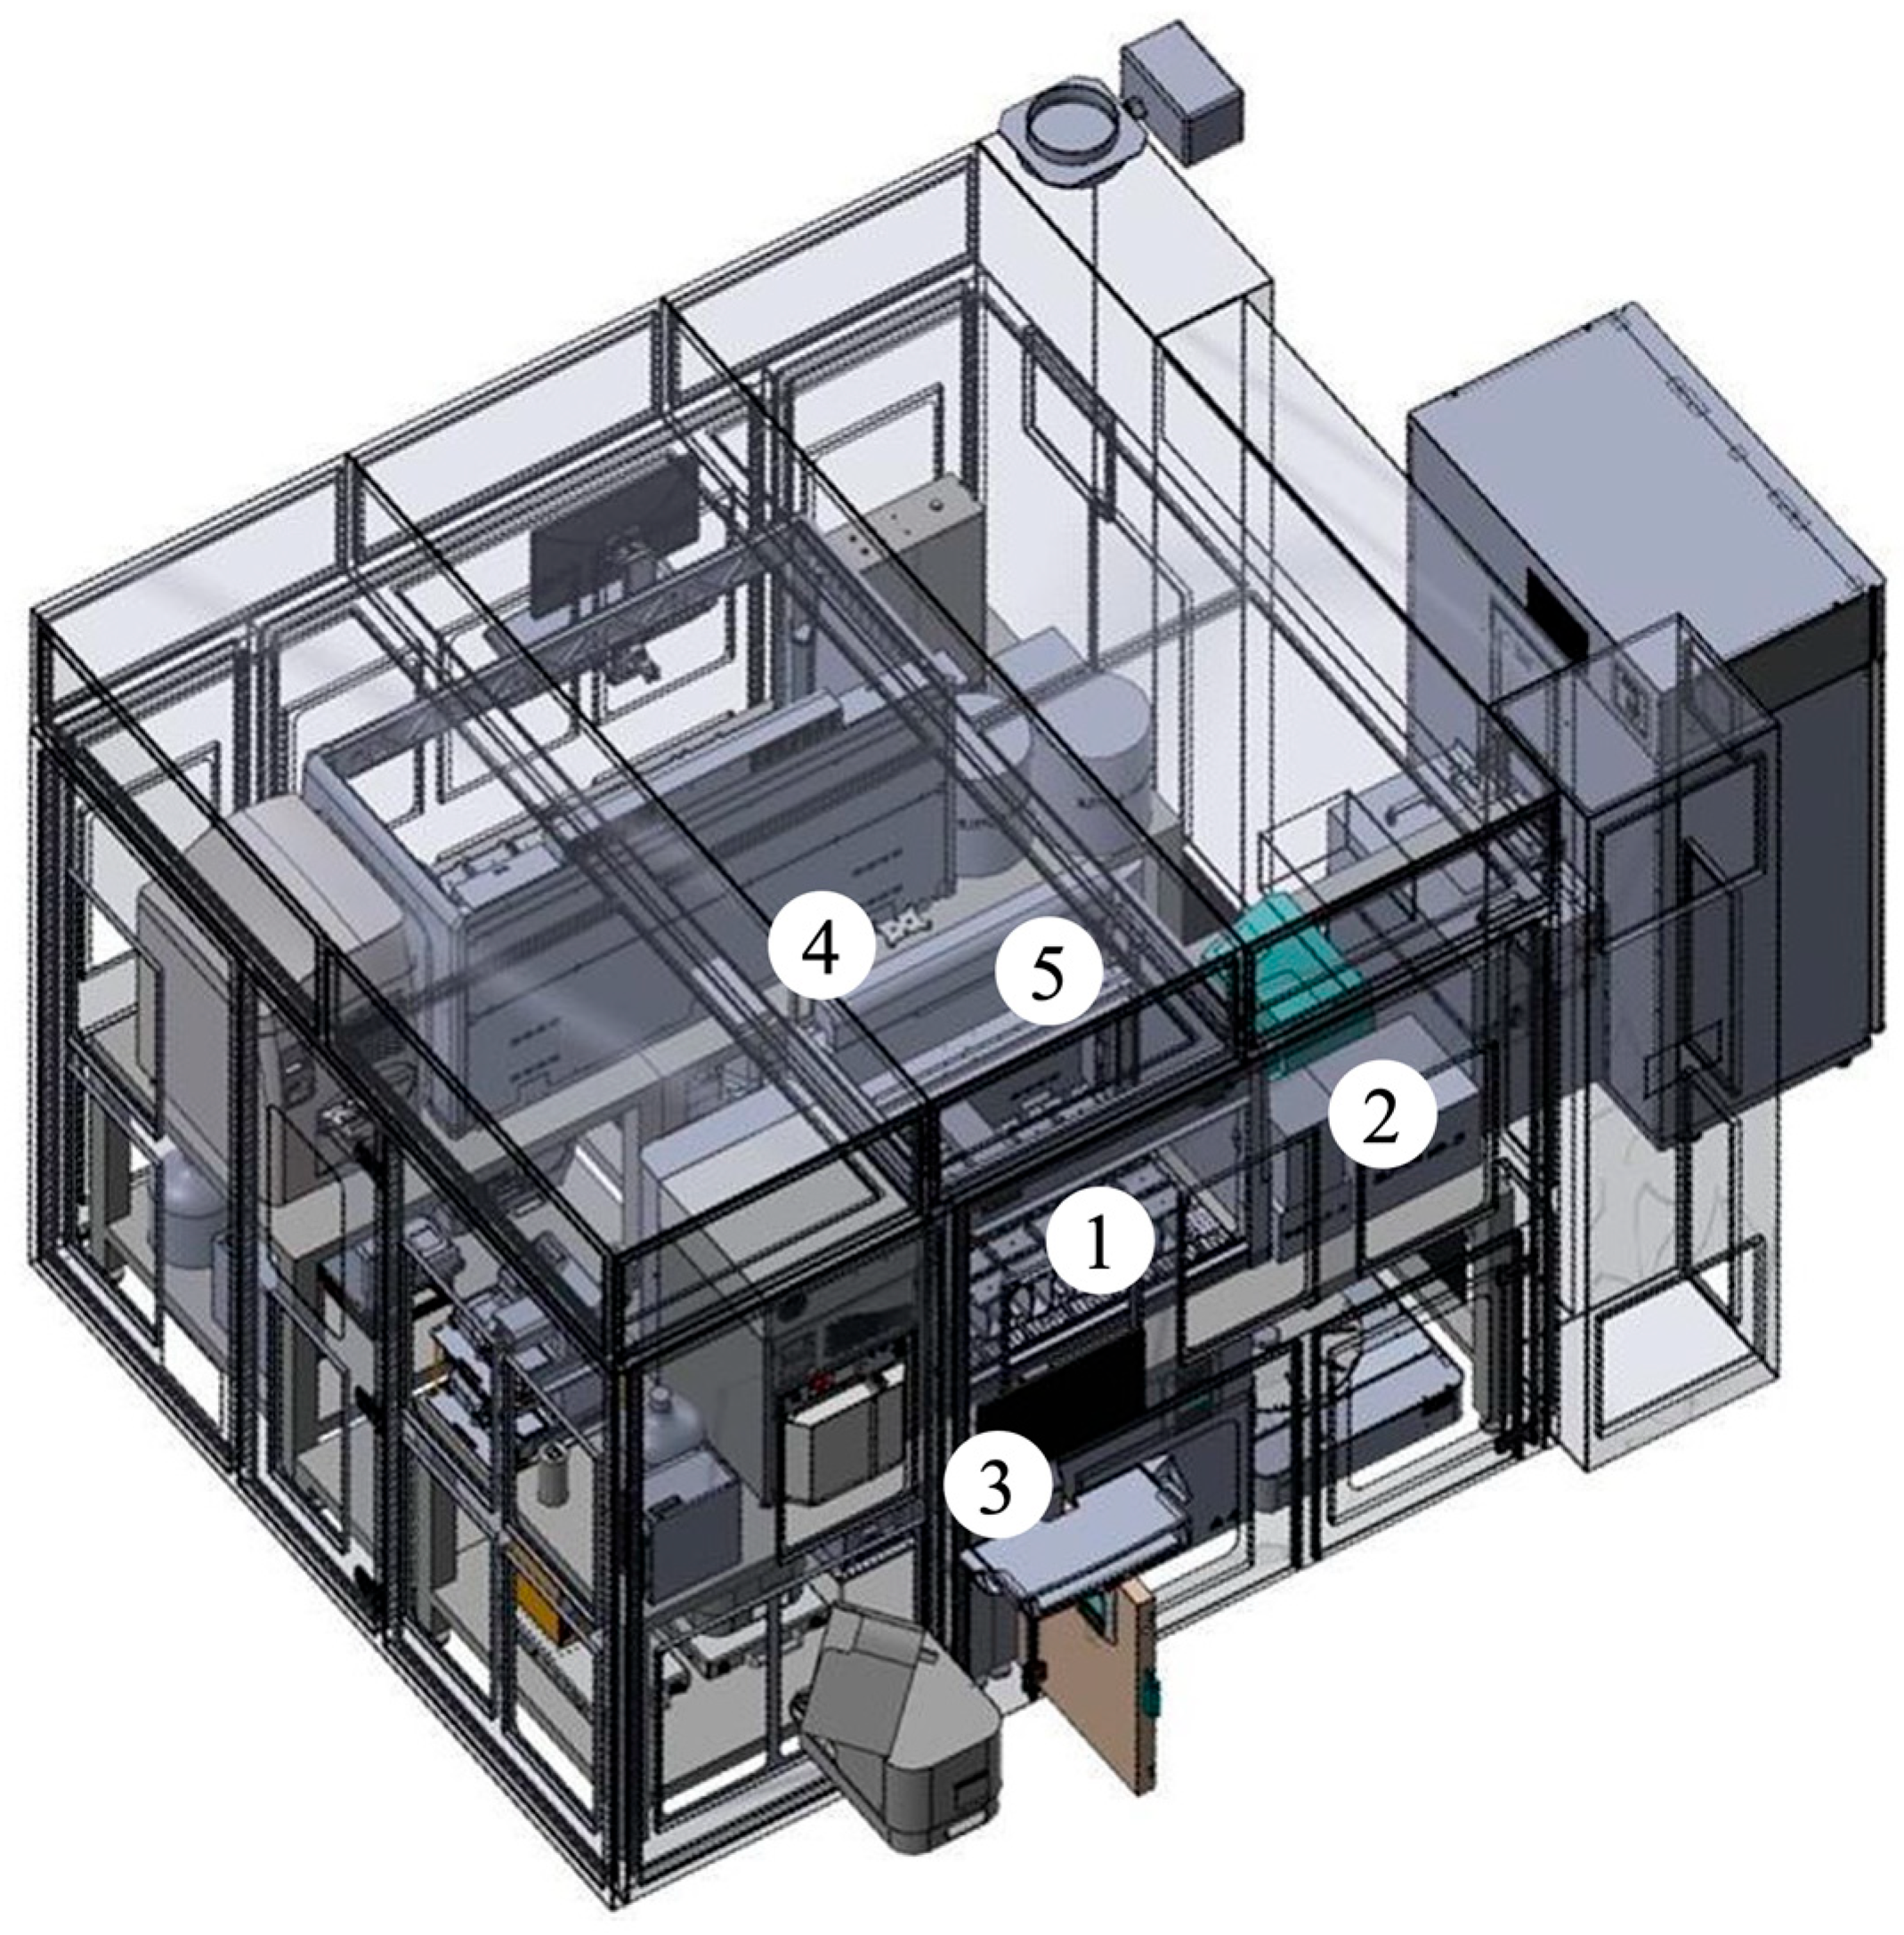
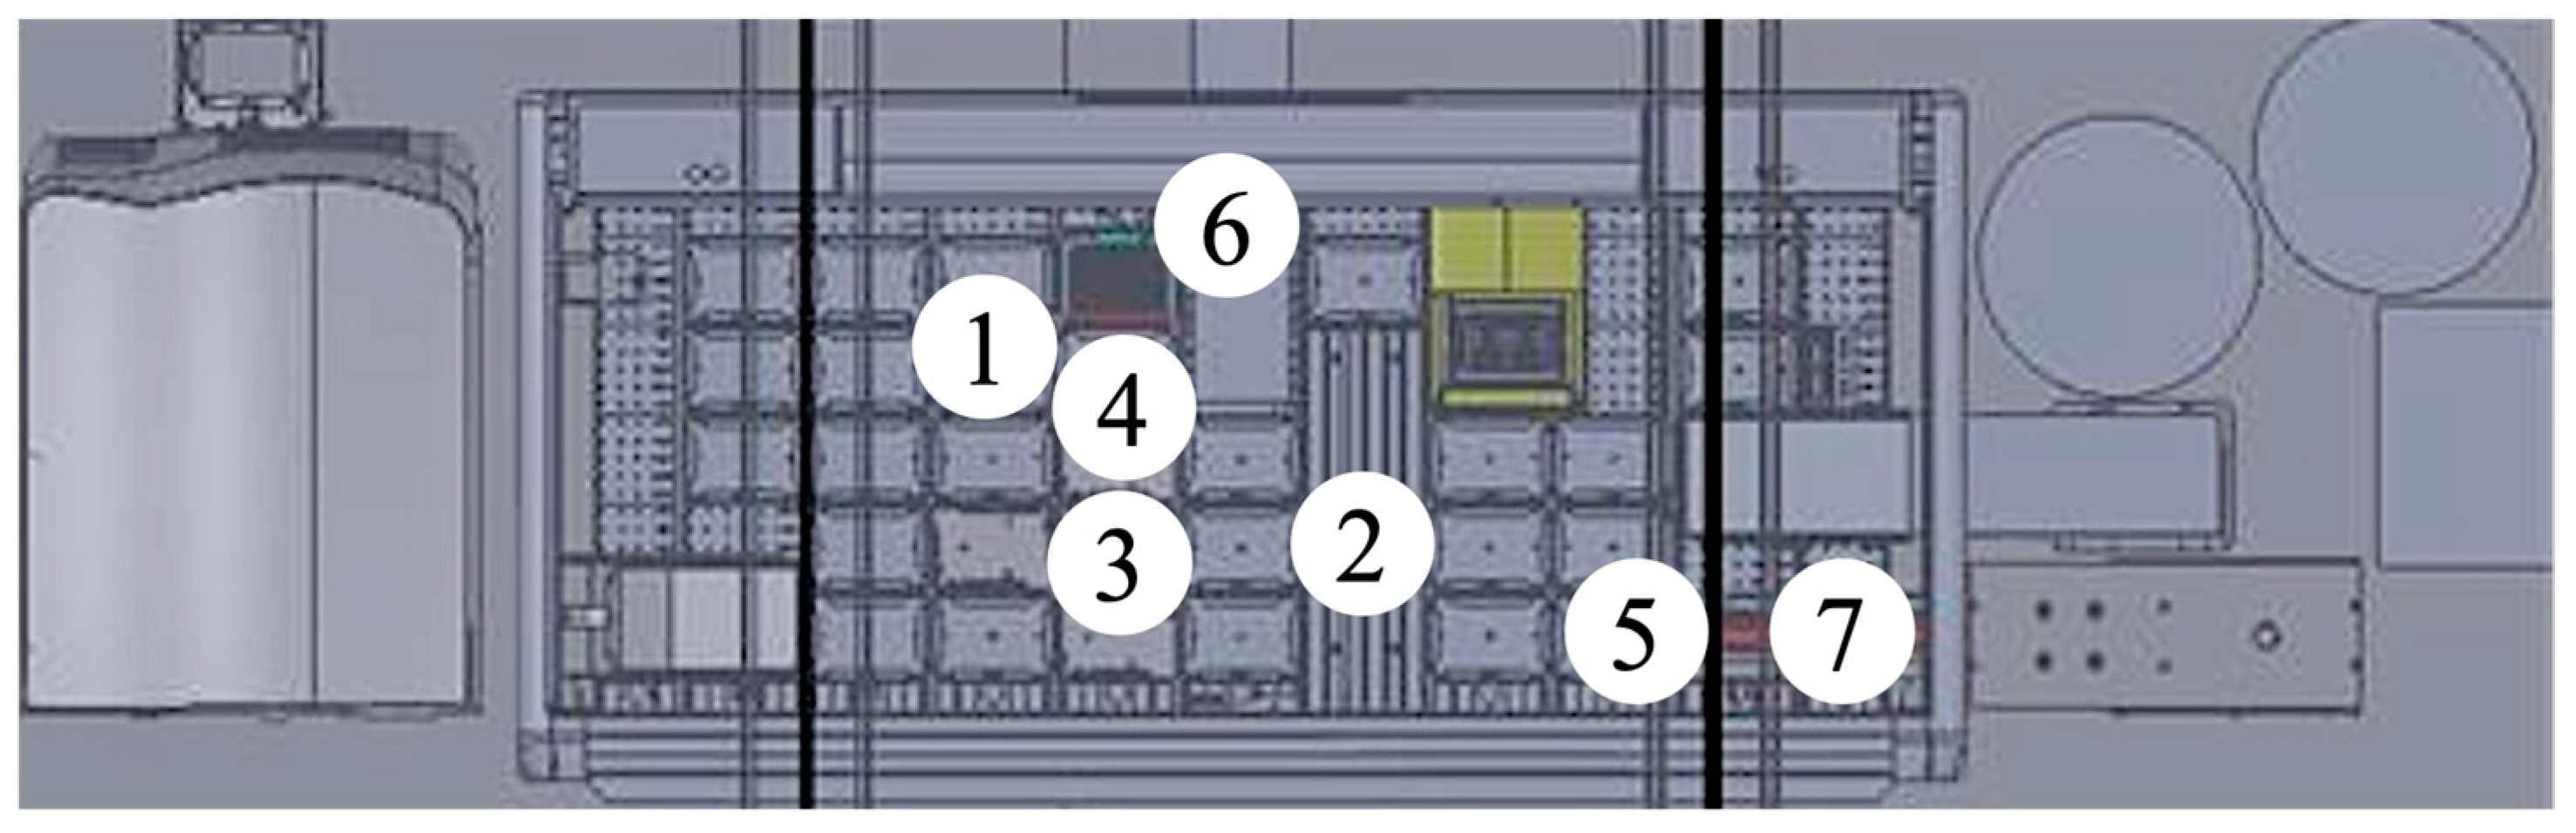
4.2. Automated Platform and LC-MS Equipment
4.3. Preparation of Stock Solutions, Calibrators, and QC Samples
4.4. Manual Sample Preparation
4.5. Automated Sample Preparation
4.6. Clinical Samples and Comparison Between Manual and Automated Sample Preparation
| Patient Number | Age | Sex | Weigh, kg | Dose of CBD (mg/kg/day) | Concomitant ASMs |
|---|---|---|---|---|---|
| 1 | 11 | M | 40 | 5 | VGB, PB, CLB |
| 2 | 19 | M | 46 | 8.7 | VPA, CLB |
| 3 | 19 | F | 47 | 10.6 | CLB, RFN, LTG, PB |
| 4 | 8 | F | 18 | 11.1 | CLB, VPA, ETS |
| 5 | 5 | F | 20 | 17.9 | VPA, TPM, CLB |
| 6 | 17 | M | 45 | 8.9 | VPA |
4.7. Online SPE
4.8. Method Validation
Author Contributions
Funding
Institutional Review Board Statement
Informed Consent Statement
Data Availability Statement
Conflicts of Interest
Abbreviations
| ASM | Antiseizure medications |
| CI | Confidence interval |
| CBD | Cannabidiol |
| CLB | Clobazam |
| CV | Coefficient of variation |
| EMA | European Medicines Agency |
| ETS | Ethosuximide |
| F | Female |
| HPLC | High-Performance Liquid Chromatography |
| IS | Internal standard |
| LC-MS/MS | Liquid chromatography coupled with tandem mass spectrometry |
| LLE | Liquid–liquid extraction |
| LoA | Limit of agreement |
| LOQ | Limit of quantification |
| LTG | Lamotrigine |
| M | Male |
| PB | Phenobarbital |
| PP | Protein precipitation |
| QC | Quality control |
| RFN | Rufinamide |
| SD | Standard deviation |
| SPE | Solid-phase extraction |
| TDM | Therapeutic drug monitoring |
| TPM | Topiramate |
| VGB | Vigabatrin |
| VPA | Valproate |
References
- Lodzki, M.; Godin, B.; Rakou, L.; Mechoulam, R.; Gallily, R.; Touitou, E. Cannabidiol-transdermal delivery and anti-inflammatory effect in a murine model. J. Control. Release 2003, 93, 377–387. [Google Scholar] [CrossRef] [PubMed]
- Li, H.; Liu, Y.; Tian, D.; Tian, L.; Ju, X.; Qi, L.; Wang, Y.; Liang, C. Overview of cannabidiol (CBD) and its analogues: Structures, biological activities, and neuroprotective mechanisms in epilepsy and Alzheimer’s disease. Eur. J. Med. Chem. 2020, 192, 112163. [Google Scholar] [CrossRef] [PubMed]
- Epidyolex. Summary of Product Characteristics; GW Pharma (International) B.V.: London, UK, 2019; Available online: https://www.ema.europa.eu/en/documents/product-information/epidyolex-epar-product-information_en.pdf (accessed on 2 April 2025).
- Epidiolex, Full. Prescribing Information. Greenwich Biosciences Inc. 2020. Available online: https://www.lice.it/LICE_ita/commissione_farmaco/farmaco21/epidyolex-epar-product-information_it.pdf (accessed on 2 April 2025).
- Patsalos, P.N.; Spencer, E.P.; Berry, D.J. Therapeutic Drug Monitoring of Antiepileptic Drugs in Epilepsy: A 2018 Update. Ther. Drug Monit. 2018, 40, 526–548. [Google Scholar] [CrossRef] [PubMed]
- Johannessen Landmark, C.; Johannessen, S.I.; Patsalos, P.N. Therapeutic drug monitoring of antiepileptic drugs: Current status and future prospects. Expert. Opin. Drug Metab. Toxicol. 2020, 16, 227–238. [Google Scholar] [CrossRef] [PubMed]
- Apffel, A.; Zhao, L.; Sartain, M.J. A Novel Solid Phase Extraction Sample Preparation Method for Lipidomic Analysis of Human Plasma Using Liquid Chromatography/Mass Spectrometry. Metabolites 2021, 11, 294. [Google Scholar] [CrossRef] [PubMed]
- de Bie, T.H.; Witkamp, R.F.; Jongsma, M.A.; Balvers, M.G.J. Development and validation of a UPLC-MS/MS method for the simultaneous determination of gamma-aminobutyric acid and glutamic acid in human plasma. J. Chromatogr. B Analyt. Technol. Biomed. Life Sci. 2021, 1164, 122519. [Google Scholar] [CrossRef] [PubMed]
- de Jong, W.H.; Graham, K.S.; van der Molen, J.C.; Links, T.P.; Morris, M.R.; Ross, H.A.; de Vries, E.G.; Kema, I.P. Plasma free metanephrine measurement using automated online solid-phase extraction HPLC tandem mass spectrometry. Clin. Chem. 2007, 53, 1684–1693. [Google Scholar] [CrossRef] [PubMed]
- de Jong, W.H.; Wilkens, M.H.; de Vries, E.G.; Kema, I.P. Automated mass spectrometric analysis of urinary and plasma serotonin. Anal. Bioanal. Chem. 2010, 396, 2609–2616. [Google Scholar] [CrossRef] [PubMed]
- Dos Santos Marques, A.C.; Brito, B.; Gorett Brito Fontes, J.; Reis Alves Carneiro, G.; Dickson Rebelo, J.F.; Barbosa Moraes, A.; Vieira Neto, L.; Costa Padilha, M. Cortisol quantification in human plasma and urine by liquid chromatography coupled to mass spectrometry: Validation, analysis and application in a reference population and patients with adrenal incidentalomas. Clin. Chim. Acta 2025, 566, 120055. [Google Scholar] [CrossRef] [PubMed]
- Duner, K.; Backstrom, J.; Magnell, N.; Svennberg, H.; Ahnoff, M.; Logren, U. Determination of ximelagatran, melagatran and two intermediary metabolites in plasma by mixed-mode solid phase extraction and LC-MS/MS. J. Chromatogr. B Analyt. Technol. Biomed. Life Sci. 2007, 852, 317–324. [Google Scholar] [CrossRef] [PubMed]
- Ishikawa, H.; Furugen, A.; Nishimura, A.; Umazume, T.; Ishikawa, S.; Aoyagi, R.; Narumi, K.; Okamoto, K.; Takekuma, Y.; Sugawara, M.; et al. Validated UPLC-MS/MS method for quantification of melatonin receptor agonists and dual orexin receptor antagonists in human plasma and breast milk: Application to quantify suvorexant and lemborexant in clinical samples. J. Pharm. Biomed. Anal. 2024, 251, 116432. [Google Scholar] [CrossRef] [PubMed]
- Li, W.; Jian, W.; Fu, Y. Basic Sample Preparation Techniques in LC-MS Bioanalysis. In Sample Preparation in LC-MS Bioanalysis; Wiley: Hoboken, NJ, USA, 2019; pp. 1–30. [Google Scholar] [CrossRef]
- Nakatani, K.; Izumi, Y.; Umakoshi, H.; Yokomoto-Umakoshi, M.; Nakaji, T.; Kaneko, H.; Nakao, H.; Ogawa, Y.; Ikeda, K.; Bamba, T. Wide-scope targeted analysis of bioactive lipids in human plasma by LC/MS/MS. J. Lipid Res. 2024, 65, 100492. [Google Scholar] [CrossRef] [PubMed]
- Pavlic, M.; Innerhofer, C.; Pitterl, F. Quantification of ∆9-tetrahydrocannabinol, 11-OH-THC, THC-COOH, hexahydrocannabinol, and cannabidiol in human plasma and blood by liquid chromatography-tandem mass spectrometry. J. Anal. Toxicol. 2025, 49, 85–95. [Google Scholar] [CrossRef] [PubMed]
- Prouteau, L.; Devier, M.H.; Angelier, F.; Chastel, O.; Brischoux, F.; Pardon, P.; Le Menach, K.; Budzinski, H. Biomonitoring of azole fungicides in free-living blackbird plasma using on-line solid-phase extraction coupled to liquid chromatography-tandem mass spectrometry (SPE HPLC-MS/MS). J. Chromatogr. A 2025, 1748, 465725. [Google Scholar] [CrossRef] [PubMed]
- Vogeser, M.; Kirchhoff, F. Progress in automation of LC-MS in laboratory medicine. Clin. Biochem. 2011, 44, 4–13. [Google Scholar] [CrossRef] [PubMed]
- Xu, X.M.; Meng, Z.; Zhang, J.S.; Chen, Q.; Han, J.L. Analytical method development for alpha-amanitin and beta-amanitin in plasma at ultra-trace level by online solid phase extraction-high performance liquid chromatography-triple quadrupole mass spectrometry and its application in poisoning events. J. Pharm. Biomed. Anal. 2020, 190, 113523. [Google Scholar] [CrossRef] [PubMed]
- Luque-Garcia, J.L.; Neubert, T.A. Sample preparation for serum/plasma profiling and biomarker identification by mass spectrometry. J. Chromatogr. A 2007, 1153, 259–276. [Google Scholar] [CrossRef] [PubMed]
- Aebersold, A.S.; Kumar, A.; Song, Z.H. LC-MS/MS quantitation of non-psychotropic cannabinoid cannabidiol in aqueous humor. J. Pharm. Biomed. Anal. 2023, 228, 115324. [Google Scholar] [CrossRef] [PubMed]
- Antunes, M.; Simoes, S.; Fonseca, S.; Franco, J.; Gallardo, E.; Barroso, M. Detection and quantification of selected cannabinoids in oral fluid samples by protein precipitation and LC-MS/MS. Forensic Sci. Int. 2024, 363, 112174. [Google Scholar] [CrossRef] [PubMed]
- Ballotari, M.; Truver, M.T.; Sojin, N.A.; Agliano, L.A.; Parimoo, R.; Hoyer, J.L.; Goodin, A.J.; Varma, D.S.; Chronister, C.W.; Roussos-Ross, K.; et al. Quantitative analysis of Δ8- and Δ9-tetrahydrocannabinol metabolites and isomers: A rapid assay in urine by LC-MS/MS. Anal. Bioanal. Chem. 2025, 417, 1507–1518. [Google Scholar] [CrossRef] [PubMed]
- Chester, L.A.; Englund, A.; Chesney, E.; Oliver, D.; Wilson, J.; Sovi, S.; Dickens, A.M.; Oresic, M.; Linderman, T.; Hodsoll, J.; et al. Effects of Cannabidiol and Delta-9-Tetrahydrocannabinol on Plasma Endocannabinoid Levels in Healthy Volunteers: A Randomized Double-Blind Four-Arm Crossover Study. Cannabis Cannabinoid Res. 2024, 9, 188–198. [Google Scholar] [CrossRef] [PubMed]
- Melen, C.M.; Merrien, M.; Wasik, A.M.; Sander, B.; Wahlin, B.E.; Panagiotis, G.; Beck, O. Delta(9)-THC and CBD in Plasma, Oral Fluid, Exhaled Breath, and Urine from 23 Patients Administered Sativex. Cannabis Cannabinoid Res. 2024, 9, e839–e846. [Google Scholar] [CrossRef] [PubMed]
- Oliveira, I.G.C.; de Souza, I.D.; de Crippa, J.A.S.; Queiroz, M.E.C. A Disposable Pipette Extraction-UHPLC-MS/MS Method Based on Removal of Phospholipids to Determine Anandamide, 2-Arachidonoylglycerol, Cannabidiol, and Delta(9)-Tetrahydrocannabidiol in Plasma Samples. J. Sep. Sci. 2025, 48, e70068. [Google Scholar] [CrossRef] [PubMed]
- Pigliasco, F.; Cafaro, A.; Barco, S.; Stella, M.; Mattioli, F.; Riva, A.; Mancardi, M.M.; Lattanzi, S.; Bandettini, R.; Striano, P.; et al. Innovative LC-MS/MS method for therapeutic drug monitoring of fenfluramine and cannabidiol in the plasma of pediatric patients with epilepsy. J. Pharm. Biomed. Anal. 2024, 245, 116174. [Google Scholar] [CrossRef] [PubMed]
- Sim, Y.E.; Kim, J.W.; Ko, B.J.; Kim, J.Y.; Cheong, J.C.; Pyo, J. Determination of urinary metabolites of cannabidiol, Delta(8)-tetrahydrocannabinol, and Delta(9)-tetrahydrocannabinol by automated online µSPE-LC-MS/MS method. J. Chromatogr. B Analyt. Technol. Biomed. Life Sci. 2023, 1214, 123568. [Google Scholar] [CrossRef] [PubMed]
- Sinapour, H.; Guterstam, J.; Grosse, S.; Astorga-Wells, J.; Stambeck, P.; Stambeck, M.; Winberg, J.; Hermansson, S.; Beck, O. Validation and application of an automated multitarget LC-MS/MS method for drugs of abuse testing using exhaled breath as specimen. J. Chromatogr. B Analyt. Technol. Biomed. Life Sci. 2024, 1240, 124142. [Google Scholar] [CrossRef] [PubMed]
- Vikingsson, S.; Hart, E.D.; Winecker, R.E.; Cone, E.J.; Kuntz, D.J.; Clark, M.; Jacques, M.; Hayes, E.D.; Flegel, R.R. Prevalence of ∆8-tetrahydrocannabinol carboxylic acid in workplace drug testing. J. Anal. Toxicol. 2023, 47, 719–725. [Google Scholar] [CrossRef] [PubMed]
- Wade, N.E.; Wallace, A.L.; Huestis, M.A.; Lisdahl, K.M.; Sullivan, R.M.; Tapert, S.F. Cannabis use and neurocognitive performance at 13-14 Years-Old: Optimizing assessment with hair toxicology in the Adolescent brain cognitive development (ABCD) study. Addict. Behav. 2024, 150, 107930. [Google Scholar] [CrossRef] [PubMed]
- Zamarripa, C.A.; Tilton, H.E.; Lin, S.; Cone, E.J.; Winecker, R.E.; Flegel, R.R.; Kuntz, D.; Beals, M.; Jacques, M.; Clark, M.; et al. Pharmacokinetics and pharmacodynamics of five distinct commercially available hemp-derived topical cannabidiol products. J. Anal. Toxicol. 2024, 48, 81–98. [Google Scholar] [CrossRef] [PubMed]
- Zancanaro, F.; Tedeschi, G.; Zamengo, L.; Frasson, S.; Frison, G. Determination of cannabinoids in 50 muL whole blood samples by online extraction using turbulent flow chromatography and LC-HRAM-Orbitrap-MS: Application on driving under the influence of drugs cases. Drug Test. Anal. 2024, 16, 210–220. [Google Scholar] [CrossRef] [PubMed]
- Zhang, Q.; Melchert, P.W.; Markowitz, J.S. Pharmacokinetic Variability of Oral Cannabidiol and Its Major Metabolites after Short-Term High-Dose Exposure in Healthy Subjects. Med. Cannabis Cannabinoids 2024, 7, 1–9. [Google Scholar] [CrossRef] [PubMed]
- Zufferey, F.; Buitrago, E.; Rahban, R.; Senn, A.; Stettler, E.; Rudaz, S.; Nef, S.; Donzé, N.; Thomas, A.; Rossier, M.F. Gonadotropin axis and semen quality in young Swiss men after cannabis consumption: Effect of chronicity and modulation by cannabidiol. Andrology 2024, 12, 56–67. [Google Scholar] [CrossRef] [PubMed]
- Franco, V.; Palmisani, M.; Marchiselli, R.; Crema, F.; Fattore, C.; De Giorgis, V.; Varesio, C.; Rota, P.; Dibari, V.F.; Perucca, E. On-Line Solid Phase Extraction High Performance Liquid Chromatography Method Coupled With Tandem Mass Spectrometry for the Therapeutic Monitoring of Cannabidiol and 7-Hydroxy-cannabidiol in Human Serum and Saliva. Front. Pharmacol. 2022, 13, 915004. [Google Scholar] [CrossRef] [PubMed]
- European Medicines Agency. ICH M10 on Bioanalytical Method Validation—Scientific Guideline. 2022. Available online: https://www.ema.europa.eu/en/documents/scientific-guideline/ich-guideline-m10-bioanalytical-method-validation-step-5_en.pdf (accessed on 2 April 2025).
Disclaimer/Publisher’s Note: The statements, opinions and data contained in all publications are solely those of the individual author(s) and contributor(s) and not of MDPI and/or the editor(s). MDPI and/or the editor(s) disclaim responsibility for any injury to people or property resulting from any ideas, methods, instructions or products referred to in the content. |
© 2025 by the authors. Licensee MDPI, Basel, Switzerland. This article is an open access article distributed under the terms and conditions of the Creative Commons Attribution (CC BY) license (https://creativecommons.org/licenses/by/4.0/).
Share and Cite
Palmisani, M.; Dattrino, F.; Rota, P.; Tacchella, F.; Fedele, G.; Pasca, L.; Quaranta, C.A.; De Giorgis, V.; Matulli Cavedagna, T.; Cancellerini, C.; et al. Automated Workflow for High-Throughput LC–MS/MS Therapeutic Monitoring of Cannabidiol and 7-Hydroxy-cannabidiol in Patients with Epilepsy. Int. J. Mol. Sci. 2025, 26, 6999. https://doi.org/10.3390/ijms26146999
Palmisani M, Dattrino F, Rota P, Tacchella F, Fedele G, Pasca L, Quaranta CA, De Giorgis V, Matulli Cavedagna T, Cancellerini C, et al. Automated Workflow for High-Throughput LC–MS/MS Therapeutic Monitoring of Cannabidiol and 7-Hydroxy-cannabidiol in Patients with Epilepsy. International Journal of Molecular Sciences. 2025; 26(14):6999. https://doi.org/10.3390/ijms26146999
Chicago/Turabian StylePalmisani, Michela, Francesca Dattrino, Paola Rota, Federica Tacchella, Guido Fedele, Ludovica Pasca, Carlo Alberto Quaranta, Valentina De Giorgis, Thomas Matulli Cavedagna, Chiara Cancellerini, and et al. 2025. "Automated Workflow for High-Throughput LC–MS/MS Therapeutic Monitoring of Cannabidiol and 7-Hydroxy-cannabidiol in Patients with Epilepsy" International Journal of Molecular Sciences 26, no. 14: 6999. https://doi.org/10.3390/ijms26146999
APA StylePalmisani, M., Dattrino, F., Rota, P., Tacchella, F., Fedele, G., Pasca, L., Quaranta, C. A., De Giorgis, V., Matulli Cavedagna, T., Cancellerini, C., Butti, A., Castellazzi, G., Russo, E., Tassorelli, C., Nicotera, P., & Franco, V. (2025). Automated Workflow for High-Throughput LC–MS/MS Therapeutic Monitoring of Cannabidiol and 7-Hydroxy-cannabidiol in Patients with Epilepsy. International Journal of Molecular Sciences, 26(14), 6999. https://doi.org/10.3390/ijms26146999