
Upregulation of the Antioxidant Response-Related microRNAs miR-146a-5p and miR-21-5p in Gestational Diabetes: An Analysis of Matched Samples of Extracellular Vesicles and PBMCs

 , , , , , , and
Abstract
1. Introduction
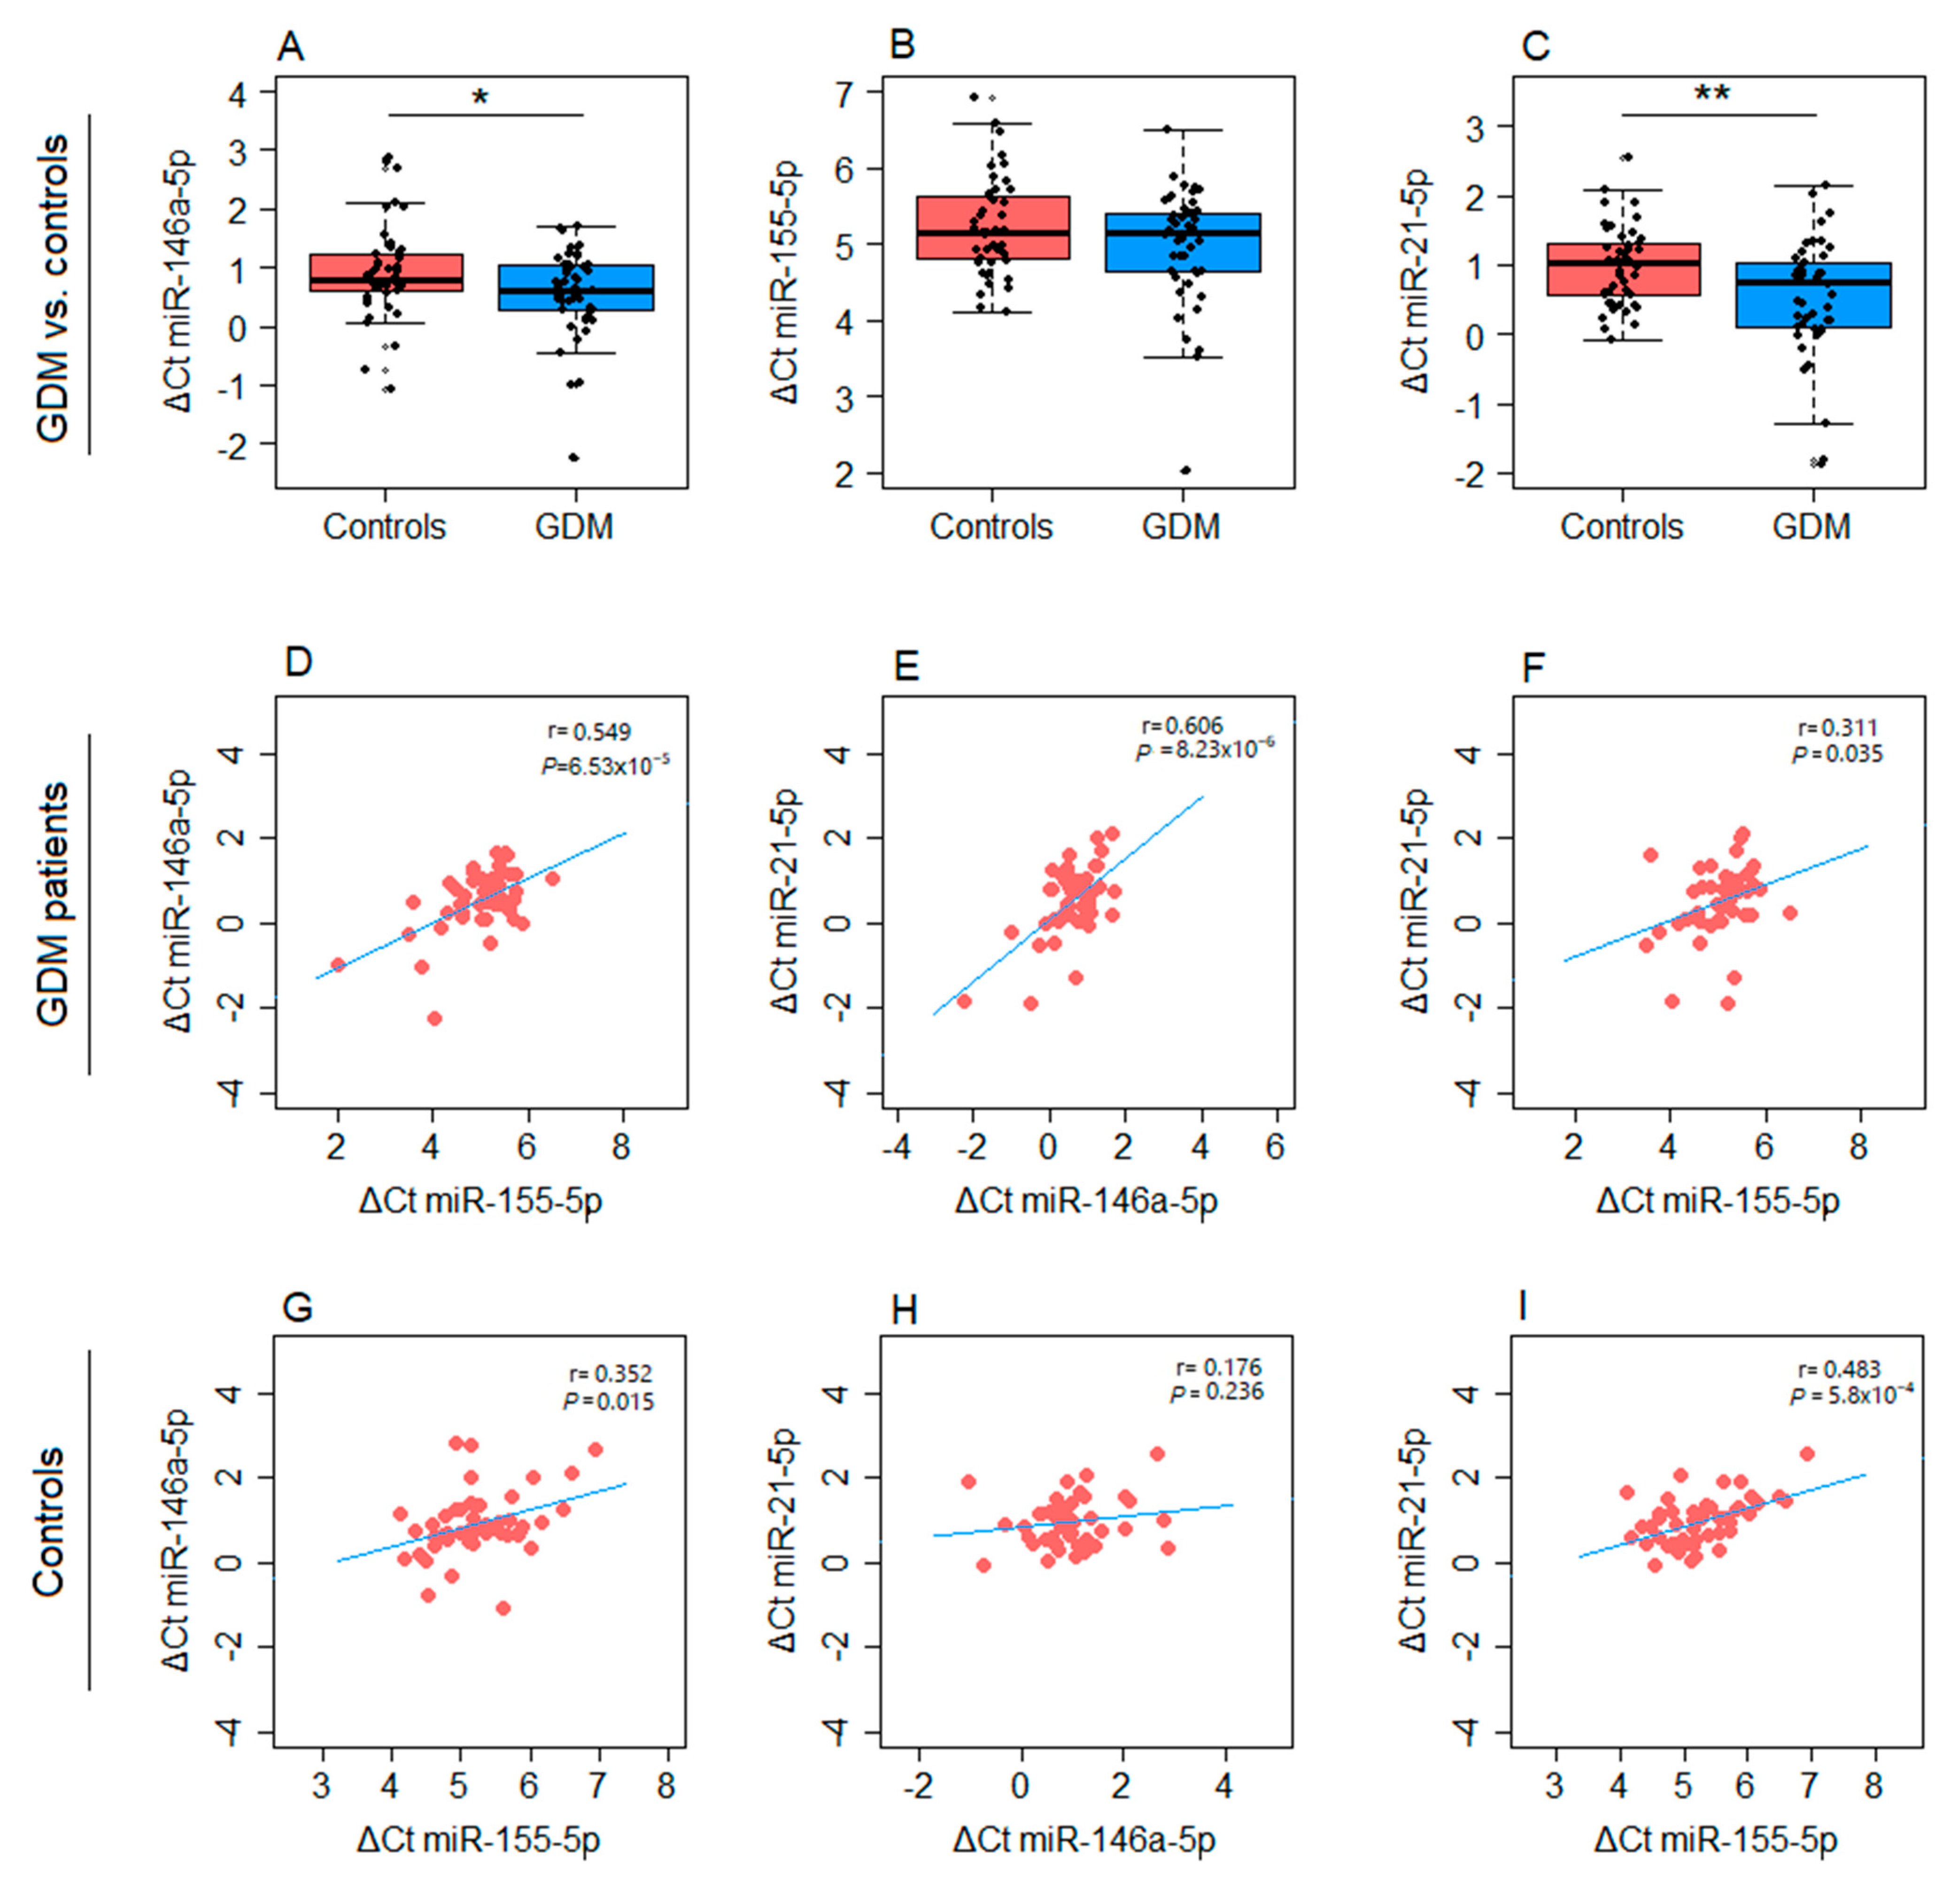
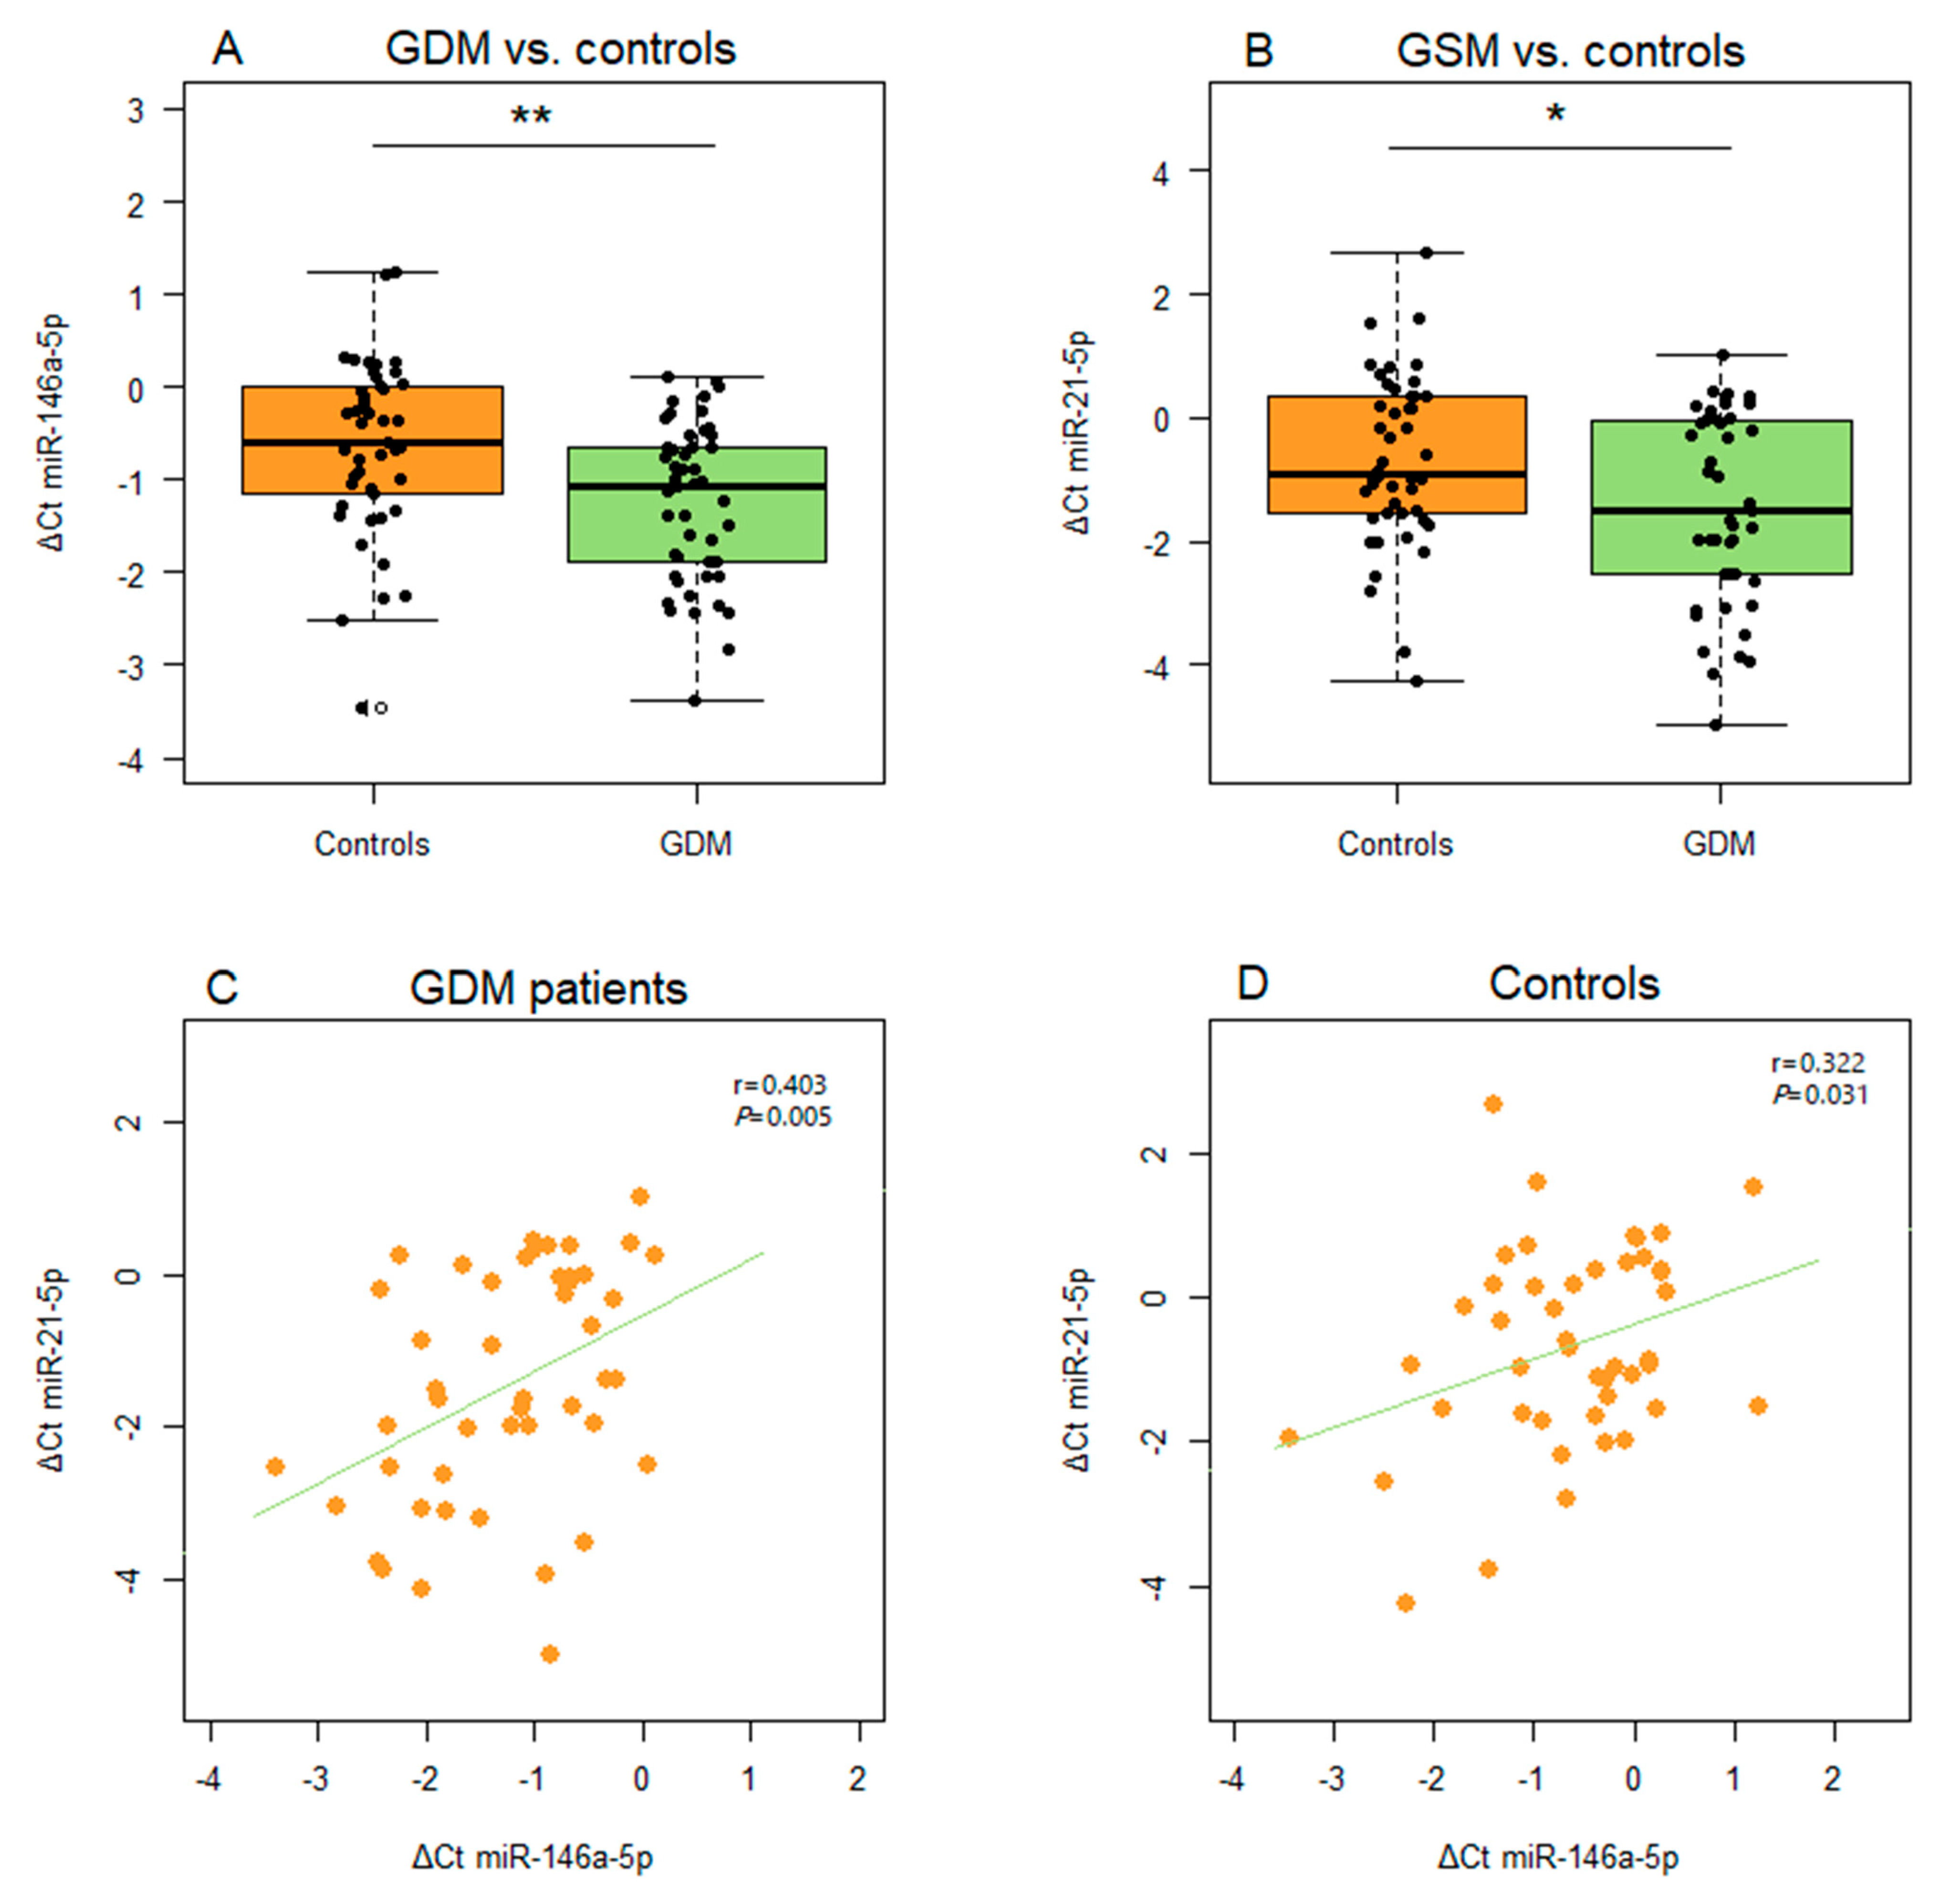
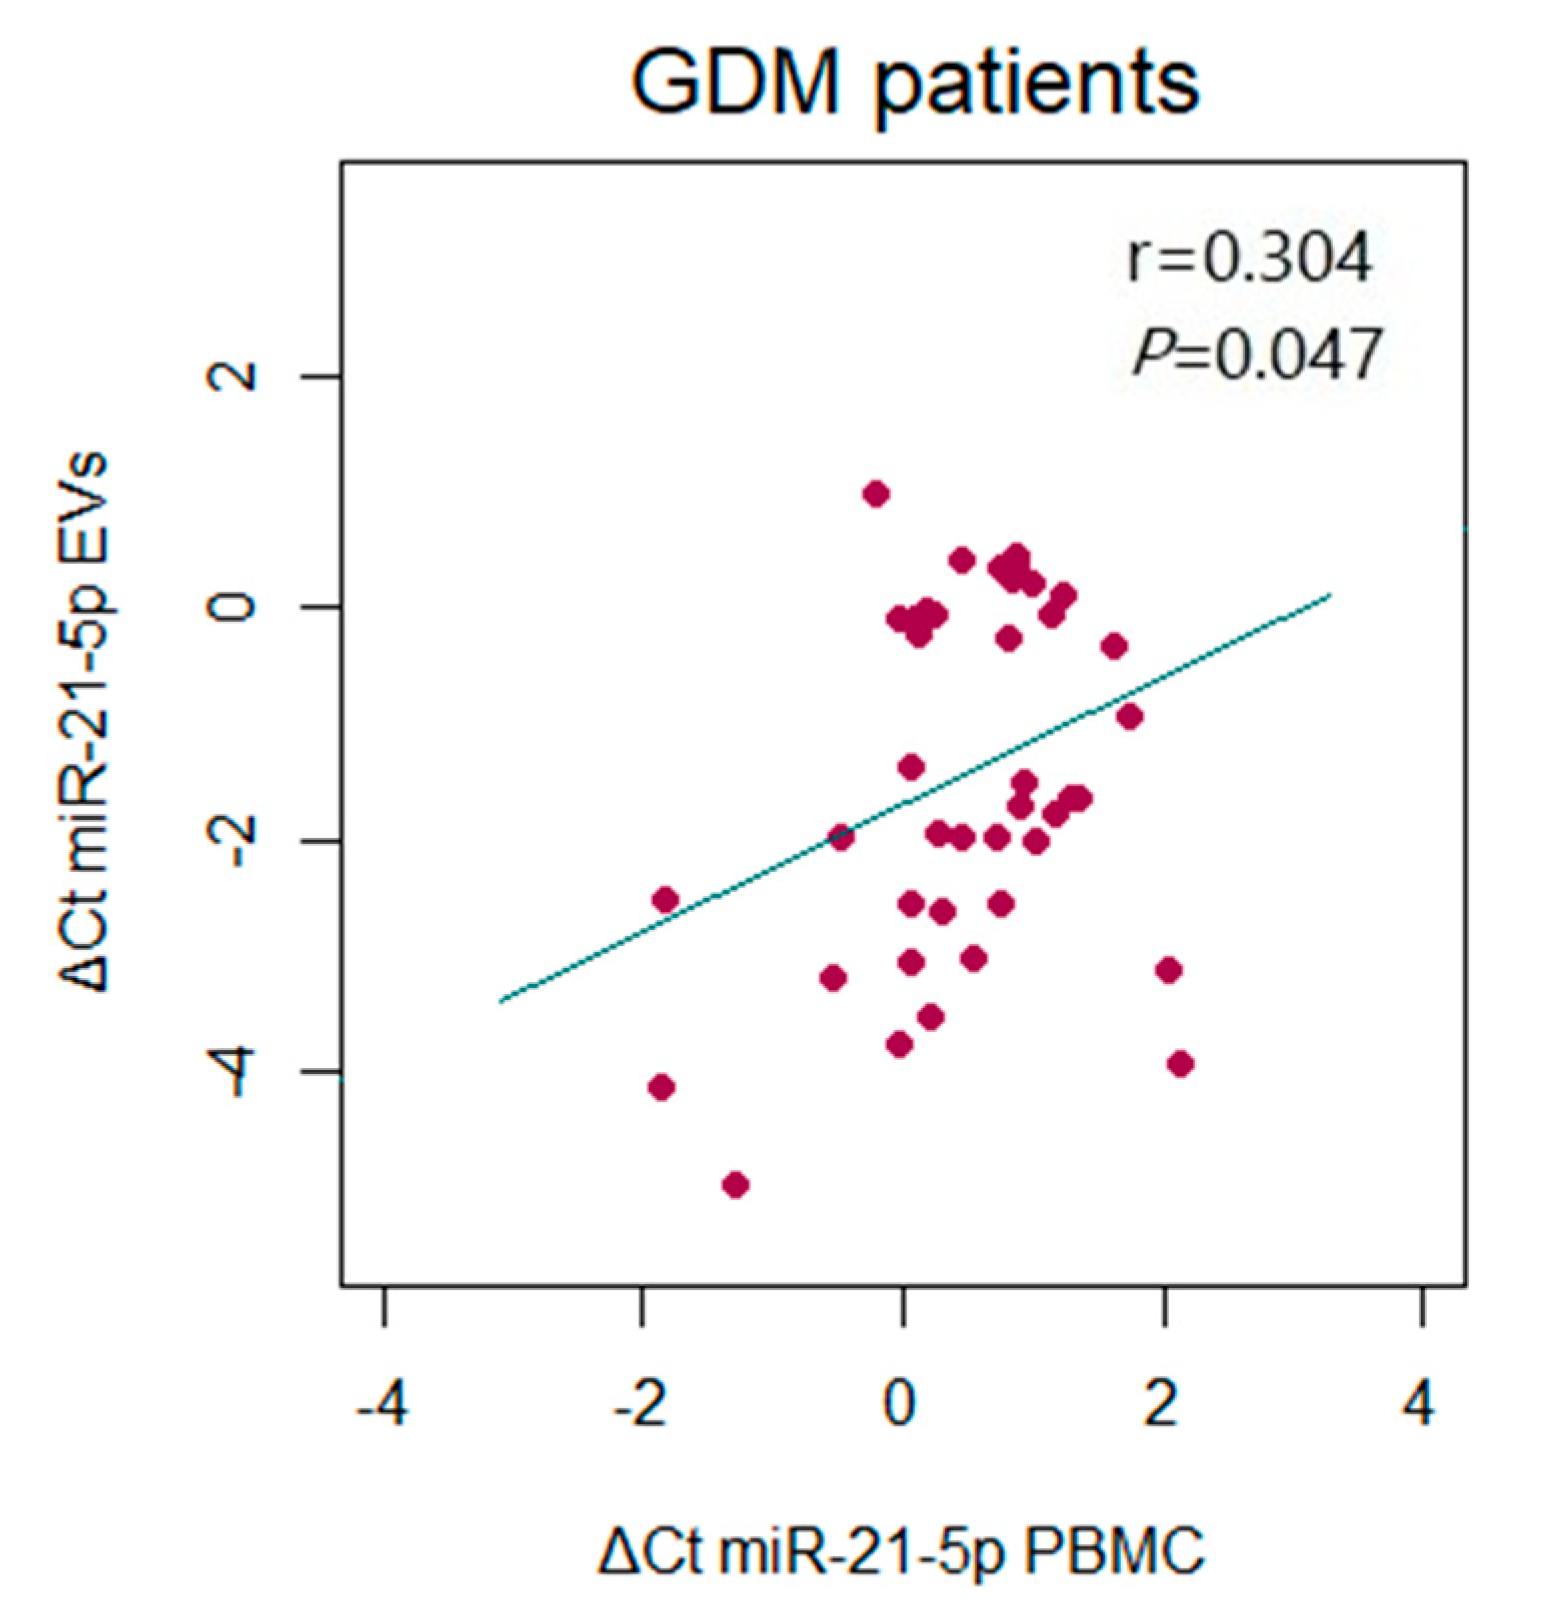
2. Results
3. Discussion
4. Materials and Methods
4.1. Isolation of Peripheral Blood Mononuclear Cells
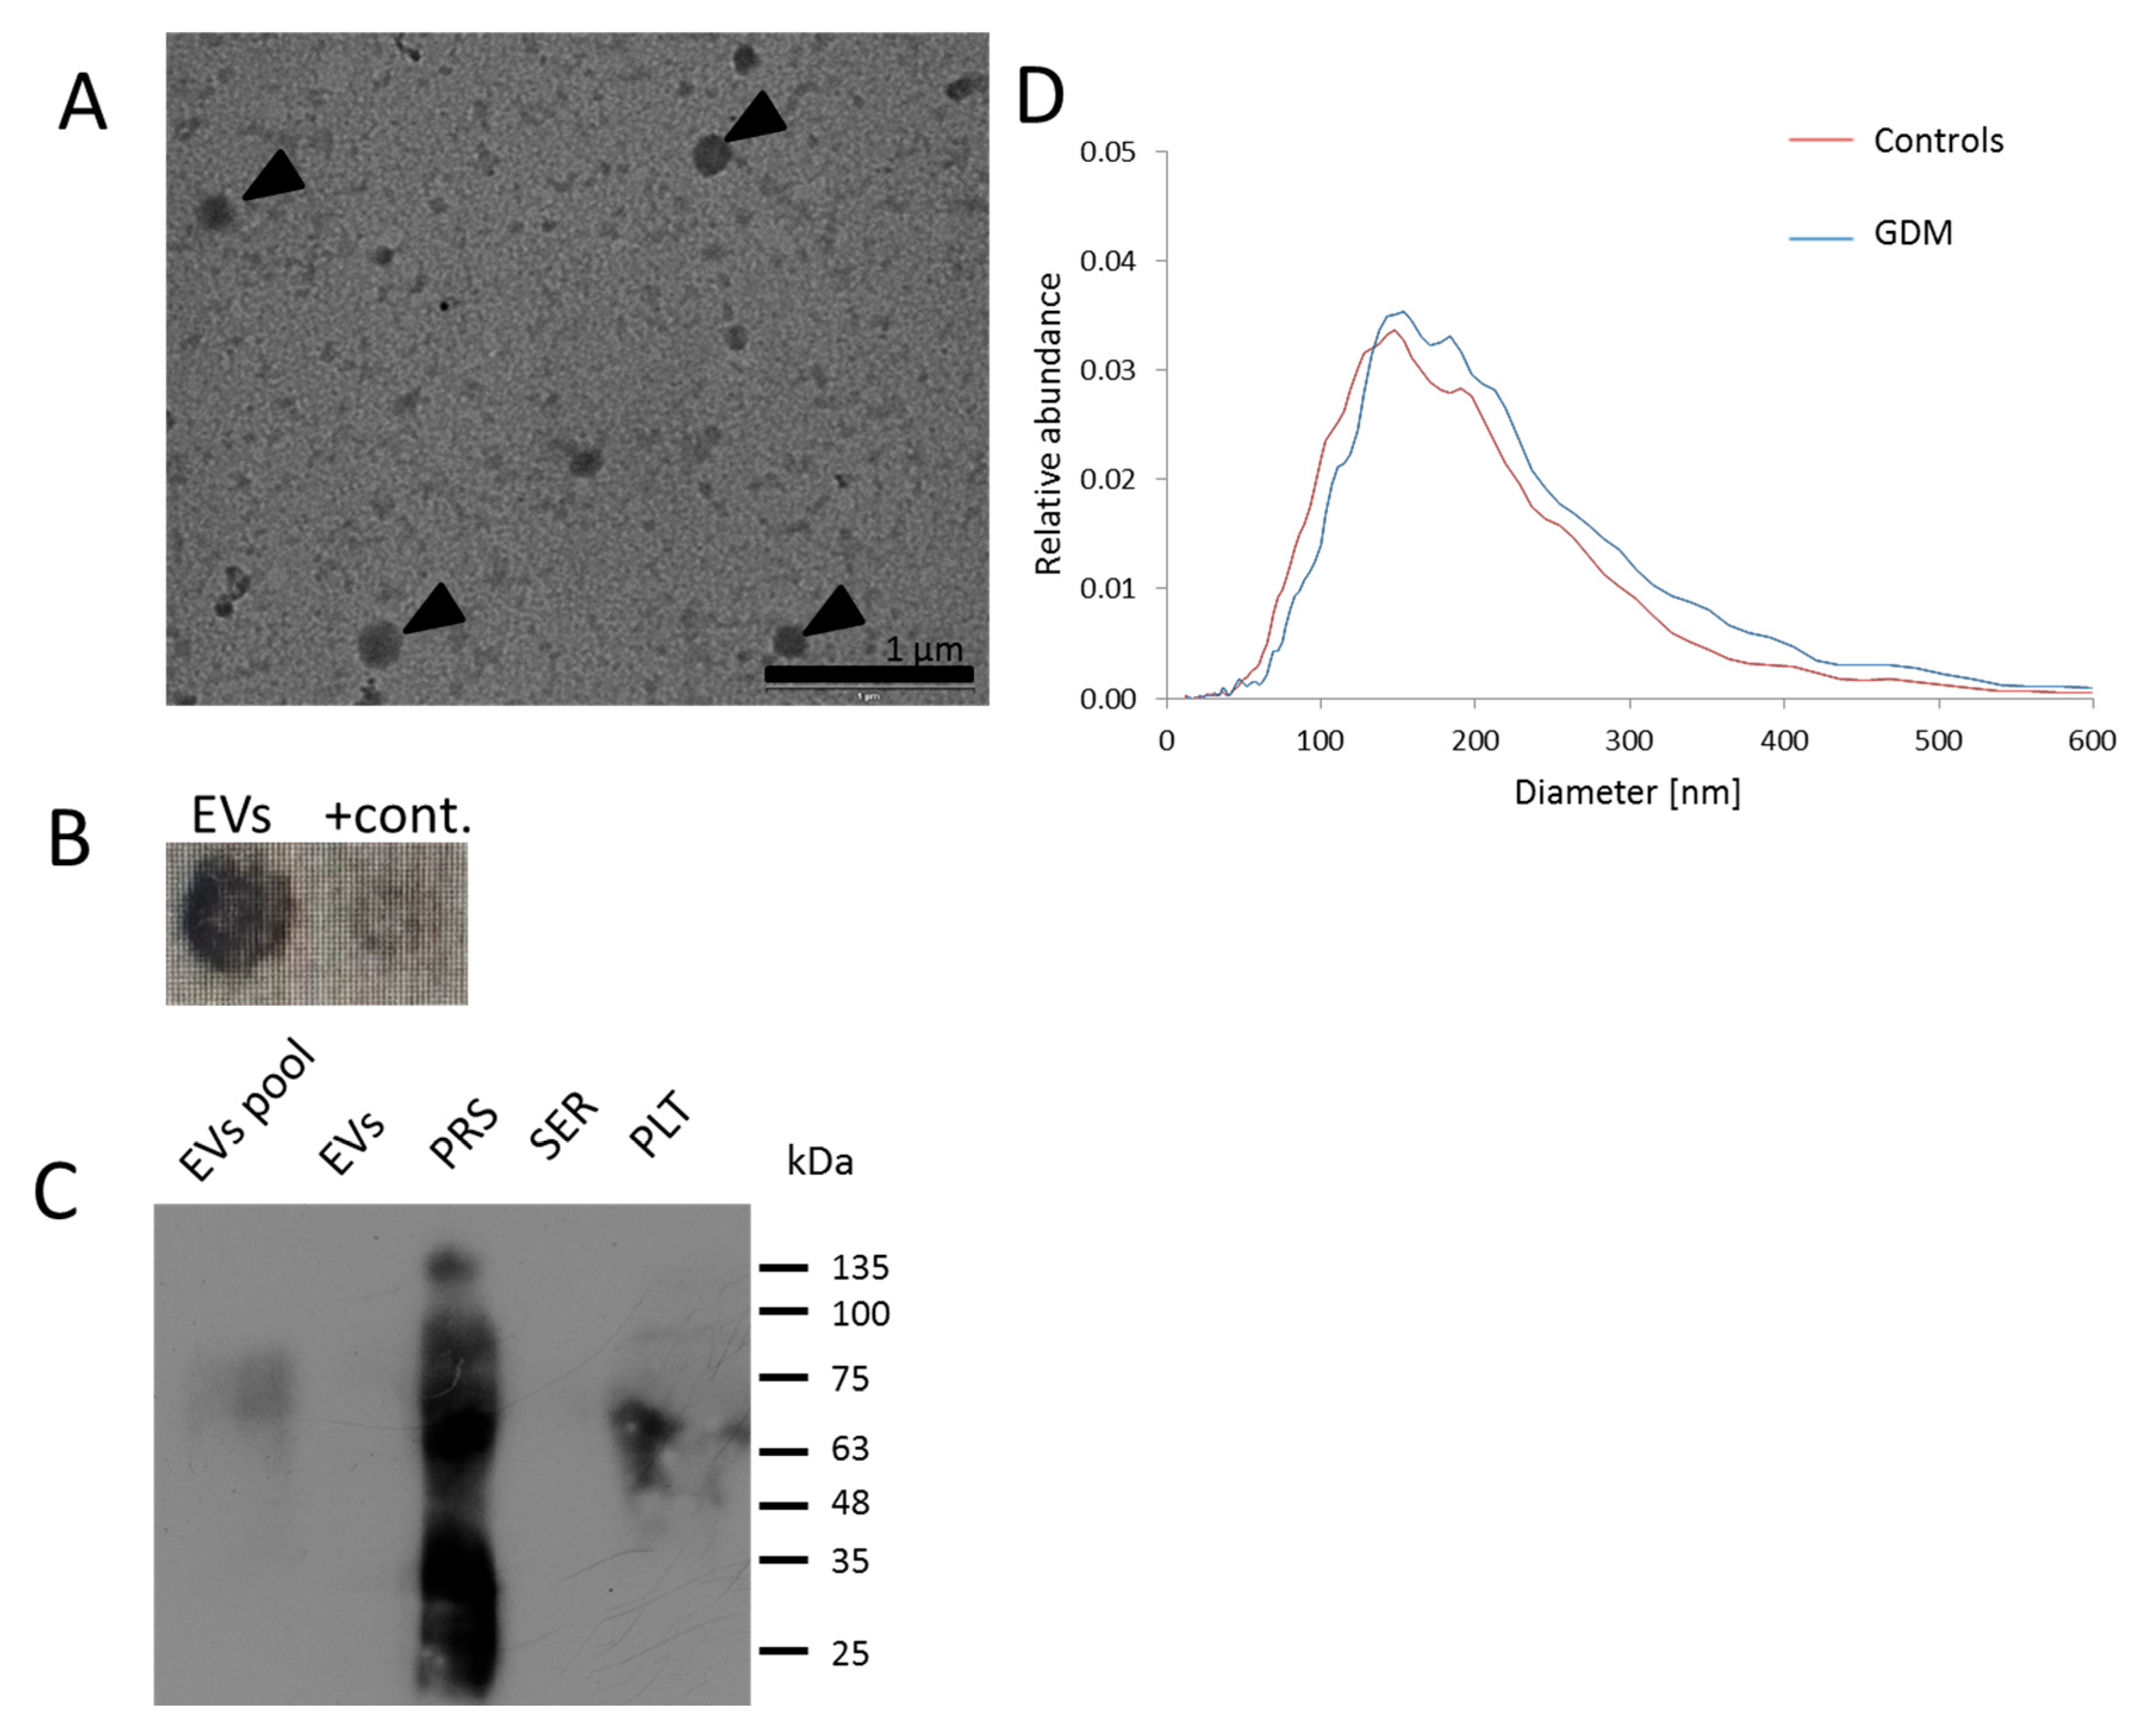
4.2. Isolation of EVs
4.3. Western Blot and Dot Blot Analysis
4.4. Transmission Electron Microscopy
4.5. Nanoparticle Tracking Analysis (NTA)
4.6. Isolation of Total RNA and Relative Quantification of microRNAs
4.7. Activities of Antioxidant Enzymes
4.8. Oxidative Modifications of Biomacromolecules
4.9. Statistical Analysis
Supplementary Materials
Author Contributions
Funding
Institutional Review Board Statement
Informed Consent Statement
Data Availability Statement
Conflicts of Interest
Abbreviations
| OS | Oxidative stress |
| IFM | Inflammation |
| GDM | Gestational diabetes |
| PBMCs | Peripheral blood mononuclear cells |
| EVs | Extracellular vesicles |
| IDF | International Diabetes Federation |
| T2DM | Type 2 diabetes |
| ROS | Reactive oxygen species |
| OGTT | Oral glucose tolerance test |
| OGC NF | Gynecology and Obstetrics Clinic “Narodni Front” |
| HbA1c | Glycated hemoglobin |
| HDL | High-density lipoprotein |
| LDL | Low-density lipoprotein |
| ALT | Alanine aminotransferase |
| AST | Aspartate aminotransferase |
| TIBC | Total iron-binding capacity |
| α2M | Alpha-2-macroglobulin |
| IUGR | Intrauterine fetal growth restriction |
| PBS | Phosphate-buffered saline |
| LSM | Lymphocyte separation medium |
| TEM | Transmission electron microscopy |
| NTA | Nanoparticle tracking analysis |
| GR | Glutathione reductase |
| SOD | Superoxide dismutase |
| CAT | Catalase |
| KB | Potassium phosphate buffer |
| DTNB | 5,5’-dithiobis(2-nitrobenzoic acid) |
| PCO | Protein carbonyl |
| DNPH | 2,4-dinitrophenylhydrazine |
| TCA | Trichloroacetic acid |
| SDS | Sodium dodecyl sulphate |
| TBARSs | Thiobarbituric acid-reactive substances |
| MCV | Mean corpuscular volume |
| MCH | Mean corpuscular hemoglobin |
| CRP | C-reactive protein |
| TIBC | Total iron binding capacity |
| T1DM | type 1 diabetes mellitus |
| HUVECs | human umbilical vein endothelial cells |
| EDTA | ethylenediaminetetraacetic acid |
| DEPC | diethyl pyrocarbonate |
References
- Wang, H.; Li, N.; Chivese, T.; Werfalli, M.; Sun, H.; Yuen, L.; Hoegfeldt, C.A.; Elise Powe, C.; Immanuel, J.; Karuranga, S.; et al. IDF Diabetes Atlas: Estimation of Global and Regional Gestational Diabetes Mellitus Prevalence for 2021 by International Association of Diabetes in Pregnancy Study Group’s Criteria. Diabetes Res. Clin. Pract. 2022, 183, 109050. [Google Scholar] [CrossRef] [PubMed]
- Moon, J.H.; Jang, H.C. Gestational Diabetes Mellitus: Diagnostic Approaches and Maternal-Offspring Complications. Diabetes Metab. J. 2022, 46, 3–14. [Google Scholar] [CrossRef] [PubMed]
- Karami, M.; Mousavi, S.H.; Rafiee, M.; Heidari, R.; Shahrokhi, S.Z. Biochemical and molecular biomarkers: Unraveling their role in gestational diabetes mellitus. Diabetol. Metab. Syndr. 2023, 15, 5. [Google Scholar] [CrossRef] [PubMed]
- Dinesen, S.; El-Faitarouni, A.; Dalgaard, L.T. Circulating microRNAs associated with gestational diabetes mellitus: Useful biomarkers? J. Endocrinol. 2022, 256, e220170. [Google Scholar] [CrossRef] [PubMed]
- Dinesen, S.; El-Faitarouni, A.; Frisk, N.L.S.; Sørensen, A.E.; Dalgaard, L.T. Circulating microRNA as Biomarkers for Gestational Diabetes Mellitus-A Systematic Review and Meta-Analysis. Int. J. Mol. Sci. 2023, 24, 6186. [Google Scholar] [CrossRef] [PubMed]
- Liu, Z.N.; Jiang, Y.; Liu, X.Q.; Yang, M.M.; Chen, C.; Zhao, B.H.; Huang, H.F.; Luo, Q. MiRNAs in Gestational Diabetes Mellitus: Potential Mechanisms and Clinical Applications. J. Diabetes Res. 2021, 2021, 4632745. [Google Scholar] [CrossRef] [PubMed]
- Légaré, C.; Clément, A.A.; Desgagné, V.; Thibeault, K.; White, F.; Guay, S.P.; Arsenault, B.J.; Scott, M.S.; Jacques, P.É.; Perron, P.; et al. Human plasma pregnancy-associated miRNAs and their temporal variation within the first trimester of pregnancy. Reprod. Biol. Endocrinol. 2022, 20, 14. [Google Scholar] [CrossRef] [PubMed]
- Kamity, R.; Sharma, S.; Hanna, N. MicroRNA-Mediated Control of Inflammation and Tolerance in Pregnancy. Front. Immunol. 2019, 10, 718. [Google Scholar] [CrossRef] [PubMed]
- Hayder, H.; O’Brien, J.; Nadeem, U.; Peng, C. MicroRNAs: Crucial regulators of placental development. Reproduction 2018, 155, R259–R271. [Google Scholar] [CrossRef] [PubMed]
- Owen, M.D.; Kennedy, M.G.; Quilang, R.C.; Scott, E.M.; Forbes, K. The role of microRNAs in pregnancies complicated by maternal diabetes. Clin. Sci. 2024, 138, 1179–1207. [Google Scholar] [CrossRef] [PubMed]
- Vezza, T.; de Marañón, A.M.; Canet, F.; Díaz-Pozo, P.; Marti, M.; D’Ocon, P.; Apostolova, N.; Rocha, M.; Víctor, V.M. MicroRNAs and Oxidative Stress: An Intriguing Crosstalk to Be Exploited in the Management of Type 2 Diabetes. Antioxidants 2021, 10, 802. [Google Scholar] [CrossRef] [PubMed]
- Nejad, C.; Stunden, H.J.; Gantier, M.P. A guide to miRNAs in inflammation and innate immune responses. FEBS J. 2018, 285, 3695–3716. [Google Scholar] [CrossRef] [PubMed]
- Saucedo, R.; Ortega-Camarillo, C.; Ferreira-Hermosillo, A.; Díaz-Velázquez, M.F.; Meixueiro-Calderón, C.; Valencia-Ortega, J. Role of Oxidative Stress and Inflammation in Gestational Diabetes Mellitus. Antioxidants 2023, 12, 1812. [Google Scholar] [CrossRef] [PubMed]
- Yang, Y.; Wu, N. Gestational Diabetes Mellitus and Preeclampsia: Correlation and Influencing Factors. Front. Cardiovasc. Med. 2022, 9, 831297. [Google Scholar] [CrossRef] [PubMed]
- Guarino, E.; Delli Poggi, C.; Grieco, G.E.; Cenci, V.; Ceccarelli, E.; Crisci, I.; Sebastiani, G.; Dotta, F. Circulating MicroRNAs as Biomarkers of Gestational Diabetes Mellitus: Updates and Perspectives. Int. J. Endocrinol. 2018, 2018, 6380463. [Google Scholar] [CrossRef] [PubMed]
- Manoel-Caetano, F.S.; Xavier, D.J.; Evangelista, A.F.; Takahashi, P.; Collares, C.V.; Puthier, D.; Foss-Freitas, M.C.; Foss, M.C.; Donadi, E.A.; Passos, G.A.; et al. Gene expression profiles displayed by peripheral blood mononuclear cells from patients with type 2 diabetes mellitus focusing on biological processes implicated on the pathogenesis of the disease. Gene 2012, 511, 151–160. [Google Scholar] [CrossRef] [PubMed]
- Mazloom, H.; Alizadeh, S.; Pasalar, P.; Esfahani, E.N.; Meshkani, R. Downregulated microRNA-155 expression in peripheral blood mononuclear cells of type 2 diabetic patients is not correlated with increased inflammatory cytokine production. Cytokine 2015, 76, 403–408. [Google Scholar] [CrossRef] [PubMed]
- Radojičić, O.; Dobrijević, Z.; Robajac, D.; Gligorijević, N.; Mandić Marković, V.; Miković, Ž.; Nedić, O. Gestational Diabetes is Associated with an Increased Expression of miR-27a in Peripheral Blood Mononuclear Cells. Mol. Diagn. Ther. 2022, 26, 421–435. [Google Scholar] [CrossRef] [PubMed]
- Monserrat-Mesquida, M.; Quetglas-Llabrés, M.; Bouzas, C.; Capó, X.; Mateos, D.; Ugarriza, L.; Tur, J.A.; Sureda, A. Peripheral Blood Mononuclear Cells Oxidative Stress and Plasma Inflammatory Biomarkers in Adults with Normal Weight, Overweight and Obesity. Antioxidants 2021, 10, 813. [Google Scholar] [CrossRef] [PubMed]
- Restaino, R.M.; Deo, S.H.; Parrish, A.R.; Fadel, P.J.; Padilla, J. Increased monocyte-derived reactive oxygen species in type 2 diabetes: Role of endoplasmic reticulum stress. Exp. Physiol. 2017, 102, 139–153. [Google Scholar] [CrossRef] [PubMed]
- Stirm, L.; Huypens, P.; Sass, S.; Batra, R.; Fritsche, L.; Brucker, S.; Abele, H.; Hennige, A.M.; Theis, F.; Beckers, J.; et al. Maternal whole blood cell miRNA-340 is elevated in gestational diabetes and inversely regulated by glucose and insulin. Sci. Rep. 2018, 8, 1366. [Google Scholar] [CrossRef] [PubMed]
- Chan, S.F.; Cheng, H.; Goh, K.K.; Zou, R. Preanalytic Methodological Considerations and Sample Quality Control of Circulating miRNAs. J. Mol. Diagn. 2023, 25, 438–453. [Google Scholar] [CrossRef] [PubMed]
- Vashukova, E.S.; Kozyulina, P.Y.; Illarionov, R.A.; Yurkina, N.O.; Pachuliia, O.V.; Butenko, M.G.; Postnikova, T.B.; Ivanova, L.A.; Eremeeva, D.R.; Zainulina, M.S.; et al. High-Throughput Sequencing of Circulating MicroRNAs in Plasma and Serum during Pregnancy Progression. Life 2021, 11, 1055. [Google Scholar] [CrossRef] [PubMed]
- Fumimoto, C.; Yamauchi, N.; Minagawa, E.; Umeda, M. MiR-146a Is Mutually Regulated by High Glucose-Induced Oxidative Stress in Human Periodontal Ligament Cells. Int. J. Mol. Sci. 2024, 25, 10702. [Google Scholar] [CrossRef] [PubMed]
- Zhao, W.; Spiers, J.G.; Vassileff, N.; Khadka, A.; Jaehne, E.J.; van den Buuse, M.; Hill, A.F. microRNA-146a modulates behavioural activity, neuroinflammation, and oxidative stress in adult mice. Mol. Cell Neurosci. 2023, 124, 103820. [Google Scholar] [CrossRef] [PubMed]
- Gilyazova, I.; Asadullina, D.; Kagirova, E.; Sikka, R.; Mustafin, A.; Ivanova, E.; Bakhtiyarova, K.; Gilyazova, G.; Gupta, S.; Khusnutdinova, E.; et al. MiRNA-146a-A Key Player in Immunity and Diseases. Int. J. Mol. Sci. 2023, 24, 12767. [Google Scholar] [CrossRef] [PubMed]
- Hu, J.; Huang, S.; Liu, X.; Zhang, Y.; Wei, S.; Hu, X. miR-155: An Important Role in Inflammation Response. J. Immunol. Res. 2022, 2022, 7437281. [Google Scholar] [CrossRef] [PubMed]
- Zhang, R.L.; Wang, W.M.; Li, J.Q.; Li, R.W.; Zhang, J.; Wu, Y.; Liu, Y. The role of miR-155 in cardiovascular diseases: Potential diagnostic and therapeutic targets. Int. J. Cardiol. Cardiovasc. Risk Prev. 2024, 24, 200355. [Google Scholar] [CrossRef] [PubMed]
- Onodera, Y.; Teramura, T.; Takehara, T.; Obora, K.; Mori, T.; Fukuda, K. miR-155 induces ROS generation through downregulation of antioxidation-related genes in mesenchymal stem cells. Aging Cell 2017, 16, 1369–1380. [Google Scholar] [CrossRef] [PubMed]
- Sheedy, F.J. Turning 21: Induction of miR-21 as a Key Switch in the Inflammatory Response. Front. Immunol. 2015, 6, 19. [Google Scholar] [CrossRef] [PubMed]
- La Sala, L.; Mrakic-Sposta, S.; Micheloni, S.; Prattichizzo, F.; Ceriello, A. Glucose-sensing microRNA-21 disrupts ROS homeostasis and impairs antioxidant responses in cellular glucose variability. Cardiovasc. Diabetol. 2018, 17, 105. [Google Scholar] [CrossRef] [PubMed]
- Qi, Y.; Cui, S.; Liu, L.; Liu, B.; Wang, T.; Yan, S.; Tian, H.; Huang, X. Expression and role of miR-146a and SMAD4 in placental tissue of pregnant women with preeclampsia. J. Obstet. Gynaecol. Res. 2022, 48, 2151–2161. [Google Scholar] [CrossRef] [PubMed]
- Lv, Q.; Wang, Y.; Tian, W.; Liu, Y.; Gu, M.; Jiang, X.; Cai, Y.; Huo, R.; Li, Y.; Li, L.; et al. Exosomal miR-146a-5p derived from human umbilical cord mesenchymal stem cells can alleviate antiphospholipid antibody-induced trophoblast injury and placental dysfunction by regulating the TRAF6/NF-κB axis. J. Nanobiotechnol. 2023, 21, 419. [Google Scholar] [CrossRef] [PubMed]
- Zhong, X.; Jiang, Y.Z.; Liu, P.; He, W.; Xiong, Z.; Chang, W.; Zhu, J.; Cui, Q. Toll-like 4 receptor /NFκB inflammatory/miR-146a pathway contributes to the ART-correlated preterm birth outcome. Oncotarget 2016, 7, 72475–72485. [Google Scholar] [CrossRef] [PubMed]
- Wang, Z.; Liu, D.; Dai, Y.; Li, R.; Zheng, Y.; Zhao, G.; Wang, J.; Diao, Z.; Cao, C.; Lv, H.; et al. Elevated Placental microRNA-155 Is a Biomarker of a Preeclamptic Subtype. Hypertension 2023, 80, 370–384. [Google Scholar] [CrossRef] [PubMed]
- Azizi, F.; Saleh Gargari, S.; Asadi Shahmirzadi, S.; Dodange, F.; Amiri, V.; Mirfakhraie, R.; Omrani, M.D. Evaluation of Placental mir-155-5p and Long Non-coding RNA sONE Expression in Patients with Severe Pre-eclampsia. Int. J. Mol. Cell Med. 2017, 6, 22–30. [Google Scholar] [PubMed]
- Wu, J.X.; Shi, M.; Gong, B.M.; Ji, B.W.; Hu, C.C.; Wang, G.C.; Lei, L.; Tang, C.; Sun, L.V.; Wu, X.H.; et al. An miRNA-mRNA integrative analysis in human placentas and mice: Role of the Smad2/miR-155-5p axis in the development of fetal growth restriction. Front. Bioeng. Biotechnol. 2023, 11, 1159805. [Google Scholar] [CrossRef] [PubMed]
- Zhang, H.; Jiang, Y.; Zhu, S.; Wei, L.; Zhou, X.; Gao, P.; Zhang, J.; Chen, Y.; Du, Y.; Fang, C.; et al. MiR-155-5p improves the insulin sensitivity of trophoblasts by targeting CEBPB in gestational diabetes mellitus. Placenta 2024, 148, 1–11. [Google Scholar] [CrossRef] [PubMed]
- Li, X.; Li, C.; Dong, X.; Gou, W. MicroRNA-155 inhibits migration of trophoblast cells and contributes to the pathogenesis of severe preeclampsia by regulating endothelial nitric oxide synthase. Mol. Med. Rep. 2014, 10, 550–554. [Google Scholar] [CrossRef] [PubMed]
- Dai, Y.; Qiu, Z.; Diao, Z.; Shen, L.; Xue, P.; Sun, H.; Hu, Y. MicroRNA-155 inhibits proliferation and migration of human extravillous trophoblast derived HTR-8/SVneo cells via down-regulating cyclin D1. Placenta 2012, 33, 824–829. [Google Scholar] [CrossRef] [PubMed]
- Shen, L.; Li, Y.; Li, R.; Diao, Z.; Yany, M.; Wu, M.; Sun, H.; Yan, G.; Hu, Y. Placenta-associated serum exosomal miR-155 derived from patients with preeclampsia inhibits eNOS expression in human umbilical vein endothelial cells. Int. J. Mol. Med. 2018, 41, 1731–1739. [Google Scholar] [CrossRef] [PubMed]
- Zhou, F.; Sun, Y.; Gao, Q.; Wang, H. microRNA-21 regulates the proliferation of placental cells via FOXM1 in preeclampsia. Exp. Ther. Med. 2020, 20, 1871–1878. [Google Scholar] [CrossRef] [PubMed]
- Chaiwangyen, W.; Ospina-Prieto, S.; Photini, S.M.; Schleussner, E.; Markert, U.R.; Morales-Prieto, D.M. Dissimilar microRNA-21 functions and targets in trophoblastic cell lines of different origin. Int. J. Biochem. Cell Biol. 2015, 68, 187–196. [Google Scholar] [CrossRef] [PubMed]
- Zhang, J.T.; Cai, Q.Y.; Ji, S.S.; Zhang, H.X.; Wang, Y.H.; Yan, H.T.; Yang, X.J. Decreased miR-143 and increased miR-21 placental expression levels are associated with macrosomia. Mol. Med. Rep. 2016, 13, 3273–3280. [Google Scholar] [CrossRef] [PubMed]
- Li, X.; Dai, A.; Tran, R.; Wang, J. Text mining-based identification of promising miRNA biomarkers for diabetes mellitus. Front. Endocrinol. 2023, 14, 1195145. [Google Scholar] [CrossRef] [PubMed]
- Stevanović, J.; Petrović, U.; Penezić, A.; Radojičić, O.; Ardalić, D.; Mandić, M.; Mandić-Marković, V.; Miković, Ž.; Brkušanin, M.; Nedić, O.; et al. LncRNAs Involved in Antioxidant Response Regulation as Biomarkers of Gestational Diabetes: A Study on H19, MALAT1 and MEG3. Antioxidants 2024, 13, 1503. [Google Scholar] [CrossRef] [PubMed]
- Ghaffari, M.; Razi, S.; Zalpoor, H.; Nabi-Afjadi, M.; Mohebichamkhorami, F.; Zali, H. Association of MicroRNA-146a with Type 1 and 2 Diabetes and their Related Complications. J. Diabetes Res. 2023, 2023, 2587104. [Google Scholar] [CrossRef] [PubMed]
- Hromadnikova, I.; Kotlabova, K.; Hympanova, L.; Krofta, L. Gestational hypertension, preeclampsia and intrauterine growth restriction induce dysregulation of cardiovascular and cerebrovascular disease associated microRNAs in maternal whole peripheral blood. Thromb. Res. 2016, 137, 126–140. [Google Scholar] [CrossRef] [PubMed]
- Feng, B.; Chen, S.; McArthur, K.; Wu, Y.; Sen, S.; Ding, Q.; Feldman, R.D.; Chakrabarti, S. miR-146a-Mediated extracellular matrix protein production in chronic diabetes complications. Diabetes 2011, 60, 2975–2984. [Google Scholar] [CrossRef] [PubMed]
- Kamali, K.; Korjan, E.S.; Eftekhar, E.; Malekzadeh, K.; Soufi, F.G. The role of miR-146a on NF-κB expression level in human umbilical vein endothelial cells under hyperglycemic condition. Bratisl. Lekárske Listy 2016, 117, 376–380. [Google Scholar] [CrossRef] [PubMed]
- Banerjee, J.; Dhas, Y.; Roy, S.; Mishra, N. Effect of glycemic control and duration of type 2 diabetes on circulatory miR-146a in middle-aged Indians. Int. J. Diabetes Dev. Ctries 2023, 43, 829–834. [Google Scholar] [CrossRef]
- Simionescu, N.; Niculescu, L.S.; Carnuta, M.G.; Sanda, G.M.; Stancu, C.S.; Popescu, A.C.; Popescu, M.R.; Vlad, A.; Dimulescu, D.R.; Simionescu, M.; et al. Hyperglycemia Determines Increased Specific MicroRNAs Levels in Sera and HDL of Acute Coronary Syndrome Patients and Stimulates MicroRNAs Production in Human Macrophages. PLoS ONE 2016, 11, e0161201. [Google Scholar] [CrossRef] [PubMed]
- Mensà, E.; Giuliani, A.; Matacchione, G.; Gurău, F.; Bonfigli, A.R.; Romagnoli, F.; De Luca, M.; Sabbatinelli, J.; Olivieri, F. Circulating miR-146a in healthy aging and type 2 diabetes: Age- and gender-specific trajectories. Mech. Ageing Dev. 2019, 180, 1–10. [Google Scholar] [CrossRef] [PubMed]
- Krishnan, P.; Branco, R.C.S.; Weaver, S.A.; Chang, G.; Lee, C.C.; Syed, F.; Evans-Molina, C. miR-146a-5p mediates inflammation-induced β cell mitochondrial dysfunction and apoptosis. bioRxiv 2024. [Google Scholar] [CrossRef] [PubMed]
- Tagoma, A.; Alnek, K.; Kirss, A.; Uibo, R.; Haller-Kikkatalo, K. MicroRNA profiling of second trimester maternal plasma shows upregulation of miR-195-5p in patients with gestational diabetes. Gene 2018, 672, 137–142. [Google Scholar] [CrossRef] [PubMed]
- Chen, M.; Yan, J. A preliminary integrated analysis of miRNA-mRNA expression profiles reveals a role of miR-146a-3p/TRAF6 in plasma from gestational diabetes mellitus patients. Ginekol. Pol. 2024, 95, 627–635. [Google Scholar] [CrossRef] [PubMed]
- Pheiffer, C.; Dias, S.; Rheeder, P.; Adam, S. Screening for Gestational Diabetes Mellitus: The Potential of MicroRNAs. In Gestational Diabetes Mellitus—An Overview with Some Recent Advances; Ray, A., Ed.; IntechOpen: Rijeka, Croatia, 2020. [Google Scholar] [CrossRef]
- Rezazadeh-Gavgani, E.; Oladghaffari, M.; Bahramian, S.; Majidazar, R.; Dolati, S. MicroRNA-21: A critical underestimated molecule in diabetic retinopathy. Gene 2023, 859, 147212. [Google Scholar] [CrossRef] [PubMed]
- Liu, R.; Liu, C.; He, X.; Sun, P.; Zhang, B.; Yang, H.; Shi, W.; Ruan, Q. MicroRNA-21 promotes pancreatic β cell function through modulating glucose uptake. Nat. Commun. 2022, 13, 3545. [Google Scholar] [CrossRef] [PubMed]
- Yazdanpanah, Z.; Kazemipour, N.; Kalantar, S.M.; Vahidi Mehrjardi, M.Y. Plasma miR-21 as a potential predictor in prediabetic individuals with a positive family history of type 2 diabetes mellitus. Physiol. Rep. 2022, 10, e15163. [Google Scholar] [CrossRef] [PubMed]
- La Sala, L.; Mrakic-Sposta, S.; Tagliabue, E.; Prattichizzo, F.; Micheloni, S.; Sangalli, E.; Specchia, C.; Uccellatore, A.C.; Lupini, S.; Spinetti, G.; et al. Circulating microRNA-21 is an early predictor of ROS-mediated damage in subjects with high risk of developing diabetes and in drug-naïve T2D. Cardiovasc. Diabetol. 2019, 18, 18. [Google Scholar] [CrossRef] [PubMed]
- Lakhter, A.J.; Pratt, R.E.; Moore, R.E.; Doucette, K.K.; Maier, B.F.; DiMeglio, L.A.; Sims, E.K. Beta cell extracellular vesicle miR-21-5p cargo is increased in response to inflammatory cytokines and serves as a biomarker of type 1 diabetes. Diabetologia 2018, 61, 1124–1134. [Google Scholar] [CrossRef] [PubMed]
- Gao, D.; Ren, L.; Hao, Y.D.; Schaduangrat, N.; Liu, X.W.; Yuan, S.S.; Yang, Y.H.; Wang, Y.; Shoombuatong, W.; Ding, H. The role of ncRNA regulatory mechanisms in diseases-case on gestational diabetes. Brief. Bioinform. 2023, 25, bbad489. [Google Scholar] [CrossRef] [PubMed]
- Li, J.; Gan, B.; Lu, L.; Chen, L.; Yan, J. Expression of microRNAs in patients with gestational diabetes mellitus: A systematic review and meta-analysis. Acta Diabetol. 2023, 60, 461–469. [Google Scholar] [CrossRef] [PubMed]
- Guan, C.Y.; Tian, S.; Cao, J.L.; Wang, X.Q.; Ma, X.; Xia, H.F. Down-Regulated miR-21 in Gestational Diabetes Mellitus Placenta Induces PPAR-α to Inhibit Cell Proliferation and Infiltration. Diabetes Metab. Syndr. Obes. 2020, 13, 3009–3034. [Google Scholar] [CrossRef] [PubMed]
- Jamalpour, S.; Zain, S.M.; Vazifehmand, R.; Mohamed, Z.; Pung, Y.F.; Kamyab, H.; Omar, S.Z. Analysis of serum circulating MicroRNAs level in Malaysian patients with gestational diabetes mellitus. Sci. Rep. 2022, 12, 20295. [Google Scholar] [CrossRef] [PubMed]
- Kunysz, M.; Cieśla, M.; Darmochwał-Kolarz, D. Evaluation of miRNA Expression in Patients with Gestational Diabetes Mellitus: Investigating Diagnostic Potential and Clinical Implications. Diabetes Metab. Syndr. Obes. 2024, 17, 881–891. [Google Scholar] [CrossRef] [PubMed]
- Liu, D.; Zhang, Y.; Zhang, G.; Xie, C. Effects of Picroside Regulating the lncRNA-MALAT1/miR-21/PPAR Signaling Pathway in Fat Synthesis of Patients with Gestational Diabetes Mellitus. Int. J. Pharmacol. 2024, 20, 1063–1075. [Google Scholar] [CrossRef]
- Zhang, M.; Lu, Y.; Wang, L.; Mao, Y.; Hu, X.; Chen, Z. Autocrine small extracellular vesicles induce tubular phenotypic transformation in diabetic nephropathy via miR-21-5p. Gene 2025, 938, 149156. [Google Scholar] [CrossRef] [PubMed]
- Hocaoglu, M.; Demirer, S.; Senturk, H.; Turgut, A.; Komurcu-Bayrak, E. Differential expression of candidate circulating microRNAs in maternal blood leukocytes of the patients with preeclampsia and gestational diabetes mellitus. Pregnancy Hypertens. 2019, 17, 5–11. [Google Scholar] [CrossRef] [PubMed]
- Wessling-Resnick, M. Iron homeostasis and the inflammatory response. Annu. Rev. Nutr. 2010, 30, 105–122. [Google Scholar] [CrossRef] [PubMed]
- Linna-Kuosmanen, S.; Tomas Bosch, V.; Moreau, P.R.; Bouvy-Liivrand, M.; Niskanen, H.; Kansanen, E.; Kivelä, A.; Hartikainen, J.; Hippeläinen, M.; Kokki, H.; et al. NRF2 is a key regulator of endothelial microRNA expression under proatherogenic stimuli. Cardiovasc. Res. 2021, 117, 1339–1357. [Google Scholar] [CrossRef] [PubMed]
- Li, Y.; Duan, J.Z.; He, Q.; Wang, C.Q. miR-155 modulates high glucose-induced cardiac fibrosis via the Nrf2/HO-1 signaling pathway. Mol. Med. Rep. 2020, 22, 4003–4016. [Google Scholar] [CrossRef] [PubMed]
- Li, R.; Jia, Z.; Zhu, H. Regulation of Nrf2 Signaling. React. Oxyg. Species 2019, 8, 312–322. [Google Scholar] [CrossRef]
- Ji, G.; Lv, K.; Chen, H.; Wang, T.; Wang, Y.; Zhao, D.; Qu, L.; Li, Y. MiR-146a regulates SOD2 expression in H2O2 stimulated PC12 cells. PLoS ONE 2013, 8, e69351. [Google Scholar] [CrossRef] [PubMed]
- Smith, E.J.; Shay, K.P.; Thomas, N.O.; Butler, J.A.; Finlay, L.F.; Hagen, T.M. Age-related loss of hepatic Nrf2 protein homeostasis: Potential role for heightened expression of miR-146a. Free. Radic. Biol. Med. 2015, 89, 1184–1191. [Google Scholar] [CrossRef] [PubMed]
- Cui, Y.; She, K.; Tian, D.; Zhang, P.; Xin, X. miR-146a Inhibits Proliferation and Enhances Chemosensitivity in Epithelial Ovarian Cancer via Reduction of SOD2. Oncol. Res. 2016, 23, 275–282. [Google Scholar] [CrossRef] [PubMed]
- Hromadnikova, I.; Kotlabova, K.; Krofta, L. First-Trimester Screening for Fetal Growth Restriction and Small-for-Gestational-Age Pregnancies without Preeclampsia Using Cardiovascular Disease-Associated MicroRNA Biomarkers. Biomedicines 2022, 10, 718. [Google Scholar] [CrossRef] [PubMed]
- Jiang, C.R.; Tang, M.X.; Li, C.; Zhang, P. Relationship between the serum miR-21, PANDER, PAPP-A levels and adverse pregnancy outcomes in gestational diabetes mellitus. Yixue Xinzhi Zazhi 2024, 34, 897–905. [Google Scholar]
- Dan, M.A.; Lu, B.A. Expression and significance of lncRNA-HOTTIP and miR-21 in serum of patients with gestational diabetes mellitus. J. Clin. Hematol. 2022, 35, 108–111. [Google Scholar]
- Maccani, M.A.; Padbury, J.F.; Marsit, C.J. miR-16 and miR-21 expression in the placenta is associated with fetal growth. PLOS ONE 2011, 6, e21210. [Google Scholar] [CrossRef] [PubMed]
- Stevanović, J.; Robajac, D.; Nedić, O.; Dobrijević, Z. Post-TRIzol protein extraction from peripheral blood mononuclear cells. J. Serbian Chem. Soc. 2023, 88, 729–738. [Google Scholar] [CrossRef]
- Janković, T.; Goč, S.; Mitić, N.; Danilović Luković, J.; Janković, M. Membrane-associated gamma-glutamyl transferase and alkaline phosphatase in the context of concanavalin A- and wheat germ agglutinin-reactive glycans mark seminal prostasome populations from normozoospermic and oligozoospermic men. Upsala J. Med. Sci. 2020, 125, 10–18. [Google Scholar] [CrossRef] [PubMed]
- Matijašević Joković, S.; Dobrijević, Z.; Kotarac, N.; Filipović, L.; Popović, M.; Korać, A.; Vuković, I.; Savić-Pavićević, D.; Brajušković, G. MiR-375 and miR-21 as Potential Biomarkers of Prostate Cancer: Comparison of Matching Samples of Plasma and Exosomes. Genes 2022, 13, 2320. [Google Scholar] [CrossRef] [PubMed]
- Glatzle, D.; Vuilleumier, J.P.; Weber, F.; Decker, K. Glutathione reductase test with whole blood, a convenient procedure for the assessment of the riboflavin status in humans. Experientia 1974, 30, 665–667. [Google Scholar] [CrossRef] [PubMed]
- Beauchamp, C.; Fridovich, I. Superoxide dismutase: Improved assays and an assay applicable to acrylamide gels. Anal. Biochem. 1971, 44, 276–287. [Google Scholar] [CrossRef] [PubMed]
- Claiborne, A. Catalase Activity. In Handbook of Methods for Oxygen Radical Research; Greenwald, R.A., Ed.; CRC Press: Boca Raton, FL, USA, 1985; pp. 283–284. [Google Scholar]
- Levine, R.L.; Garland, D.; Oliver, C.N.; Amici, A.; Climent, I.; Lenz, A.G.; Ahn, B.W.; Shaltiel, S.; Stadtman, E.R. Determination of carbonyl content in oxidatively modified proteins. Methods Enzymol. 1990, 186, 464–478. [Google Scholar] [PubMed]

| Sample Type | miR-146a-5p | miR-155-5p | miR-21-5p | ||||
|---|---|---|---|---|---|---|---|
| r | p Value | r | p Value | r | p Value | ||
| PBMCs | Lipid profile | ||||||
| Triglycerides | −0.131 | 0.427 | −0.226 | 0.166 | −0.061 | 0.712 | |
| Cholesterol | −0.100 | 0.550 | −0.010 | 0.952 | 0.236 | 0.154 | |
| HDL | 0.065 | 0.664 | 0.154 | 0.301 | 0.091 | 0.548 | |
| LDL | 0.085 | 0.612 | 0.039 | 0.816 | 0.194 | 0.243 | |
| Glycemic profile | |||||||
| Fasting glucose | −0.037 | 0.805 | 0.114 | 0.445 | 0.018 | 0.905 | |
| OGTT 60′ | −0.144 | 0.334 | −0.012 | 0.936 | 0.062 | 0.682 | |
| OGTT 120′ | −0.094 | 0.530 | 0.036 | 0.810 | −0.049 | 0.746 | |
| Fasting insulin | 0.230 | 0.120 | 0.137 | 0.358 | 0.164 | 0.276 | |
| HOMA-IR | 0.230 | 0.138 | 0.137 | 0.381 | 0.130 | 0.412 | |
| HOMA-β | 0.134 | 0.392 | 0.114 | 0.447 | 0.224 | 0.154 | |
| HbA1c | 0.064 | 0.756 | 0.264 | 0.192 | −0.182 | 0.384 | |
| EVs | Lipid profile | ||||||
| Triglycerides | 0.166 | 0.306 | - | - | 0.298 | 0.065 | |
| Cholesterol | 0.051 | 0.755 | - | - | 0.241 | 0.139 | |
| HDL | 0.082 | 0.575 | - | - | −0.063 | 0.674 | |
| LDL | 0.007 | 0.956 | - | - | 0.173 | 0.292 | |
| Glycemic profile | |||||||
| Fasting glucose | 0.057 | 0.697 | - | - | 0.309 | 0.034 * | |
| OGTT 60′ | −0.023 | 0.875 | - | - | 0.139 | 0.351 | |
| OGTT 120′ | 0.178 | 0.221 | - | - | 0.352 | 0.015 | |
| Fasting insulin | −0.144 | 0.324 | - | - | 0.236 | 0.110 | |
| HOMA-IR | −0.116 | 0.453 | - | - | 0.282 | 0.070 | |
| HOMA-β | −0.183 | 0.234 | - | - | 0.111 | 0.484 | |
| HbA1c | −0.137 | 0.496 | - | - | 0.103 | 0.624 | |
| Sample Type | miR-146a-5p | miR-155-5p | miR-21-5p | ||||
|---|---|---|---|---|---|---|---|
| r | p Value | r | p Value | r | p Value | ||
| PBMCs | |||||||
| NRF2 mRNA | 0.096 | 0.521 | −0.059 | 0.521 | 0.183 | 0.223 | |
| NRF2 protein | 0.381 | 0.054 | 0.401 | 0.042 * | 0.396 | 0.050 | |
| GR (IU/mg Hgb) | 0.026 | 0.873 | 0.080 | 0.624 | 0.133 | 0.420 | |
| SOD (IU/mg Hgb) | 0.264 | 0.109 | −0.122 | 0.466 | 0.361 | 0.024 | |
| CAT (IU/mg Hgb) | 0.012 | 0.941 | 0.184 | 0.256 | −0.004 | 0.981 | |
| SH (mmol/g prot.) | 0.159 | 0.347 | −0.017 | 0.920 | −0.052 | 0.763 | |
| PCO (mmol/g prot.) | 0.057 | 0.791 | 0.224 | 0.293 | −0.111 | 0.614 | |
| TBARS (µmol/L) | 0.026 | 0.864 | −0.064 | 0.673 | 0.037 | 0.809 | |
| EVs | |||||||
| NRF2 mRNA | −0.357 | 0.012 | - | - | −0.132 | 0.376 | |
| NRF2 protein | 0.090 | 0.662 | - | - | 0.049 | 0.820 | |
| GR (IU/mg Hgb) | −0.139 | 0.399 | - | - | −0.069 | 0.681 | |
| SOD (IU/mg Hgb) | −0.400 | 0.011 | - | - | −0.204 | 0.219 | |
| CAT (IU/mg Hgb) | −0.279 | 0.077 | - | - | −0.066 | 0.686 | |
| SH (mmol/g prot.) | 0.279 | 0.090 | - | - | 0.211 | 0.210 | |
| PCO (mmol/g prot.) | −0.082 | 0.690 | - | - | 0.049 | 0.816 | |
| TBARS (µmol/L) | −0.238 | 0.107 | - | - | 0.059 | 0.700 | |
| Primer | Sequence | |
|---|---|---|
| RT-PCR | miR-191-5p-RT | 5′-GTCGTATCCAGTGCAGGGTCCGAGGTATTCGCACTGGATACGACCAGCTG-3′ |
| miR-146a-5p-RT | 5′-GTCGTATCCAGTGCAGGGTCCGAGGTATTCGCACTGGATACGACAACCCA-3′ | |
| miR-155-5p-RT | 5′-GTCGTATCCAGTGCAGGGTCCGAGGTATTCGCACTGGATACGACAACCCC-3′ | |
| miR-21-5p-RT | 5′-GTCGTATCCAGTGCAGGGTCCGAGGTATTCGCACTGGATACGACTCAACAT-3′ | |
| qPCR | Universal miR-rv | 5′-CCAGTGCAGGGTCCGAGGTAT-3′ |
| miR-191-5p-fw | 5′-CGCGGTCAACGGAATCCCAAAAG-3′ | |
| miR-146a-5p-fw | 5′-CGGCGGTTGAGAACTGAATTCCA-3′ | |
| miR-155-5p-fw | 5′-GGCGTTAATGCTAATCGTGATAG-3′ |
Disclaimer/Publisher’s Note: The statements, opinions and data contained in all publications are solely those of the individual author(s) and contributor(s) and not of MDPI and/or the editor(s). MDPI and/or the editor(s) disclaim responsibility for any injury to people or property resulting from any ideas, methods, instructions or products referred to in the content. |
© 2025 by the authors. Licensee MDPI, Basel, Switzerland. This article is an open access article distributed under the terms and conditions of the Creative Commons Attribution (CC BY) license (https://creativecommons.org/licenses/by/4.0/).
Share and Cite
Stevanović, J.; Mitić, N.; Penezić, A.; Radojičić, O.; Ardalić, D.; Mandić, M.; Mandić-Marković, V.; Miković, Ž.; Brkušanin, M.; Nedić, O.; et al. Upregulation of the Antioxidant Response-Related microRNAs miR-146a-5p and miR-21-5p in Gestational Diabetes: An Analysis of Matched Samples of Extracellular Vesicles and PBMCs. Int. J. Mol. Sci. 2025, 26, 6902. https://doi.org/10.3390/ijms26146902
Stevanović J, Mitić N, Penezić A, Radojičić O, Ardalić D, Mandić M, Mandić-Marković V, Miković Ž, Brkušanin M, Nedić O, et al. Upregulation of the Antioxidant Response-Related microRNAs miR-146a-5p and miR-21-5p in Gestational Diabetes: An Analysis of Matched Samples of Extracellular Vesicles and PBMCs. International Journal of Molecular Sciences. 2025; 26(14):6902. https://doi.org/10.3390/ijms26146902
Chicago/Turabian StyleStevanović, Jovana, Ninoslav Mitić, Ana Penezić, Ognjen Radojičić, Daniela Ardalić, Milica Mandić, Vesna Mandić-Marković, Željko Miković, Miloš Brkušanin, Olgica Nedić, and et al. 2025. "Upregulation of the Antioxidant Response-Related microRNAs miR-146a-5p and miR-21-5p in Gestational Diabetes: An Analysis of Matched Samples of Extracellular Vesicles and PBMCs" International Journal of Molecular Sciences 26, no. 14: 6902. https://doi.org/10.3390/ijms26146902
APA StyleStevanović, J., Mitić, N., Penezić, A., Radojičić, O., Ardalić, D., Mandić, M., Mandić-Marković, V., Miković, Ž., Brkušanin, M., Nedić, O., & Dobrijević, Z. (2025). Upregulation of the Antioxidant Response-Related microRNAs miR-146a-5p and miR-21-5p in Gestational Diabetes: An Analysis of Matched Samples of Extracellular Vesicles and PBMCs. International Journal of Molecular Sciences, 26(14), 6902. https://doi.org/10.3390/ijms26146902