1. Introduction
Platelets, derived from megakaryocytes, contribute to haemostasis, thrombosis, and thrombo-inflammation via receptor-induced signalling responses [
1,
2,
3]. Physiologically important receptors are the protease-activated receptors (PAR1/4) for thrombin, the purinergic receptors (P2Y
1/12) for ADP, which signal as G-protein coupled receptors (GPCRs), and the glycoprotein VI (GPVI) receptor for collagen, acting as a protein tyrosine kinase-linked receptor (TKLR) [
4]. Since the activation and aggregation of platelets frequently drive arterial thrombotic complications [
5], which are prominent causes of death worldwide [
6], a clear understanding of the activation process is a must.
In platelets stimulated via GPCRs or TKLRs, rises in cytosolic [Ca
2+]
i are a common initial event, contributing to essentially all platelet functions [
7,
8]. The receptor-induced mobilisation of Ca
2+ from intracellular stores in the endoplasmic reticulum (or dense tubular system) proceeds via inositol 1,4,5-trisphosphate receptors (IP
3Rs), while sarcoplasmic/endoplasmic reticulum Ca
2+-ATPases (SERCAs) are responsible for the back pumping of Ca
2+ into the stores (
Figure S1) [
7,
8]. The IP
3R channels are operated via IP
3, which is produced as a result of activation of the GPCRs for thrombin [
9] and ADP [
10] and upon the activation of GPVI by collagen or collagen-related peptide (CRP) [
8].
In the process of store-operated Ca
2+ entry (SOCE), Ca
2+ store depletion is coupled to entry of Ca
2+ from the extracellular medium via Orai1 channels, which open upon interaction with the Ca
2+ sensor STIM1 (stromal interaction molecule 1) in the endoplasmic reticulum membrane [
7]. The back pumping of Ca
2+ over the plasma membrane occurs via plasma membrane Ca
2+-ATPases (PMCAs). Furthermore, primary agonists such as thrombin and CRP stimulate the release of autocrine agents, which enhance the Ca
2+ signalling process. Particularly relevant are the autocrine agents thromboxane A
2 (TxA
2) and ADP, both of which stimulate IP
3 production via GPCRs [
11]. Another paracrine-dependent Ca
2+ entry mechanism is provided by ATP, which activates P2X
1 channels that specifically mediate Ca
2+ entry [
12].
Several pharmacological inhibitors are known to interfere with platelet Ca
2+ responses. The entry of Ca
2+ from blood plasma is prevented by the Ca
2+ chelator EGTA. The back pumping of Ca
2+ from cytosol to intracellular stores is inhibited by the compound thapsigargin, which accordingly potentiates Orai1-STIM1-dependent entry [
7]. The effects of autocrine agents are suppressed by the addition of apyrase (degrading ATP and ADP) and indomethacin (blocking TxA
2 formation).
Figure S1 illustrates the actions of these platelet receptors, ligands, inhibitors, and channels relevant for the present study.
The high complexity of Ca
2+-related signalling in platelets has led to the development of mathematical models, aiming to better understand the process and identify therapeutic targets. Authors have combined the Ca
2+ fluxes in various platelet compartments into one model based on ordinary differential equations (ODEs) [
13]. Even though this system did not include ligand–receptor interactions, it consisted of 34 entities, 35 interactions, and 86 parameters, thus reflecting the complexity of the Ca
2+ signalling process. An alternative approach presented by Chatterjee and Diamond [
14] was to create a neural network model that was trained from the Ca
2+ response patterns to specific agonists. This neural network, acting as a black box, was able to predict synergistic effects on the Ca
2+ responses of up to six agonists. A trade-off of the network model was that all the parameters needed to be trained, and, hence, required extensive experimental data. Another limitation of the neural network approach was that it did not predict the contribution of each Ca
2+ channel and pump to the overall cytosolic [Ca
2+]
i level.
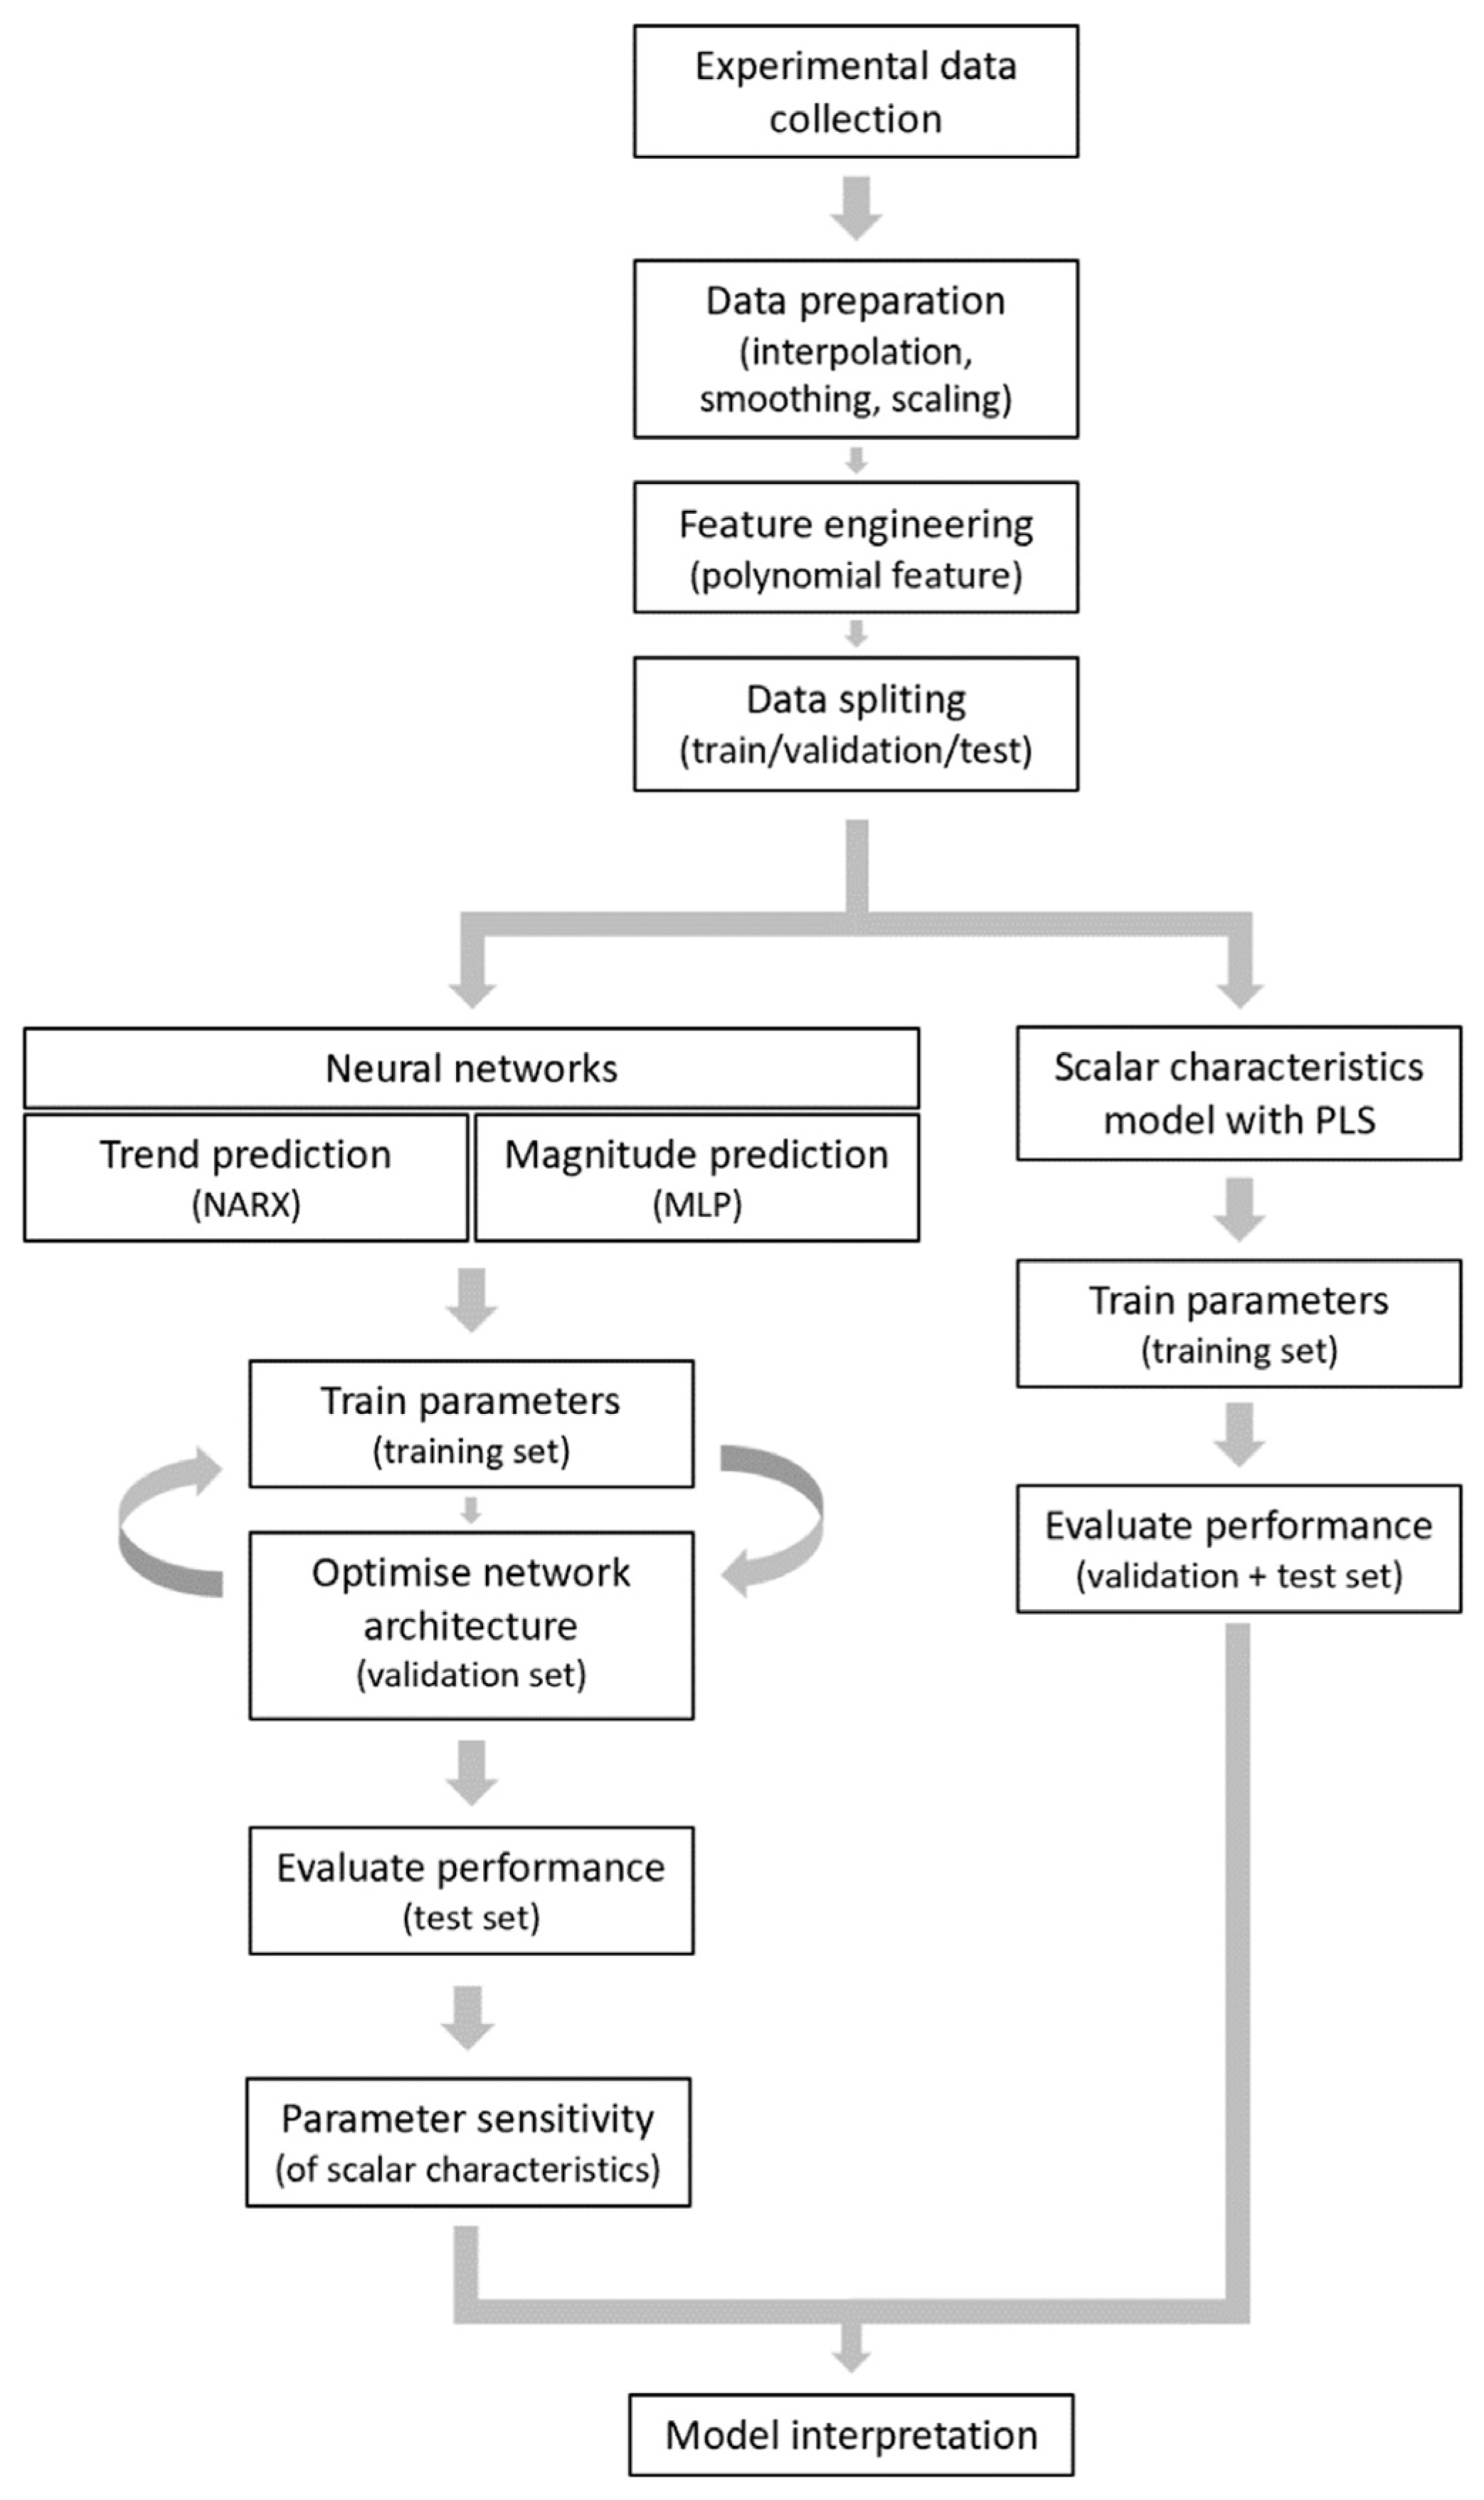
In the present study, we constructed computational models to predict the magnitude and shape of the [Ca2+]i time curves in platelets in response to collagen, thrombin, and CRP for a given set of experimental conditions in the absence or presence of known inhibitors. We first built two neural network models to predict agonist and inhibitor effects on the [Ca2+]i curves. We then used partial least square (PLS) regression analysis to better understand how specific curve variables contributed to the obtained response. To exclude inter-individual variation, we used a coherent set of Ca2+ response curves taken from the platelets of one healthy subject, checked to be representative for five healthy subjects.
3. Discussion
The combined modelling approaches presented here introduce a new way to predict the response size and pattern of agonist-induced platelet Ca
2+ responses under a great variety of conditions. The constructed MLP and NARX neural networks were able to produce mostly correct magnitude curves for [Ca
2+]
i, whereas the modelling by PLS regression captured the characteristic curve shapes. Our work thereby adds to the idea of a platelet Ca
2+ calculator introduced by Diamond and colleagues [
14], in that, now, curve patterns can also be predicted without mathematical modelling. However, we did not consider the synergistic effects of agonist combinations such as those presented in that study.
It is important to note that, while the present machine learning techniques were able to fit most of the input data, the obtained output did not give a direct biological interpretation. This is in contrast to modelling approaches based on biological concepts, such as enzyme and receptor reaction rates in ODE-based kinetic models. However, the latter approaches cannot easily capture the complex interactions between signalling steps, for instance due to combinations of agonists and inhibitors.
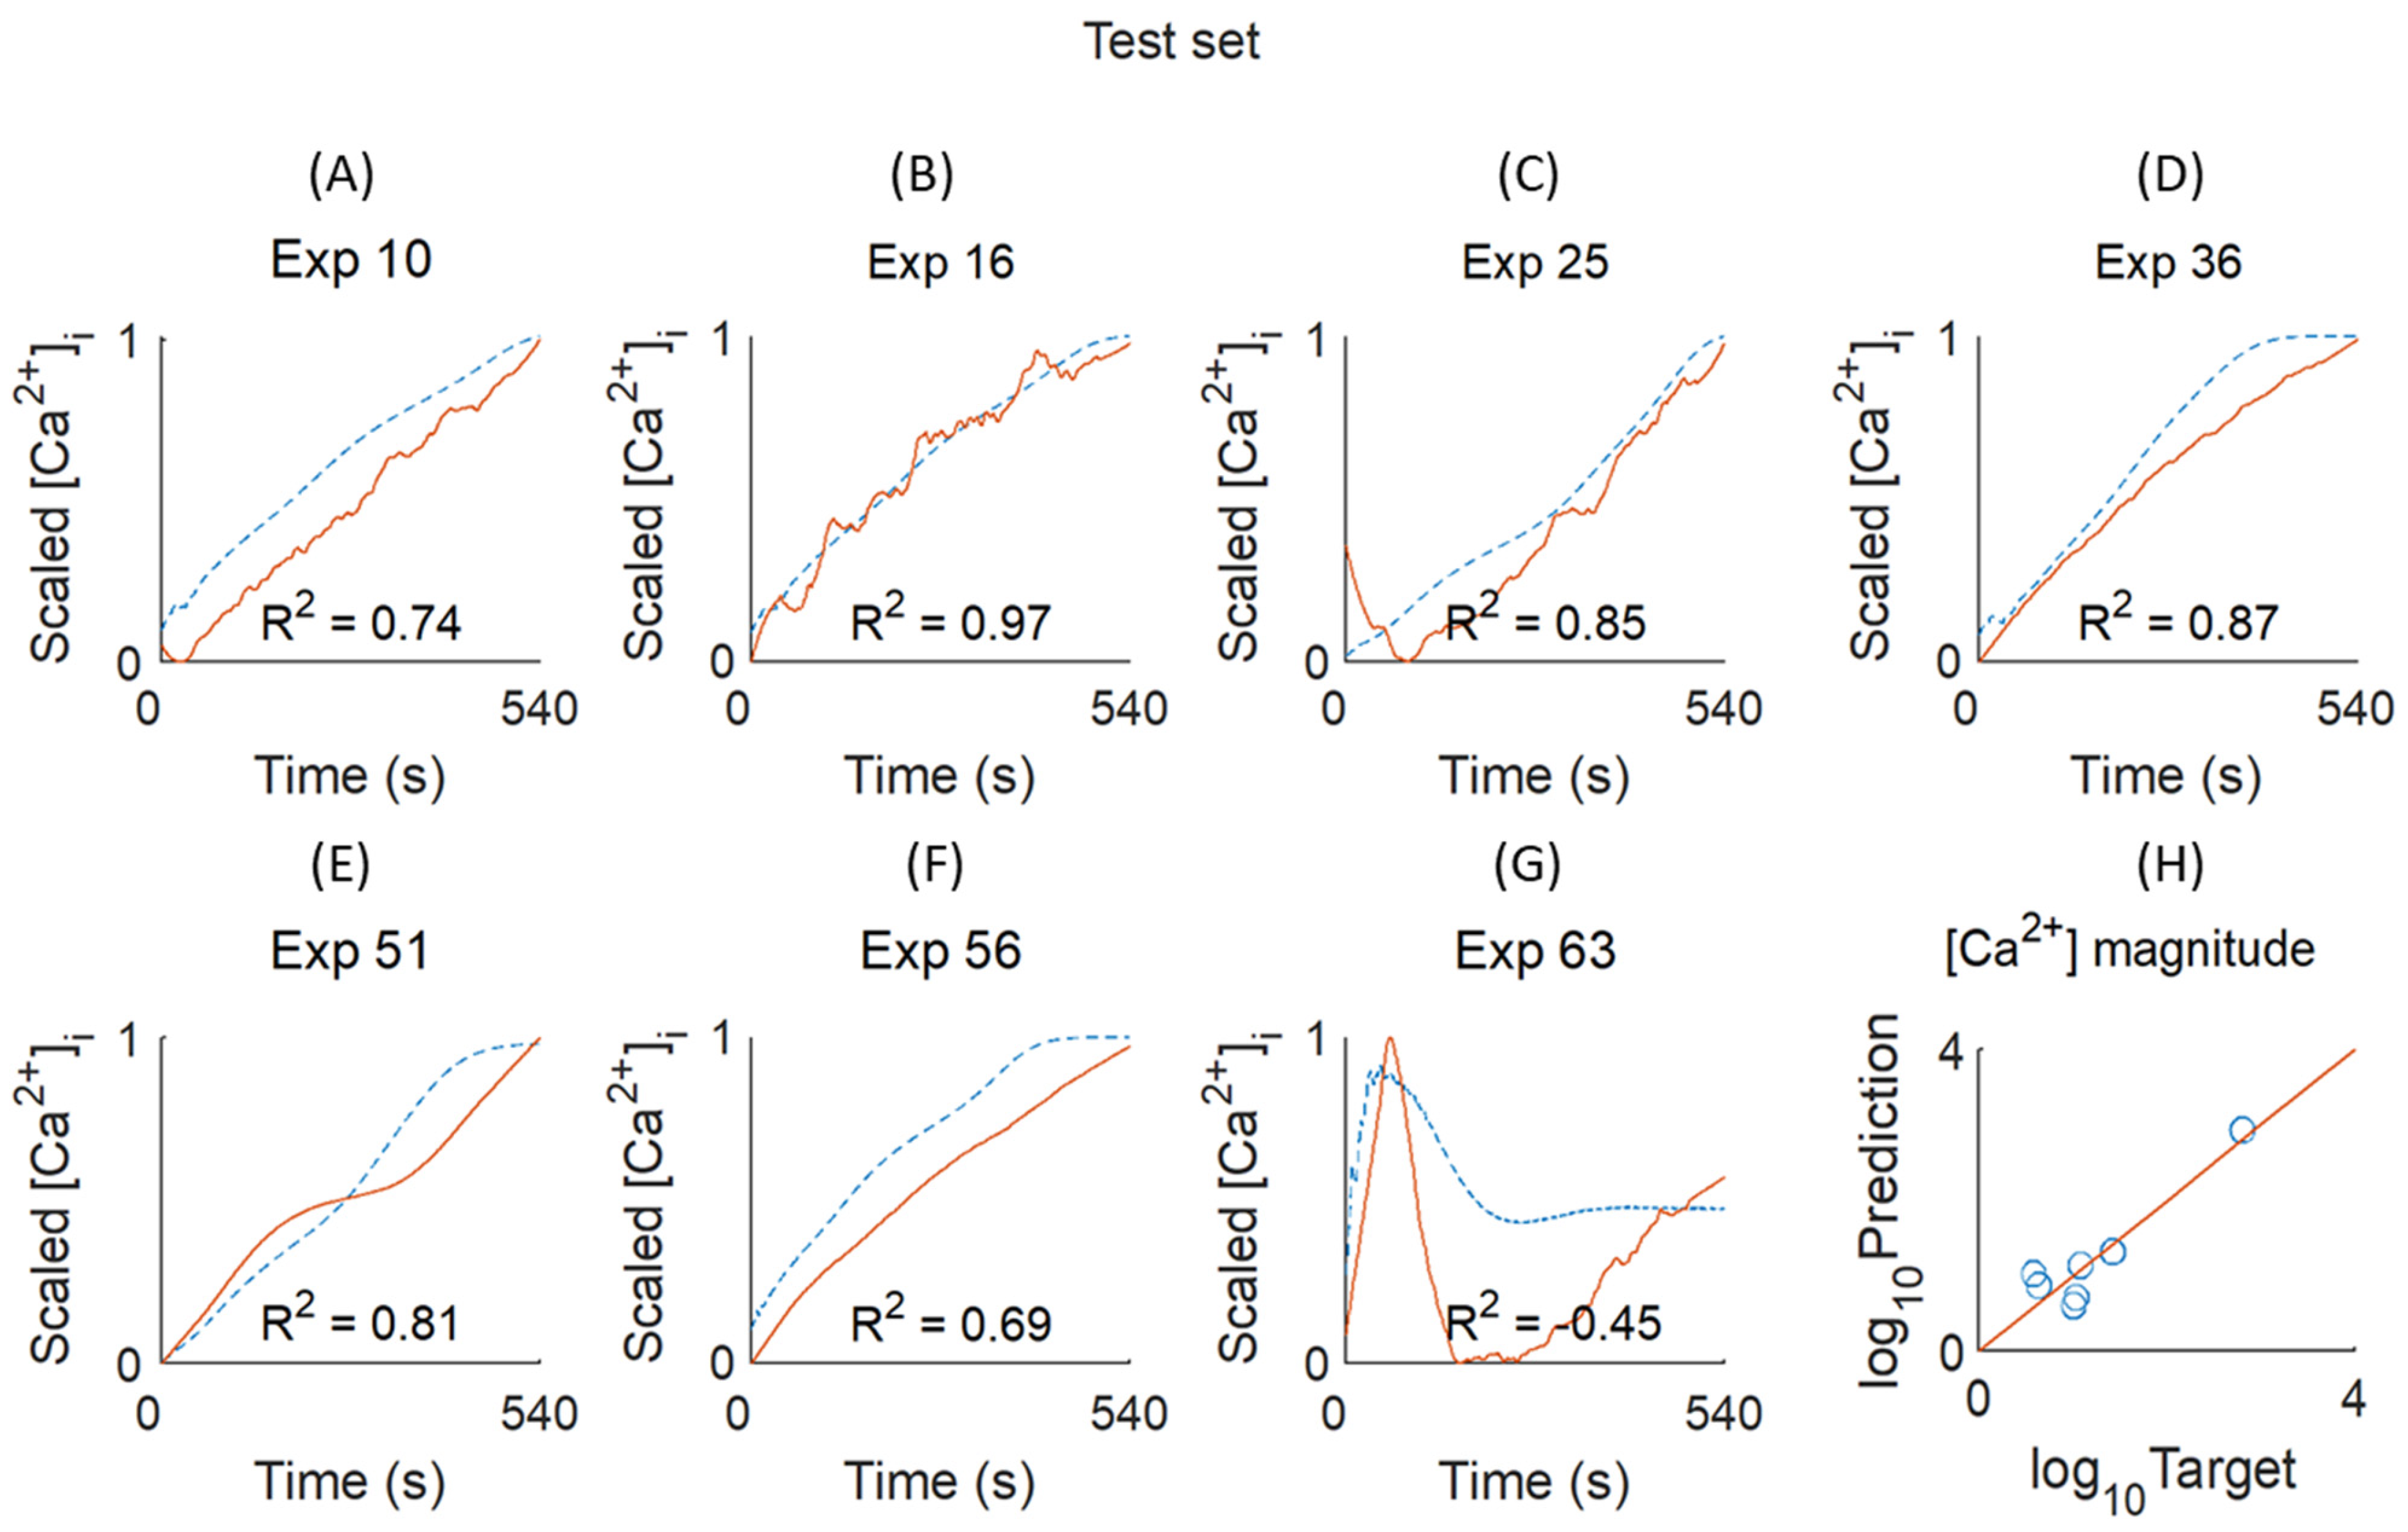
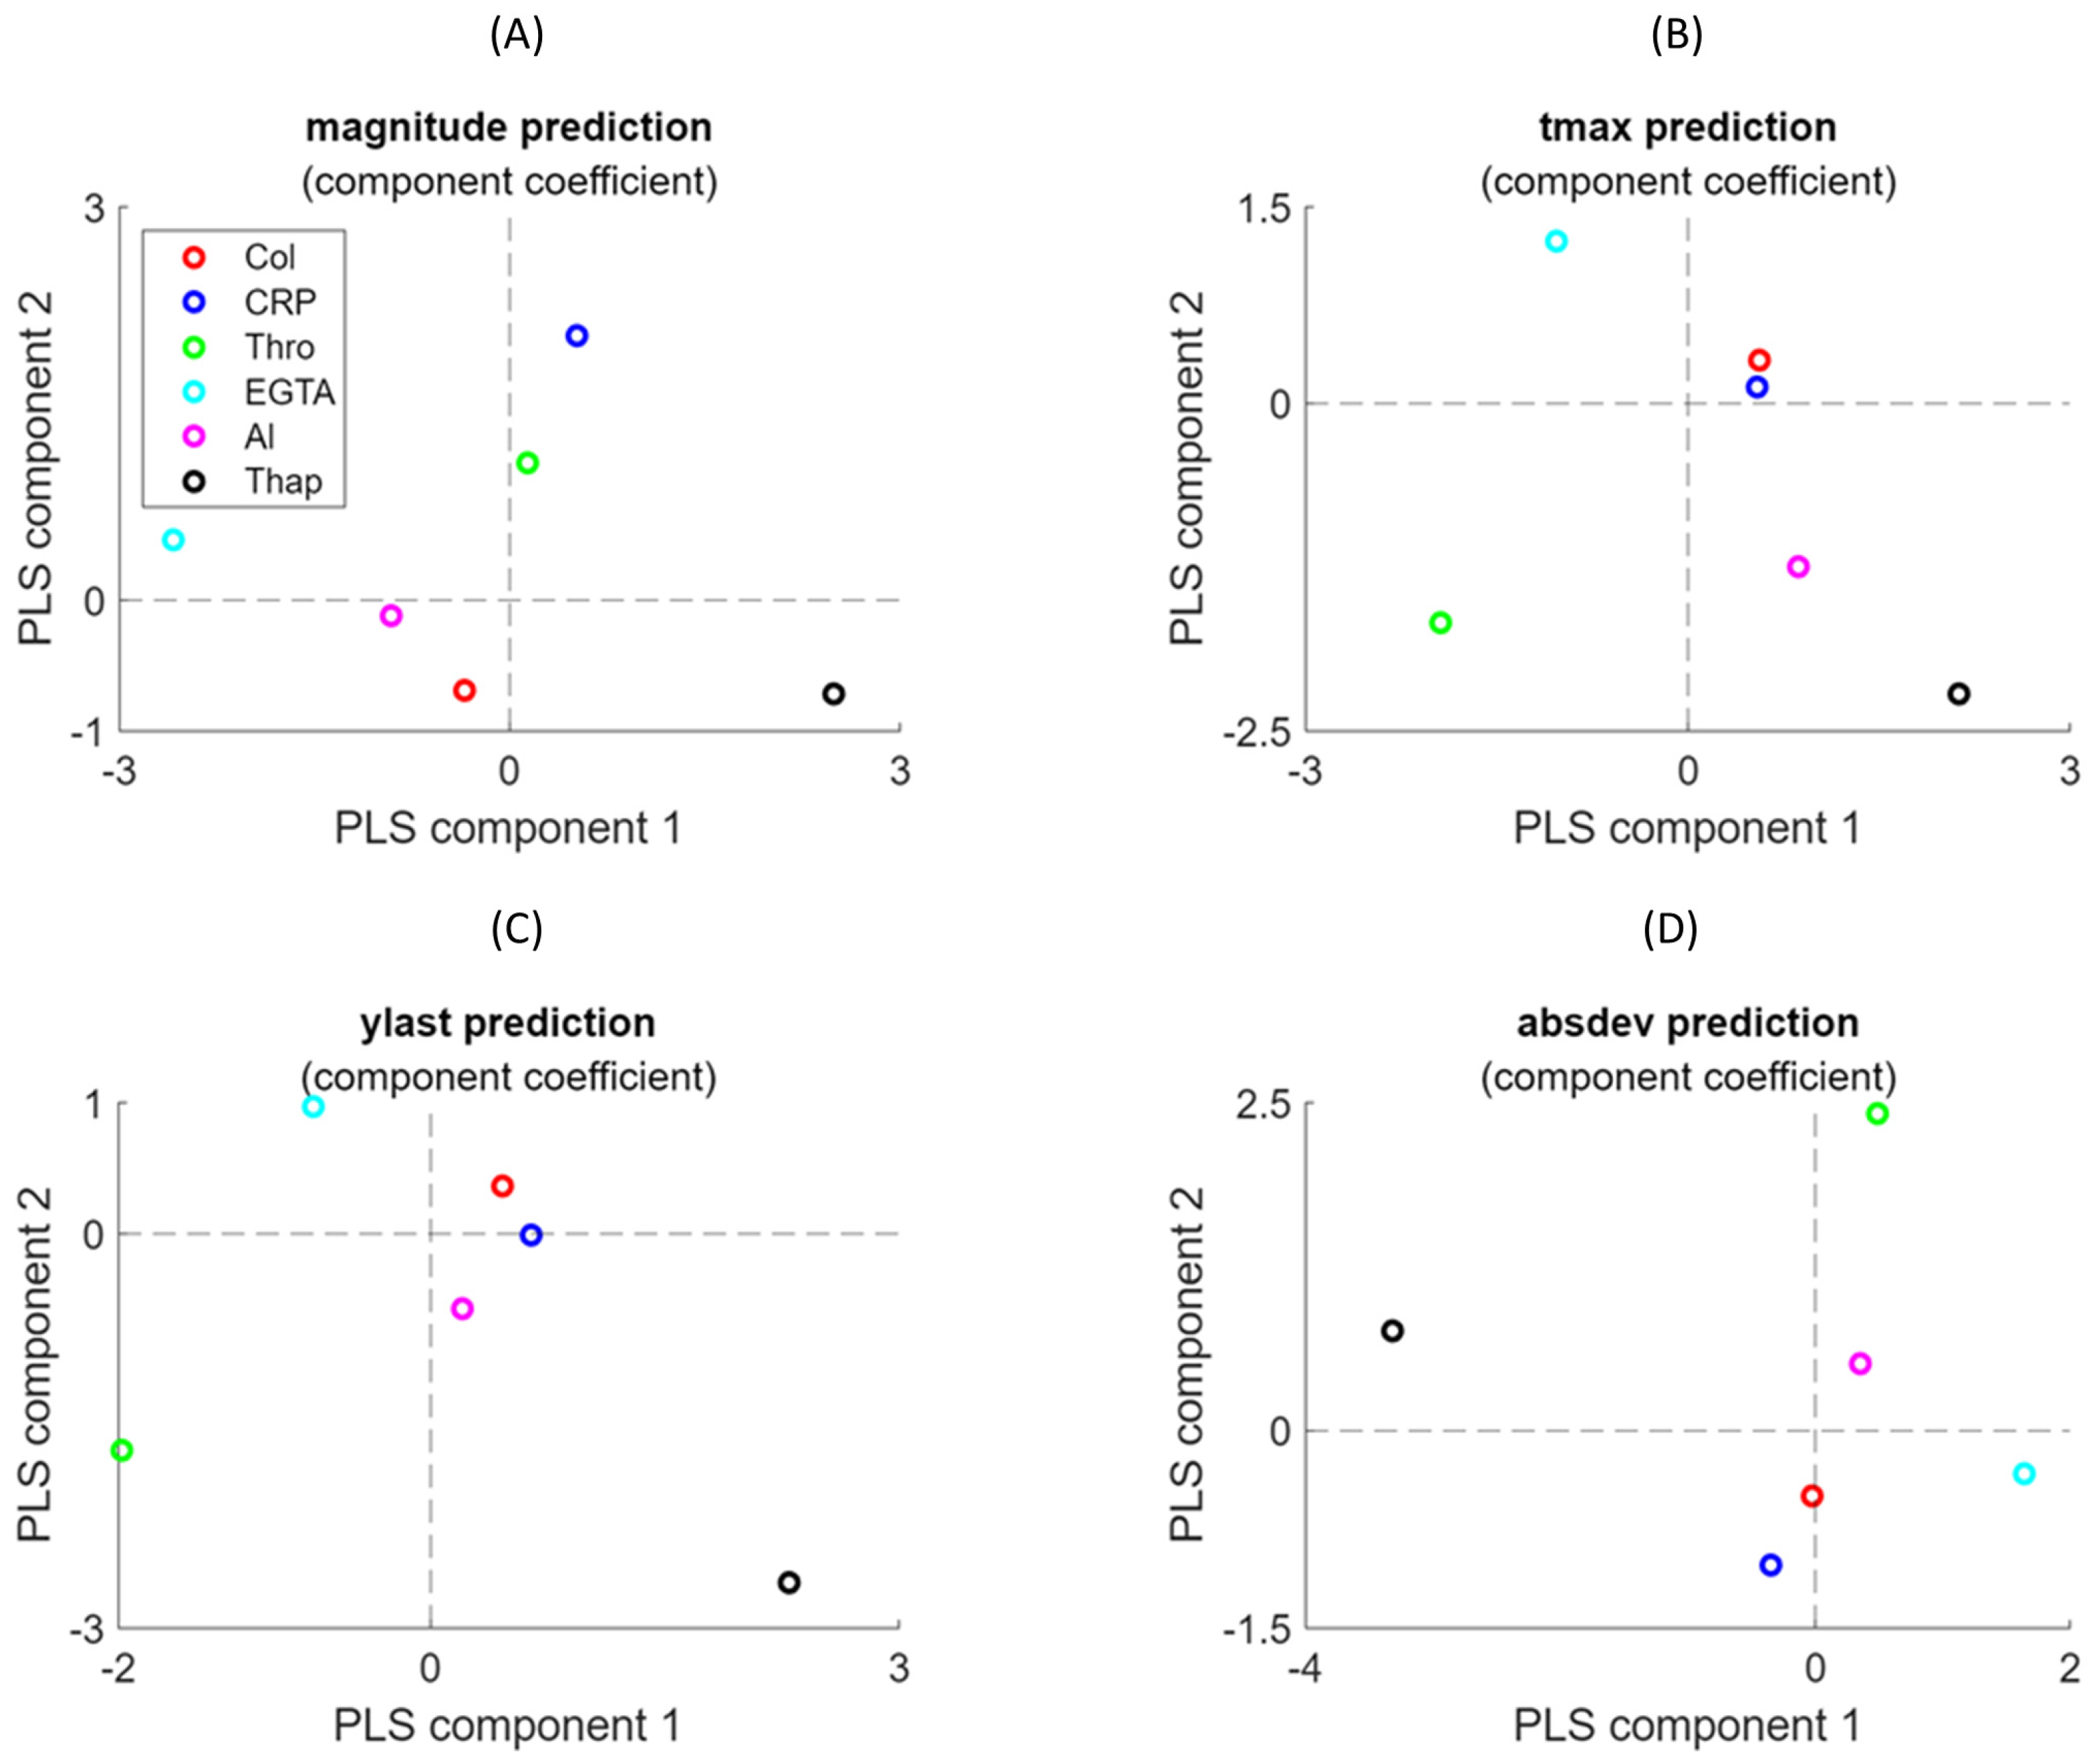
Both the NARX network and PLS regression modelling yielded useful results for understanding the variation in [Ca2+]i curves. The magnitude differences between curves in the presence of EGTA or CaCl2 (due to Ca2+ entry into the platelets) were well captured by the MLP and PLS regression models. The prediction results—i.e., sensitivity for MLP and components 1/2 for PLS—were well interpretable for this variable. On the other hand, NARX outperformed in capturing some curve variables. Thus, the subtle curve magnitude and shape effects (tmax and absdev) induced by thapsigargin were captured by NARX, but not by PLS regression. This illustrates that neural networks such as NARX can easily handle non-linear effects due to their complex activation functions, whereas PLS relies on linear regression analysis.
A specific limitation encountered was the shape differences in the [Ca
2+]
i curves used for training approaches, i.e., more often transient with thrombin and non-transient with CRP or collagen. Although neural networks can capture any function, they need sufficient data to train for such curve differences. In our case, a limited number of curves per agonist was available for training, which caused an imbalance in this set. One way to fix this problem is to use data augmentation, for example, by a synthetic minority oversampling technique [
16].
In the present paper, we used the platelets from a single donor for training all models, which allowed for a detailed investigation of the complex Ca
2+ signalling pathways involved. We chose this approach because [Ca
2+]
i curve aspects such as magnitude and shape often vary between blood donors [
14]. However, as shown in
Figure S2, it was checked for the majority of curves that the chosen subject was representative for four other healthy subjects. On the other hand, the use of blood from a single donor can be seen as a limitation, because the amount of obtained platelets reduced the number of variable experimental conditions and, accordingly, the machine learning models had a limited predictive power. These models can now be used to generate hypotheses for additional experimentation and provide insights that are otherwise not obtained by traditional analytical approaches. Appropriate use is important, ensuring that the data used for training are representative, while independent data are available for validation. However, comparing the platelet responses from a large cohort of healthy donors will increase the accuracy of overall predictions, ultimately aiming to more easily identify systematic aberrations in donors with suspected platelet bleeding disorders. Conversely, the current predictions of [Ca
2+]
i rises with multiple agonists offer a foundation for estimating the thresholds for platelet activation (OAT) and for testing the effects of new antithrombotic drugs, directly or indirectly targeting platelet Ca
2+ responses (PLS). Another application could be effect prediction in patients with gain- or loss-of-function mutations in genes encoding for Ca
2+ response modulators, such as
STIM1 and
ORAI1 [
17].
A solution to this issue is the approach of transfer learning [
18], in which a generic model is built for samples from various donors and then refined to obtain adjusted weights per donor. This approach has already been used to build personalised models for drug development [
19]. Regardless of the approach followed, modelled analysis will be important to understand the effects of clinically relevant inhibitors of Ca
2+ signalling pathways, such as P2X
1 Ca
2+ channel antagonists [
20]. In this paper, we examined this for a drug blocking the clinically important STIM1-Orai1 pathway [
20], namely 2APB. The PLS regression analyses performed well, capturing the curve size and shape effects of this drug and giving loadings in the models resembling the condition “EGTA”, with no Ca
2+ entry.
Differently from the neural network models, the PLS regression analysis performed better with the available sample size. The present PLS regression analysis to predict the (scaled) [Ca
2+]
i curve features would easily allow for comparisons with platelets from more donors. In work by the Diamond laboratory [
14], a NARX model was generalised by fitting networks constructed from several donors and determining their average prediction. Our analysis indicates that this can be conducted more easily by PLS regression techniques.
4. Methodology
4.1. Materials
Human α-thrombin was obtained from Kordia (Leiden, The Netherlands); cross-linked collagen-related peptide (CRP-XL) from the University of Cambridge (UK); Fura-2 acetoxymethyl ester from Invitrogen (Carlsbad, CA, USA); and Pluronic F-127 from Molecular Probes (Eugene, OR, USA). Horm-type collagen was obtained from Nycomed (Hoofddorp, The Netherlands). 2-Aminomethyl diphenylborinate (2APB) came from Sigma-Aldrich (St. Louis, MO, USA). Other materials were from sources described before [
21].
4.2. Blood Collection and Platelet Preparation
This study was approved by the Medical Ethics Committee of Maastricht University. Blood donor age and sex could not be recorded. Blood taken into 3.2% sodium citrate (Vacuette tubes, Greiner Bio-One, Alphen a/d Rijn, The Netherlands) was obtained from consenting healthy volunteers who had not taken anti-platelet medication in the previous ten days. Platelet counts were within the reference range.
Platelet-rich plasma (PRP) was obtained from citrated blood by centrifuging, after which collected platelets were washed in the presence of apyrase (1 unit/mL) and loaded with Fura-2 acetoxymethyl ester (3 µM) and Pluronic (0.4 µg/mL) at a count of 2 × 10
8/mL for 40 min at room temperature, as described before [
22]. The isolated platelets were finally resuspended at a concentration of 2 × 10
8/mL in Hepes buffer at pH 7.45 (10 mM Hepes, 136 mM NaCl, 2.7 mM KCl, 2 mM MgCl
2, 5.5 mM glucose, and 0.1% bovine serum albumin).
4.3. Calibrated Cytosolic Ca2+ Measurements
In the Fura-2-loaded platelets, changes in cytosolic [Ca
2+]
i were measured in 96-well plates with a FlexStation 3 (Molecular Devices, San Jose, CA, USA), as previously described [
22]. When desired, the platelets in the wells were pretreated with apyrase (0.1 unit/mL) plus indomethacin (20 µM), or with thapsigargin (1 µM) for 10 min. After the addition of either 0.1 mM EGTA or 1 mM CaCl
2, the platelets were stimulated by automated pipetting with one of the following agonists: CRP (1 or 10 µg/mL), collagen (1, 3, 10, or 30 µg/mL), thrombin (0.3, 1, 3, or 10 nM), or none of these (vehicle controls). In wells per row, changes in Fura-2 fluorescence were measured quasi-simultaneously over time at 37 °C by ratiometric fluorometry, including appropriate calibrator controls for obtaining nM concentrations of [Ca
2+]
i [
22]. For the independent testing of pharmacological drugs known to affect SOCE, the platelets were preincubated with 2APB (30 μM), as studied and titrated before [
15,
23]; the agonist concentrations were maximal: CRP 10 μg/mL or thrombin 10 nM.
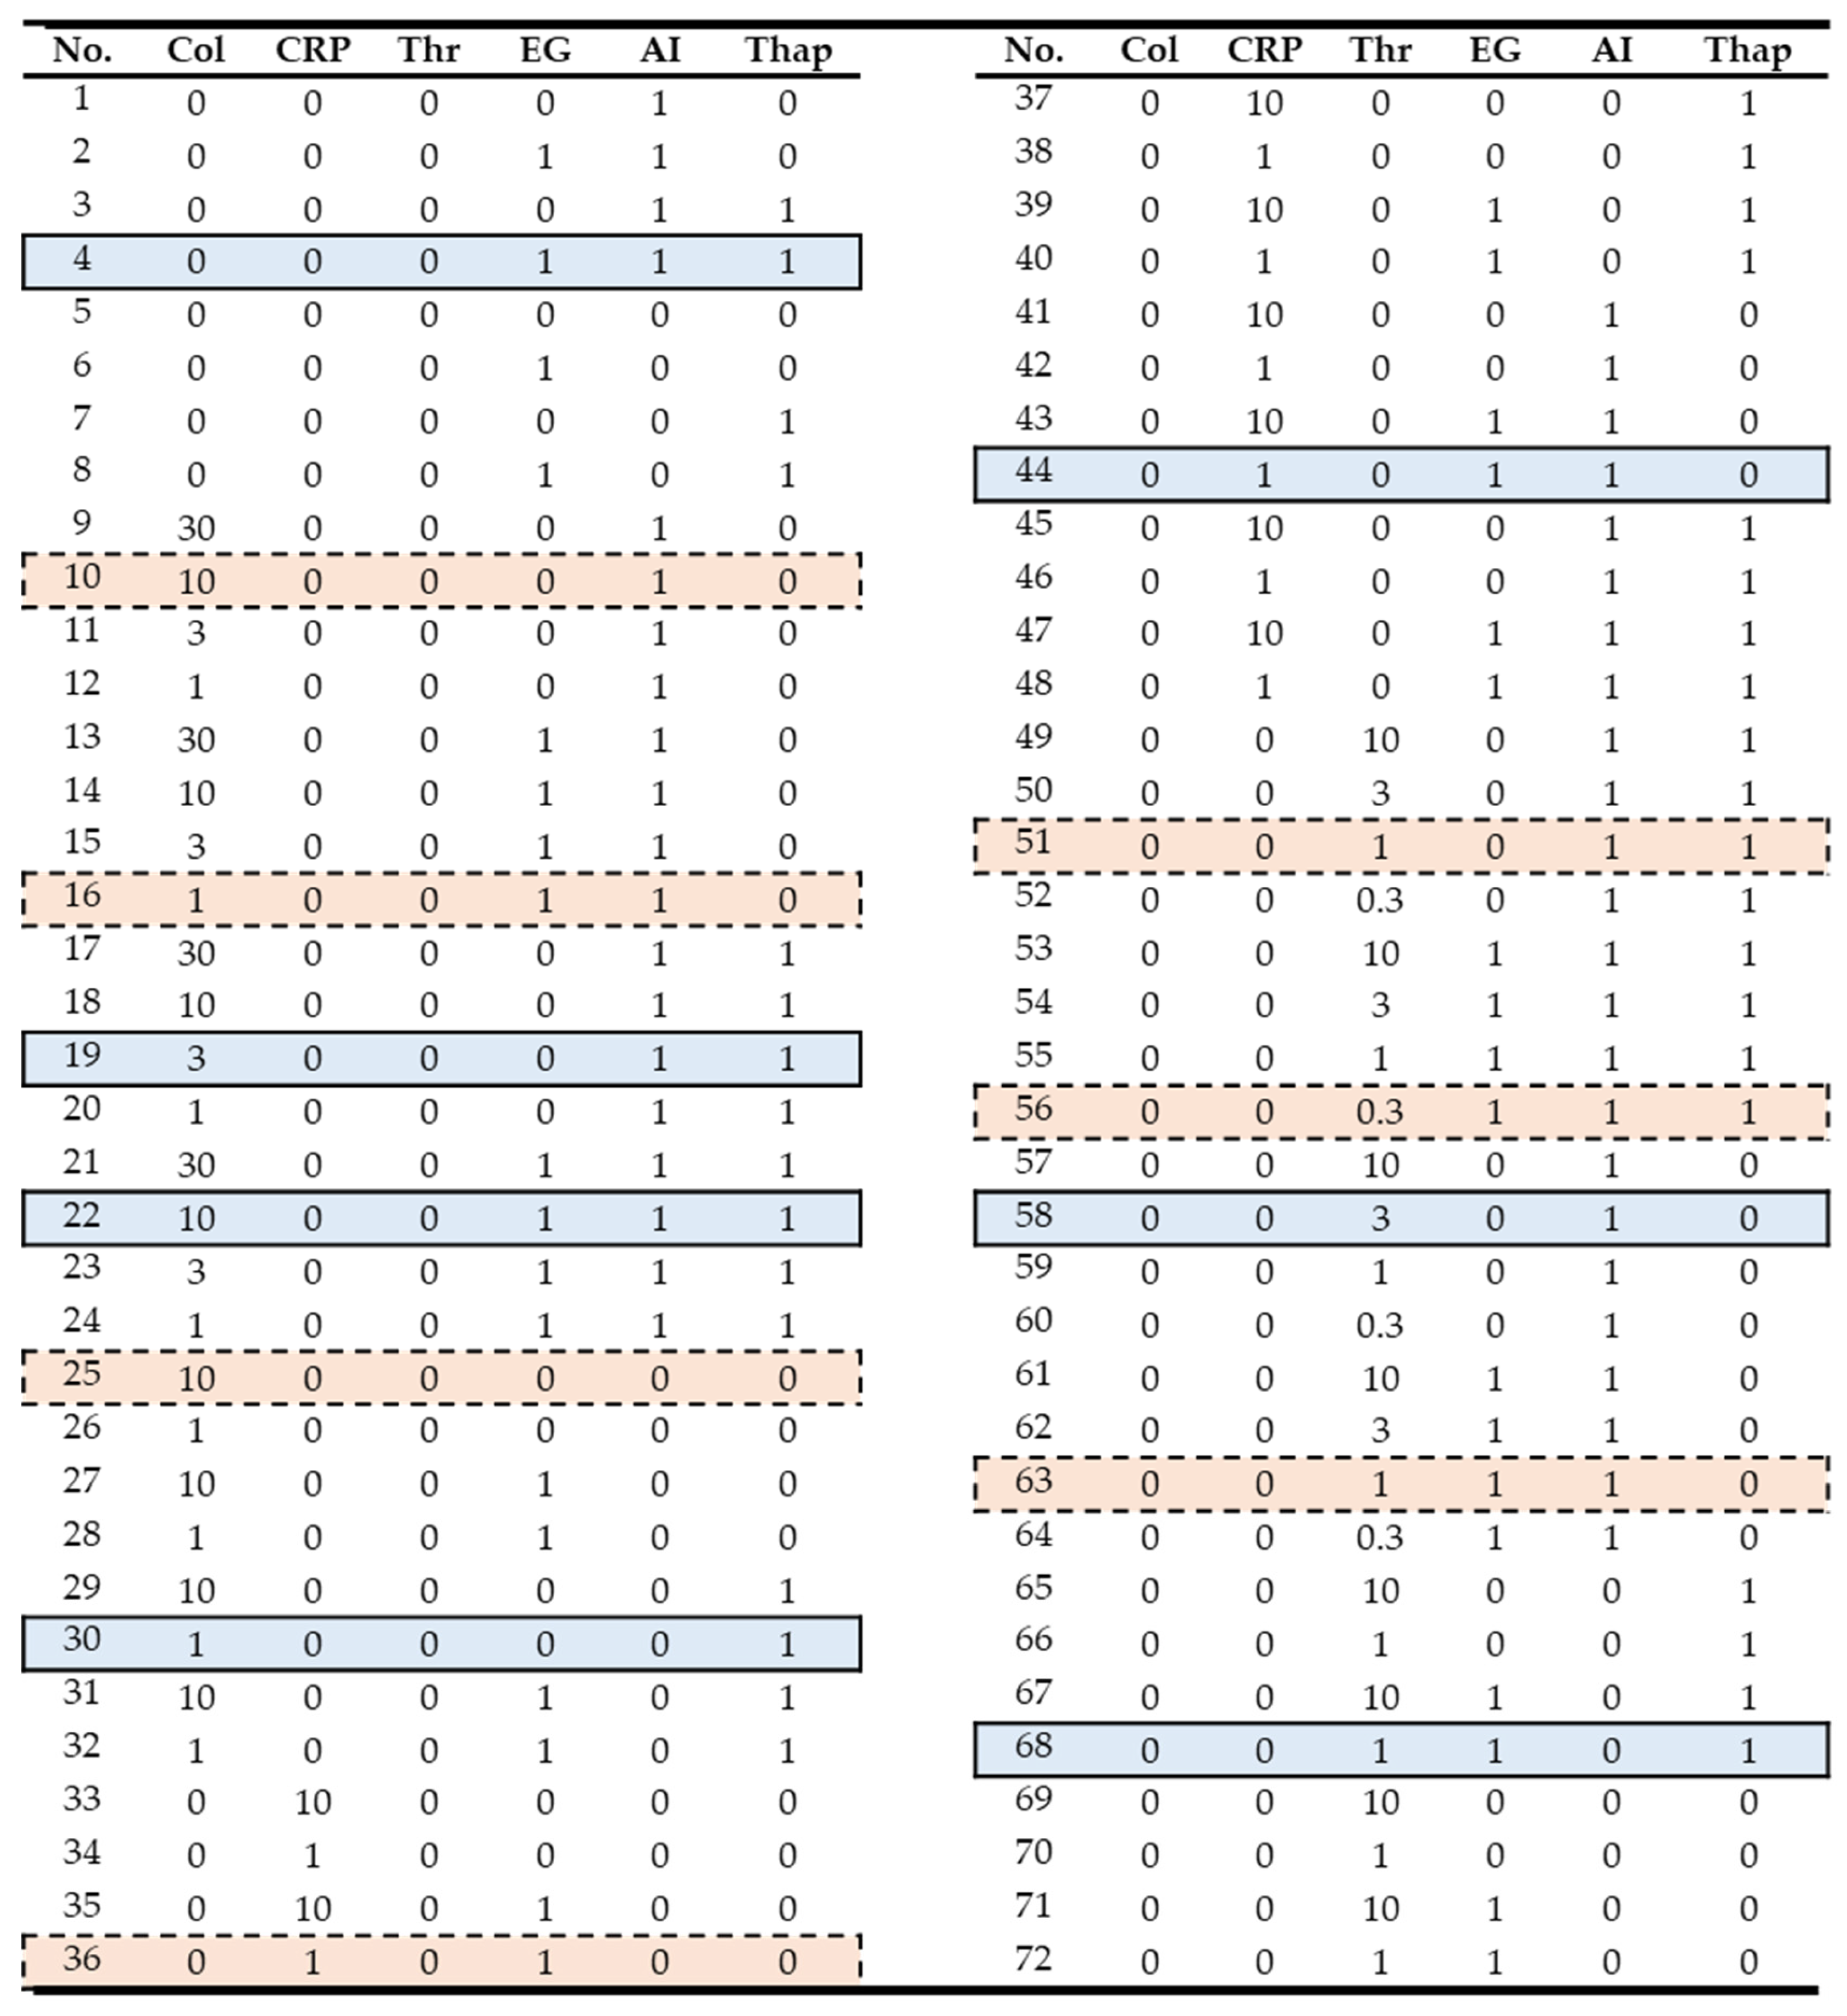
4.4. Selection of Platelet [Ca2+]i Curves for Modelling
For the majority of experimental conditions, the Ca
2+ responses were studied in Fura-2-loaded platelets obtained from 5 healthy donors, thus resulting in calibrated time series of nM [Ca
2+]
i [
15]. For the present modelling approach, a complete set of 72 time curves was taken from subject 1 and checked to be representative for those of all subjects (
Figure S2). In
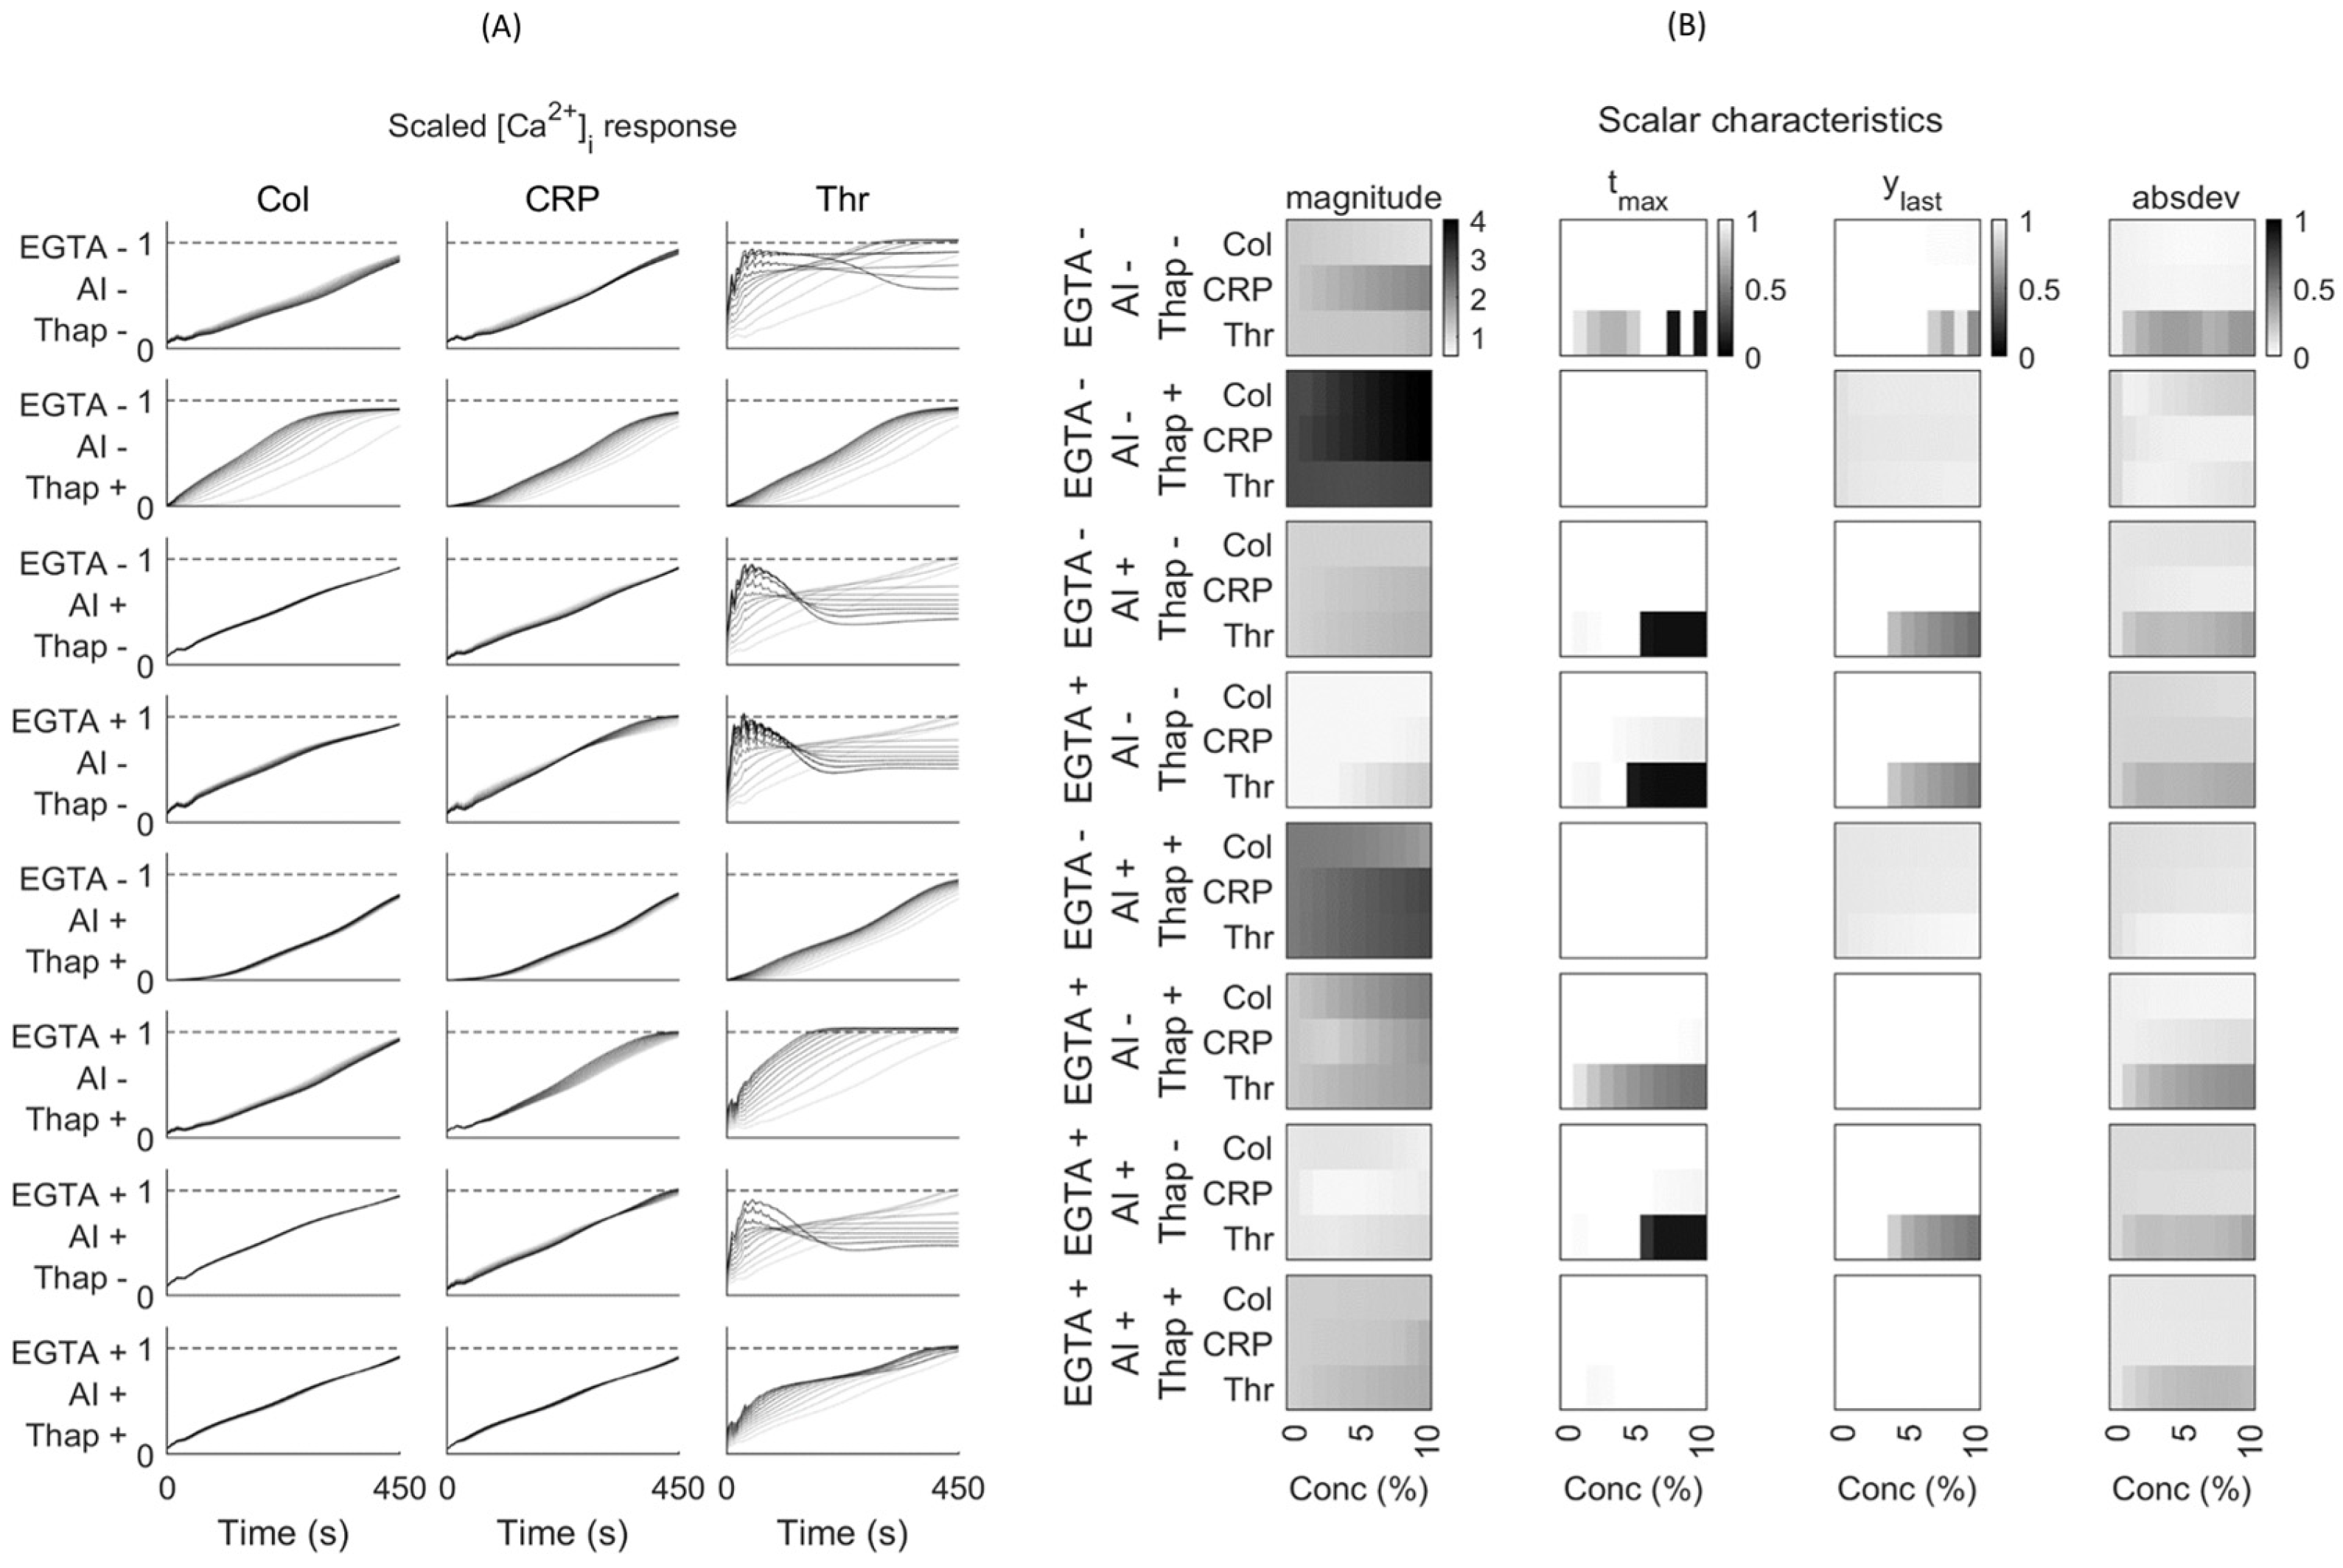
Figure 1, the chosen experiments for model validation and testing are highlighted in blue and red, respectively, based on criteria indicated below.
4.5. Preparation of Input Data
The raw curves of [Ca
2+]
i changes in platelets stimulated with CRP or collagen had a sampling time of 4 s, while those with thrombin had a sampling time of 2 s. To allow for direct comparisons, the raw nM values (
Figure S3) were linearly resampled and interpolated to generate 1 s time steps from 0 s to 540 s. To minimise noise disturbances, the curves were smoothed with a Savitzky–Golay filter (
Figure S4).
In cases where scaling was needed, the smoothed curves were subjected to a min–max scaling algorithm, giving values between 0 and 1. To scale the input conditions, experimental variables were set as [0, 1], except for the agonist concentrations, which were scaled in the range of [0, 10] (
Figure 1). Herein, 0 indicated no agonist or inhibitor present.
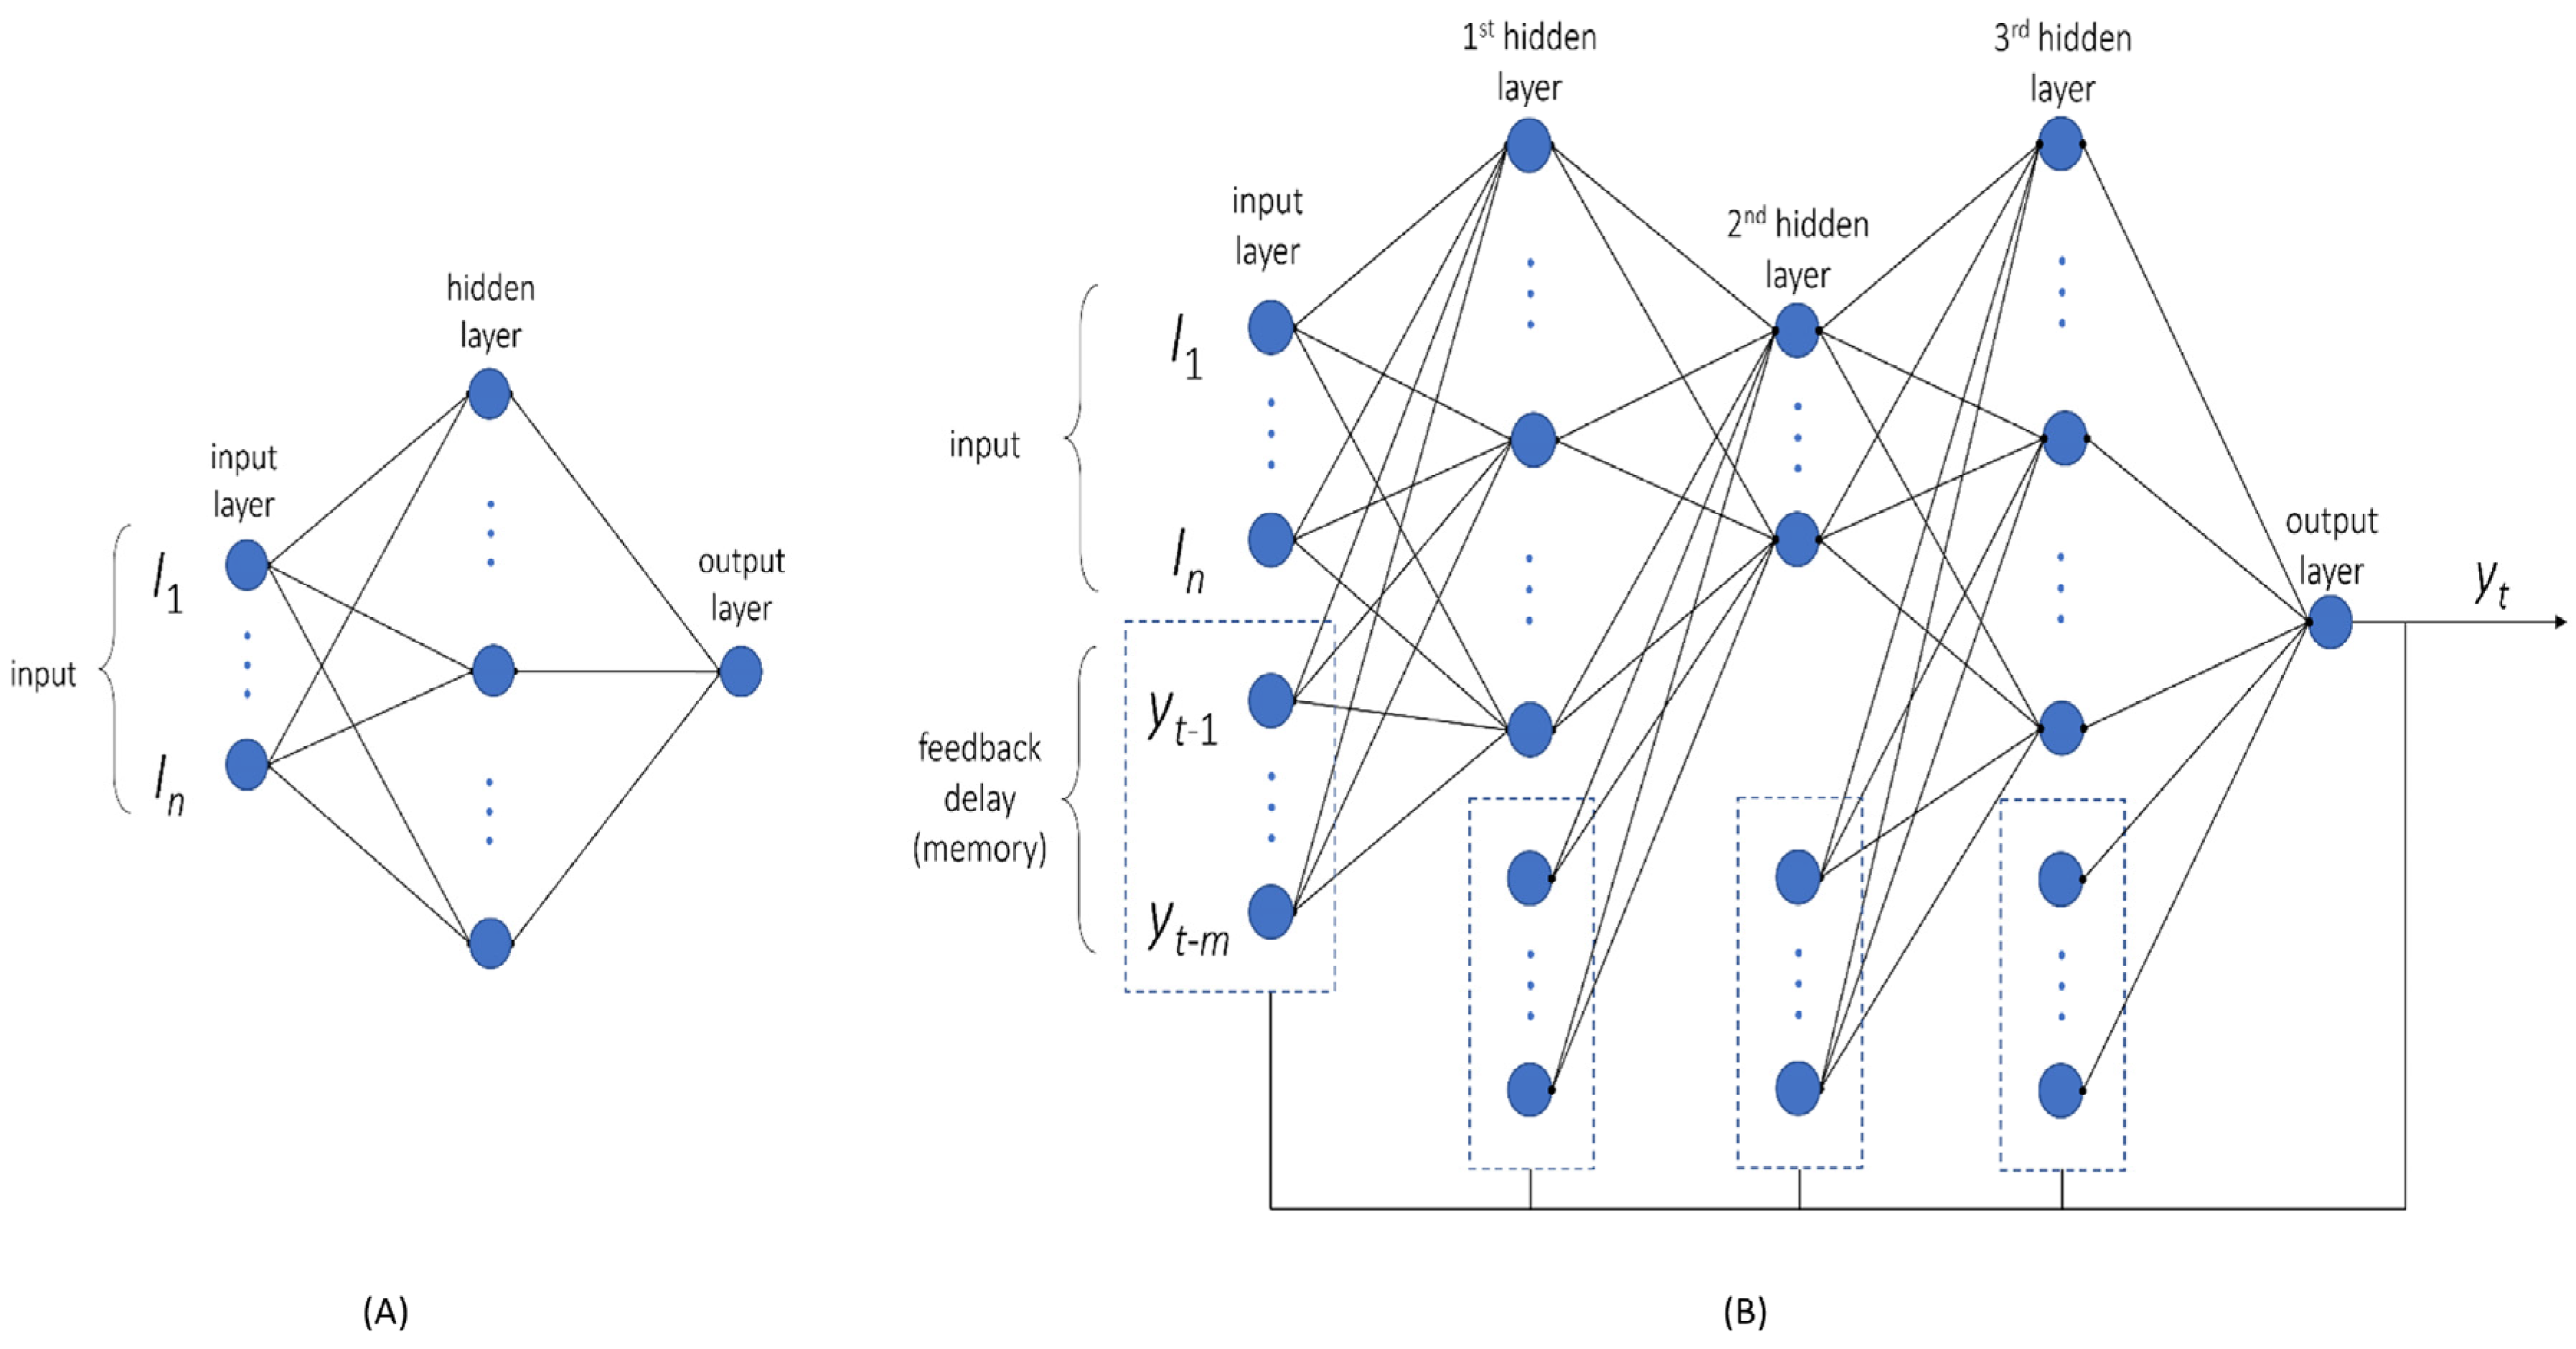
For constructing the multilayer perceptron (MLP) network, a regression model was built using the magnitudes of all [Ca
2+]
i time series. The experimental variables were taken as inputs (
Figure 3A), while the mean square error was used as a cost function. This ensured a better fit for the larger values. For this purpose, we set the target (output) for the model as log-scaled values of the nM [Ca
2+]
i range as log
10(max − min). This improved the overall accuracy of log scales.
Considering that the number of total features was small with 6 experimental variables (
Figure 1), we also generated polynomial features (quadratic feature combinations), which increased this number from 6 to 27. For the MLP network, the number of hidden layers was set to 1, while the number of nodes was randomly selected from 1 to 10. The network architecture options were chosen as to train only low numbers of parameters to prevent overfitting. Networks were trained 100 times, starting from random weights. As the best structure, the network with a minimal score in the cost function of the validation set was taken. Network training was performed using the Levenberg–Marquardt algorithm, containing a rectified linear unit as the activation function in each node. The modelling was conducted using Matlab R2022a and the Neural Network Toolbox.
4.6. Trend Prediction of NARX Network
A separate neural network was constructed to predict the trends (shapes) of smoothed and scaled [Ca
2+]
i time curves. To better capture the time dynamics, we chose a non-linear autoregressive network with exogenous input (NARX) and parallel architecture [
24,
25], which is also known as a closed-loop neural network. For this NARX network, the model’s output
y(
t) was used to fit the target (i.e., the smoothed and scaled [Ca
2+]
i curves). The output then generated feedback as an additional input to the network when combined with the experimental condition (
Figure 3B). The mathematical expression for [Ca
2+](
t) is then written as follows:
where
y(
t) is [Ca
2+]
i over time,
I is an input matrix of the experimental conditions, and
yh is the feedback delay (history) of
y. Furthermore,
W and
Hn are the input matrix weight and feedback delay of y, respectively;
bn are biases;
Ln are the weights of each hidden layer; and
f is the activation (transfer) function. Note that the product of the matrix is also a matrix, meaning that the equation represents a summation of numerous parameters and functions.
For feedback delays, we chose the values at 1, 3, 6, 10, 15, 21, 28, and 36 s prior to the current value of a [Ca2+]i time series. Hence, these feedback delays kept the information about current values, while preserving the long-term memory of the system. The initial values of the feedback delays were set to zero, as the system was assumed to be in a steady state prior to the agonist-induced activation of platelets. The use of MSE as a cost function allowed us to make predictions of the scaled min–max [Ca2+]i time series. Scaling was performed per time series, implying that each series had the same range [0, 1]. Polynomial features were used also in this network, thus expanding the number of inputs from 6 to 27.
The neural network architecture was optimised to maximise the goodness of fit but to prevent overfitting. We used three hidden layers, with each layer’s size varying between 2 and 20 nodes (not including feedback delays). This gave approximately 7000 different architectures being trained. A randomised grid search was employed to find the best architecture. For training, the Levenberg–Marquardt algorithm was used with a hyperbolic tangent sigmoid as an activation function. Since parameter fitting in the neural network depended on a random seed, each architecture was fitted 100 times, after which the best parameters were used for comparison. The networks were built and trained in Matlab R2022a.
4.7. Parameter Sensitivity Analysis
To perform agonist concentration sensitivity analysis, the method of one-at-a-time (OAT) factor was applied [
26]. This kept the variables fixed to the central or baseline value, while changing one variable at a time. Since effects were computed with reference to the same central point in space, this improved the comparability of the outcomes. As default, we set the conditions of EGTA or CaCl
2, autocrine inhibitors (AI) or not, and thapsigargin or not as 1 or 0 (2
3 = 8 combinations). Furthermore, we scaled the agonist concentration from 0 to 10% of the maximal concentrations (30 μg/mL collagen, 10 μg/mL CRP, or 10 nM thrombin). The shape of each [Ca
2+]
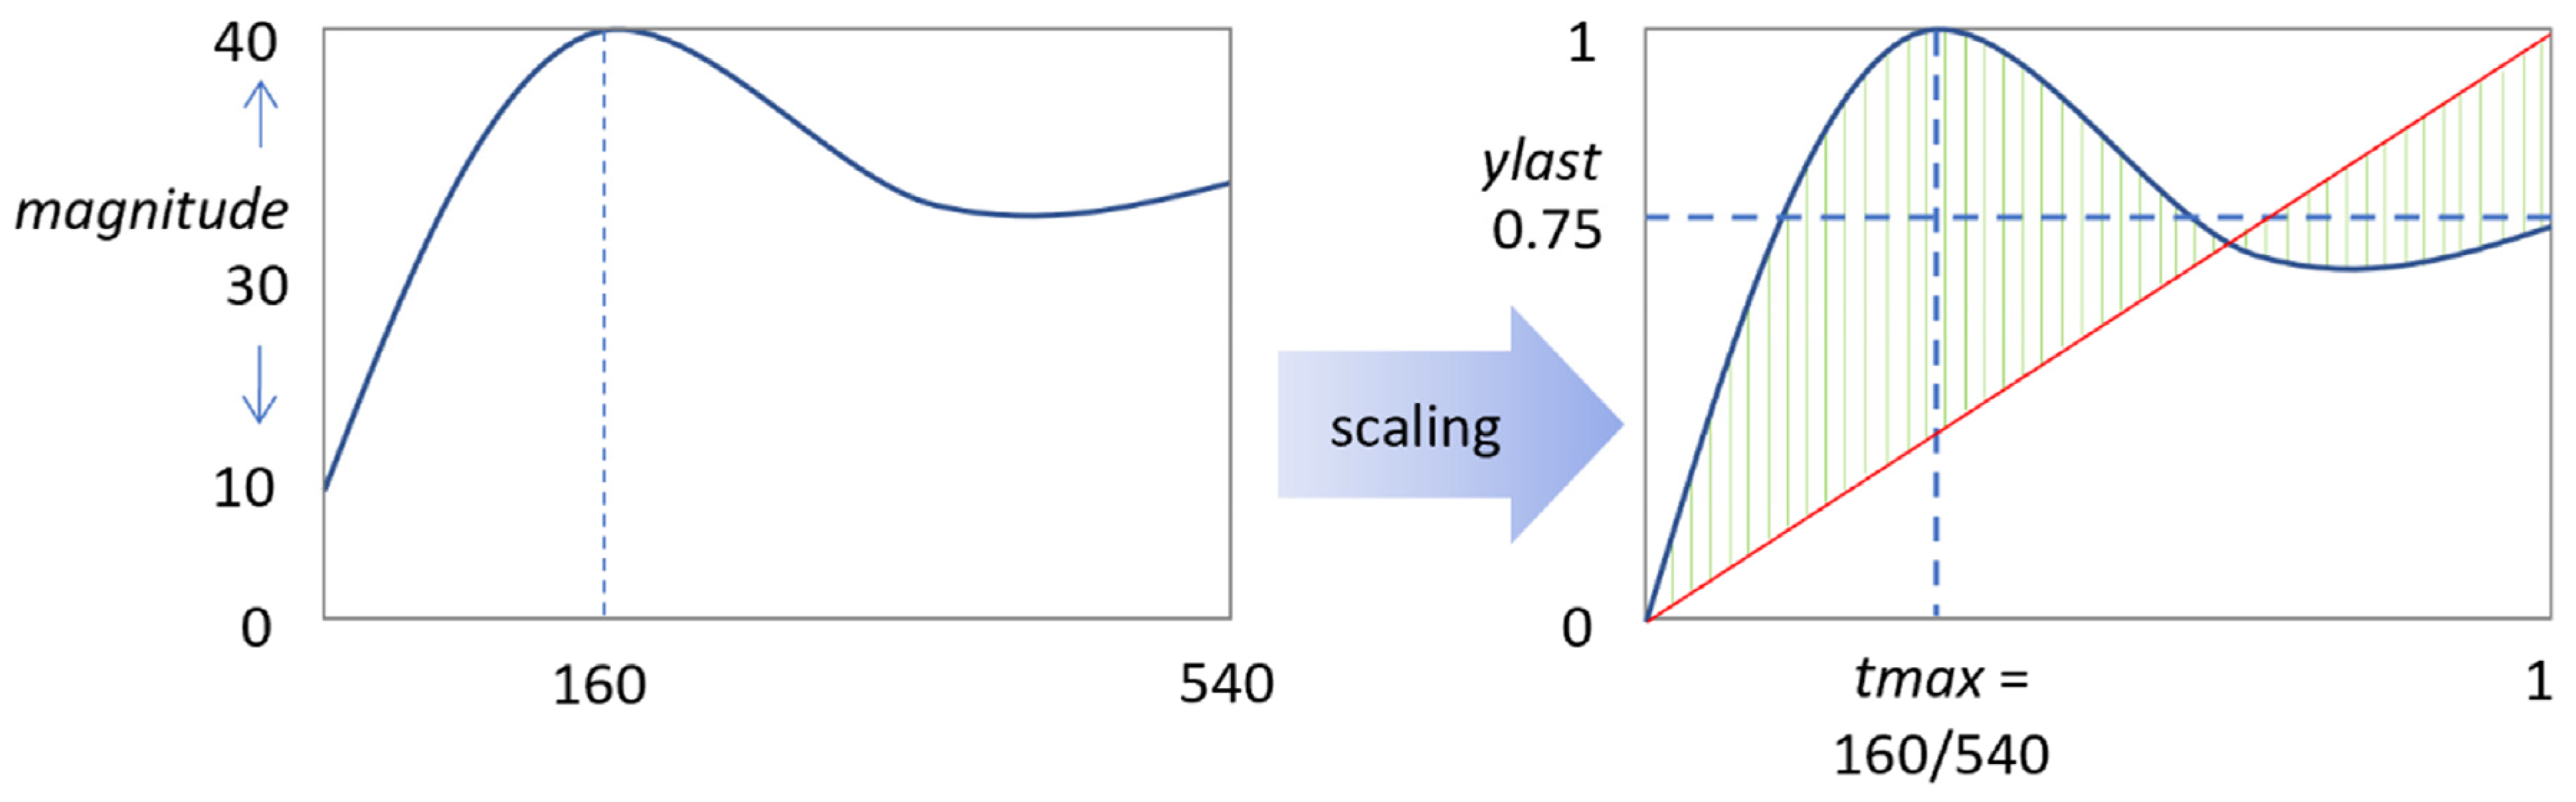
i time curve was defined according to four scalar characteristics, namely the magnitude of the response, peak time, relative terminal level, and the mean deviation from a straight line (
Figure 2).
4.8. Partial Least Square (PLS) Regression Analysis
Regression analysis with PLS was used as an extension of principal component analysis [
27,
28], which maximises the covariance between an input matrix X and output matrix Y. In this method, each component has a latent variable
ti, while the linearly weighted combination of the latent variables generates the prediction of outcomes (Y matrix), as follows:
The experimental conditions of
Figure 1 were used as the X matrix and the scalar characteristics of a [Ca
2+]
i time series were used as the Y matrix. The number of components in the PLS analysis was taken from the optimal variance achieved. The loading weights depended on the input variables that contributed most to the prediction. By maximising the covariance between explanatory variable X and response variable Y, the most relevant components in X were obtained for changes in Y. Stated otherwise, by examining the loading weights of a few latent variables accounting for most of the explained covariance, we could identify the experimental conditions with the most significant impact on the [Ca
2+]
i time curves.

 ,
, 