
Regeneration of Biomechanically Functional Tendon Tissue Following Injection of Uncultured, Autologous, Adipose-Derived Regenerative Cells into Partial Achilles Tendon Defects in Rabbits

 , , , , , , ,
  and
and 
Abstract
1. Introduction
2. Results
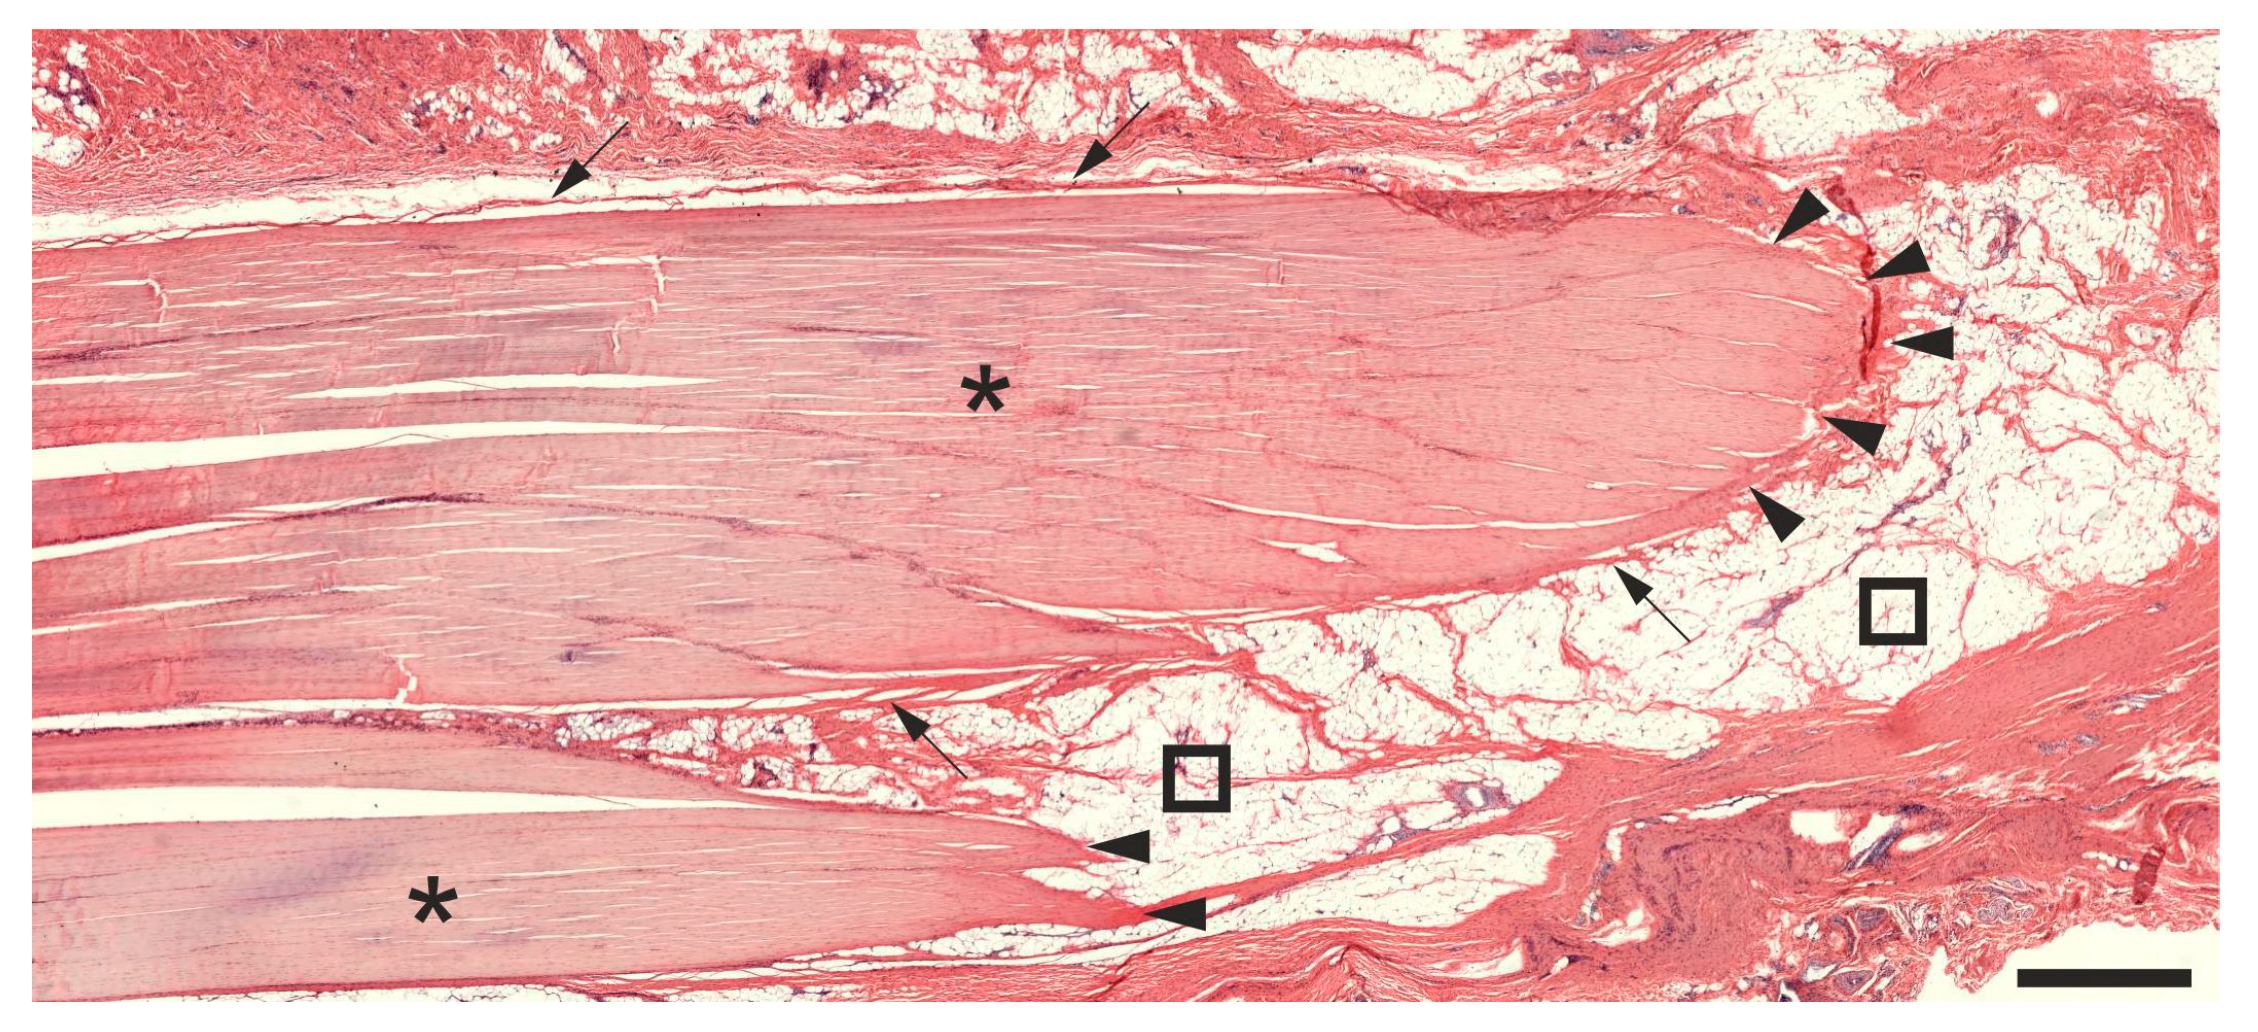
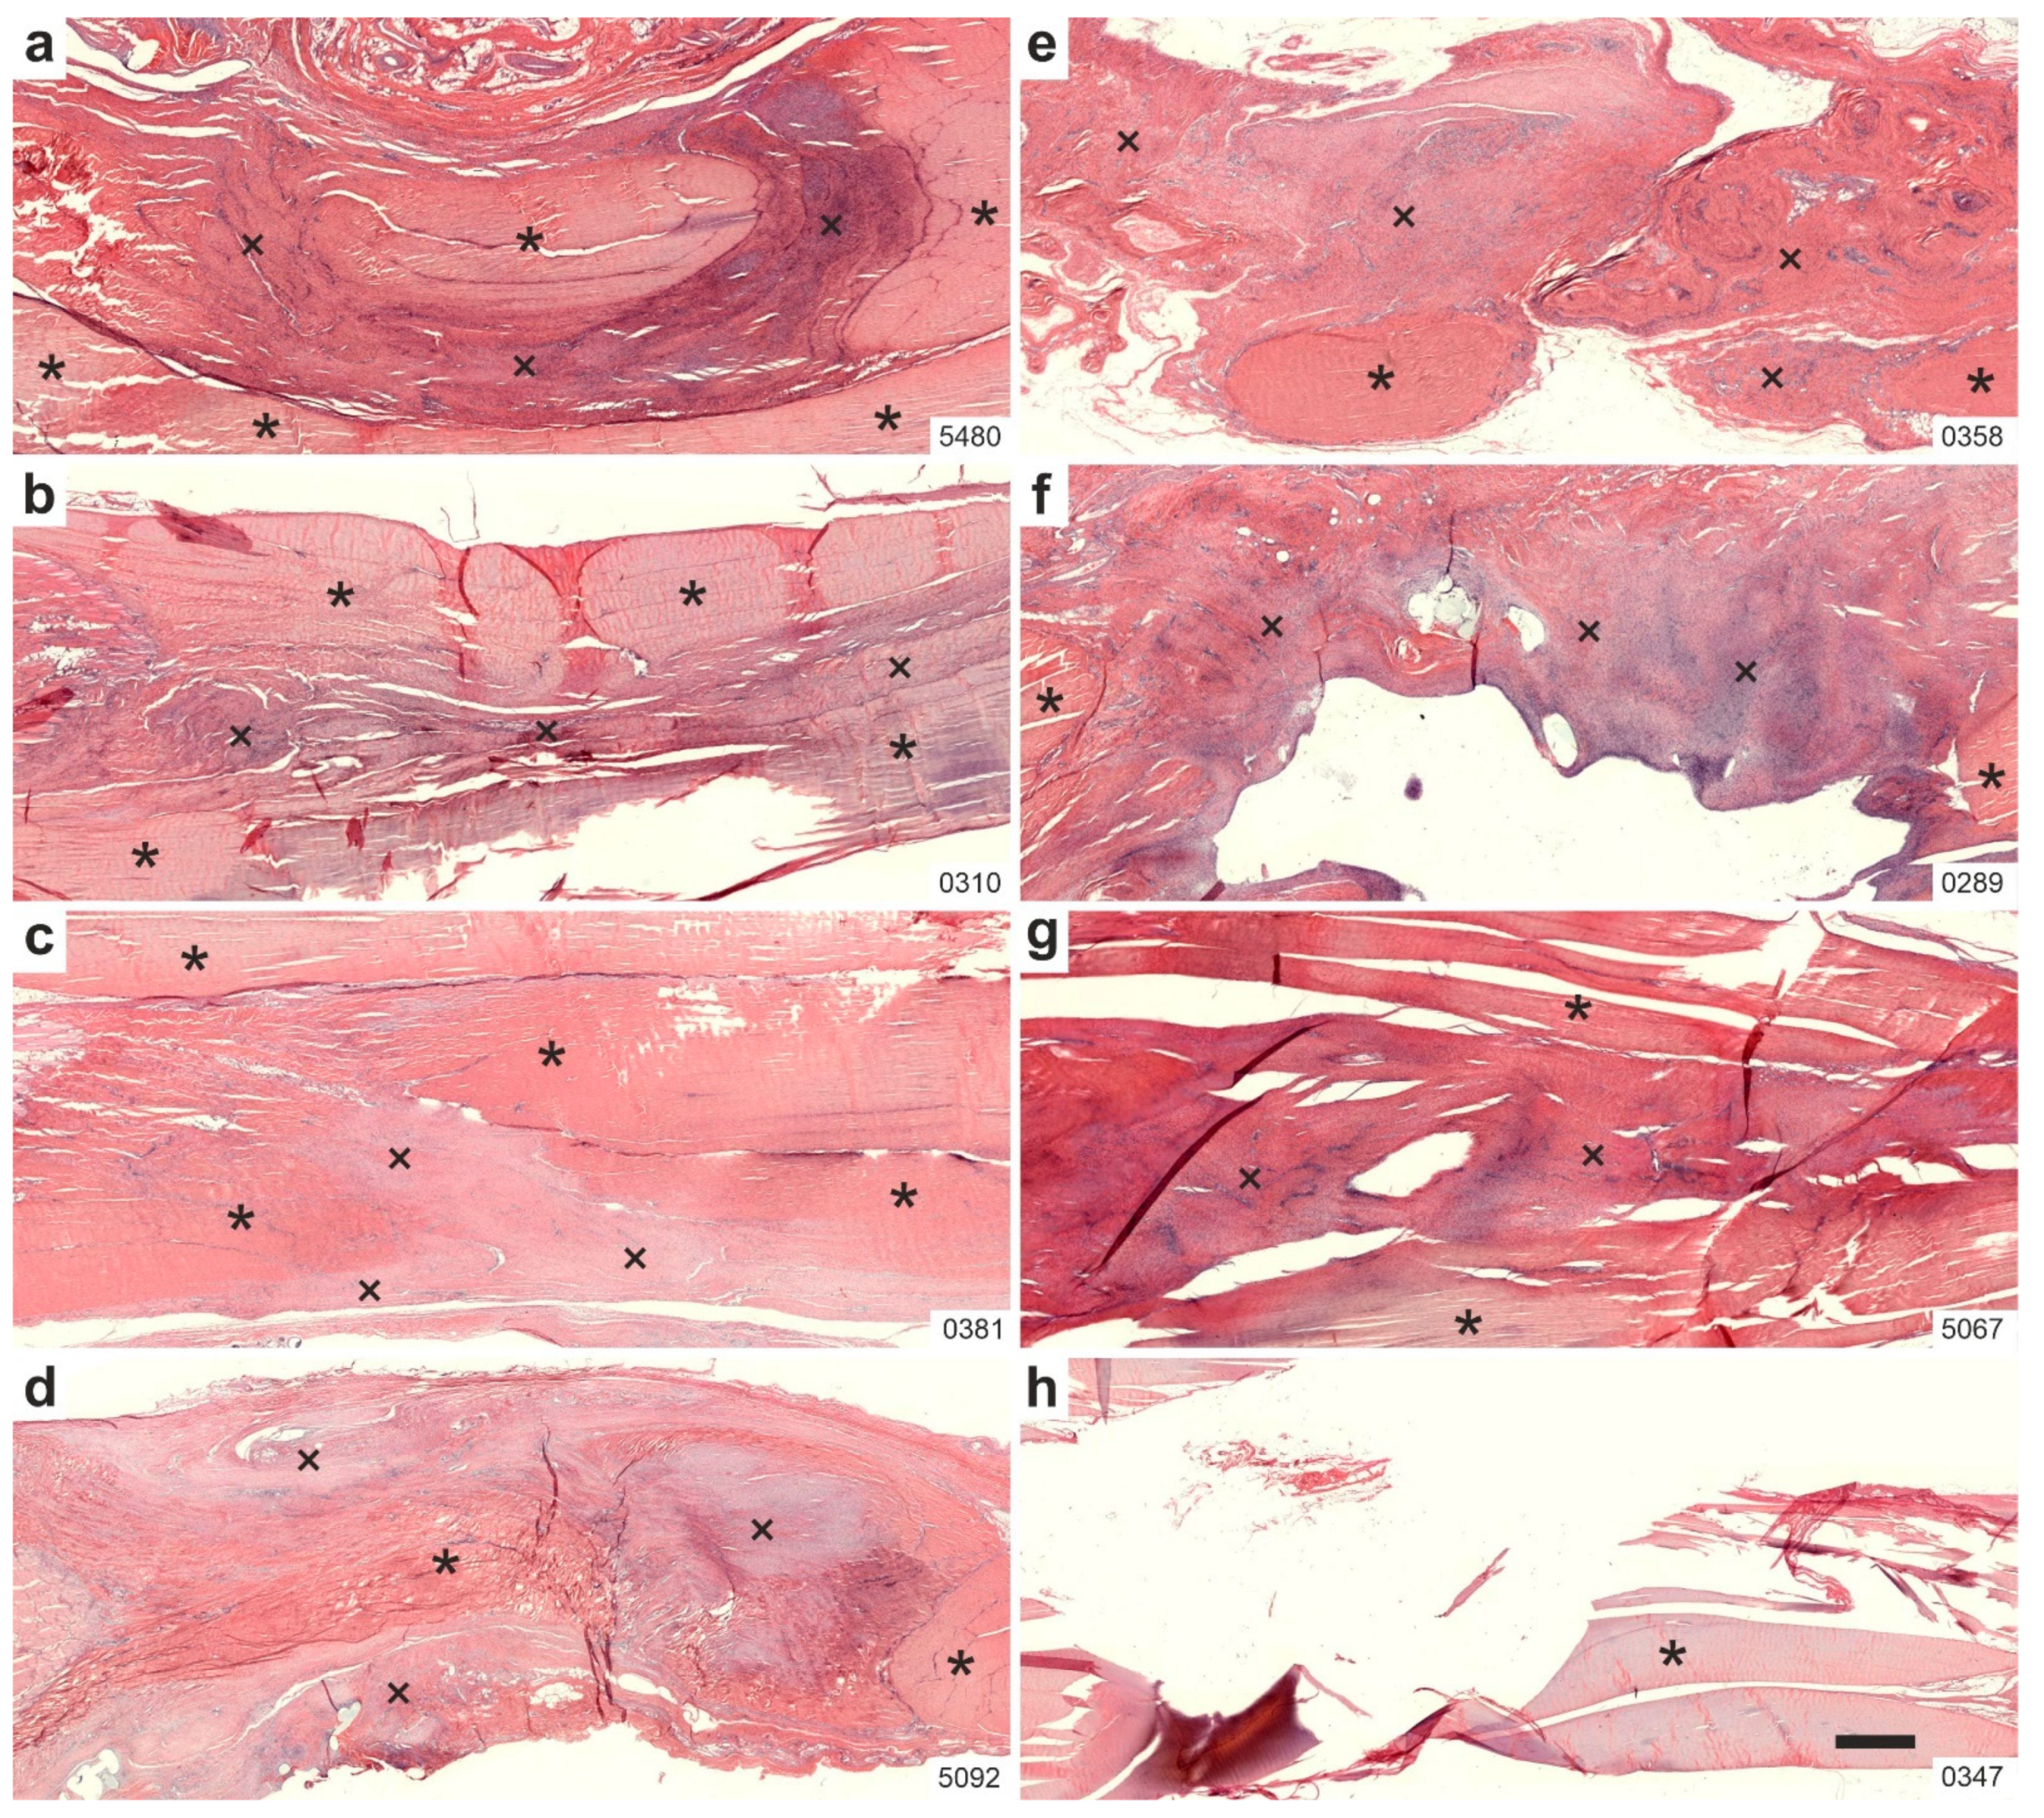
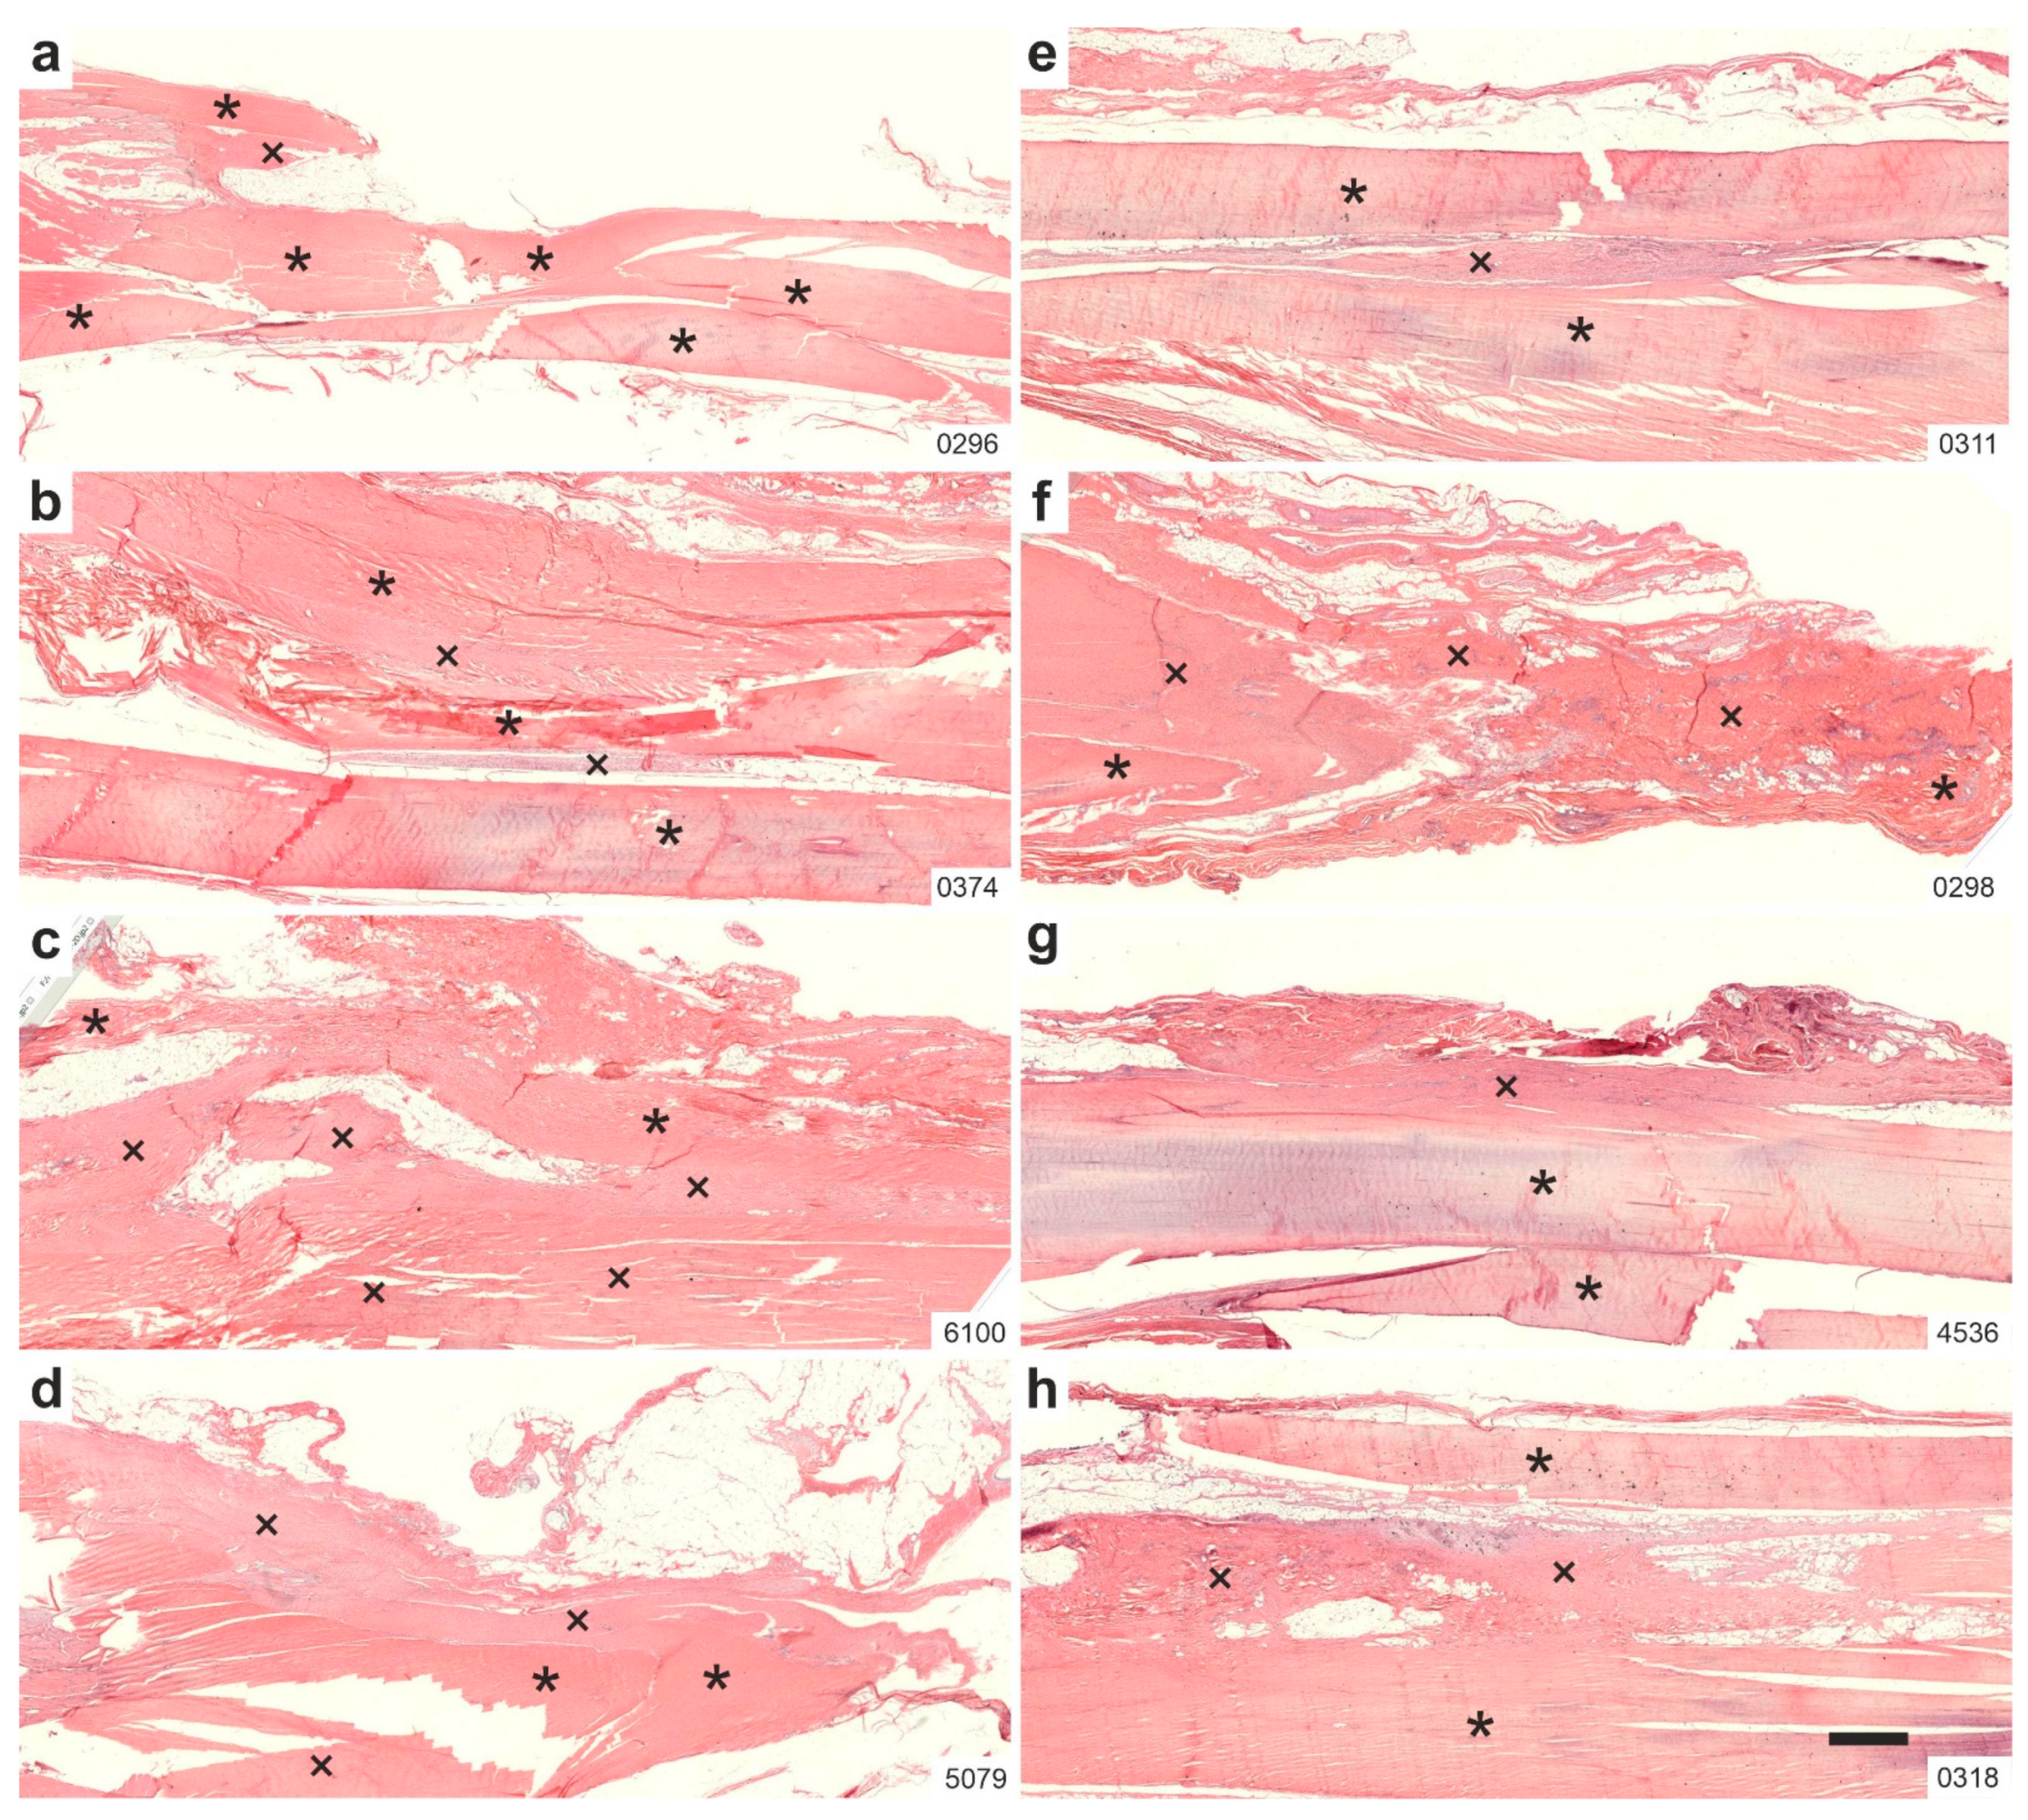
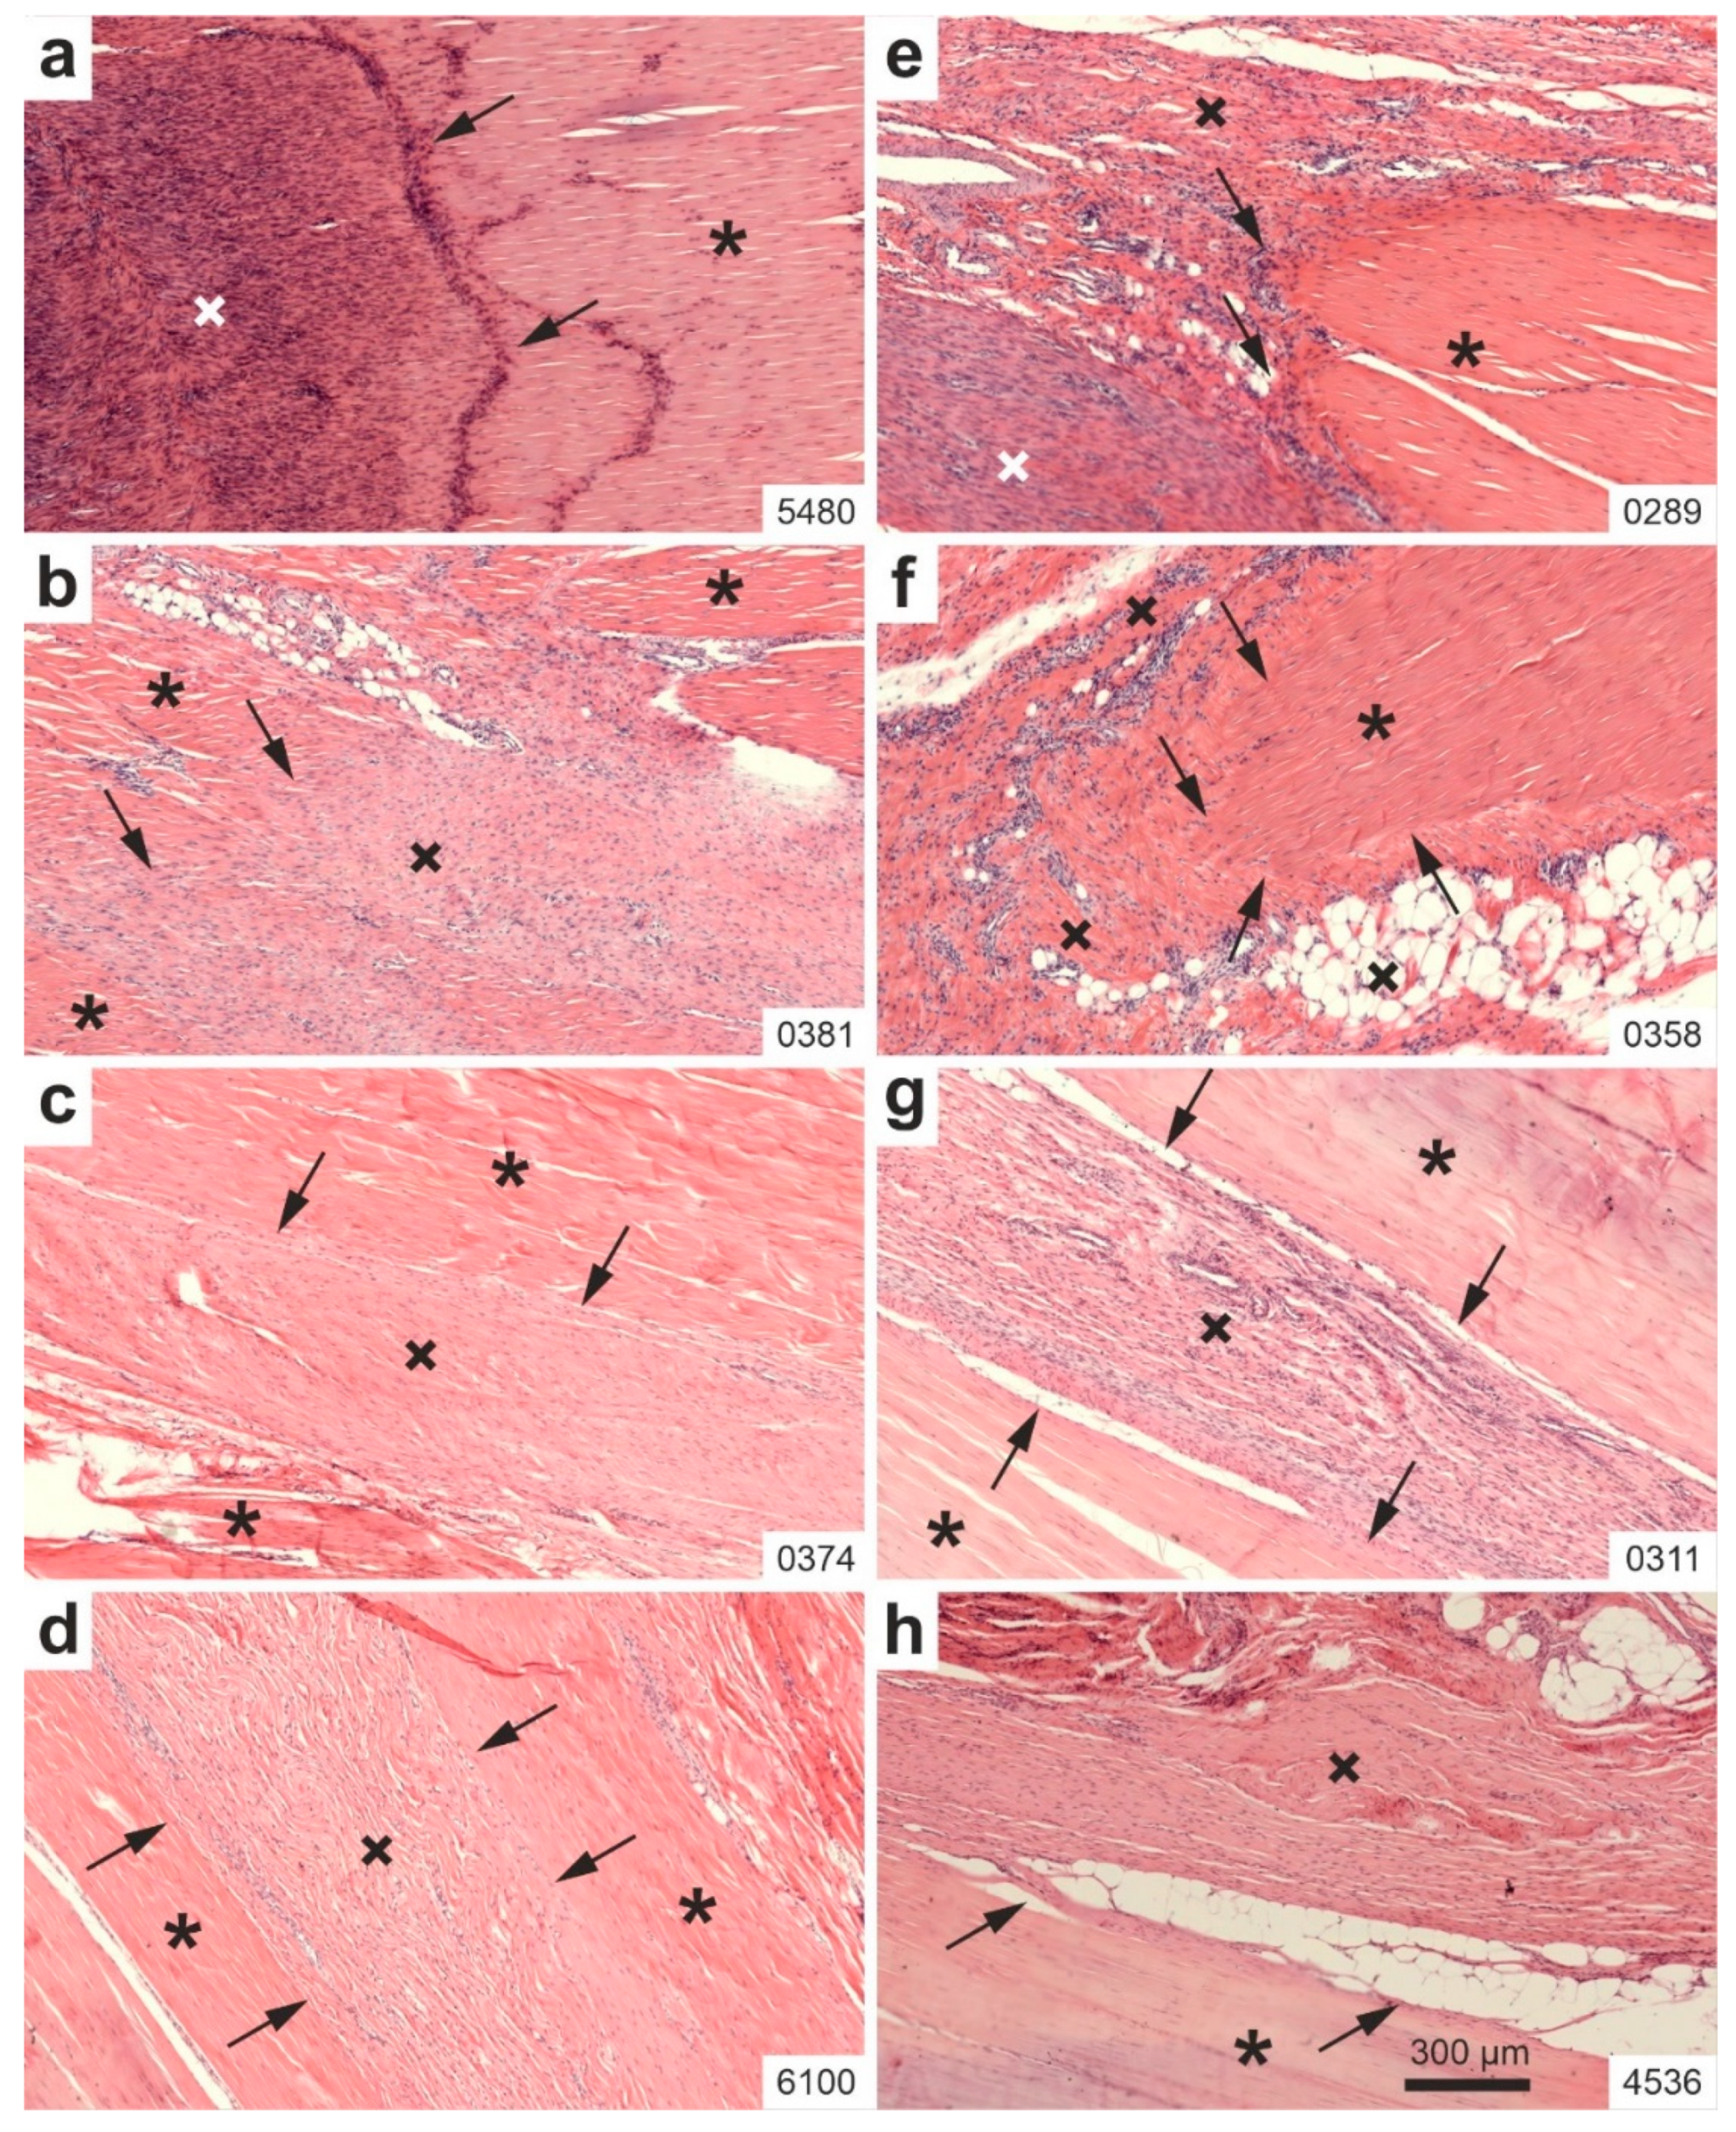
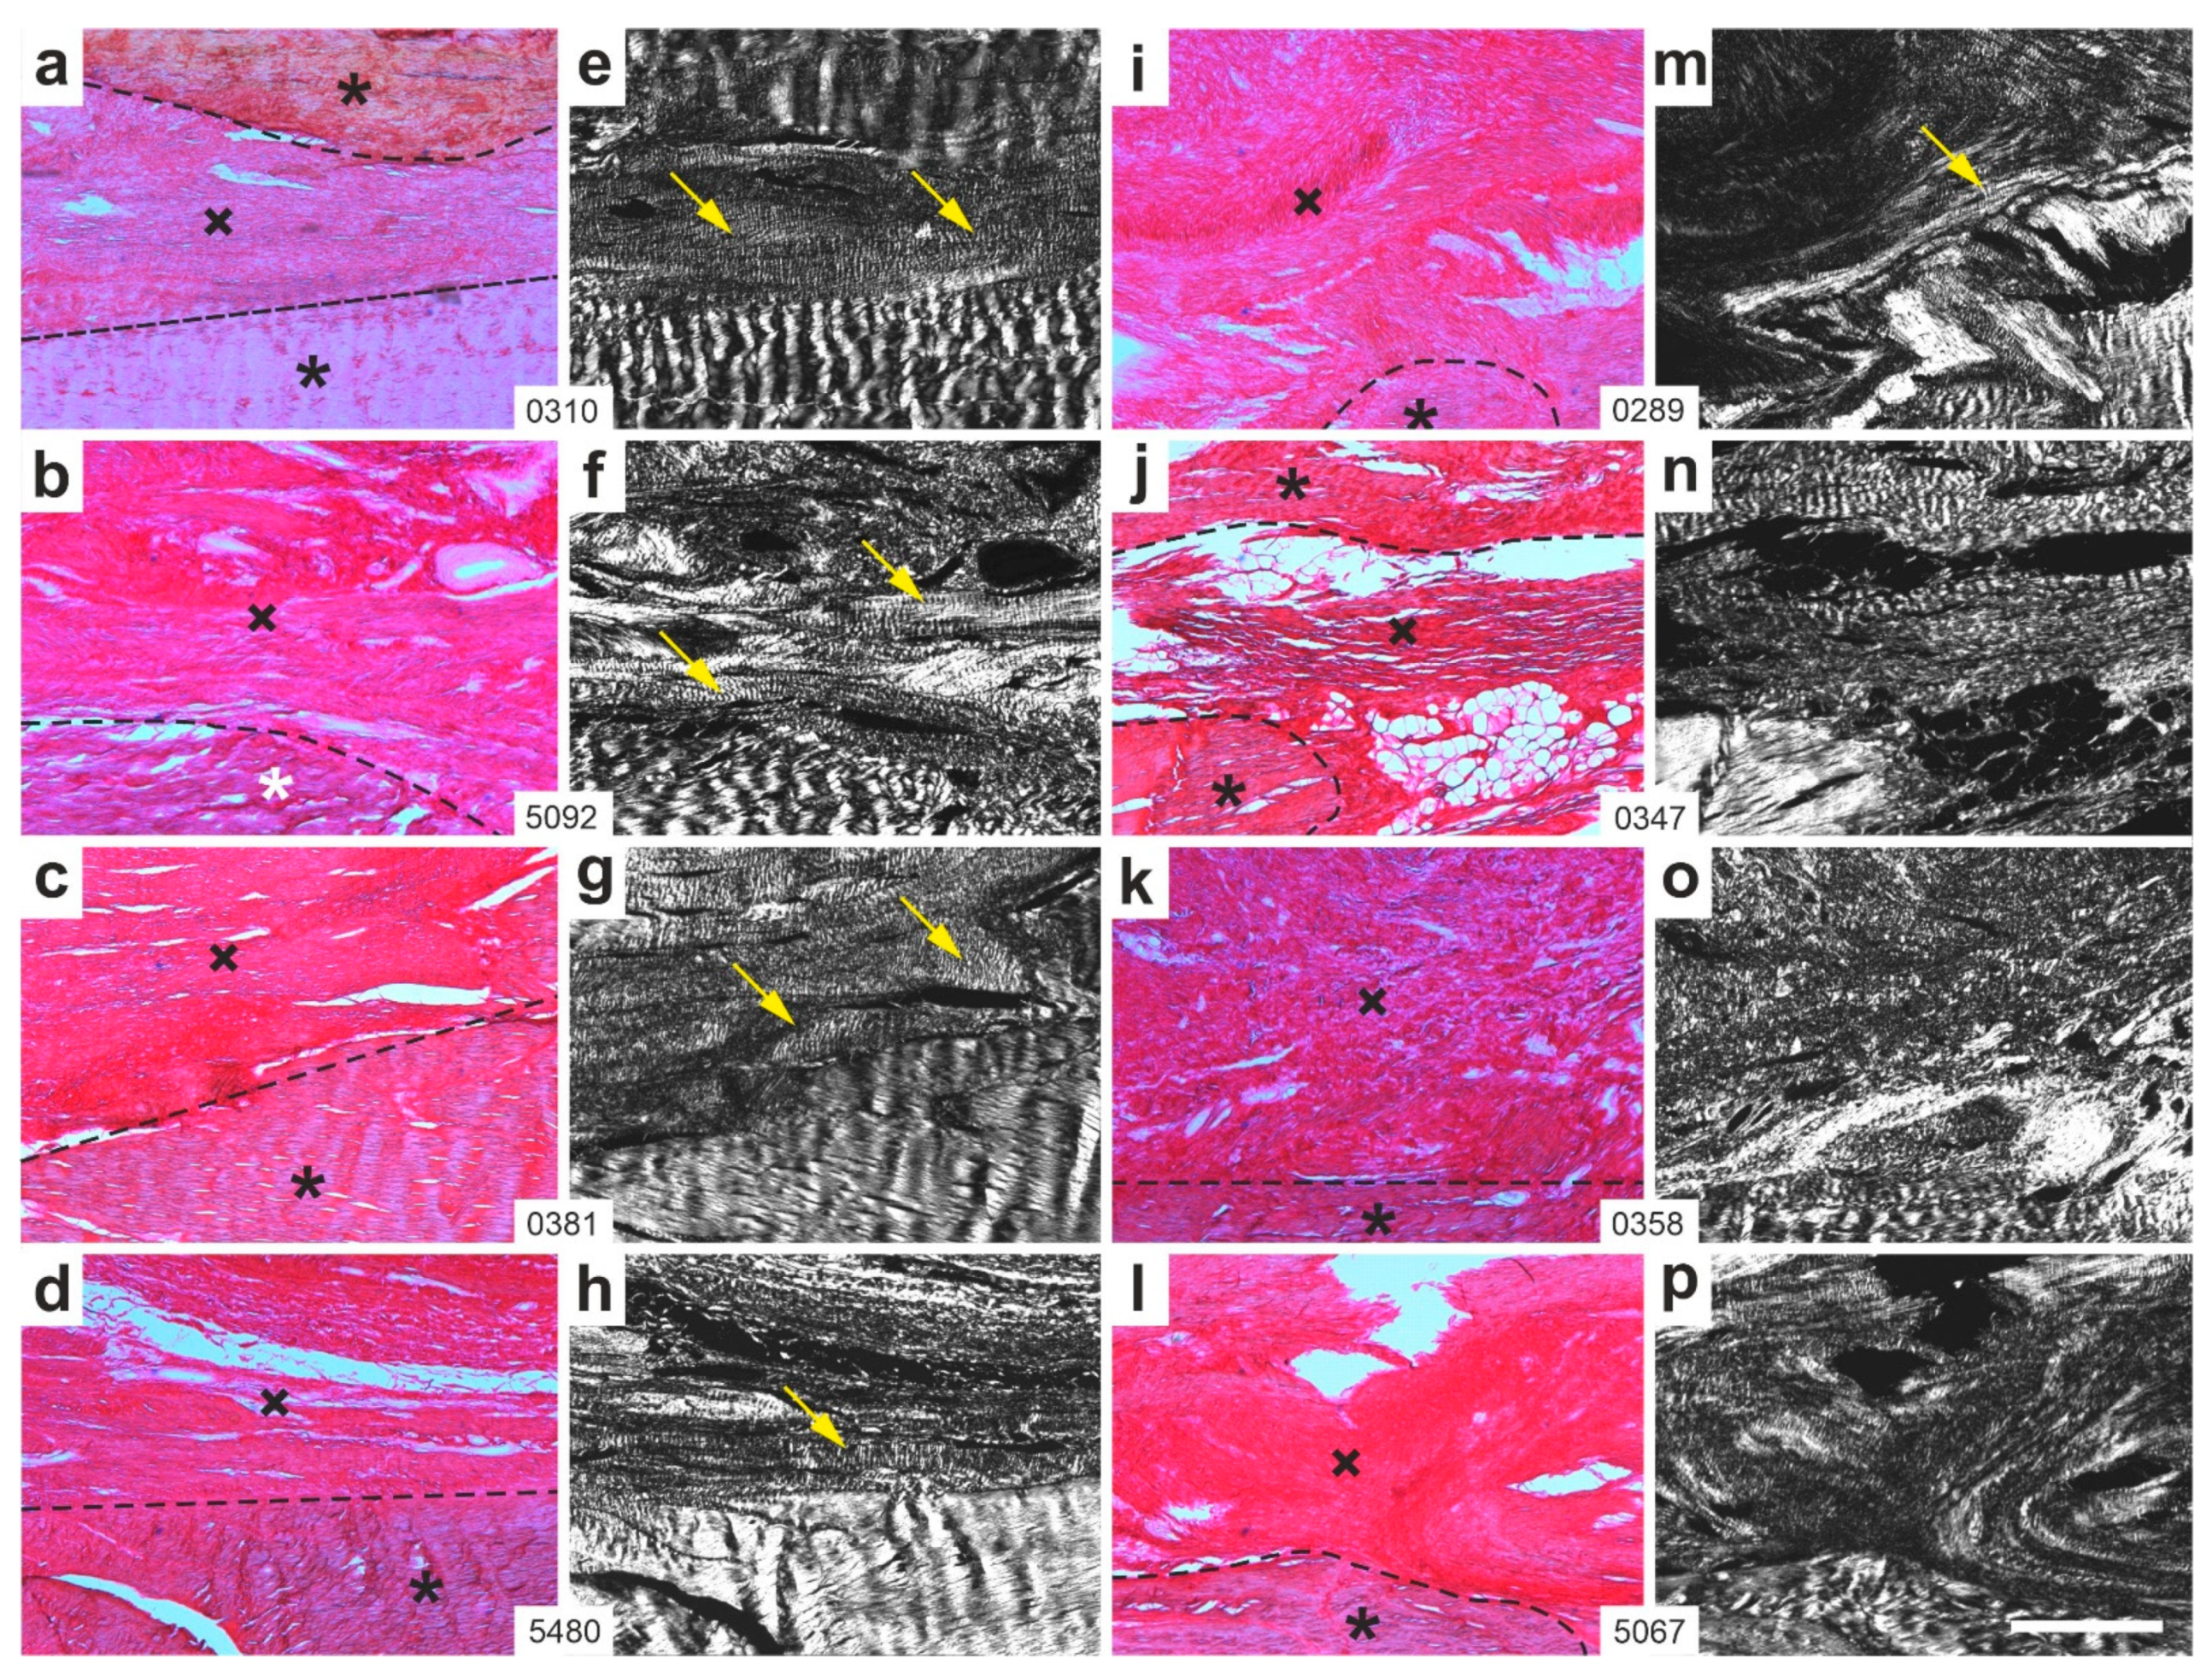
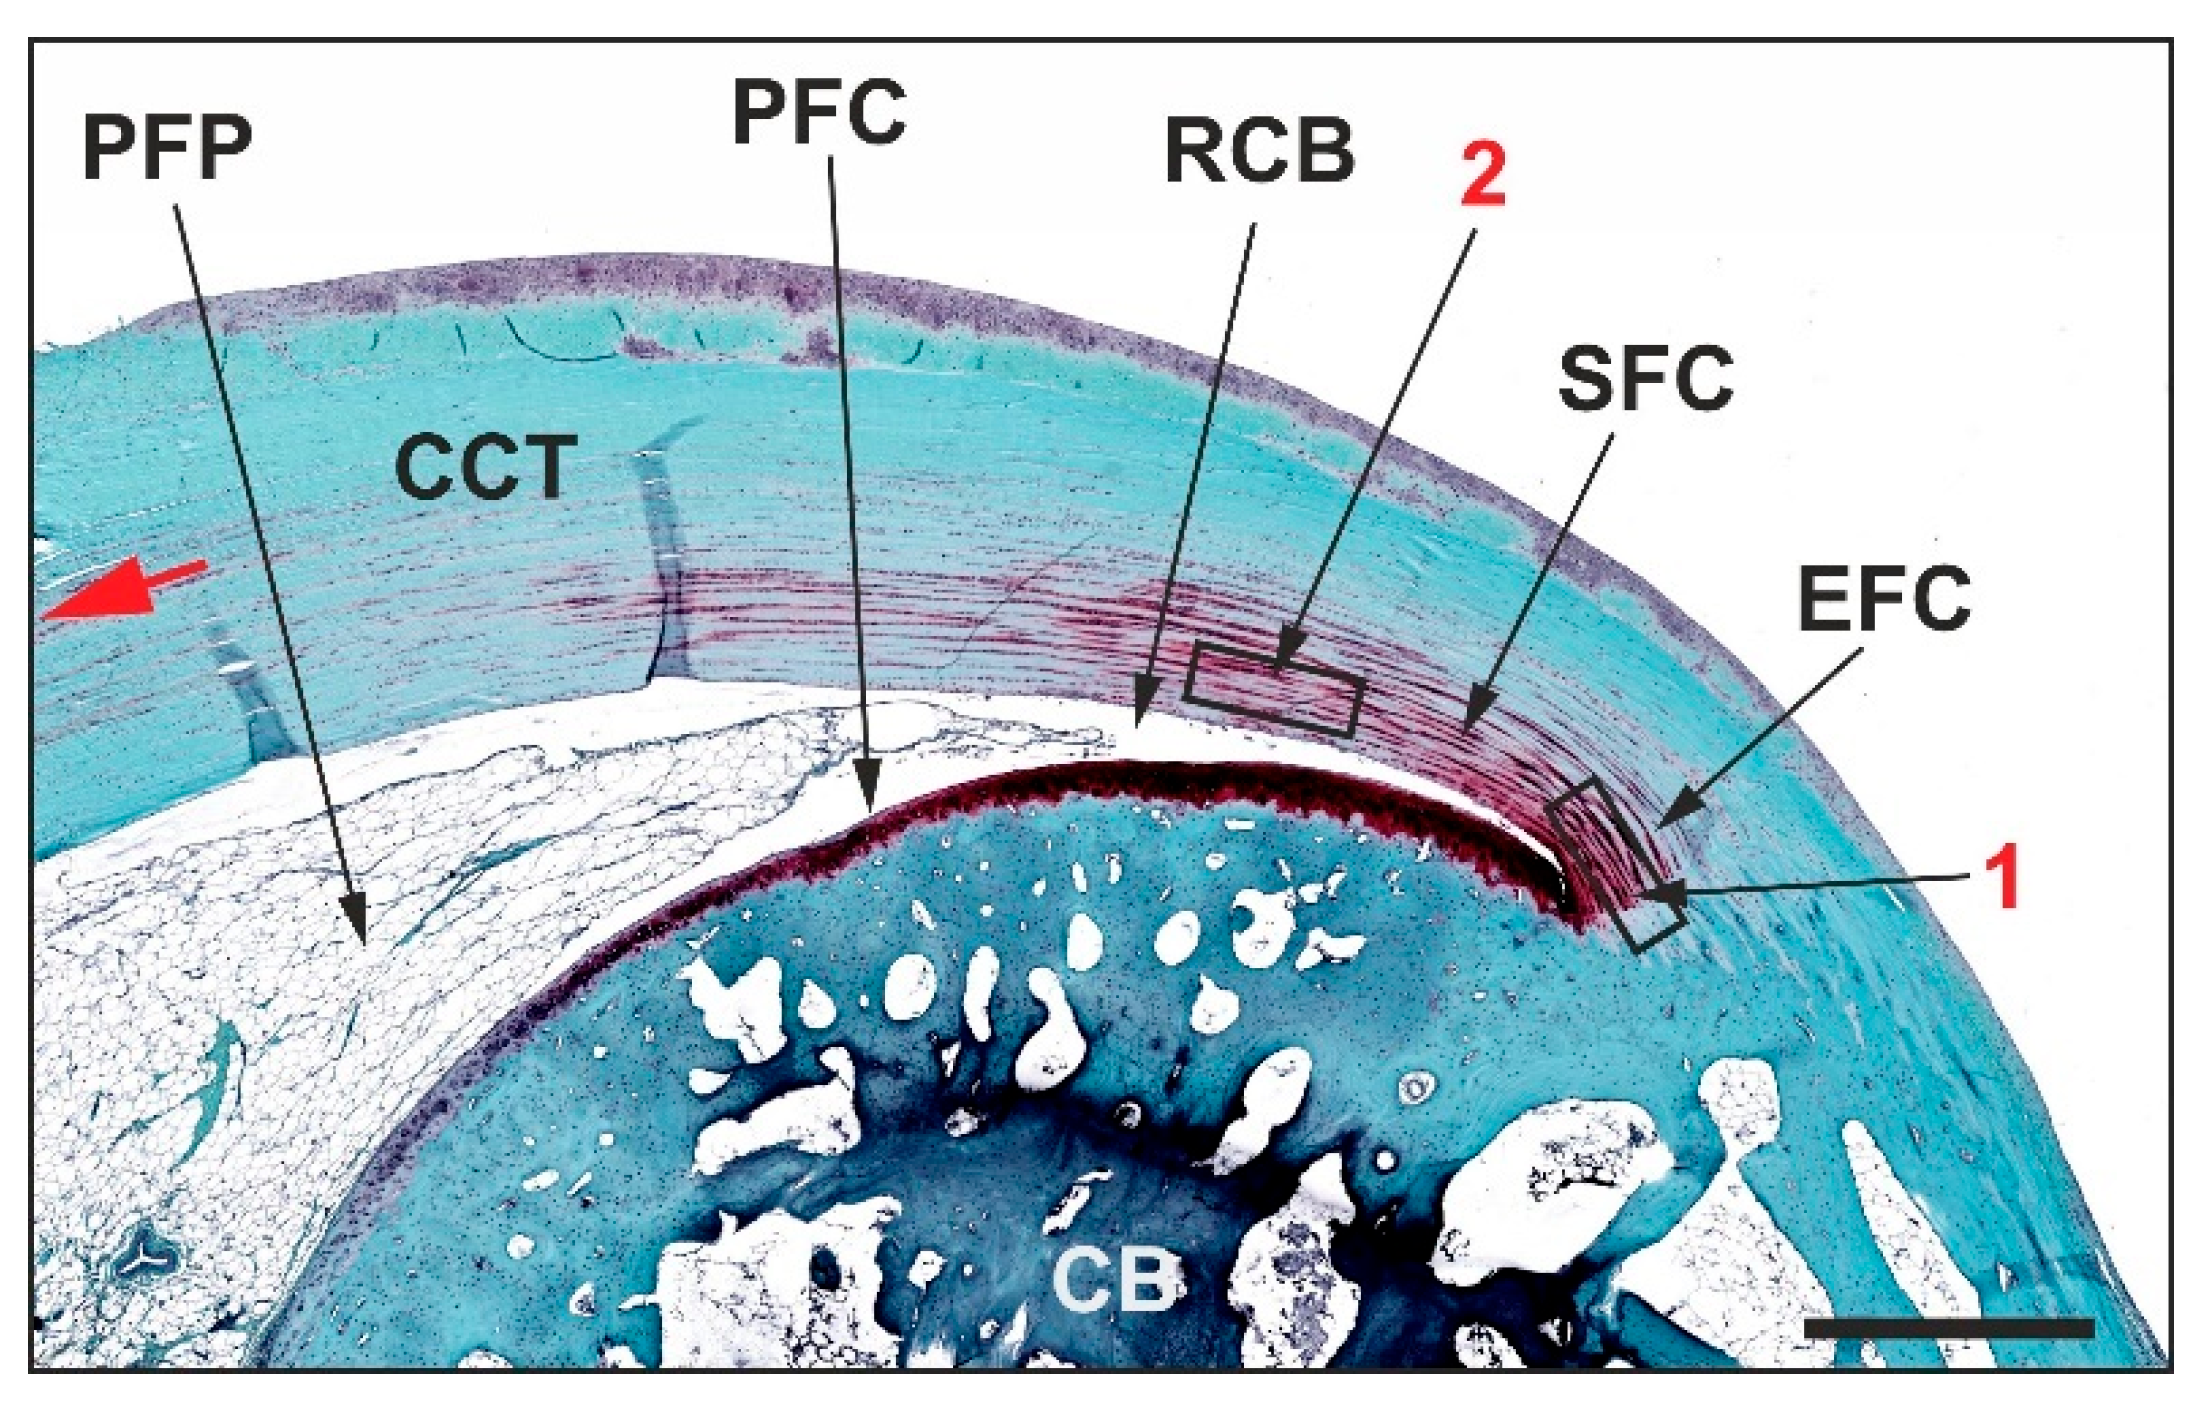
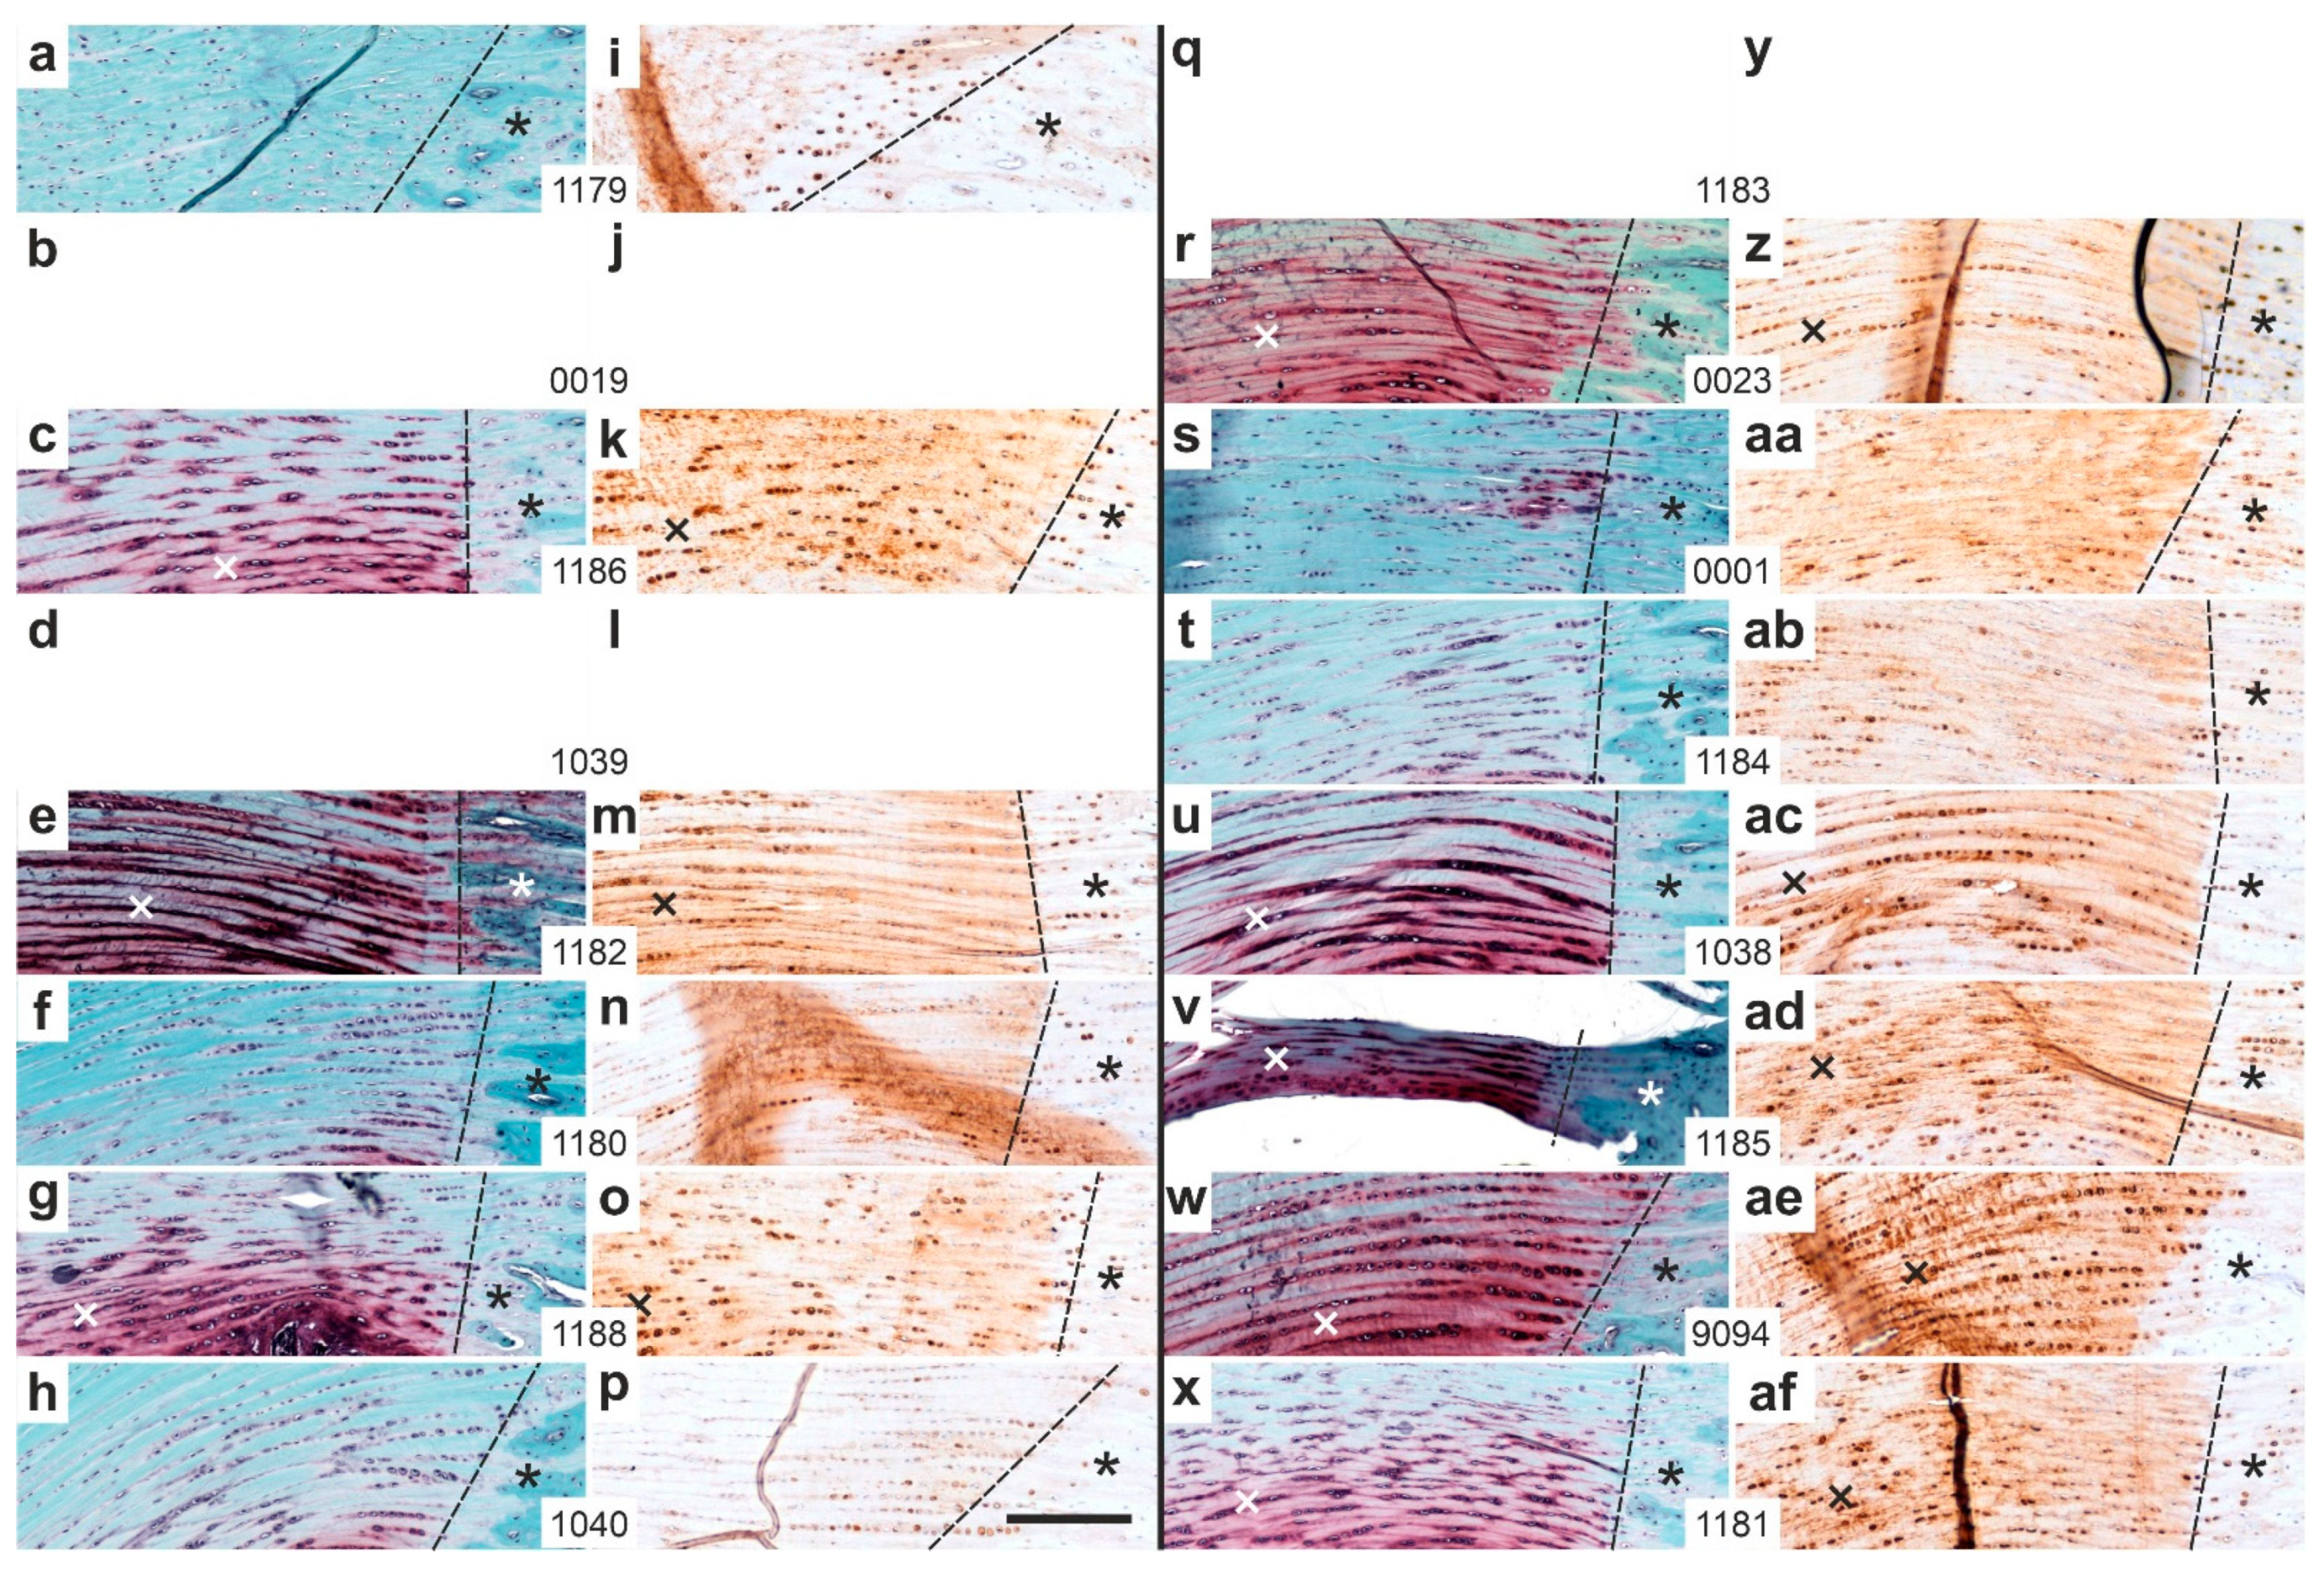
2.1. Histology
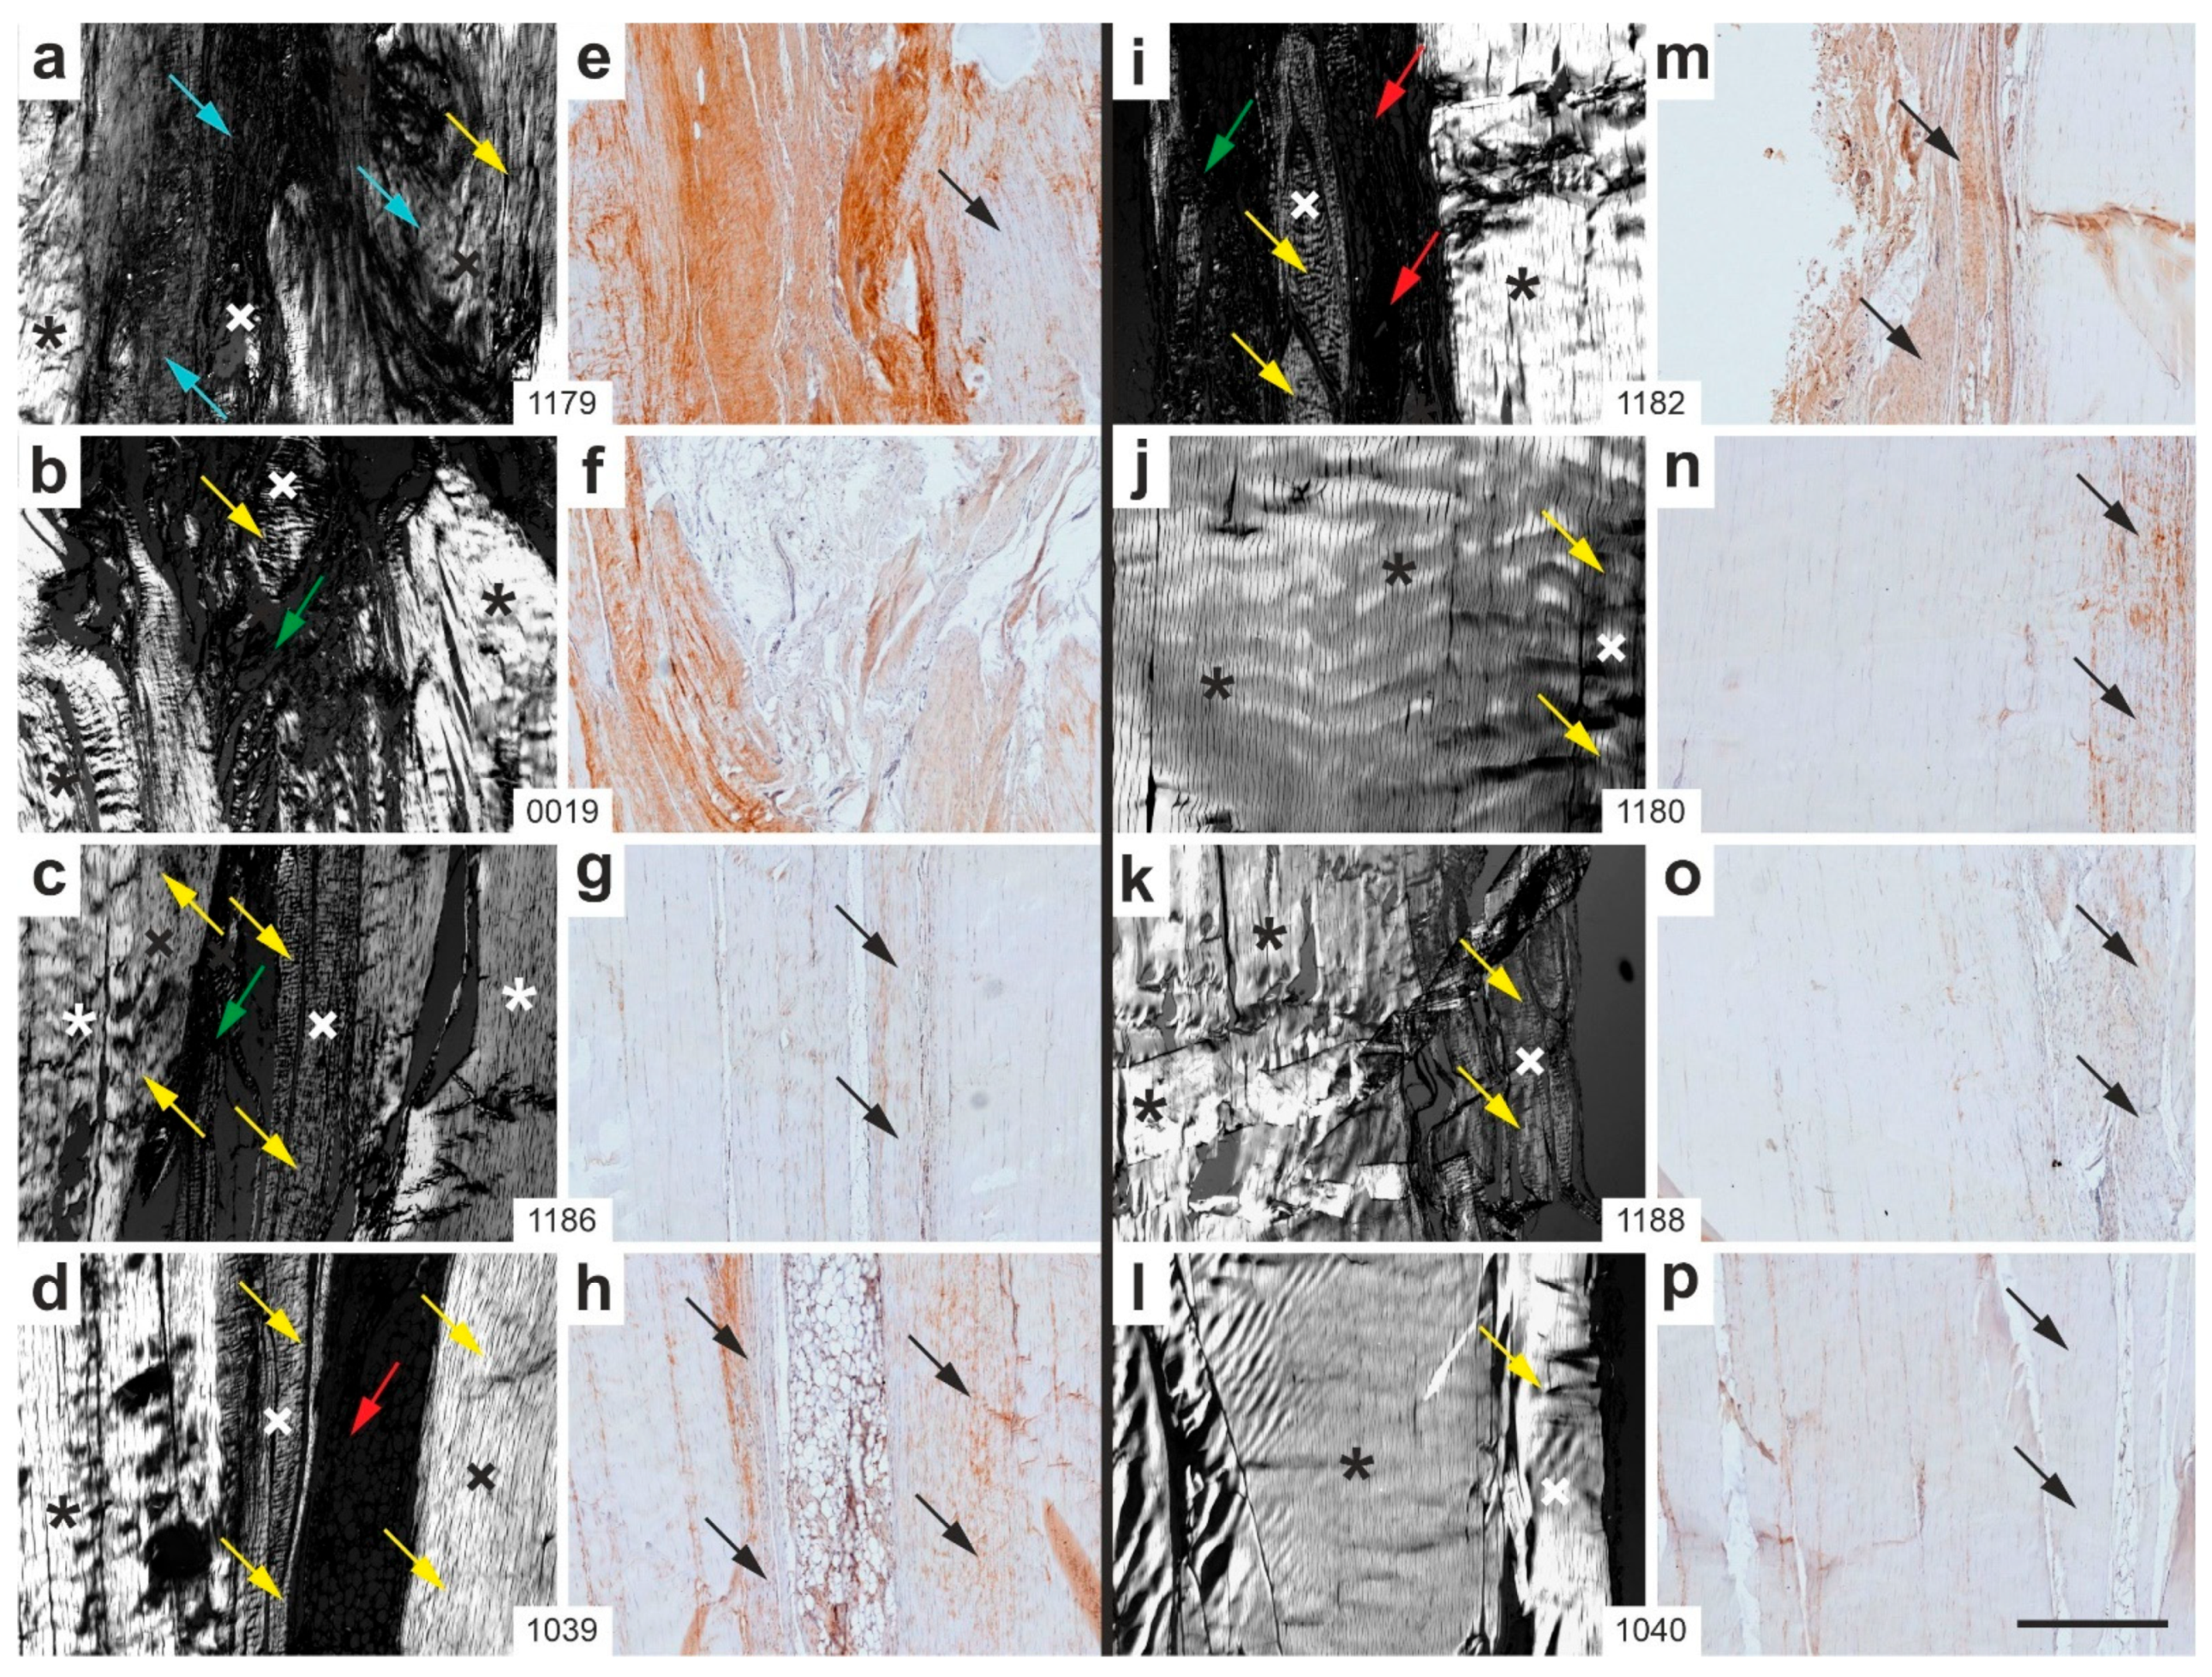
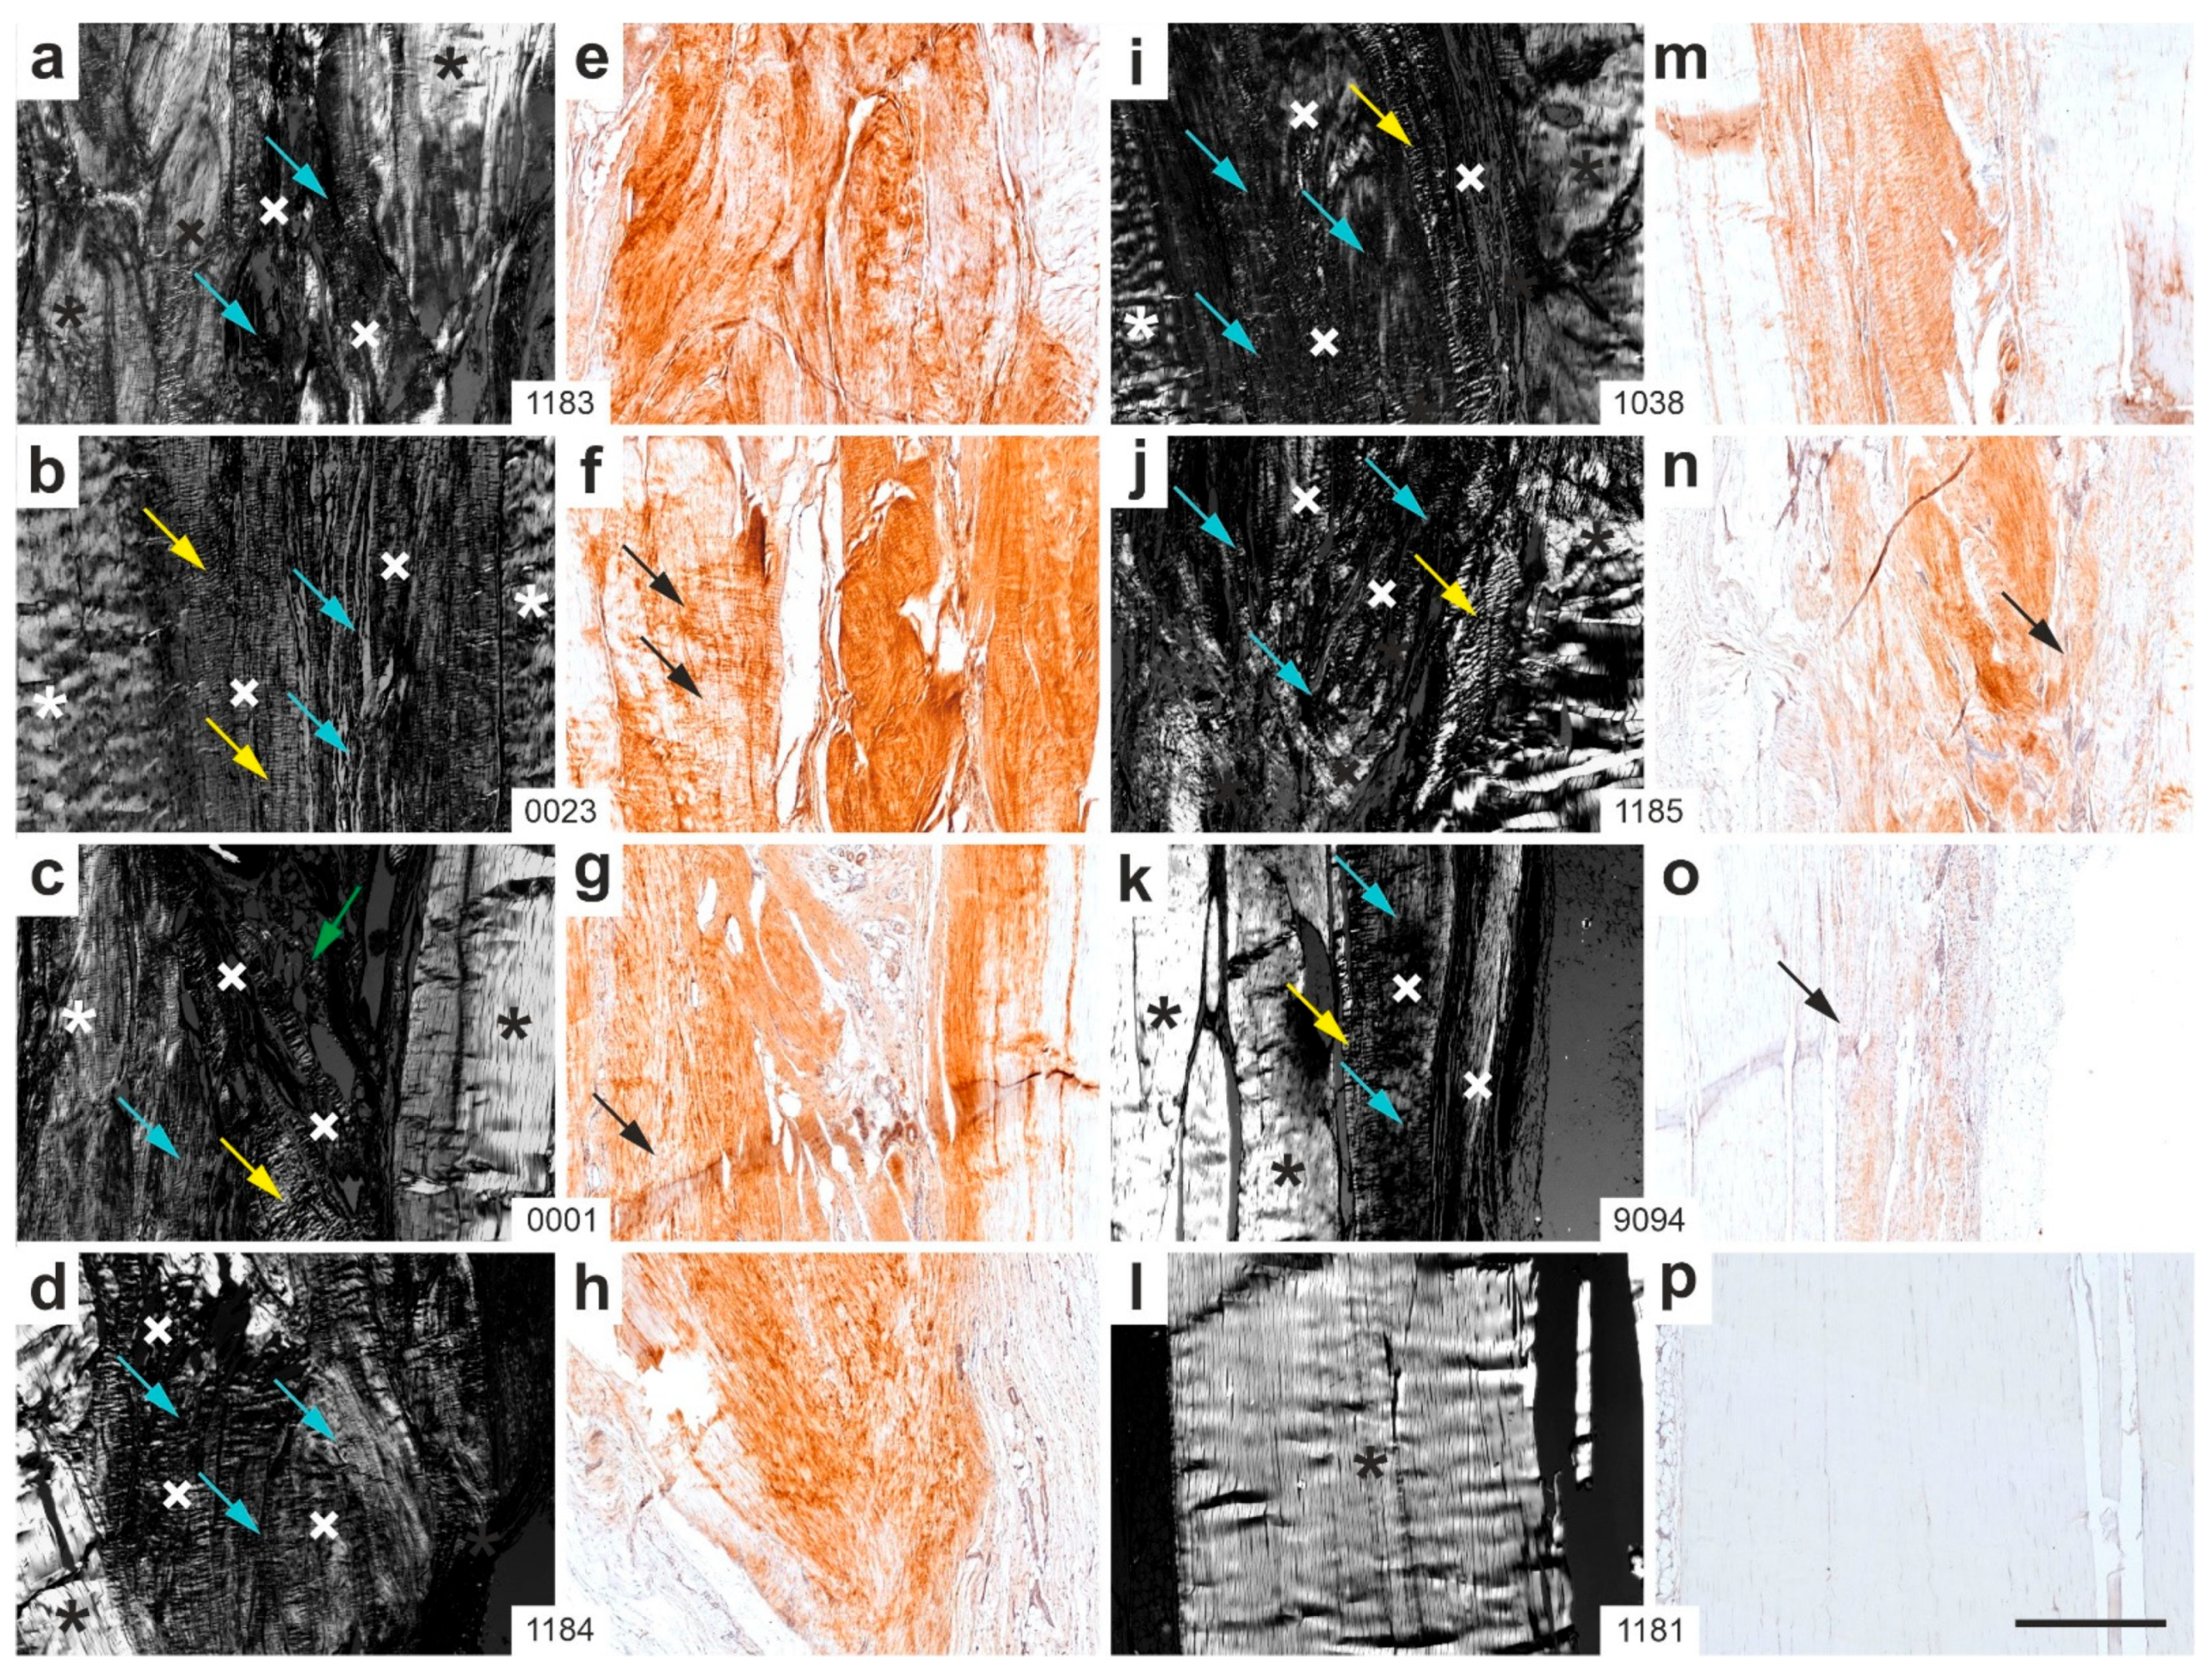
2.2. Polarization Microscopy
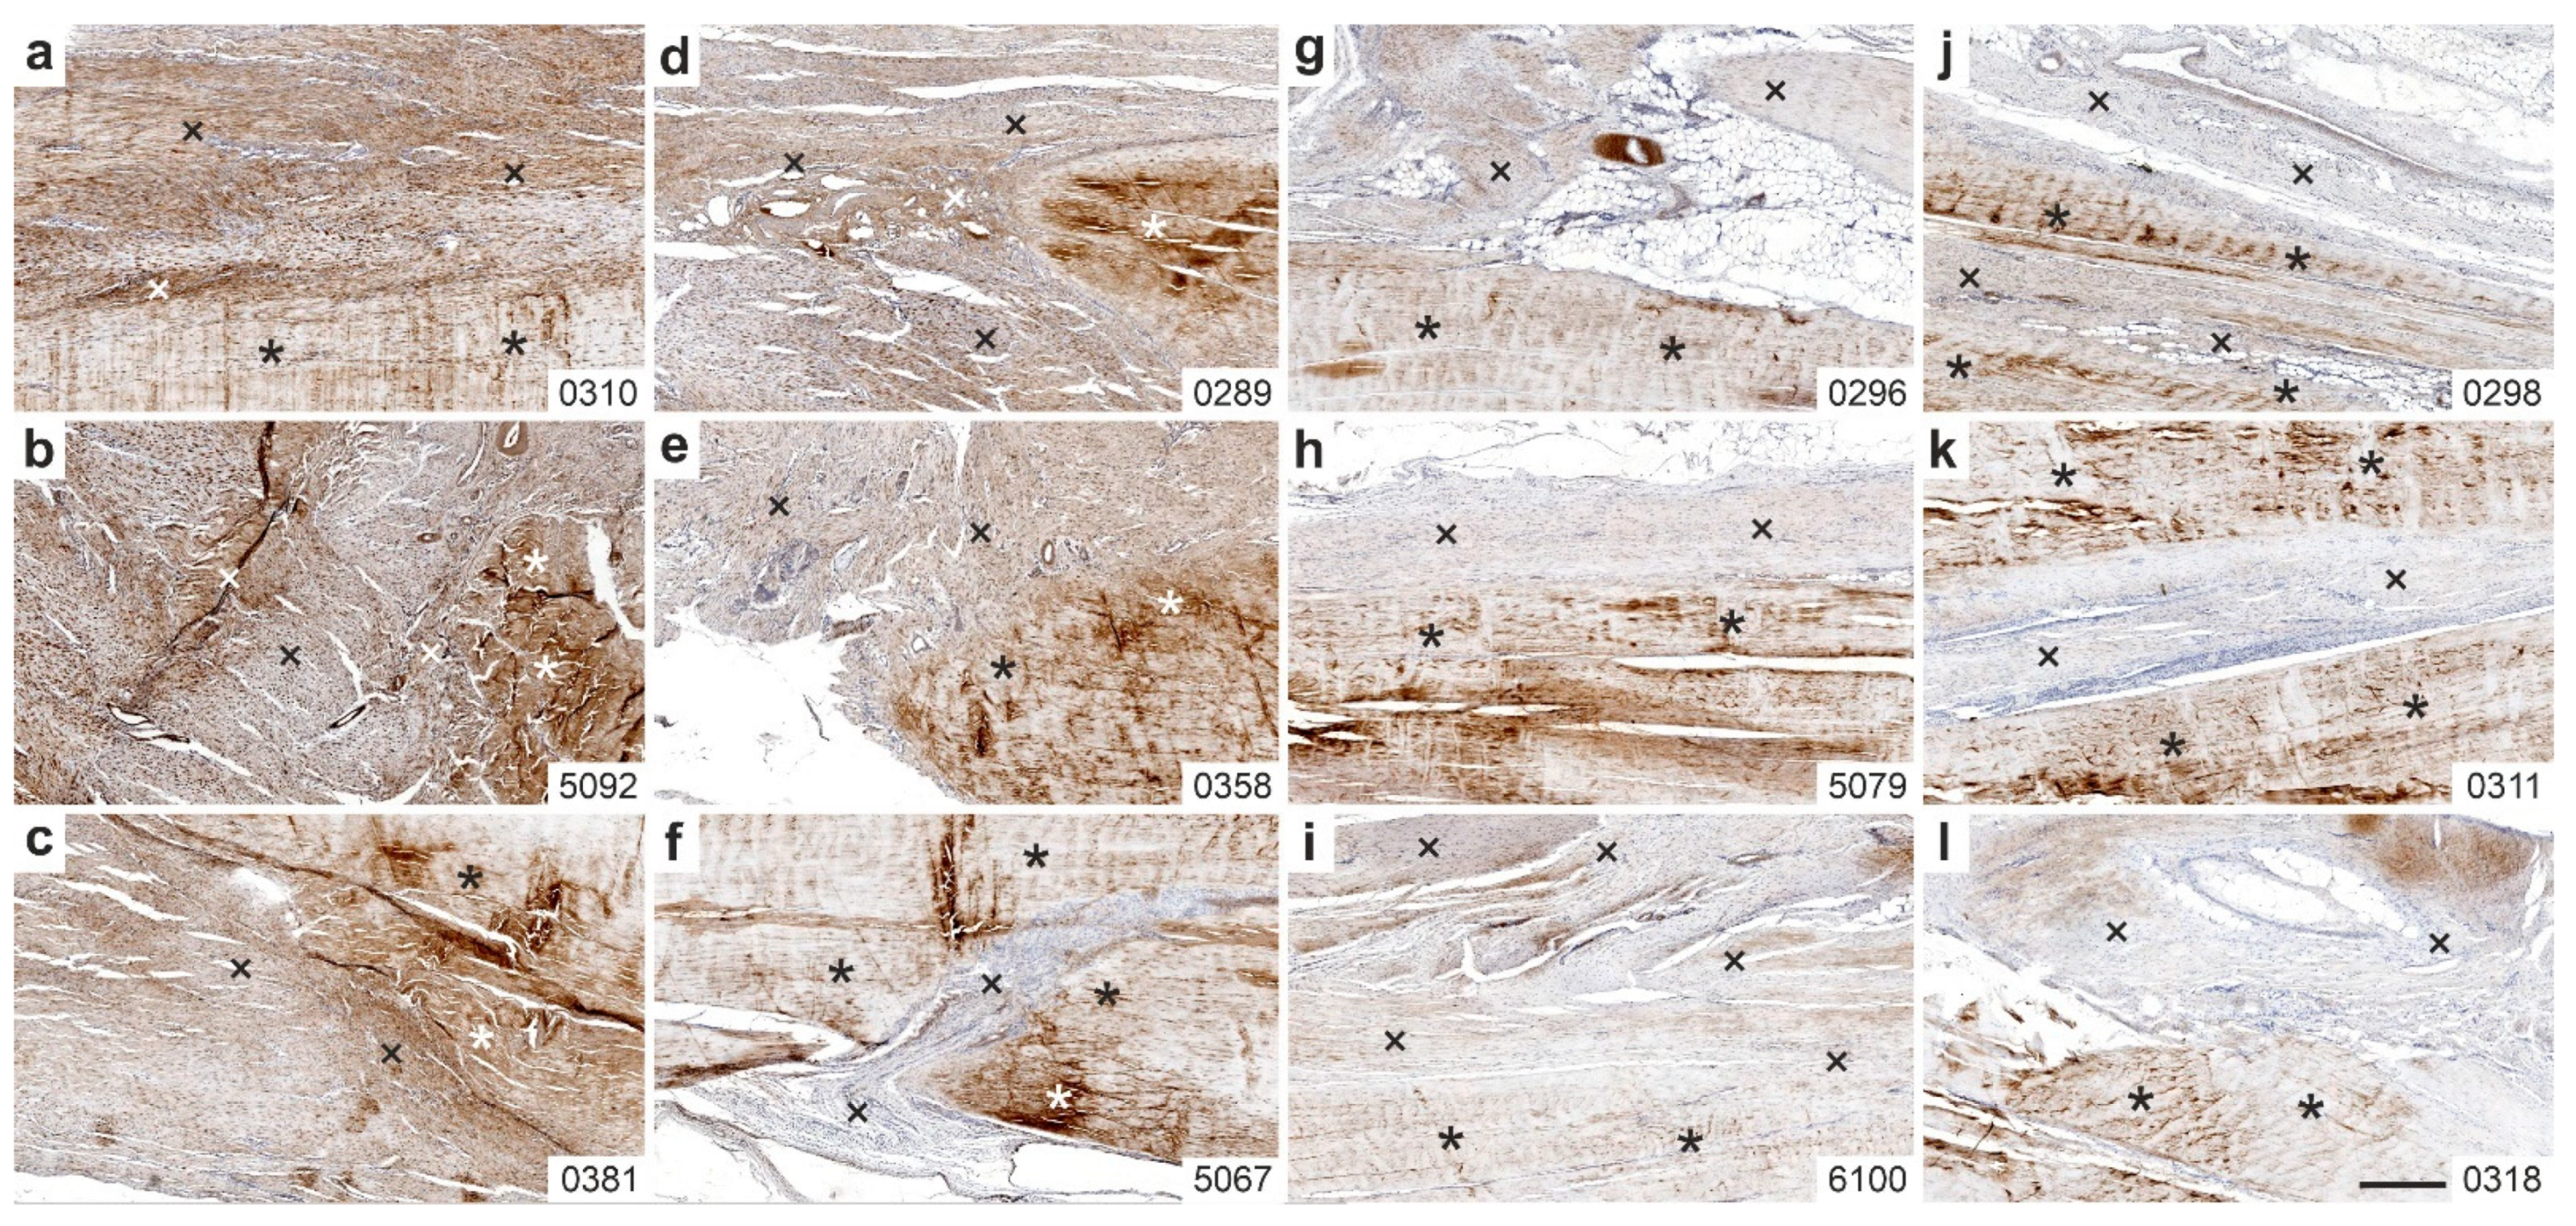
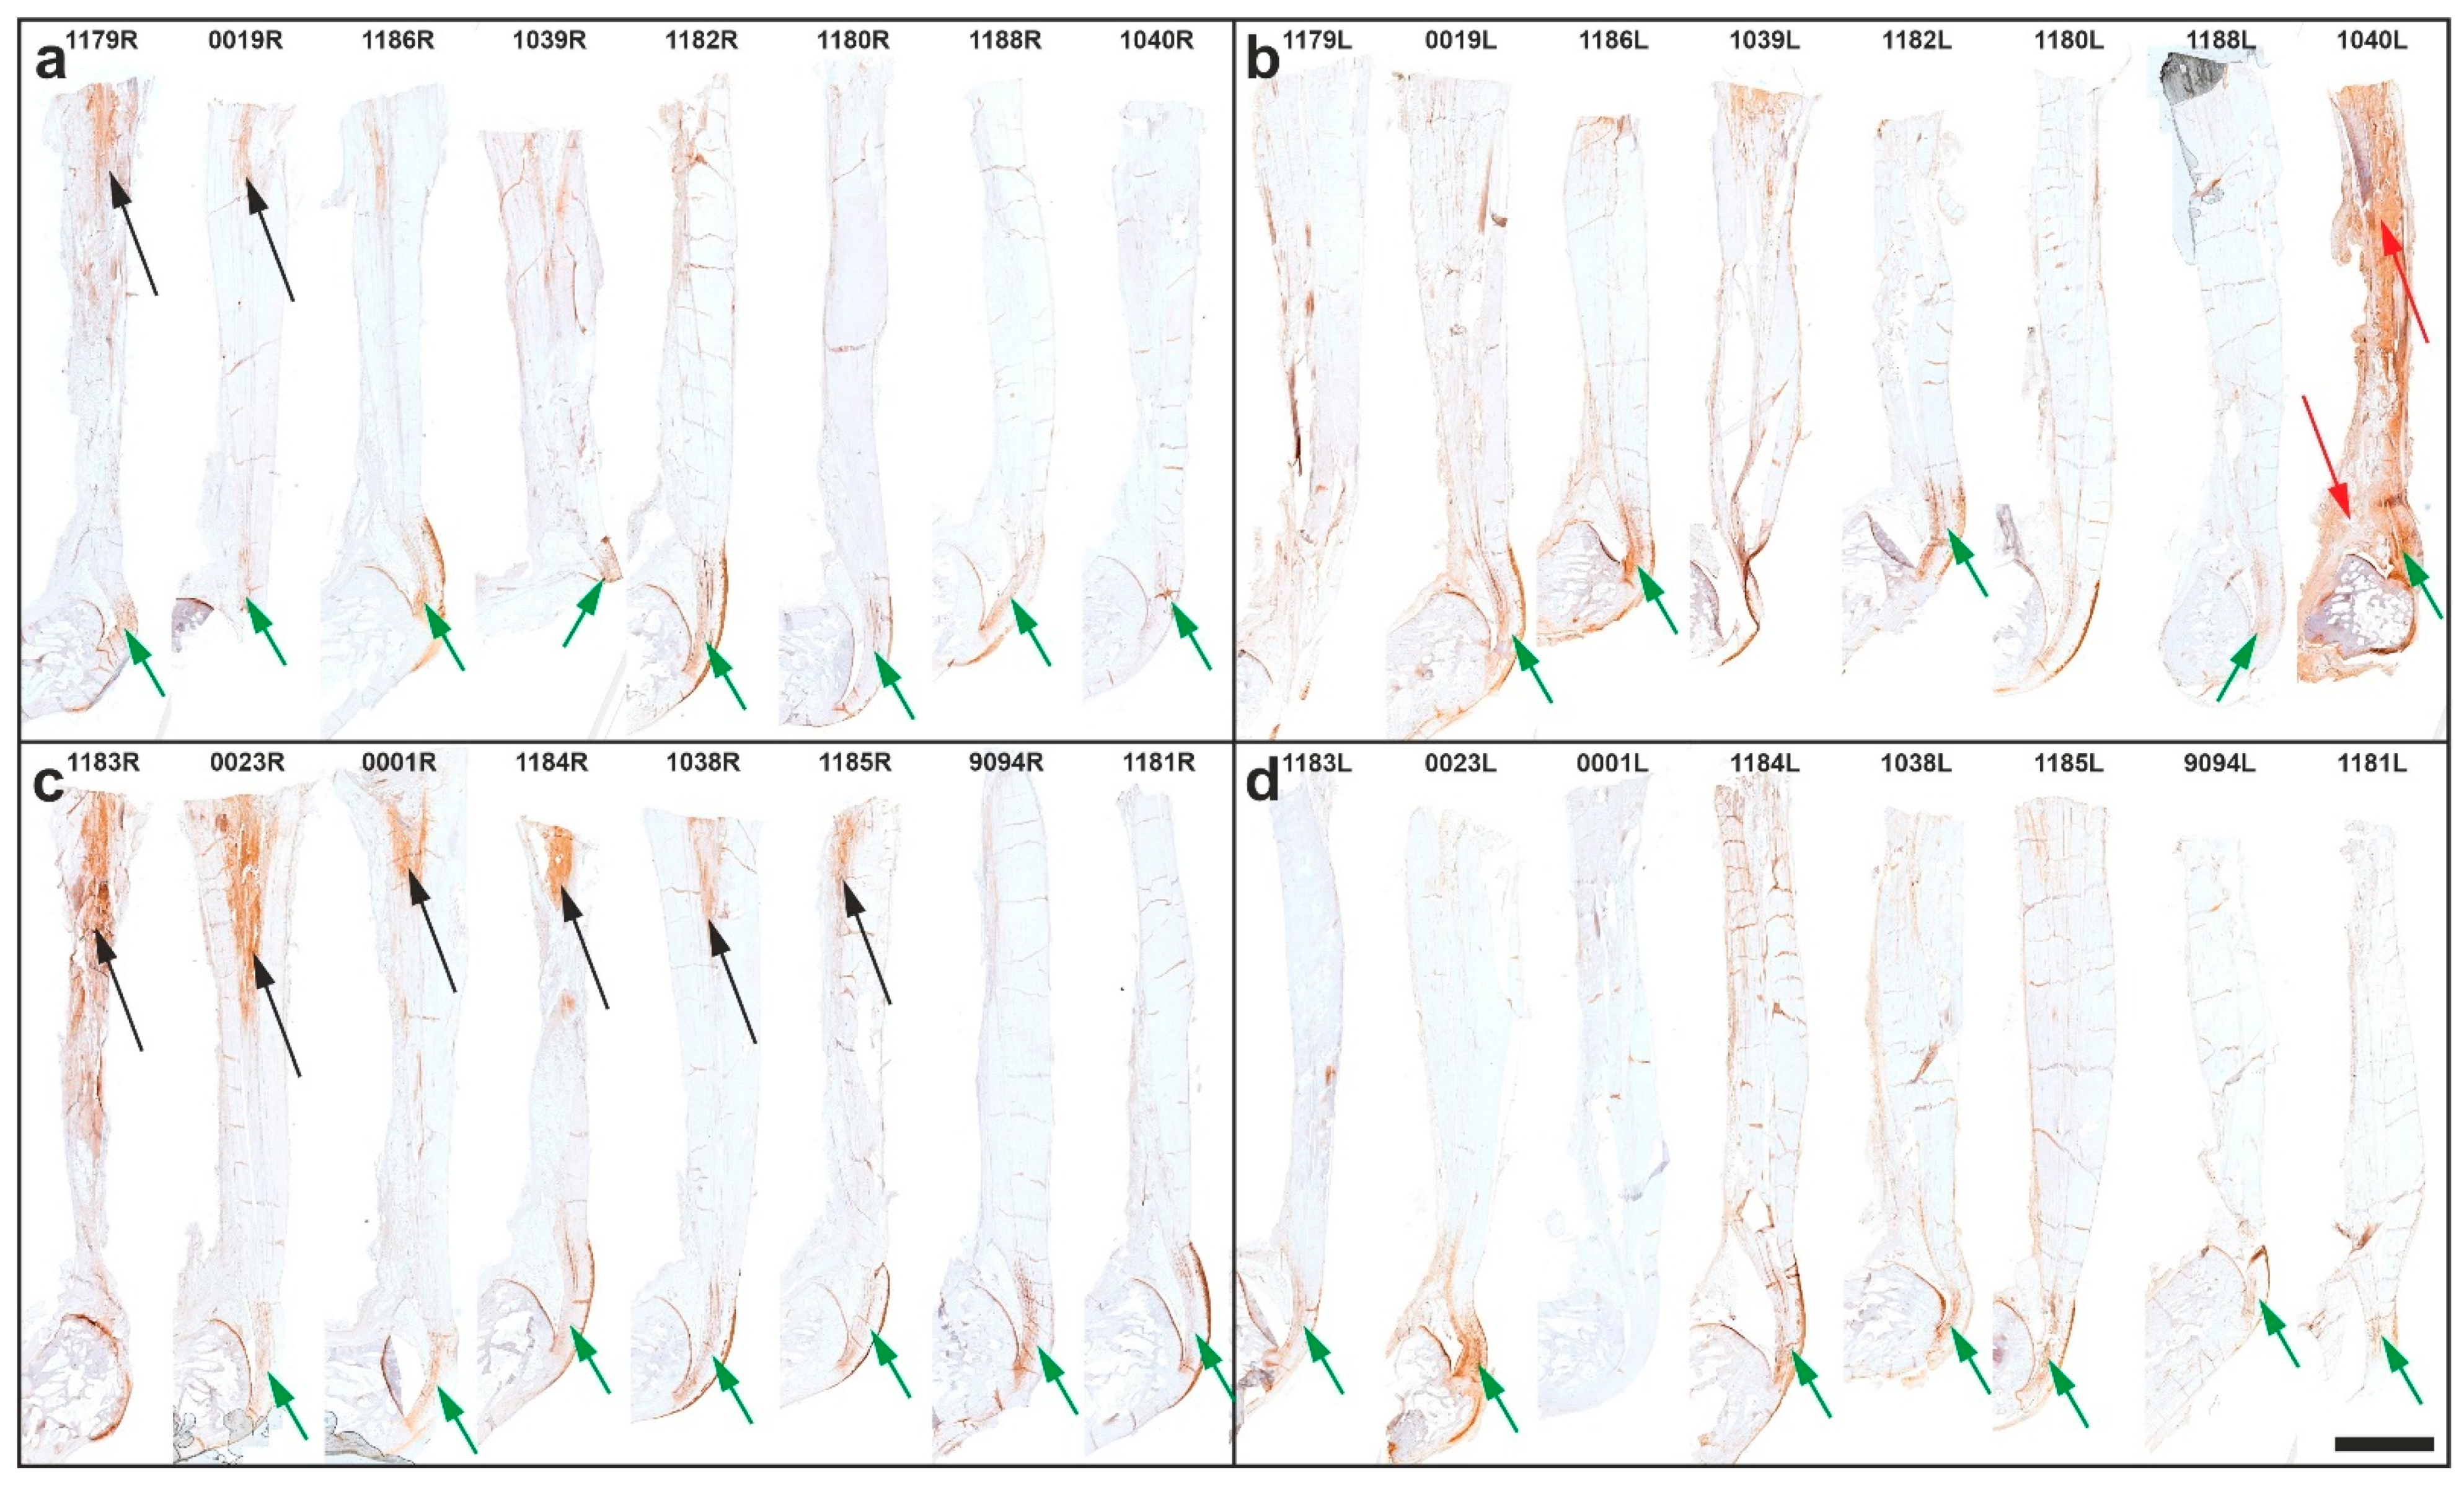
2.3. Immunolabeling of Type I Procollagen
2.4. Immunolabeling of Type III Collagen
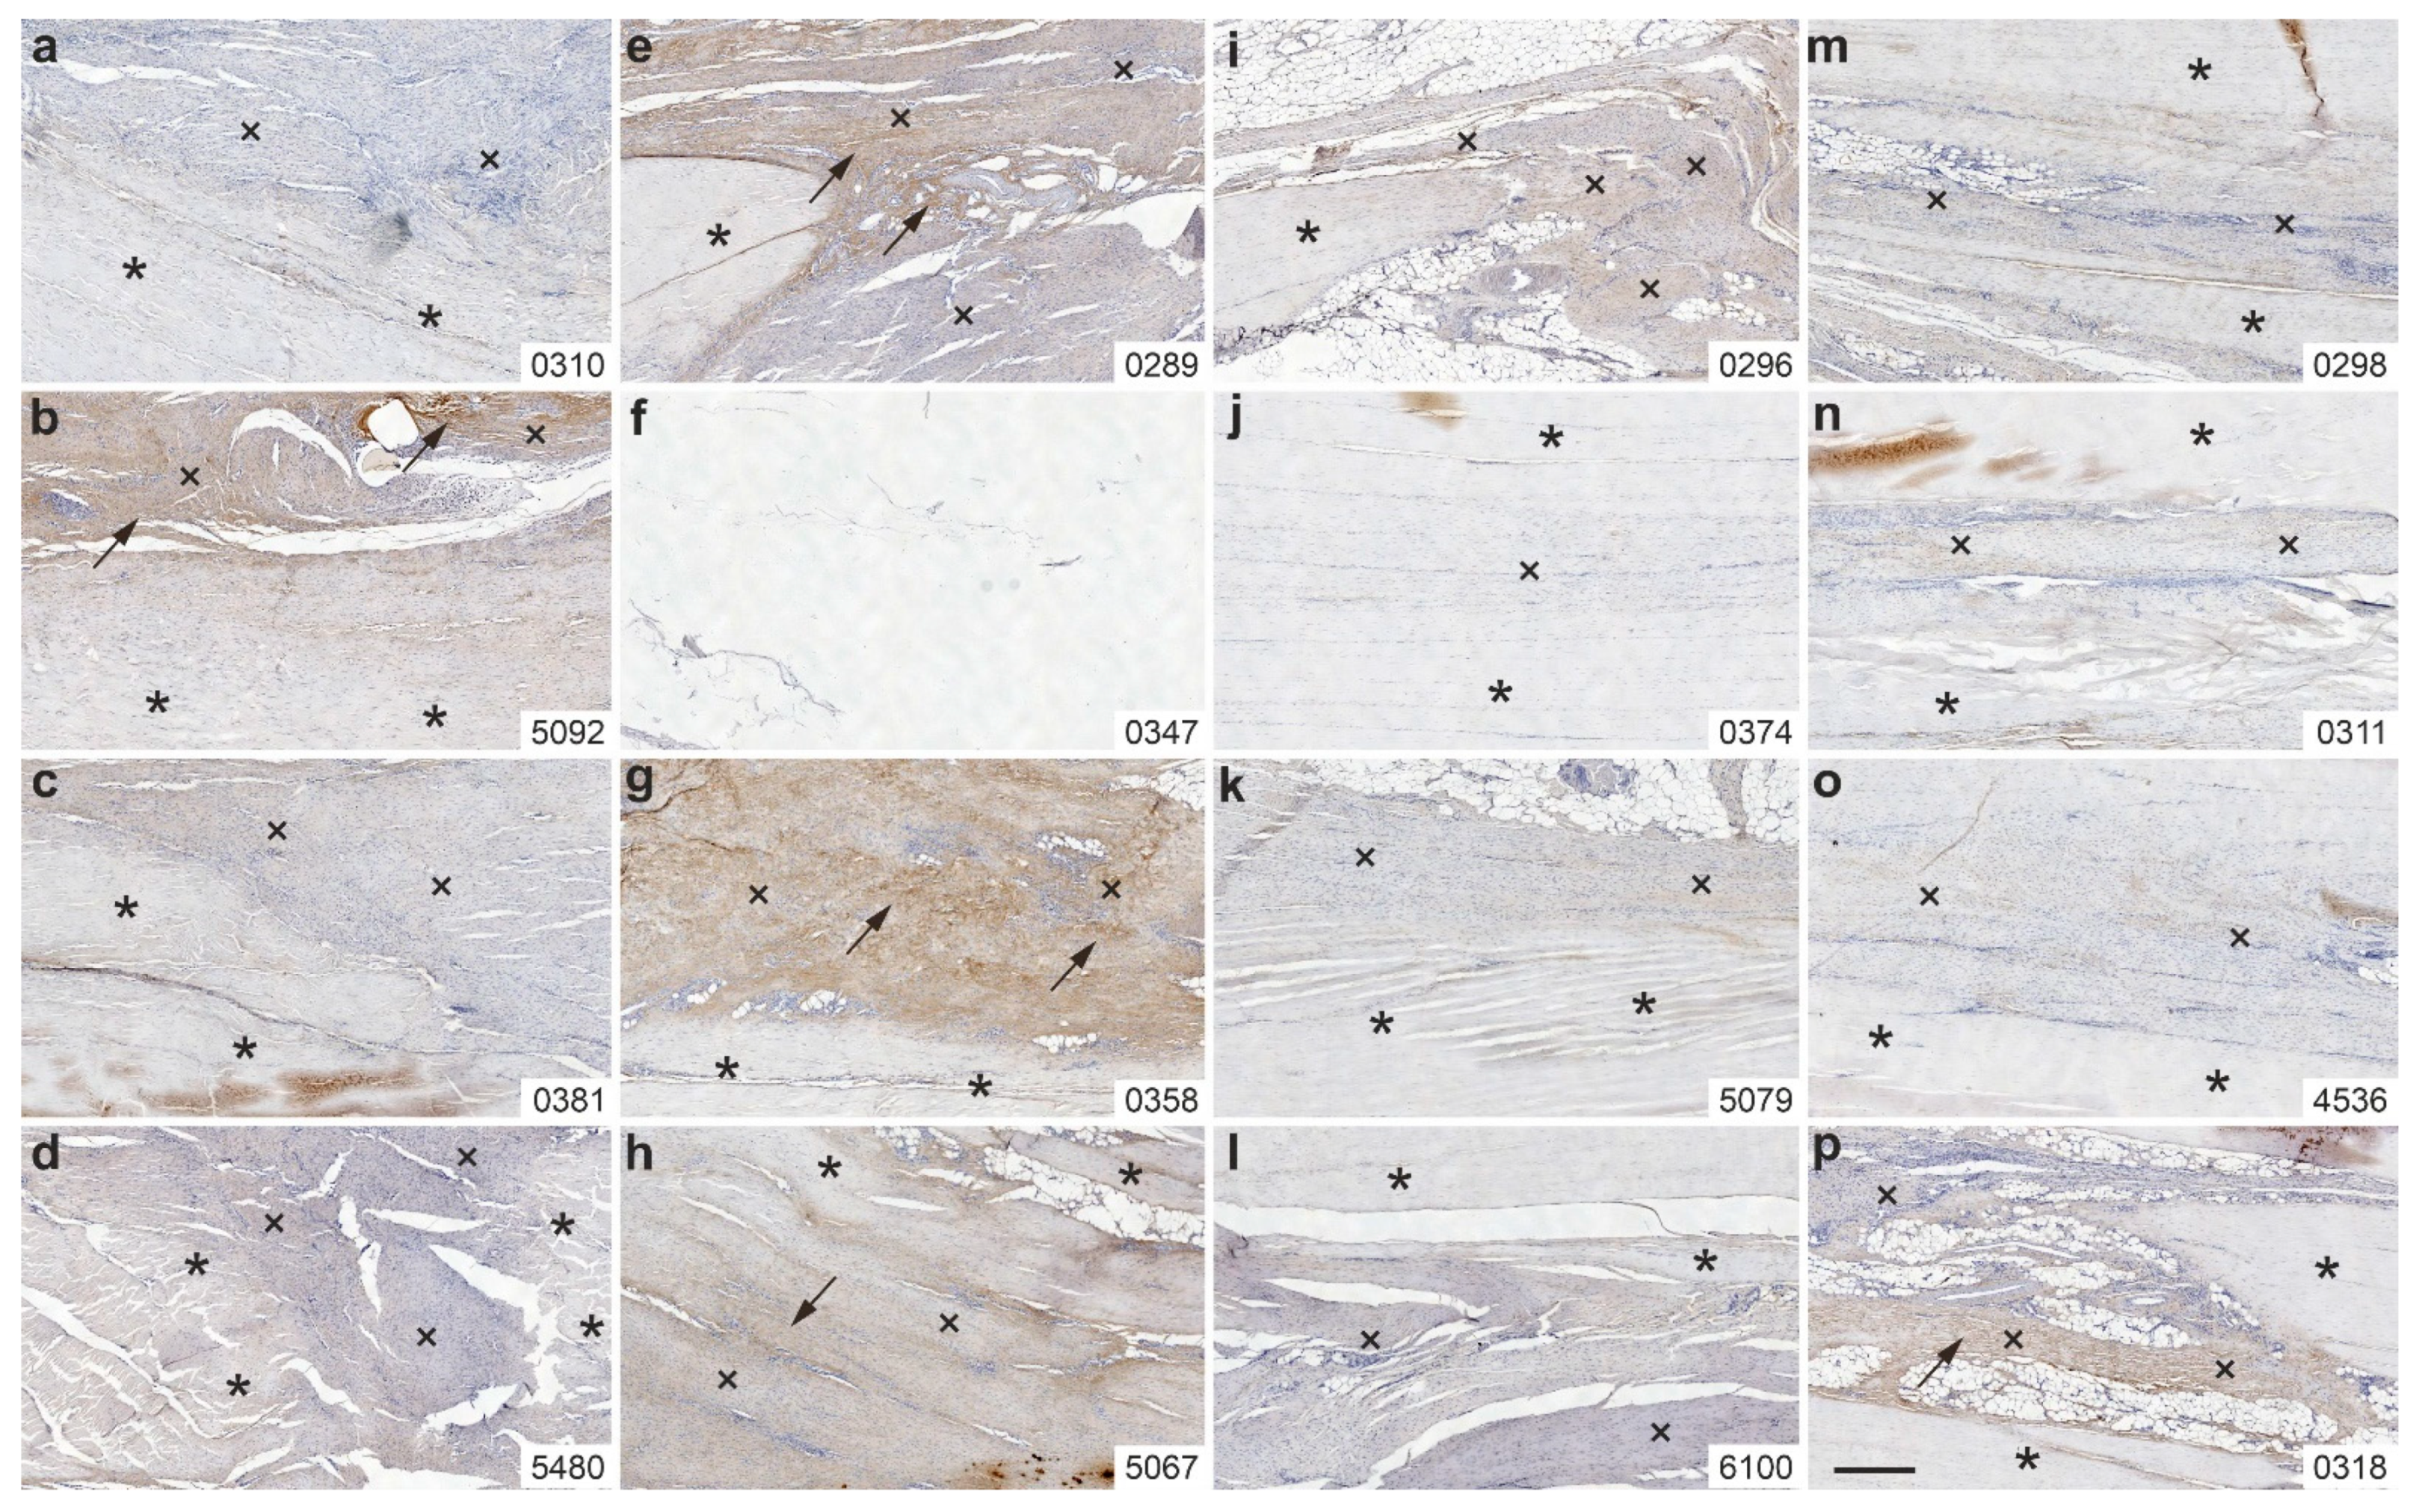
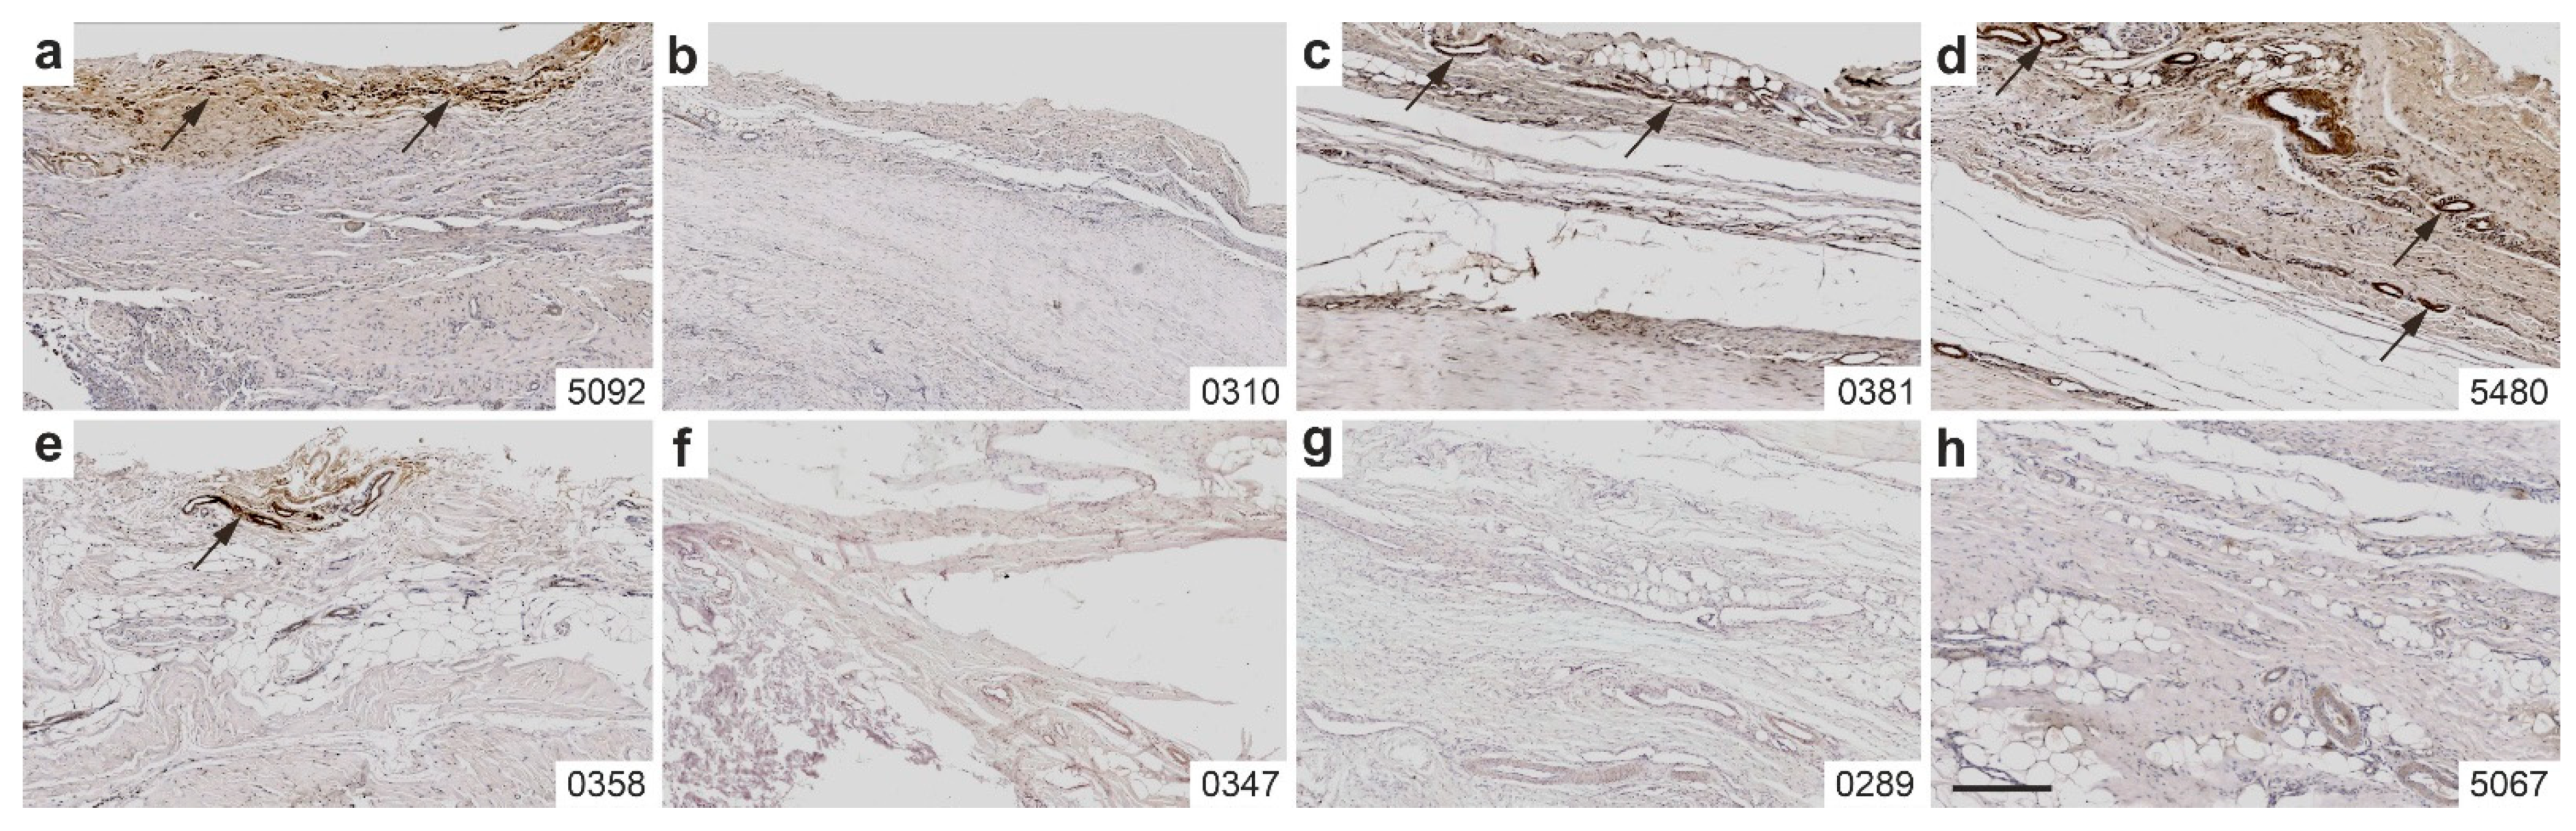
2.5. Immunolabeling of CD163
2.6. Immunolabeling of Aggrecan
2.7. Combination of Polarization Microscopy and Immunohistochemistry
2.8. Functional Histology and Functional Immunohistochemistry
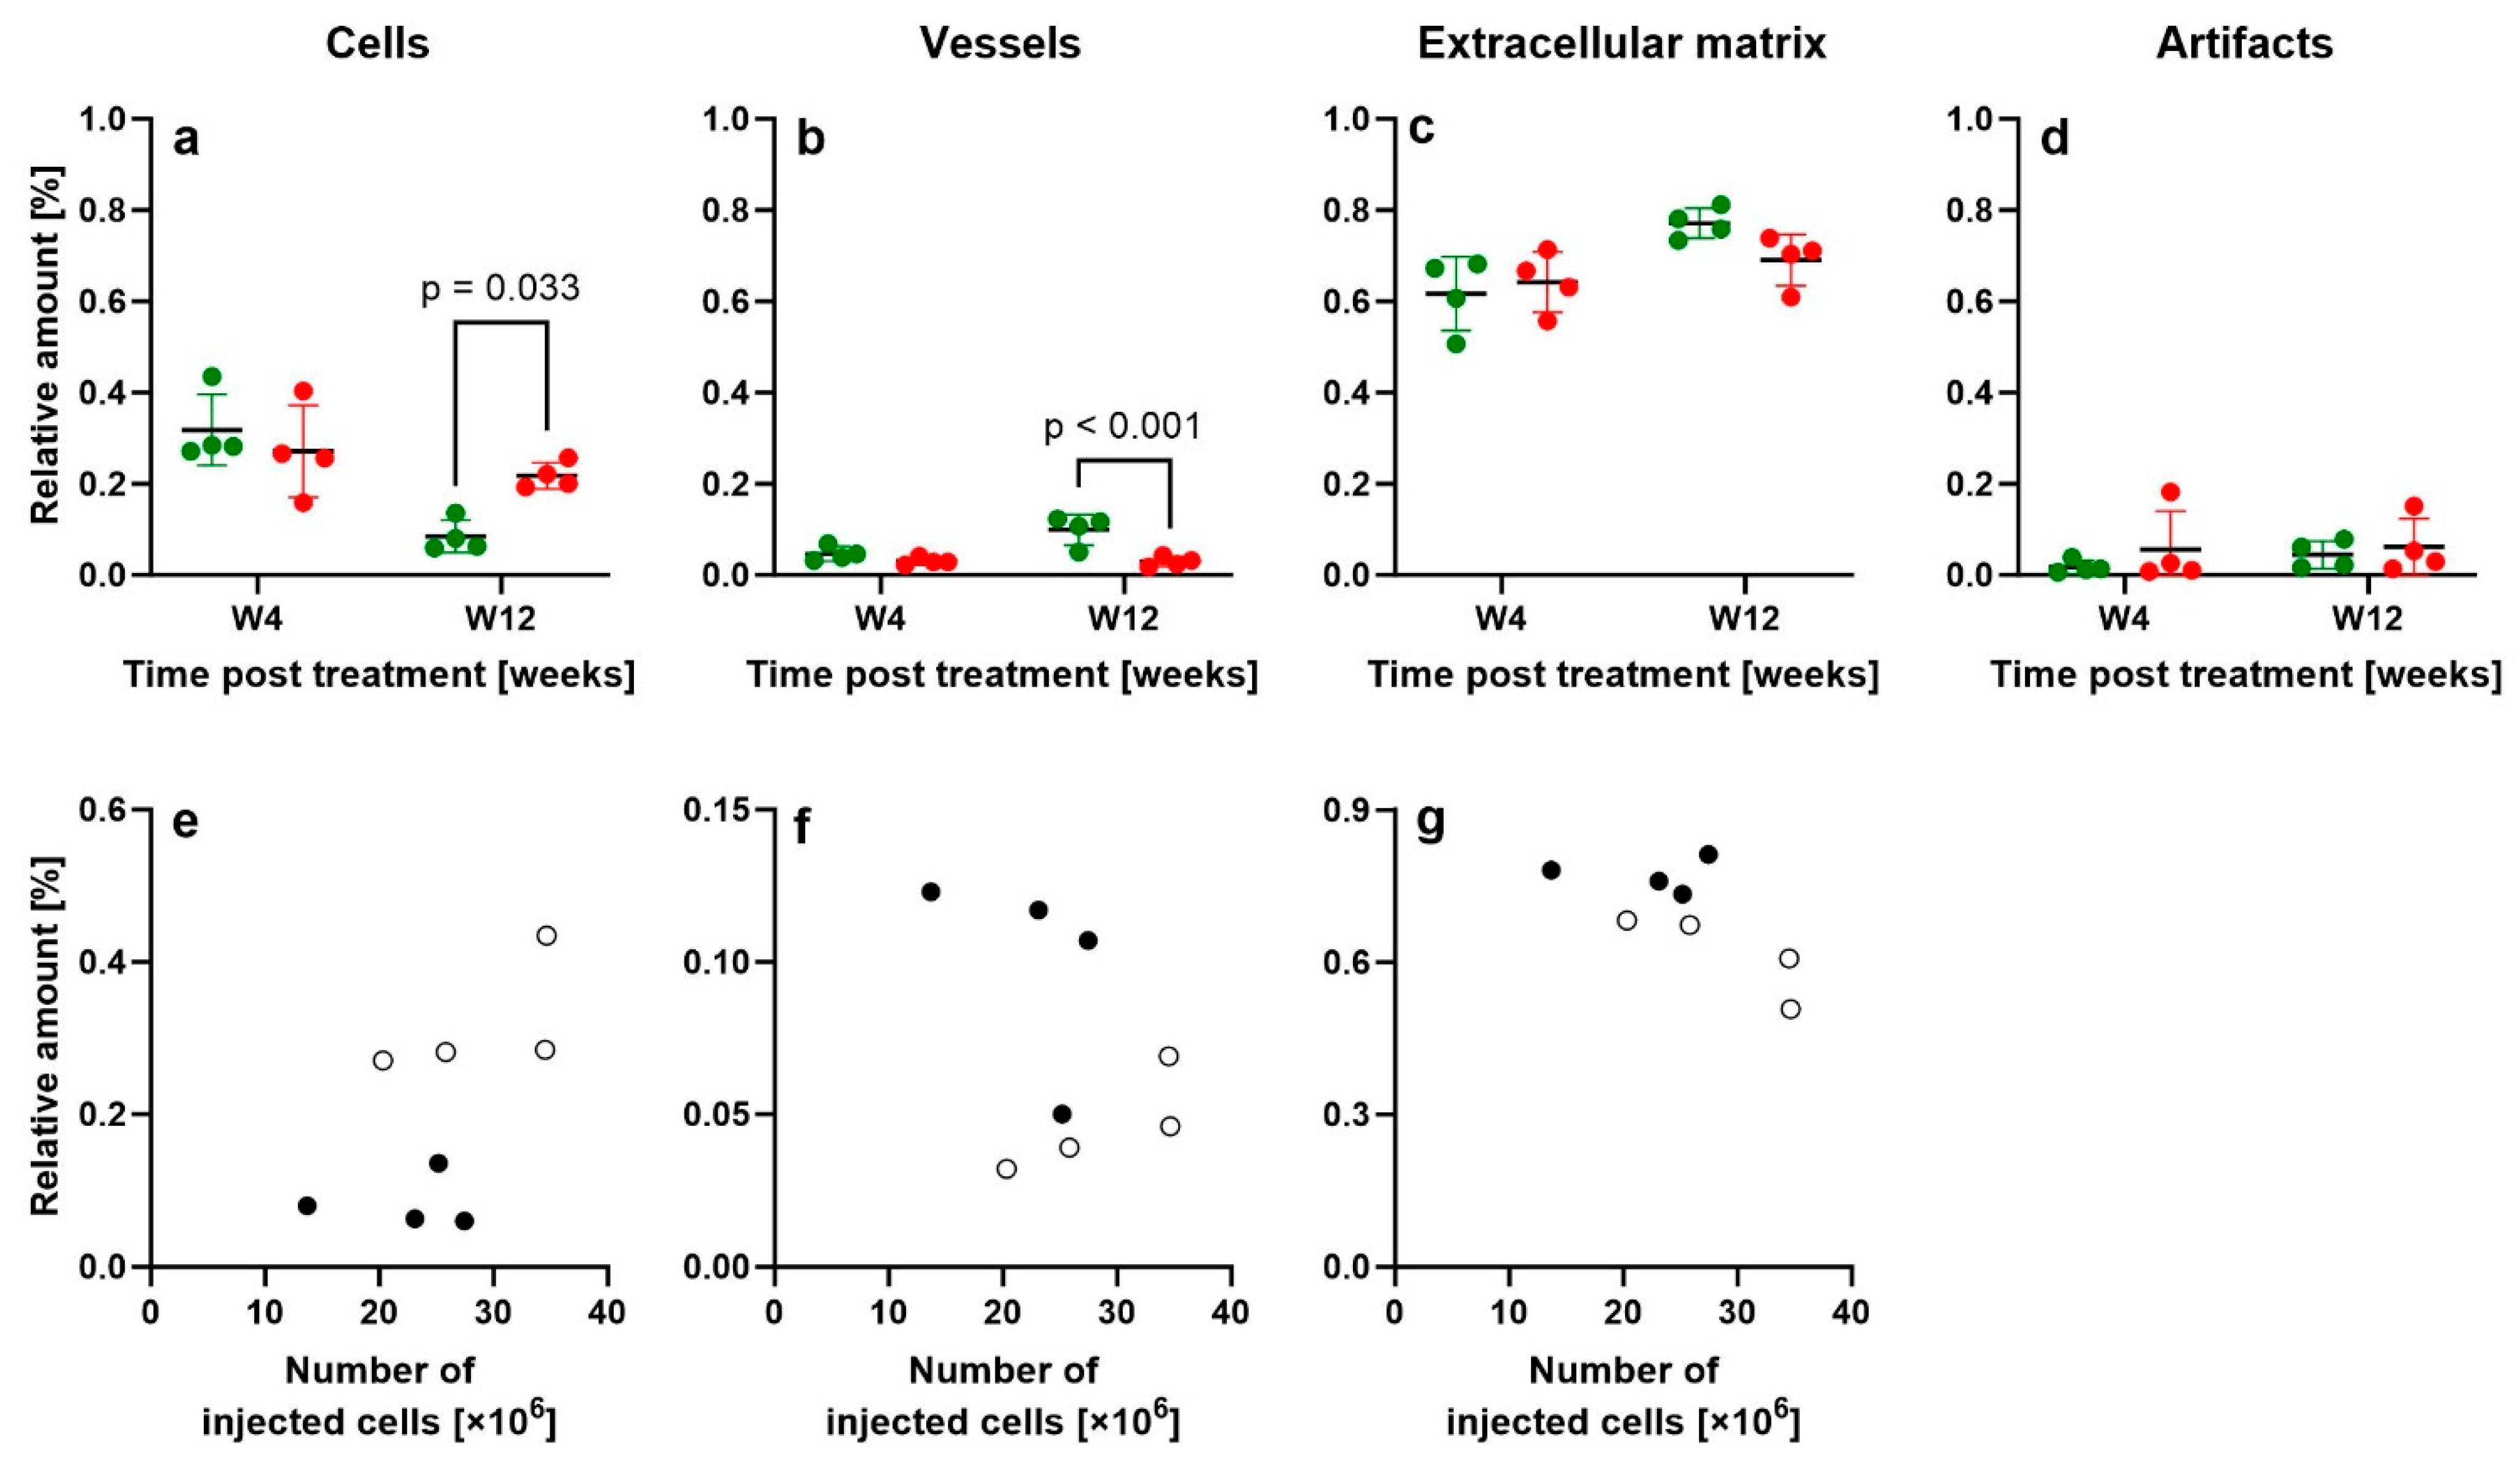
2.9. Design-Based Stereologic Analysis
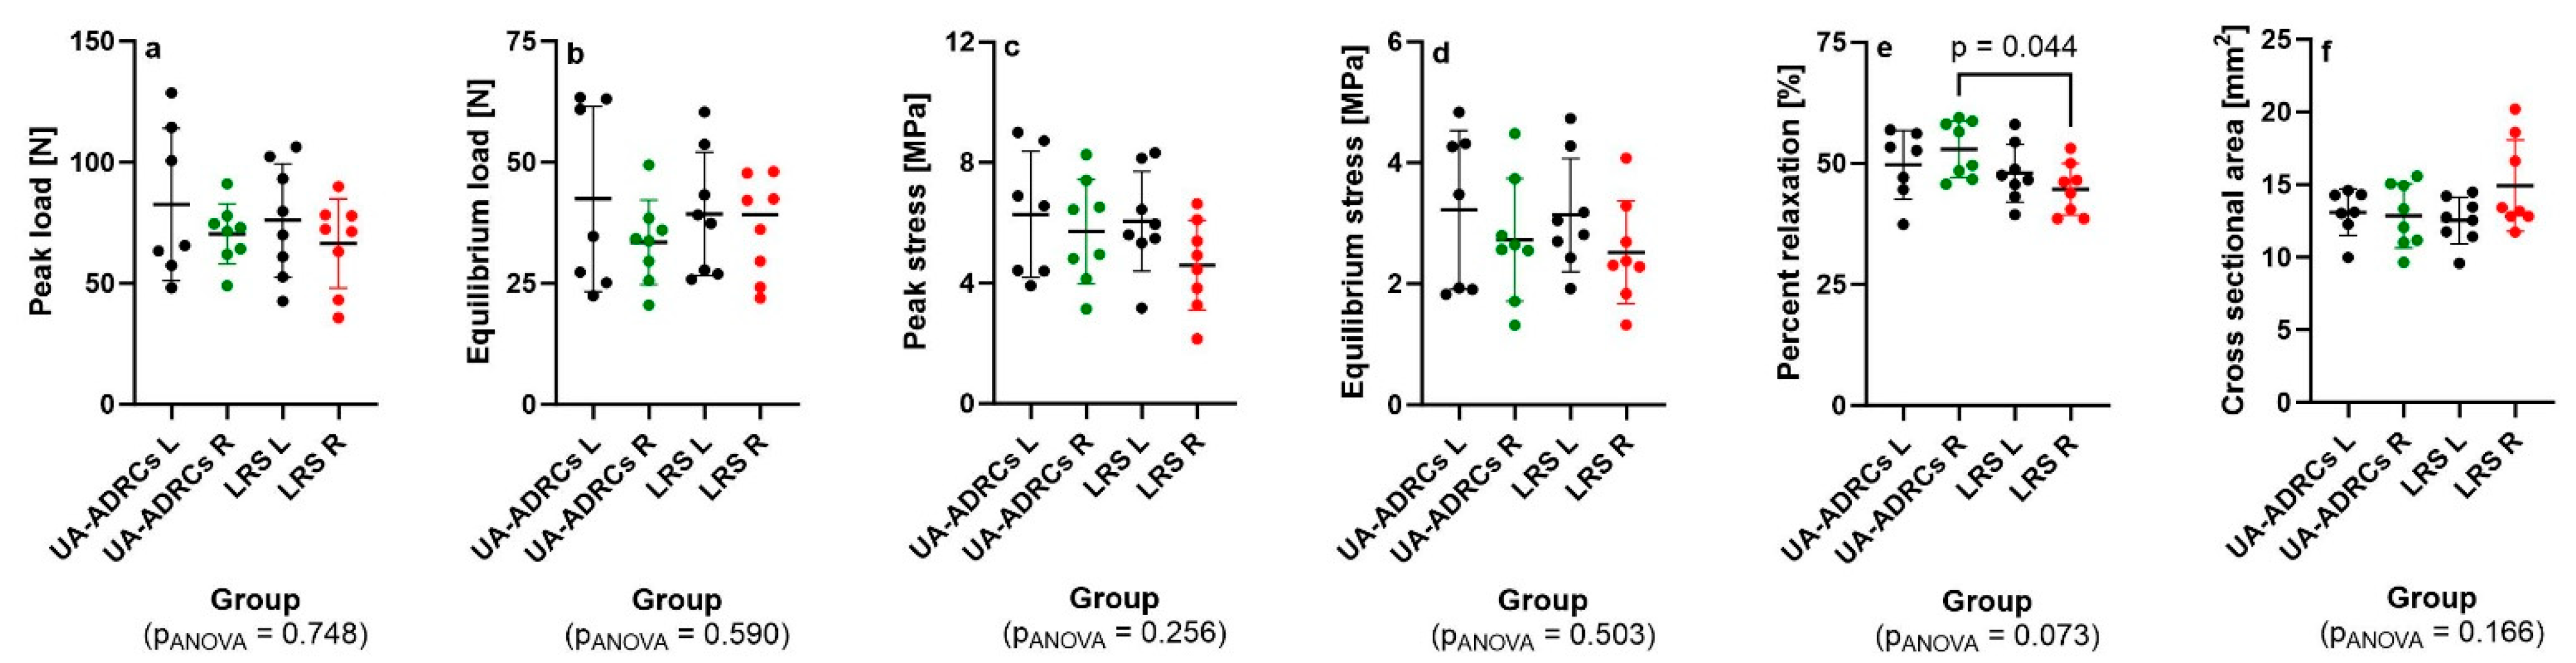
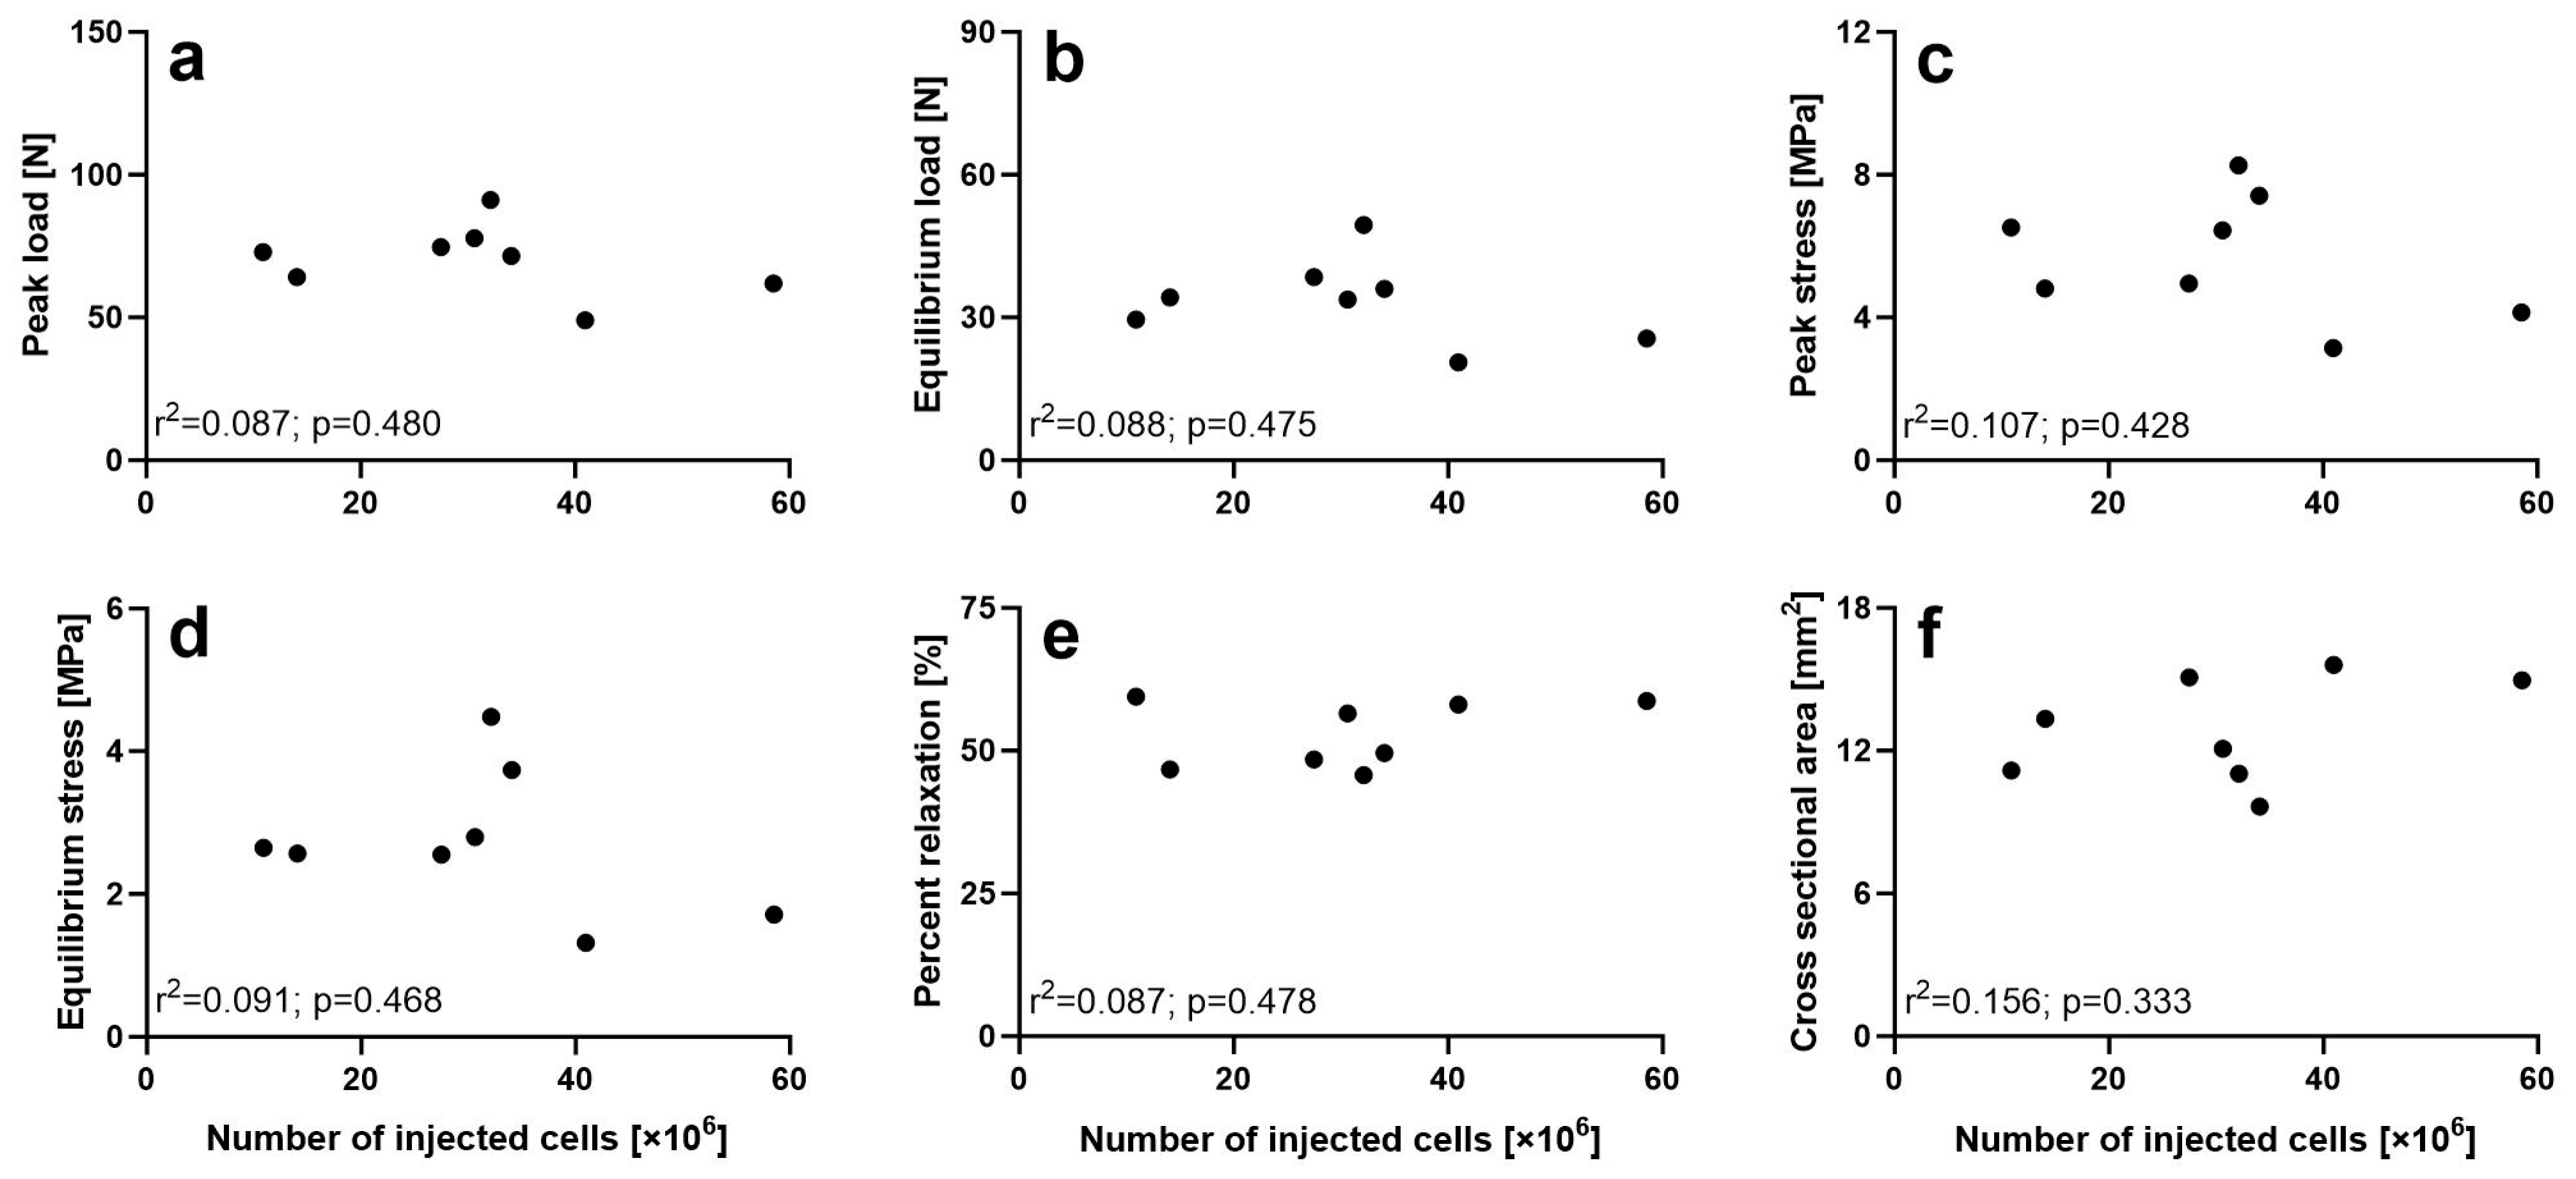
2.10. Non-Destructive Biomechanical Analysis
3. Discussion
4. Materials and Methods
5. Conclusions
Author Contributions
Funding
Institutional Review Board Statement
Informed Consent Statement
Data Availability Statement
Acknowledgments
Conflicts of Interest
Abbreviations
| sPTRCT | Symptomatic, partial-thickness rotator cuff tears |
| UA-ADRCs | Uncultured, unmodified, autologous, adipose-derived regenerative cells |
| RCT | Randomized clinical trial |
| CCT | Common calcaneal tendon |
| RLS | Ringer’s lactated solution |
| ECM | Extracellular matrix |
| PBS | Phosphate-buffered saline |
References
- Hurd, J.L.; Facile, T.R.; Weiss, J.; Hayes, M.; Hayes, M.; Furia, J.P.; Maffulli, N.; Winnier, G.E.; Alt, C.; Schmitz, C.; et al. Safety and efficacy of treating symptomatic, partial-thickness rotator cuff tears with fresh, uncultured, unmodified, autologous adipose-derived regenerative cells (UA-ADRCs) isolated at the point of care: A prospective, randomized, controlled first-in-human pilot study. J. Orthop. Surg. Res. 2020, 15, 122. [Google Scholar] [CrossRef] [PubMed]
- Lundeen, M.; Hurd, J.L.; Hayes, M.; Hayes, M.; Facile, T.R.; Furia, J.P.; Maffulli, N.; Alt, C.; Alt, E.U.; Schmitz, C.; et al. Management of partial-thickness rotator cuff tears with autologous adipose-derived regenerative cells is safe and more effective than injection of corticosteroid. Sci. Rep. 2023, 13, 19348. [Google Scholar] [CrossRef] [PubMed]
- Winnier, G.E.; Valenzuela, N.; Peters-Hall, J.; Kellner, J.; Alt, C.; Alt, E.U. Isolation of adipose tissue derived regenerative cells from human subcutaneous tissue with or without the use of an enzymatic reagent. PLoS ONE 2019, 14, e0221457. [Google Scholar] [CrossRef] [PubMed]
- Dykstra, J.A.; Blue, E.D.; Negrão de Assis, P.L.; Weimer, J.M.; Kota, D.J. Human adipose-derived stromal vascular fraction: Characterization, safety and therapeutic potential in an experimental mouse model of articular injury. J. Stem Cells Regen. Med. 2020, 16, 16–25. [Google Scholar] [CrossRef] [PubMed]
- Schmitz, C.; Alt, C.; Azares, A.R.; Pearce, D.A.; Facile, T.R.; Furia, J.P.; Maffulli, N.; Huang, C.; Alt, E.U. The composition of adipose-derived regenerative cells isolated from lipoaspirate using a point of care system does not depend on the subject’s individual age, sex, body mass index and ethnicity. Cells 2022, 12, 30. [Google Scholar] [CrossRef] [PubMed]
- Hurd, J. Autologous Adult Adipose-Derived Regenerative Cell Injection into Chronic Partial-Thickness Rotator Cuff Tears. ClinicalTrials. Gov. Available online: https://www.clinicaltrials.gov/ct2/show/NCT03752827 (accessed on 7 July 2025).
- Kim, S.H.; Chung, S.W.; Oh, J.H. Expression of insulin-like growth factor type 1 receptor and myosin heavy chain in rabbit’s rotator cuff muscle after injection of adipose-derived stem cell. Knee Surg. Sports Traumatol. Arthrosc. 2014, 22, 2867–2873. [Google Scholar] [CrossRef] [PubMed]
- Mora, M.V.; Antuña, S.A.; Arranz, M.G.; Carrascal, M.T.; Barco, R. Application of adipose tissue-derived stem cells in a rat rotator cuff repair model. Injury 2014, 45 (Suppl. S4), S22–S27. [Google Scholar] [CrossRef] [PubMed]
- Chen, H.S.; Su, Y.T.; Chan, T.M.; Su, Y.J.; Syu, W.S.; Harn, H.J.; Lin, S.Z.; Chiu, S.C. Human adipose-derived stem cells accelerate the restoration of tensile strength of tendon and alleviate the progression of rotator cuff injury in a rat model. Cell Transplant. 2015, 24, 509–520. [Google Scholar] [CrossRef] [PubMed]
- Tsekes, D.; Konstantopoulos, G.; Khan, W.S.; Rossouw, D.; Elvey, M.; Singh, J. Use of stem cells and growth factors in rotator cuff tendon repair. Eur. J. Orthop. Surg. Traumatol. 2019, 29, 747–757. [Google Scholar] [CrossRef] [PubMed]
- Alt, E.; Rothoerl, R.; Hoppert, M.; Frank, H.G.; Wuerfel, T.; Alt, C.; Schmitz, C. First immunohistochemical evidence of human tendon repair following stem cell injection: A case report and review of literature. World J. Stem Cells 2021, 13, 944–970. [Google Scholar] [CrossRef] [PubMed]
- Bottagisio, M.; Lovati, A.B. A review on animal models and treatments for the reconstruction of Achilles and flexor tendons. J. Mater. Sci. Mater. Med. 2017, 28, 45. [Google Scholar] [CrossRef] [PubMed]
- Aykora, D.; Taşçı, B.; Şahin, M.Z.; Tekeoğlu, I.; Uzun, M.; Sarafian, V.; Docheva, D. Tendon regeneration deserves better: Focused review on In vivo models, artificial intelligence and 3D bioprinting approaches. Front. Bioeng. Biotechnol. 2025, 13, 1580490. [Google Scholar] [CrossRef] [PubMed]
- Vidal, L.; Brennan, M.Á.; Krissian, S.; De Lima, J.; Hoornaert, A.; Rosset, P.; Fellah, B.H.; Layrolle, P. In situ production of pre-vascularized synthetic bone grafts for regenerating critical-sized defects in rabbits. Acta Biomater. 2020, 114, 384–394. [Google Scholar] [CrossRef] [PubMed]
- Ni, Y.; He, X.; Yuan, Z.; Liu, M.; Du, H.; Zhong, X. Effect of fat particle-to-SVF ratio on graft survival rates in rabbits. Ann. Plast. Surg. 2015, 74, 609–614. [Google Scholar] [CrossRef] [PubMed]
- Wang, J.; Liao, Y.; Xia, J.; Wang, Z.; Mo, X.; Feng, J.; He, Y.; Chen, X.; Li, Y.; Lu, F.; et al. Mechanical micronization of lipoaspirates for the treatment of hypertrophic scars. Stem Cell Res. Ther. 2019, 10, 42. [Google Scholar] [CrossRef] [PubMed]
- Desando, G.; Bartolotti, I.; Martini, L.; Giavaresi, G.; Nicoli Aldini, N.; Fini, M.; Roffi, A.; Perdisa, F.; Filardo, G.; Kon, E.; et al. Regenerative features of adipose tissue for osteoarthritis treatment in a rabbit model: Enzymatic digestion versus mechanical disruption. Int. J. Mol Sci. 2019, 20, 2636. [Google Scholar] [CrossRef] [PubMed]
- Desando, G.; Bartolotti, I.; Cattini, L.; Tschon, M.; Martini, L.; Fini, M.; Schiavinato, A.; Soranzo, C.; Grigolo, B. Prospects on the potential In Vitro regenerative features of mechanically treated-adipose tissue for osteoarthritis care. Stem Cell Rev. Rep. 2021, 17, 1362–1373. [Google Scholar] [CrossRef] [PubMed]
- Jia, L.; Yang, M.; Jiang, H.; Liu, X. Chondrogenic characteristics of auricular chondrocytes cocultured with adipose-derived stem cells are superior to stromal vascular fraction of adipose tissue. J. Craniofac. Surg. 2021, 32, 2906–2911. [Google Scholar] [CrossRef] [PubMed]
- Schmitz, C.; Hof, P.R. Design-based stereology in neuroscience. Neuroscience 2005, 130, 813–831. [Google Scholar] [CrossRef] [PubMed]
- Alt, E.U.; Winnier, G.; Haenel, A.; Rothoerl, R.; Solakoglu, O.; Alt, C.; Schmitz, C. Towards a comprehensive understanding of UA-ADRCs (uncultured, autologous, fresh, unmodified, adipose derived regenerative cells, isolated at point of care) in regenerative medicine. Cells 2020, 9, 1097. [Google Scholar] [CrossRef] [PubMed]
- Alt, E.U.; Schmitz, C.; Bai, X. Perspective: Why and how ubiquitously distributed, vascular-associated, pluripotent stem cells in the adult body (vaps cells) are the next generation of medicine. Cells 2021, 10, 2303. [Google Scholar] [CrossRef] [PubMed]
- Mitchell, J.B.; McIntosh, K.; Zvonic, S.; Garrett, S.; Floyd, Z.E.; Kloster, A.; Di Halvorsen, Y.; Storms, R.W.; Goh, B.; Kilroy, G.; et al. Immunophenotype of human adipose-derived cells: Temporal changes in stromal-associated and stem cell–associated markers. Stem Cells 2006, 24, 376–385. [Google Scholar] [CrossRef] [PubMed]
- Furia, J.P.; Lundeen, M.A.; Hurd, J.L.; Pearce, D.A.; Alt, C.; Alt, E.U.; Schmitz, C.; Maffulli, N. Why and how to use the body’s own stem cells for regeneration in musculoskeletal disorders: A primer. J. Orthop. Surg. Res. 2022, 17, 36. [Google Scholar] [CrossRef] [PubMed]
- Uysal, A.C.; Mizuno, H. Tendon regeneration and repair with adipose derived stem cells. Curr. Stem Cell Res. Ther. 2010, 5, 161–167. [Google Scholar] [CrossRef] [PubMed]
- Torres-Torrillas, M.; Rubio, M.; Damia, E.; Cuervo, B.; Del Romero, A.; Peláez, P.; Chicharro, D.; Miguel, L.; Sopena, J.J. Adipose-derived mesenchymal stem cells: A promising tool in the treatment of musculoskeletal diseases. Int. J. Mol. Sci. 2019, 20, 3105. [Google Scholar] [CrossRef] [PubMed]
- Xu, Y.; Zhang, W.-X.; Wang, L.-N.; Ming, Y.-Q.; Li, Y.-L.; Ni, G.-X. Stem cell therapies in tendon-bone healing. World J. Stem Cells 2021, 13, 753–775. [Google Scholar] [CrossRef] [PubMed]
- Shim, I.K.; Kang, M.S.; Lee, E.-S.; Choi, J.H.; Lee, Y.N.; Koh, K.H. Decellularized bovine pericardial patch loaded with mesenchymal stromal cells enhance the mechanical strength and biological healing of large-to-massive rotator cuff tear in a rat model. Arthroscopy 2022, 38, 2987–3000. [Google Scholar] [CrossRef] [PubMed]
- Macedo, R.S.; Teodoro, W.R.; Capellozzi, V.L.; Rosemberg, D.L.; Sposeto, R.B.; de Cesar Netto, C.; Deland, J.T.; Maffulli, N.; Ellis, S.J.; Godoy-Santos, A.L. Histoarchitecture of the fibrillary matrix of human fetal posterior tibial tendons. Sci. Rep. 2022, 12, 17922. [Google Scholar] [CrossRef] [PubMed]
- Herchenhan, A.; Kalson, N.S.; Holmes, D.F.; Hill, P.; Kadler, K.E.; Margetts, L. Tenocyte contraction induces crimp formation in tendon-like tissue. Biomech. Model. Mechanobiol. 2012, 11, 449–459. [Google Scholar] [CrossRef] [PubMed]
- Prockop, D.J.; Kivirikko, K.I.; Tuderman, L.; Guzman, N.A. The biosynthesis of collagen and its disorders (first of two parts). N. Engl. J. Med. 1979, 301, 13–23. [Google Scholar] [CrossRef] [PubMed]
- Prockop, D.J.; Kivirikko, K.I.; Tuderman, L.; Guzman, N.A. The biosynthesis of collagen and its disorders (second of two parts). N. Engl. J. Med. 1979, 301, 77–85. [Google Scholar] [CrossRef] [PubMed]
- Clore, J.N.; Cohen, I.K.; Diegelmann, R.F. Quantitation of collagen Types I and III during wound healing in rat skin. Proc. Soc. Exp. Biol. Med. 1979, 161, 337–340. [Google Scholar] [CrossRef] [PubMed]
- Bhogal, R.K.; Stoica, C.M.; McGaha, T.L.; Bona, C.A. Molecular aspects of regulation of collagen gene expression in fibrosis. J. Clin. Immunol. 2005, 25, 592–603. [Google Scholar] [CrossRef] [PubMed]
- Barros, M.H.M.; Hauck, F.; Dreyer, J.H.; Kempkes, B.; Niedobitek, G. Macrophage polarisation: An immunohistochemical approach for identifying M1 and M2 macrophages. PLoS ONE 2013, 8, e80908. [Google Scholar] [CrossRef] [PubMed]
- Yunna, C.; Mengru, H.; Lei, W.; Weidong, C. Macrophage M1/M2 polarization. Eur. J. Pharmacol. 2020, 877, 173090. [Google Scholar] [CrossRef] [PubMed]
- Blaine, T.A.; Kim, Y.S.; Voloshin, I.; Chen, D.; Murakami, K.; Chang, S.S.; Winchester, R.; Lee, F.Y.; O’Keefe, R.J.; Bigliani, L.U. The molecular pathophysiology of subacromial bursitis in rotator cuff disease. J. Shoulder Elbow Surg. 2005, 14, S84–S89. [Google Scholar] [CrossRef] [PubMed]
- Shindle, M.K.; Chen, C.C.; Robertson, C.; DiTullio, A.E.; Paulus, M.C.; Clinton, C.M.; Cordasco, F.A.; Rodeo, S.A.; Warren, R.F. Full-thickness supraspinatus tears are associated with more synovial inflammation and tissue degeneration than partial-thickness tears. J. Shoulder Elbow Surg. 2011, 20, 917–927. [Google Scholar] [CrossRef] [PubMed]
- Chisari, E.; Rehak, L.; Khan, W.S.; Maffulli, N. Tendon healing is adversely affected by low-grade inflammation. J. Orthop. Surg. Res. 2021, 16, 700. [Google Scholar] [CrossRef] [PubMed]
- Brandt, L.; Schubert, S.; Scheibe, P.; Brehm, W.; Franzen, J.; Gross, C.; Burk, J. Tenogenic properties of mesenchymal progenitor cells are compromised in an inflammatory environment. Int. J. Mol. Sci. 2018, 19, 2549. [Google Scholar] [CrossRef] [PubMed]
- Gumucio, J.P.; Schonk, M.M.; Kharaz, Y.A.; Comerford, E.; Mendias, C.L. Scleraxis is required for the growth of adult tendons in response to mechanical loading. JCI Insight 2020, 5, e138295. [Google Scholar] [CrossRef] [PubMed]
- Li, J.; Stoppato, M.; Schiele, N.R.; Graybeal, K.L.; Nguyen, P.K.; Kuo, C.K. Embryonic and postnatal tendon cells respond differently to interleukin-1β. Ann. N. Y. Acad. Sci. 2019, 1442, 118–127. [Google Scholar] [CrossRef] [PubMed]
- Benjamin, M.; Ralphs, J.R. Fibrocartilage in tendons and ligaments—An adaptation to compressive load. J. Anat. 1998, 193, 481–494. [Google Scholar] [CrossRef] [PubMed]
- Vogel, K.G. What happens when tendons bend and twist? Proteoglycans. J. Musculoskelet. Neuronal Interact. 2004, 4, 202–203. [Google Scholar] [PubMed]
- Rosenberg, L. Chemical basis for the histological use of Safranin O in the study of articular cartilage. J. Bone Jt. Surg. Am. 1971, 53, 69–82. [Google Scholar] [CrossRef]
- Yanagishita, M. Function of proteoglycans in the extracellular matrix. Acta Pathol. Jpn. 1993, 43, 283–293. [Google Scholar] [CrossRef] [PubMed]
- Meyers, M.A.; Chawla, K.K. Mechanical Behavior of Materials, 1st ed.; Cambridge University Press: Cambridge, UK, 2009; pp. 71–155. [Google Scholar]
- Fan, C.; Zhao, Y.; Chen, Y.; Qin, T.; Lin, J.; Han, S.; Yan, R.; Lei, T.; Xie, Y.; Wang, T.; et al. A Cd9+Cd271+ stem/progenitor population and the SHP2 pathway contribute to neonatal-to-adult switching that regulates tendon maturation. Cell Rep. 2022, 39, 110762. [Google Scholar] [CrossRef] [PubMed]
- Solakoglu, Ö.; Götz, W.; Kiessling, M.C.; Alt, C.; Schmitz, C.; Alt, E.U. Improved guided bone regeneration by combined application of unmodified, fresh autologous adipose derived regenerative cells and plasma rich in growth factors: A first-in-human case report and literature review. World J. Stem Cells 2019, 11, 124–146. [Google Scholar] [CrossRef] [PubMed]
- Lu, L.-Y.; Kuang, C.-Y.; Yin, F. Magnetic resonance imaging and biomechanical analysis of adipose-derived stromal vascular fraction applied on rotator cuff repair in rabbits. Chin. Med. J. 2018, 131, 69–74. [Google Scholar] [CrossRef] [PubMed]
- Lu, L.Y.; Ma, M.; Cai, J.F.; Yuan, F.; Zhou, W.; Luo, S.L.; Pan, Z.Y.; Zeng, W.; Zhong, N.; Yin, F. Effects of local application of adipose-derived stromal vascular fraction on tendon–bone healing after rotator cuff tear in rabbits. Chin. Med. J. 2018, 131, 2620–2622. [Google Scholar] [CrossRef] [PubMed]
- Palumbo Piccionello, A.; Riccio, V.; Senesi, L.; Volta, A.; Pennasilico, L.; Botto, R.; Rossi, G.; Tambella, A.M.; Galosi, L.; Marini, C.; et al. Adipose micro-grafts enhance tendinopathy healing in ovine model: An in vivo experimental perspective study. Stem Cells Transl. Med. 2021, 10, 1544–1560. [Google Scholar] [CrossRef] [PubMed]
- Van Dongen, J.A.; Stevens, H.P.; Parvizi, M.; Van Der Lei, B.; Harmsen, M.C. The fractionation of adipose tissue procedure to obtain stromal vascular fractions for regenerative purposes. Wound Repair Regen. 2016, 24, 994–1003. [Google Scholar] [CrossRef] [PubMed]
- Alentorn-Geli, E.; Seijas, R.; Martínez-De la Torre, A.; Cuscó, X.; Steinbacher, G.; Álvarez-Díaz, P.; Barastegui, D.; Navarro, J.; Serra-Renom, J.M.; Nishishinya, B.; et al. Effects of autologous adipose-derived regenerative stem cells administered at the time of anterior cruciate ligament reconstruction on knee function and graft healing. J. Orthop. Surg. 2019, 27, 230949901986758. [Google Scholar] [CrossRef] [PubMed]
- Uysal, A.C.; Mizuno, H. differentiation of adipose-derived stem cells for tendon repair. Methods Mol. Biol. 2011, 702, 443–451. [Google Scholar] [CrossRef] [PubMed]
- Uysal, C.A.; Tobita, M.; Hyakusoku, H.; Mizuno, H. Adipose-derived stem cells enhance primary tendon repair: Biomechanical and immunohistochemical evaluation. J. Plast. Reconstr. Aesthet. Surg. 2012, 65, 1712–1719. [Google Scholar] [CrossRef] [PubMed]
- Carvalho, A.M.; Badial, P.R.; Álvarez, L.E.; Yamada, A.L.; Borges, A.S.; Deffune, E.; Hussni, C.A.; Garcia Alves, A.L. Equine tendonitis therapy using mesenchymal stem cells and platelet concentrates: A randomized controlled trial. Stem Cell Res. Ther. 2013, 4, 85. [Google Scholar] [CrossRef] [PubMed]
- Conze, P.; van Schie, H.T.; van Weeren, R.; Staszyk, C.; Conrad, S.; Skutella, T.; Hopster, K.; Rohn, K.; Stadler, P.; Geburek, F. Effect of autologous adipose tissue-derived mesenchymal stem cells on neovascularization of artificial equine tendon lesions. Regen. Med. 2014, 9, 743–757. [Google Scholar] [CrossRef] [PubMed]
- Deng, D.; Wang, W.; Wang, B.; Zhang, P.; Zhou, G.; Zhang, W.J.; Cao, Y.; Liu, W. Repair of achilles tendon defect with autologous ASCs engineered tendon in a rabbit model. Biomaterials 2014, 35, 8801–8809. [Google Scholar] [CrossRef] [PubMed]
- Geburek, F.; Mundle, K.; Conrad, S.; Hellige, M.; Walliser, U.; van Schie, H.T.; van Weeren, R.; Skutella, T.; Stadler, P.M. Tracking of autologous adipose tissue-derived mesenchymal stromal cells with in vivo magnetic resonance imaging and histology after intralesional treatment of artificial equine tendon lesions—A pilot study. Stem Cell Res. Ther. 2016, 7, 21. [Google Scholar] [CrossRef] [PubMed]
- Gelberman, R.H.; Shen, H.; Kormpakis, I.; Rothrauff, B.; Yang, G.; Tuan, R.S.; Xia, Y.; Sakiyama-Elbert, S.; Silva, M.J.; Thomopoulos, S. Effect of adipose-derived stromal cells and bmp12 on intrasynovial tendon repair: A biomechanical, biochemical, and proteomics study. J. Orthop. Res. 2016, 34, 630–640. [Google Scholar] [CrossRef] [PubMed]
- Shen, H.; Kormpakis, I.; Havlioglu, N.; Linderman, S.W.; Sakiyama-Elbert, S.E.; Erickson, I.E.; Zarembinski, T.; Silva, M.J.; Gelberman, R.H.; Thomopoulos, S. The effect of mesenchymal stromal cell sheets on the inflammatory stage of flexor tendon healing. Stem Cell Res. Ther. 2016, 7, 144. [Google Scholar] [CrossRef] [PubMed]
- Romero, A.; Barrachina, L.; Ranera, B.; Remacha, A.R.; Moreno, B.; de Blas, I.; Sanz, A.; Vázquez, F.J.; Vitoria, A.; Junquera, C.; et al. Comparison of autologous bone marrow and adipose tissue derived mesenchymal stem cells, and platelet rich plasma, for treating surgically induced lesions of the equine superficial digital flexor tendon. Vet. J. 2017, 224, 76–84. [Google Scholar] [CrossRef] [PubMed]
- Geburek, F.; Roggel, F.; van Schie, H.T.M.; Beineke, A.; Estrada, R.; Weber, K.; Hellige, M.; Rohn, K.; Jagodzinski, M.; Welke, B.; et al. Effect of single intralesional treatment of surgically induced equine superficial digital flexor tendon core lesions with adipose-derived mesenchymal stromal cells: A controlled experimental trial. Stem Cell Res. Ther. 2017, 8, 129. [Google Scholar] [CrossRef] [PubMed]
- Gelberman, R.H.; Linderman, S.W.; Jayaram, R.; Dikina, A.D.; Sakiyama-Elbert, S.; Alsberg, E.; Thomopoulos, S.; Shen, H. Combined administration of ascs and bmp-12 promotes an m2 macrophage phenotype and enhances tendon healing. Clin. Orthop. Relat. Res. 2017, 475, 2318–2331. [Google Scholar] [CrossRef] [PubMed]
- Ahrberg, A.B.; Horstmeier, C.; Berner, D.; Brehm, W.; Gittel, C.; Hillmann, A.; Josten, C.; Rossi, G.; Schubert, S.; Winter, K.; et al. Effects of mesenchymal stromal cells versus serum on tendon healing in a controlled experimental trial in an equine model. BMC Musculoskelet. Disord. 2018, 19, 230. [Google Scholar] [CrossRef] [PubMed]
- Chen, C.; Zhang, T.; Liu, F.; Qu, J.; Chen, Y.; Fan, S.; Chen, H.; Sun, L.; Zhao, C.; Hu, J.; et al. Effect of low-intensity pulsed ultrasound after autologous adipose-derived stromal cell transplantation for bone-tendon healing in a rabbit model. Am. J. Sports Med. 2019, 47, 942–953. [Google Scholar] [CrossRef] [PubMed]
- de Lima Santos, A.; Silva, C.G.D.; de Sá Barretto, L.S.; Franciozi, C.E.D.S.; Tamaoki, M.J.S.; de Almeida, F.G.; Faloppa, F. Biomechanical evaluation of tendon regeneration with adipose-derived stem cell. J. Orthop. Res. 2019, 37, 1281–1286. [Google Scholar] [CrossRef] [PubMed]
- Facon-Poroszewska, M.; Kiełbowicz, Z.; Prządka, P. Influence of radial pressure wave therapy (RPWT) on collagenase-induced achilles tendinopathy treated with platelet rich plasma and autologous adipose derived stem cells. Pol. J. Vet. Sci. 2019, 22, 743–751. [Google Scholar] [CrossRef] [PubMed]
- Shin, M.J.; Shim, I.K.; Kim, D.M.; Choi, J.H.; Lee, Y.N.; Jeon, I.H.; Kim, H.; Park, D.; Kholinne, E.; Yang, H.S.; et al. Engineered cell sheets for the effective delivery of adipose-derived stem cells for tendon-to-bone healing. Am. J. Sports Med. 2020, 48, 3347–3358. [Google Scholar] [CrossRef] [PubMed]
- Oshita, T.; Tobita, M.; Tajima, S.; Mizuno, H. Adipose-derived stem cells improve collagenase-induced tendinopathy in a rat model. Am. J. Sports Med. 2016, 44, 1983–1989. [Google Scholar] [CrossRef] [PubMed]
- Frauz, K.; Teodoro, L.F.R.; Carneiro, G.D.; Cristina da Veiga, F.; Lopes Ferrucci, D.; Luis Bombeiro, A.; Waleska Simões, P.; Elvira Álvares, L.; Leite, R.; de Oliveira, A.; et al. Transected tendon treated with a new fibrin sealant alone or associated with adipose-derived stem cells. Cells 2019, 8, 56. [Google Scholar] [CrossRef] [PubMed]
- Matsumoto, T.; Sato, Y.; Kobayashi, T.; Suzuki, K.; Kimura, A.; Soma, T.; Ito, E.; Kikuchi, T.; Kobayashi, S.; Harato, K.; et al. Adipose-derived stem cell sheets improve early biomechanical graft strength in rabbits after anterior cruciate ligament reconstruction. Am. J. Sports Med. 2021, 49, 3508–3518. [Google Scholar] [CrossRef] [PubMed]
- Soltani, A.; Moradi, M.; Nejad, A.R.; Moradi, S.; Javandoost, E.; Nazari, H.; Jafarian, A. Adipose-derived stem cells: Potentials, availability and market size in regenerative medicine. Curr. Stem Cell Res. Ther. 2023, 18, 347–379. [Google Scholar] [CrossRef] [PubMed]
- McClellan, P.; Ina, J.G.; Knapik, D.M.; Isali, I.; Learn, G.; Valente, A.; Wen, Y.; Wen, R.; Anderson, J.M.; Gillespie, R.J.; et al. Mesenchymal stem cell delivery via topographically tenoinductive collagen biotextile enhances regeneration of segmental tendon defects. Am. J. Sports Med. 2022, 50, 2281–2291. [Google Scholar] [CrossRef] [PubMed]
- Bowers, K.; Amelse, L.; Bow, A.; Newby, S.; MacDonald, A.; Sun, X.; Anderson, D.; Dhar, M. Mesenchymal stem cell use in acute tendon injury: In Vitro tenogenic potential vs. in vivo dose response. Bioengineering 2022, 9, 407. [Google Scholar] [CrossRef] [PubMed]
- Salz, R.O.; Elliott, C.R.B.; Zuffa, T.; Bennet, E.D.; Ahern, B.J. Treatment of racehorse superficial digital flexor tendonitis: A comparison of stem cell treatments to controlled exercise rehabilitation in 213 cases. Equine Vet. J. 2023, 55, 979–987. [Google Scholar] [CrossRef] [PubMed]
- Chun, S.W.; Kim, W.; Lee, S.Y.; Lim, C.Y.; Kim, K.; Kim, J.G.; Park, C.H.; Hong, S.H.; Yoo, H.J.; Chung, S.G. A randomized controlled trial of stem cell injection for tendon tear. Sci. Rep. 2022, 12, 818. [Google Scholar] [CrossRef] [PubMed]
- Behfar, M.; Sarrafzadeh-Rezaei, F.; Hobbenaghi, R.; Delirezh, N.; Dalir-Naghadeh, B. Adipose-derived stromal vascular fraction improves tendon healing in rabbits. Chin. J. Traumatol. 2011, 14, 329–335. [Google Scholar] [PubMed]
- Behfar, M.; Sarrafzadeh-Rezaei, F.; Hobbenaghi, R.; Delirezh, N.; Dalir-Naghadeh, B. Enhanced mechanical properties of rabbit flexor tendons in response to intratendinous injection of adipose derived stromal vascular fraction. Curr. Stem Cell Res. Ther. 2012, 7, 173–178. [Google Scholar] [CrossRef] [PubMed]
- Behfar, M.; Javanmardi, S.; Sarrafzadeh-Rezaei, F. Comparative study on functional effects of allotransplantation of bone marrow stromal cells and adipose derived stromal vascular fraction on tendon repair: A biomechanical study in rabbits. Cell J. 2014, 16, 263–270. [Google Scholar] [PubMed]
- Lee, J.Y.; Lee, K.H.; Shin, H.M.; Chung, K.H.; Kim, G.I.; Lew, H. Orbital volume augmentation after injection of human orbital adipose-derived stem cells in rabbits. Investig. Ophthalmol. Vis. Sci. 2013, 54, 2410. [Google Scholar] [CrossRef] [PubMed]
- Brown, M.; Lee, M.; Zwiebel, S.; Adenuga, P.; Molavi, S.; Gargesha, M.; Varghai, D.; Guyuron, B. Augmentation of intraorbital volume with fat injection. Plast. Reconstr. Surg. 2014, 133, 1098–1106. [Google Scholar] [CrossRef] [PubMed]
- Maffulli, N.; Cuozzo, F.; Migliorini, F.; Oliva, F. The tendon unit: Biochemical, biomechanical, hormonal influences. J. Orthop. Surg. Res. 2023, 18, 311. [Google Scholar] [CrossRef] [PubMed]
- Polly, S.S.; Nichols, A.E.C.; Donnini, E.; Inman, D.J.; Scott, T.J.; Apple, S.M.; Werre, S.R.; Dahlgren, L.A. Adipose-derived stromal vascular fraction and cultured stromal cells as trophic mediators for tendon healing. J. Orthop. Res. 2019, 37, 1429–1439. [Google Scholar] [CrossRef] [PubMed]
- Wang, Y.; Chang, T.; Wu, T.; Xu, W.; Dou, G.; Wang, Y.; Guo, C. M2 macrophages promote vasculogenesis during retinal neovascularization by regulating bone marrow-derived cells via SDF-1/VEGF. Cell Tissue Res. 2020, 380, 469–486. [Google Scholar] [CrossRef] [PubMed]
- Feng, P.; Che, Y.; Gao, C.; Chu, X.; Li, Z.; Li, L.; Li, J.; Gao, J.; Dong, Y. Profibrotic role of transcription factor SP1 in cross-talk between fibroblasts and M2 macrophages. iScience 2023, 26, 108484. [Google Scholar] [CrossRef] [PubMed]
- Barrett, J.P.; Minogue, A.M.; Falvey, A.; Lynch, M.A. Involvement of IGF-1 and Akt in M1/M2 activation state in bone marrow-derived macrophages. Exp. Cell Res. 2015, 335, 258–268. [Google Scholar] [CrossRef] [PubMed]
- Chen, S.H.; Lee, Y.W.; Kao, H.K.; Yang, P.C.; Chen, S.H.; Liu, S.W.; Yang, P.C.; Lin, Y.J.; Huang, C.C. The transplantation of 3-dimensional spheroids of adipose-derived stem cells promotes achilles tendon healing in rabbits by enhancing the proliferation of tenocytes and suppressing M1 macrophages. Am. J. Sports Med. 2024, 52, 406–422. [Google Scholar] [CrossRef] [PubMed]
- Manning, C.N.; Martel, C.; Sakiyama-Elbert, S.E.; Silva, M.J.; Shah, S.; Gelberman, R.H.; Thomopoulos, S. Adipose-derived mesenchymal stromal cells modulate tendon fibroblast responses to macrophage-induced inflammation In Vitro. Stem Cell Res. Ther. 2015, 6, 74. [Google Scholar] [CrossRef] [PubMed]
- Vindigni, V.; Tonello, C.; Lancerotto, L.; Abatangelo, G.; Cortivo, R.; Zavan, B.; Bassetto, F. Preliminary report of In Vitro reconstruction of a vascularized tendonlike structure: A novel application for adipose-derived stem cells. Ann. Plast. Surg. 2013, 71, 664–670. [Google Scholar] [CrossRef] [PubMed]
- Lee, S.Y.; Kwon, B.; Lee, K.; Son, Y.H.; Chung, S.G. Therapeutic mechanisms of human adipose-derived mesenchymal stem cells in a rat tendon injury model. Am. J. Sports Med. 2017, 45, 1429–1439. [Google Scholar] [CrossRef] [PubMed]
- Zhang, Y.; Ju, W.; Zhang, H.; Mengyun, L.; Shen, W.; Chen, X. Mechanisms and therapeutic prospects of mesenchymal stem cells-derived exosomes for tendinopathy. Stem Cell Res. Ther. 2023, 14, 307. [Google Scholar] [CrossRef] [PubMed]
- Kasula, V.; Padala, V.; Gupta, N.; Doyle, D.; Bagheri, K.; Anastasio, A.; Adams, S.B. The use of extracellular vesicles in Achilles tendon repair: A systematic review. Biomedicines 2024, 12, 942. [Google Scholar] [CrossRef] [PubMed]
- Advanced Therapy Medicinal Products: Overview. Available online: https://www.ema.europa.eu/en/human-regulatory/overview/advanced-therapy-medicinal-products-overview (accessed on 7 July 2025).
- Code of Federal Regulations. Part 1271—Human Cells, Tissues, and Cellular and Tissue-Based Products. Available online: https://www.ecfr.gov/current/title-21/chapter-I/subchapter-L/part-1271#_top (accessed on 7 July 2025).
- Code of Federal Regulations—Title 21—Food and Drugs. Available online: https://www.fda.gov/medical-devices/medical-device-databases/code-federal-regulations-title-21-food-and-drugs (accessed on 7 July 2025).
- Regulatory Considerations for Human Cells, Tissues, and Cellular and Tissue-Based Products: Minimal Manipulation and Homologous Use—Guidance for Industry and Food and Drug Administration Staff. Available online: https://www.fda.gov/regulatory-information/search-fda-guidance-documents/regulatory-considerations-human-cells-tissues-and-cellular-and-tissue-based-products-minimal (accessed on 7 July 2025).
- Brown, J.C.; Shang, H.; Li, Y.; Yang, N.; Patel, N.; Katz, A.J. Isolation of adipose-derived stromal vascular fraction cells using a novel point-of-care device: Cell characterization and review of the literature. Tissue Eng. Part C Methods 2017, 23, 125–135. [Google Scholar] [CrossRef] [PubMed]
- Aronowitz, J.A.; Lockhart, R.A.; Hakakian, C.S.; Birnbaum, Z.E. Adipose stromal vascular fraction isolation: A head-to-head comparison of 4 cell separation systems #2. Ann. Plast. Surg. 2016, 77, 354–362. [Google Scholar] [CrossRef] [PubMed]
- Matava, M.J.; Purcell, D.B.; Rudzki, J.R. Partial-thickness rotator cuff tears. Am. J. Sports Med. 2005, 33, 1405–1417. [Google Scholar] [CrossRef] [PubMed]
- Matthewson, G.; Beach, C.J.; Nelson, A.A.; Woodmass, J.M.; Ono, Y.; Boorman, R.S.; Lo, I.K.; Thornton, G.M. Partial thickness rotator cuff tears: Current concepts. Adv. Orthop. 2015, 2015, 458786. [Google Scholar] [CrossRef] [PubMed]
- Giai Via, A.; De Cupis, M.; Spoliti, M.; Oliva, F. Clinical and biological aspects of rotator cuff tears. Muscles Ligaments Tendons J. 2019, 3, 70–79. [Google Scholar] [CrossRef]
- Little, D.; Amadio, P.C.; Awad, H.A.; Cone, S.G.; Dyment, N.A.; Fisher, M.B.; Huang, A.H.; Koch, D.W.; Kuntz, A.F.; Madi, R.; et al. Preclinical tendon and ligament models: Beyond the 3Rs (replacement, reduction, and refinement) to 5W1H (why, who, what, where, when, how). J. Orthop. Res. 2023, 41, 2133–2162. [Google Scholar] [CrossRef] [PubMed]
- Baksh, N.; Hannon, C.P.; Murawski, C.D.; Smyth, N.A.; Kennedy, J.G. Platelet-rich plasma in tendon models: A systematic review of basic science literature. Arthroscopy 2013, 29, 596–607. [Google Scholar] [CrossRef] [PubMed]
- Randelli, P.; Randelli, F.; Ragone, V.; Menon, A.; D’Ambrosi, R.; Cucchi, D.; Cabitza, P.; Banfi, G. Regenerative medicine in rotator cuff injuries. Biomed. Res. Int. 2014, 2014, 129515. [Google Scholar] [CrossRef] [PubMed]
- Viganò, M.; Ragni, E.; Marmotti, A.; De Girolamo, L. The effects of orthobiologics in the treatment of tendon pathologies: A systematic review of preclinical evidence. J. Exp. Orthop. 2022, 9, 31. [Google Scholar] [CrossRef] [PubMed]
- Fang, W.H.; Agrawal, D.K.; Thankam, F.G. “Smart exosomes”: A smart approach for tendon regeneration. Tissue Eng. Part B Rev. 2022, 28, 613–625. [Google Scholar] [CrossRef] [PubMed]
- Citro, V.; Clerici, M.; Boccaccini, A.R.; Della Porta, G.; Maffulli, N.; Forsyth, N.R. Tendon tissue engineering: An overview of biologics to promote tendon healing and repair. J. Tissue Eng. 2023, 14, 20417314231196275. [Google Scholar] [CrossRef] [PubMed]
- Rodeo, S.A. Exosomes: The new kid on the block in orthobiologics. Am. J. Sports Med. 2023, 51, 3363–3366. [Google Scholar] [CrossRef] [PubMed]
- Hurley, E.T.; Hannon, C.P.; Pauzenberger, L.; Fat, D.L.; Moran, C.J.; Mullett, H. Nonoperative treatment of rotator cuff disease with platelet-rich plasma: A systematic review of randomized controlled trials. Arthroscopy 2019, 35, 1584–1591. [Google Scholar] [CrossRef] [PubMed]
- Schwitzguebel, A.J.; Kolo, F.C.; Tirefort, J.; Kourhani, A.; Nowak, A.; Gremeaux, V.; Saffarini, M.; Lädermann, A. Efficacy of platelet-rich plasma for the treatment of interstitial supraspinatus tears: A double-blinded, randomized controlled trial. Am. J. Sports Med. 2019, 47, 1885–1892. [Google Scholar] [CrossRef] [PubMed]
- Rodeo, S.A. Orthobiologics: Current status in 2023 and future outlook. J. Am. Acad. Orthop. Surg. 2023, 31, 604–613. [Google Scholar] [CrossRef] [PubMed]
- Sharun, K.; Pawde, A.M.; Kumar, R.; Kalaiselvan, E.; Kinjavdekar, P.; Dhama, K.; Pal, A. Standardization and characterization of adipose-derived stromal vascular fraction from new zealand white rabbits for bone tissue engineering. Vet. World 2021, 14, 508–514. [Google Scholar] [CrossRef] [PubMed]
- Skalec, A.; Janeczek, M.; Czerski, A. Anatomy and histology of the rabbit common calcanean tendon. Anat. Histol. Embryol. 2019, 48, 466–475. [Google Scholar] [CrossRef] [PubMed]
- Hou, Y.; Mao, Z.; Wei, X.; Lin, L.; Chen, L.; Wang, H.; Fu, X.; Zhang, J.; Yu, C. The roles of TGF-β1 gene transfer on collagen formation during Achilles tendon healing. Biochem. Biophys. Res. Commun. 2009, 383, 235–239. [Google Scholar] [CrossRef] [PubMed]
- Statsmodels. Available online: www.statsmodels.org (accessed on 7 July 2025).


| Two-Way ANOVA (Source of Variation) | Variable: | Cells | Vessels | ECM | Artifacts |
|---|---|---|---|---|---|
| Interaction (Time × Treatment) | 0.021 | 0.019 | 0.112 | 0.705 | |
| Time | 0.001 | 0.022 | 0.006 | 0.567 | |
| Treatment | 0.228 | 0.001 | 0.385 | 0.324 | |
| 95% confidence interval of mean difference at W4 | −0.0755 to 0.170 | −0.0195 to 0.0520 | −0.136 to 0.0864 | −0.138 to 0.0603 | |
| 95% confidence interval of mean difference at W12 | −0.256 to −0.0105 | 0.0343 to 0.106 | −0.0309 to 0.192 | −0.117 to 0.0816 |
| Peak Load | Equilibrium Load | Peak Stress | Equilibrium Stress | Percent Relaxation | Cross-Sectional Area | |
|---|---|---|---|---|---|---|
| Effect size | 0.29 | 0.27 | 0.4 | 0.3 | 0.54 | 0.45 |
| OP [%] | 21.8 | 19.4 | 39.4 | 23.2 | 65.5 | 49.3 |
| nTotal | 135 | 155 | 73 | 126 | 42 | 58 |
| nGroup | 34 | 39 | 18 | 32 | 11 | 15 |
| R | Y | Sp | T | I | P | S | AT | C | H | PM | IHC | B |
|---|---|---|---|---|---|---|---|---|---|---|---|---|
| [55] | 2011 | Rabbit | CCT | Incision | + | - | PRP | - | + | - | - | - |
| [56] | 2012 | Rabbit | CCT | Transection | + | - | PRP | PRP alone | + | - | + | + |
| [57] | 2013 | Horse | SDFT | Collagenase gel | - | - | PC | Sham | + | - | - | - |
| [58] | 2014 | Horse | SDFT | Lesion created by a standardized surgical model | - | - | - | Sham | + | - | + | - |
| [59] | 2014 | Rabbit | CCT | Resection of a 2 cm-long tendon fragment | - | + | - | Cell-free scaffold | + | -- | - | + |
| [7] | 2014 | Rabbit | SST | Sharp release of the insertion of the SST at the greater tuberosity | + 1 | - | - | Sham | - | - | + | - |
| [60] | 2016 | Horse | SDF | Lesion created by a standardized surgical model | - | - | - | Sham | + | - | + | - |
| [61] | 2016 | Dog | FDPT | Transection | + | + | GF | Cell-free scaffold | - | - | - | + |
| [62] | 2016 | Dog | FT | Transection | + | + | - | Cell-free scaffold | - | - | + | - |
| [63] | 2017 | Horse | SDFT | Lesion created by a standardized surgical model | - | - | PRP | BM-MSCs | + | - | - | - |
| [64] | 2017 | Horse | SDFT | Lesion created by a standardized surgical model | - | - | - | Sham | + | - | - | + |
| [65] | 2017 | Dog | FDPT | Transection | + | + | GF | Cell-free scaffold | + | - | + | - |
| [66] | 2018 | Horse | SDFT | Collagenase | - | - | - | Autologous serum | + | + | + | - |
| [67] | 2019 | Rabbit | PT | Partial patellectomy | + | + | US | No cells, no US | + | + 3 | - | + |
| [68] | 2019 | Rabbit | FDST | Transection | + | - | - | Sham | - | - | - | + |
| [69] | 2019 | Sheep | AT | Collagenase | - | - | rESWT | PRP | + | - | + | - |
| [70] | 2020 | Rat | SST | Sharp release of the insertion of the SST at the greater tuberosity | + 2 | + | - | Cell-free scaffold | + | - | + | + |
| Cell Type | MSCs [%] | EP [%] | M2 [%] | CV [%] | |
|---|---|---|---|---|---|
| Surface Markers | CD45- CD31- CD34+ | CD45- CD31+ CD34+ | CD45+ CD206+ | ||
| Reference | System/Method | ||||
| [5] | A | 32.8 | 15.3 | 16.4 | 85.2 |
| [4] | A | 20.0 | -- | -- | -- |
| [99] | B | 16.1 | 9.4 | 5.6 | 82.0 |
| [100] | C | 10.7 | -- | -- | 84.0 |
| [100] | D | 9.1 | -- | -- | 82.0 |
| [100] | B | 8.9 | -- | -- | 69.3 |
| [98] | E | 7.2 | -- | -- | 50.3 |
| Group | n | Treatment | Type | Time Post-Treatment |
|---|---|---|---|---|
| 1 | 4 | UA-ADRCs | H/I | W4 |
| 2 | 4 | UA-ADRCs | H/I | W12 |
| 3 | 4 | RLS | H/I | W4 |
| 4 | 4 | RLS | H/I | W12 |
| 5 | 8 | UA-ADRCs | B/I | W12 |
| 6 | 8 | RLS | B/I | W12 |
| Antibody | Characteristic | Specification |
|---|---|---|
| Procollagen 1 | ||
| Immunoglobuline isotype/clone status | IgG1/mouse, monoclonal | |
| Catalog no./provider | SP1.D8/DSHB a | |
| Demasking of antigen | Not applicable | |
| Blocking | Vector Bloxall SP-6000 b, LOT ZG1216 from 4 April 2021, and normal horse serum blocking solution 2.5% (S-2012-50) b | |
| Dilution and incubation parameters | 1:10, 4 °C, over night | |
| Secondary antibody used | Horse-anti-mouse IgG BA-2000 b, 1:200 | |
| Type III collagen | ||
| Immunoglobuline isotype/clone status | IgG1/mouse, monoclonal | |
| Catalog no./provider | C7805 (Clone FH-7A)/Sigma-Aldrich (St. Louis, MO, USA) | |
| Demasking of antigen | Protease XIV | |
| Blocking | Vector Bloxall SP-6000 b, LOT ZG1216 from 4 April 2021, and normal horse serum blocking solution 2.5% (S-2012-50) b | |
| Dilution and incubation parameters | 1:150, 4 °C, over night | |
| Secondary antibody used | Horse-anti-mouse IgG BA-2000 b, 1:200 | |
| CD163 | ||
| Immunoglobuline isotype/clone status | IgG1/mouse, monoclonal | |
| Catalog no./provider | 5C6 FAT BMA Biomedicals (Augst, Switzerland) | |
| Demasking of antigen | Not applicable | |
| Blocking | 3% H2O2 in Methanol | |
| Dilution and incubation parameters | 1:400, 4 °C, over night | |
| Secondary antibody used | Horse-anti-mouse IgG BA-2000 b, 1:200 | |
| Aggrecan | ||
| Immunoglobuline isotype/clone status | IgG1/mouse, monoclonal | |
| Catalog no./provider | 12/21/1-C-6/DSHB a | |
| Demasking of antigen | 3% H2O2 in Methanol/Chondroitinase AC c | |
| Blocking | Normal horse serum blocking solution 2.5% (S-2012-50) b | |
| Dilution and incubation parameters | 1:5, 4 °C, over night | |
| Secondary antibody used | Horse-anti-mouse IgG BA 2000 b, 1:200 | |
Disclaimer/Publisher’s Note: The statements, opinions and data contained in all publications are solely those of the individual author(s) and contributor(s) and not of MDPI and/or the editor(s). MDPI and/or the editor(s) disclaim responsibility for any injury to people or property resulting from any ideas, methods, instructions or products referred to in the content. |
© 2025 by the authors. Licensee MDPI, Basel, Switzerland. This article is an open access article distributed under the terms and conditions of the Creative Commons Attribution (CC BY) license (https://creativecommons.org/licenses/by/4.0/).
Share and Cite
Schmitz, C.; Alt, C.; Wuerfel, T.; Milz, S.; Dinzey, J.; Hill, A.; Sikes, K.J.; Burton, L.H.; Easley, J.; Stewart, H.L.; et al. Regeneration of Biomechanically Functional Tendon Tissue Following Injection of Uncultured, Autologous, Adipose-Derived Regenerative Cells into Partial Achilles Tendon Defects in Rabbits. Int. J. Mol. Sci. 2025, 26, 6800. https://doi.org/10.3390/ijms26146800
Schmitz C, Alt C, Wuerfel T, Milz S, Dinzey J, Hill A, Sikes KJ, Burton LH, Easley J, Stewart HL, et al. Regeneration of Biomechanically Functional Tendon Tissue Following Injection of Uncultured, Autologous, Adipose-Derived Regenerative Cells into Partial Achilles Tendon Defects in Rabbits. International Journal of Molecular Sciences. 2025; 26(14):6800. https://doi.org/10.3390/ijms26146800
Chicago/Turabian StyleSchmitz, Christoph, Christopher Alt, Tobias Wuerfel, Stefan Milz, Jacqueline Dinzey, Ashley Hill, Katie J. Sikes, Lindsey H. Burton, Jeremiah Easley, Holly L. Stewart, and et al. 2025. "Regeneration of Biomechanically Functional Tendon Tissue Following Injection of Uncultured, Autologous, Adipose-Derived Regenerative Cells into Partial Achilles Tendon Defects in Rabbits" International Journal of Molecular Sciences 26, no. 14: 6800. https://doi.org/10.3390/ijms26146800
APA StyleSchmitz, C., Alt, C., Wuerfel, T., Milz, S., Dinzey, J., Hill, A., Sikes, K. J., Burton, L. H., Easley, J., Stewart, H. L., Puttlitz, C. M., Gadomski, B. C., Labus, K. M., Pearce, D. A., Maffulli, N., & Alt, E. U. (2025). Regeneration of Biomechanically Functional Tendon Tissue Following Injection of Uncultured, Autologous, Adipose-Derived Regenerative Cells into Partial Achilles Tendon Defects in Rabbits. International Journal of Molecular Sciences, 26(14), 6800. https://doi.org/10.3390/ijms26146800