

Quantum Dot-Based Luminescent Sensors: Review from Analytical Perspective


Abstract
1. Introduction
2. Sensing Applications Based on the Fluorescence of QDs

| First Name | Nanostructure | Size | Sensing Molecule | Excitation and Emission Wavelength | Quenching Mechanism | Analyte | LOD | Range | Log(Range) | RSD (Average, Range) | Other FoM | Preparation |
|---|---|---|---|---|---|---|---|---|---|---|---|---|
| Hong 2012, [56] | CdTe QDs@TGA-Eu3+ | N/A | N/A | ex.: 360 nm; em.: 540 nm | PET | nucleoside triphosphates | 2.0 nM | 70–150 nM | 0.33 | N/A | N/A | reflux synthesis, CdCl2, NaHTe, TGA |
| Ban 2015, [57] | amine-capped Si QDs | 2.1 nm | APTMS | ex.: 350 nm; em.: 465 nm | FRET | TNT | 1.0 nM | 5–500 nM | 2.00 | 2.63%; 2.3–2.9% | QY: 22% | hydrothermal; APTMS, trisodium citrate |
| Peveler 2015, [58] | red ZnS-shelled CdSe QDs | N/A | OMe | ex.: 365 nm, em.: 608 nm | ET | DNT | 0.38 µM | 15–85 µM | 0.75 | N/A | N/A | decomposition; CdO, TOP-Se, Zn-DTCA, surface ligands CD, CX, OH, OMe) |
| Peveler 2015, [58] | green ZnS-shelled CdSe QDs | N/A | CX | ex.: 365 nm, em.: 544 nm | ET | TNT | 0.44 µM | 15–85 µM | 0.75 | N/A | Quenching %: 73% | decomposition; CdO, TOP-Se, Zn-DTCA, surface ligands CD, CX, OH, OMe) |
| Peveler 2015, [58] | red ZnS-shelled CdSe QDs | N/A | OMe | ex.: 365 nm, em.: 608 nm | ET | tetryl | 0.73 µM | 15–85 µM | 0.75 | N/A | Quenching %: 47% | decomposition; CdO, TOP-Se, Zn-DTCA, surface ligands CD, CX, OH, OMe) |
| Peveler 2015, [58] | red ZnS-shelled CdSe QDs | N/A | OMe | ex.: 365 nm, em.: 608 nm | ET | RDX | 2.5 µM | 15–85 µM | 0.75 | N/A | N/A | decomposition; CdO, TOP-Se, Zn-DTCA, surface ligands CD, CX, OH, OMe) |
| Peveler 2015, [58] | blue ZnS-shelled CdSe QDs | N/A | OH | ex.: 365 nm, em.: 516 nm | ET | PETN | 0.35 µM | 15–85 µM | 0.75 | N/A | N/A | decomposition; CdO, TOP-Se, Zn-DTCA, surface ligands CD, CX, OH, OMe) |
| Zhang 2015, [59] | carboxylated CdT QDs | 10 nm | MIPs | ex.: 397 nm, em.: 540 nm | ET | phycocyanin | 5.9 nM | 0.02–0.8 μM | 1.60 | 3.20% | Recovery %: 94.0–105.0% | hot injection method in aqueous phase; Cd(NO3)2·4H2O, Te powder, NaBH4 |
| Li 2016, [60] | CdTe QDs | 3.08 nm | aptamer | ex.: 400 nm, em.: 543 nm | IFE | bisphenol A | 8.2 nM | 10–80 ng/mL | 0.90 | 1.62%; 1.08–1.91% | Recovery %: 95.3–102% | microwave-assisted; N2-saturated CdCl2, Te powder, NaBH4, TGA |
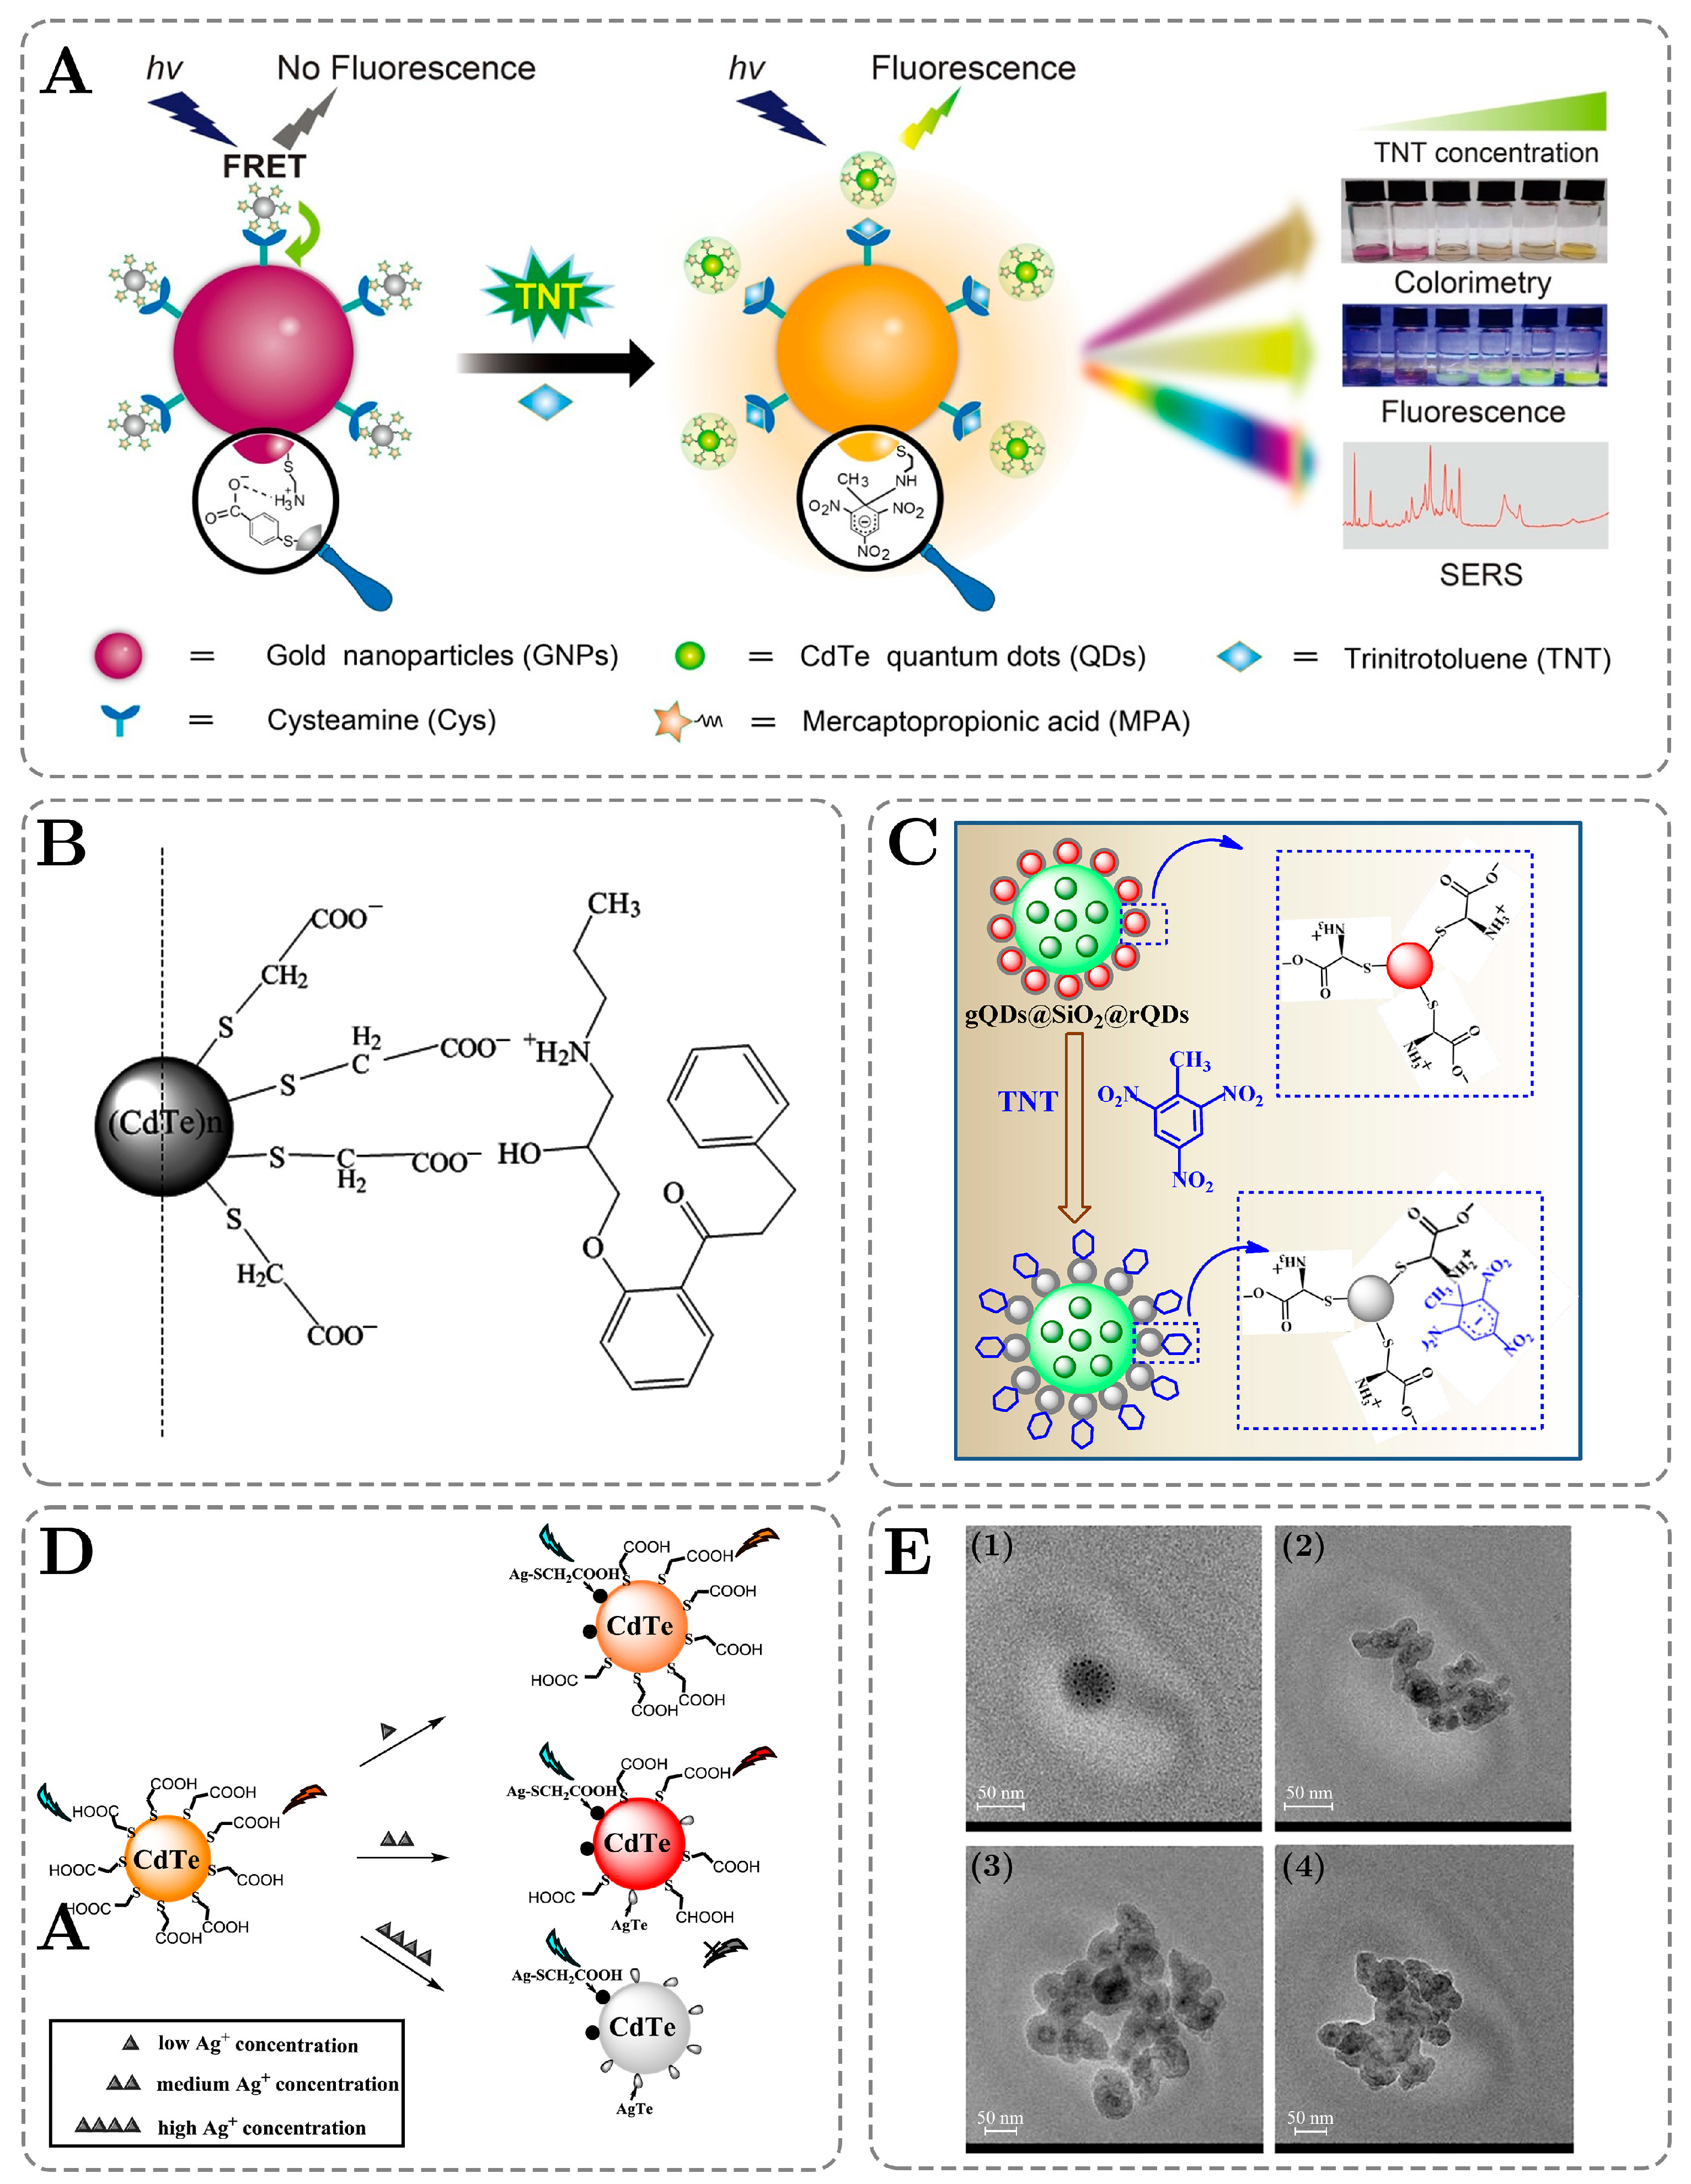
| Qian 2016, [61] | 3-MPA-CdTe gQDs@SiO2@ Lcys-CdTe rQDs | 3.18 nm | L-cysteine (Lcys) | ex.: 365 nm, em.: 625 nm | static quenching | TNT | 3.3 nM | 10–8000 nM | 2.90 | 5.28%; 3.5–8.7% | Recovery %: 95.5–108.5% | colloidal; Te powder, NaBH4, CdCl2 |
| Singh 2016, [62] | ZnO QDs | N/A | N/A | ex.: 320 nm, em.: 525 nm | static and dynamic quenching | free chlorine | 41 nM | 0.05–0.7 μM | 1.15 | N/A | N/A | ultrasonication; Zn(OAc)2, ethanol, APTES |
| Chang 2017, [63] | Mn-doped MBA-capped ZnS QDs | 3.5 nm | MBA | ex.: 310 nm, em.: 610 nm | no quenching | transferrin (TRF) | 5.7 nM | 0.1–10 μM | 2.00 | 0.43%; 0.2–0.8% | Recovery %: 86.9–97.5% | wet-chemical precipitation method; ZnSO4 × 7H2O, MnSO4 × 4H2O |
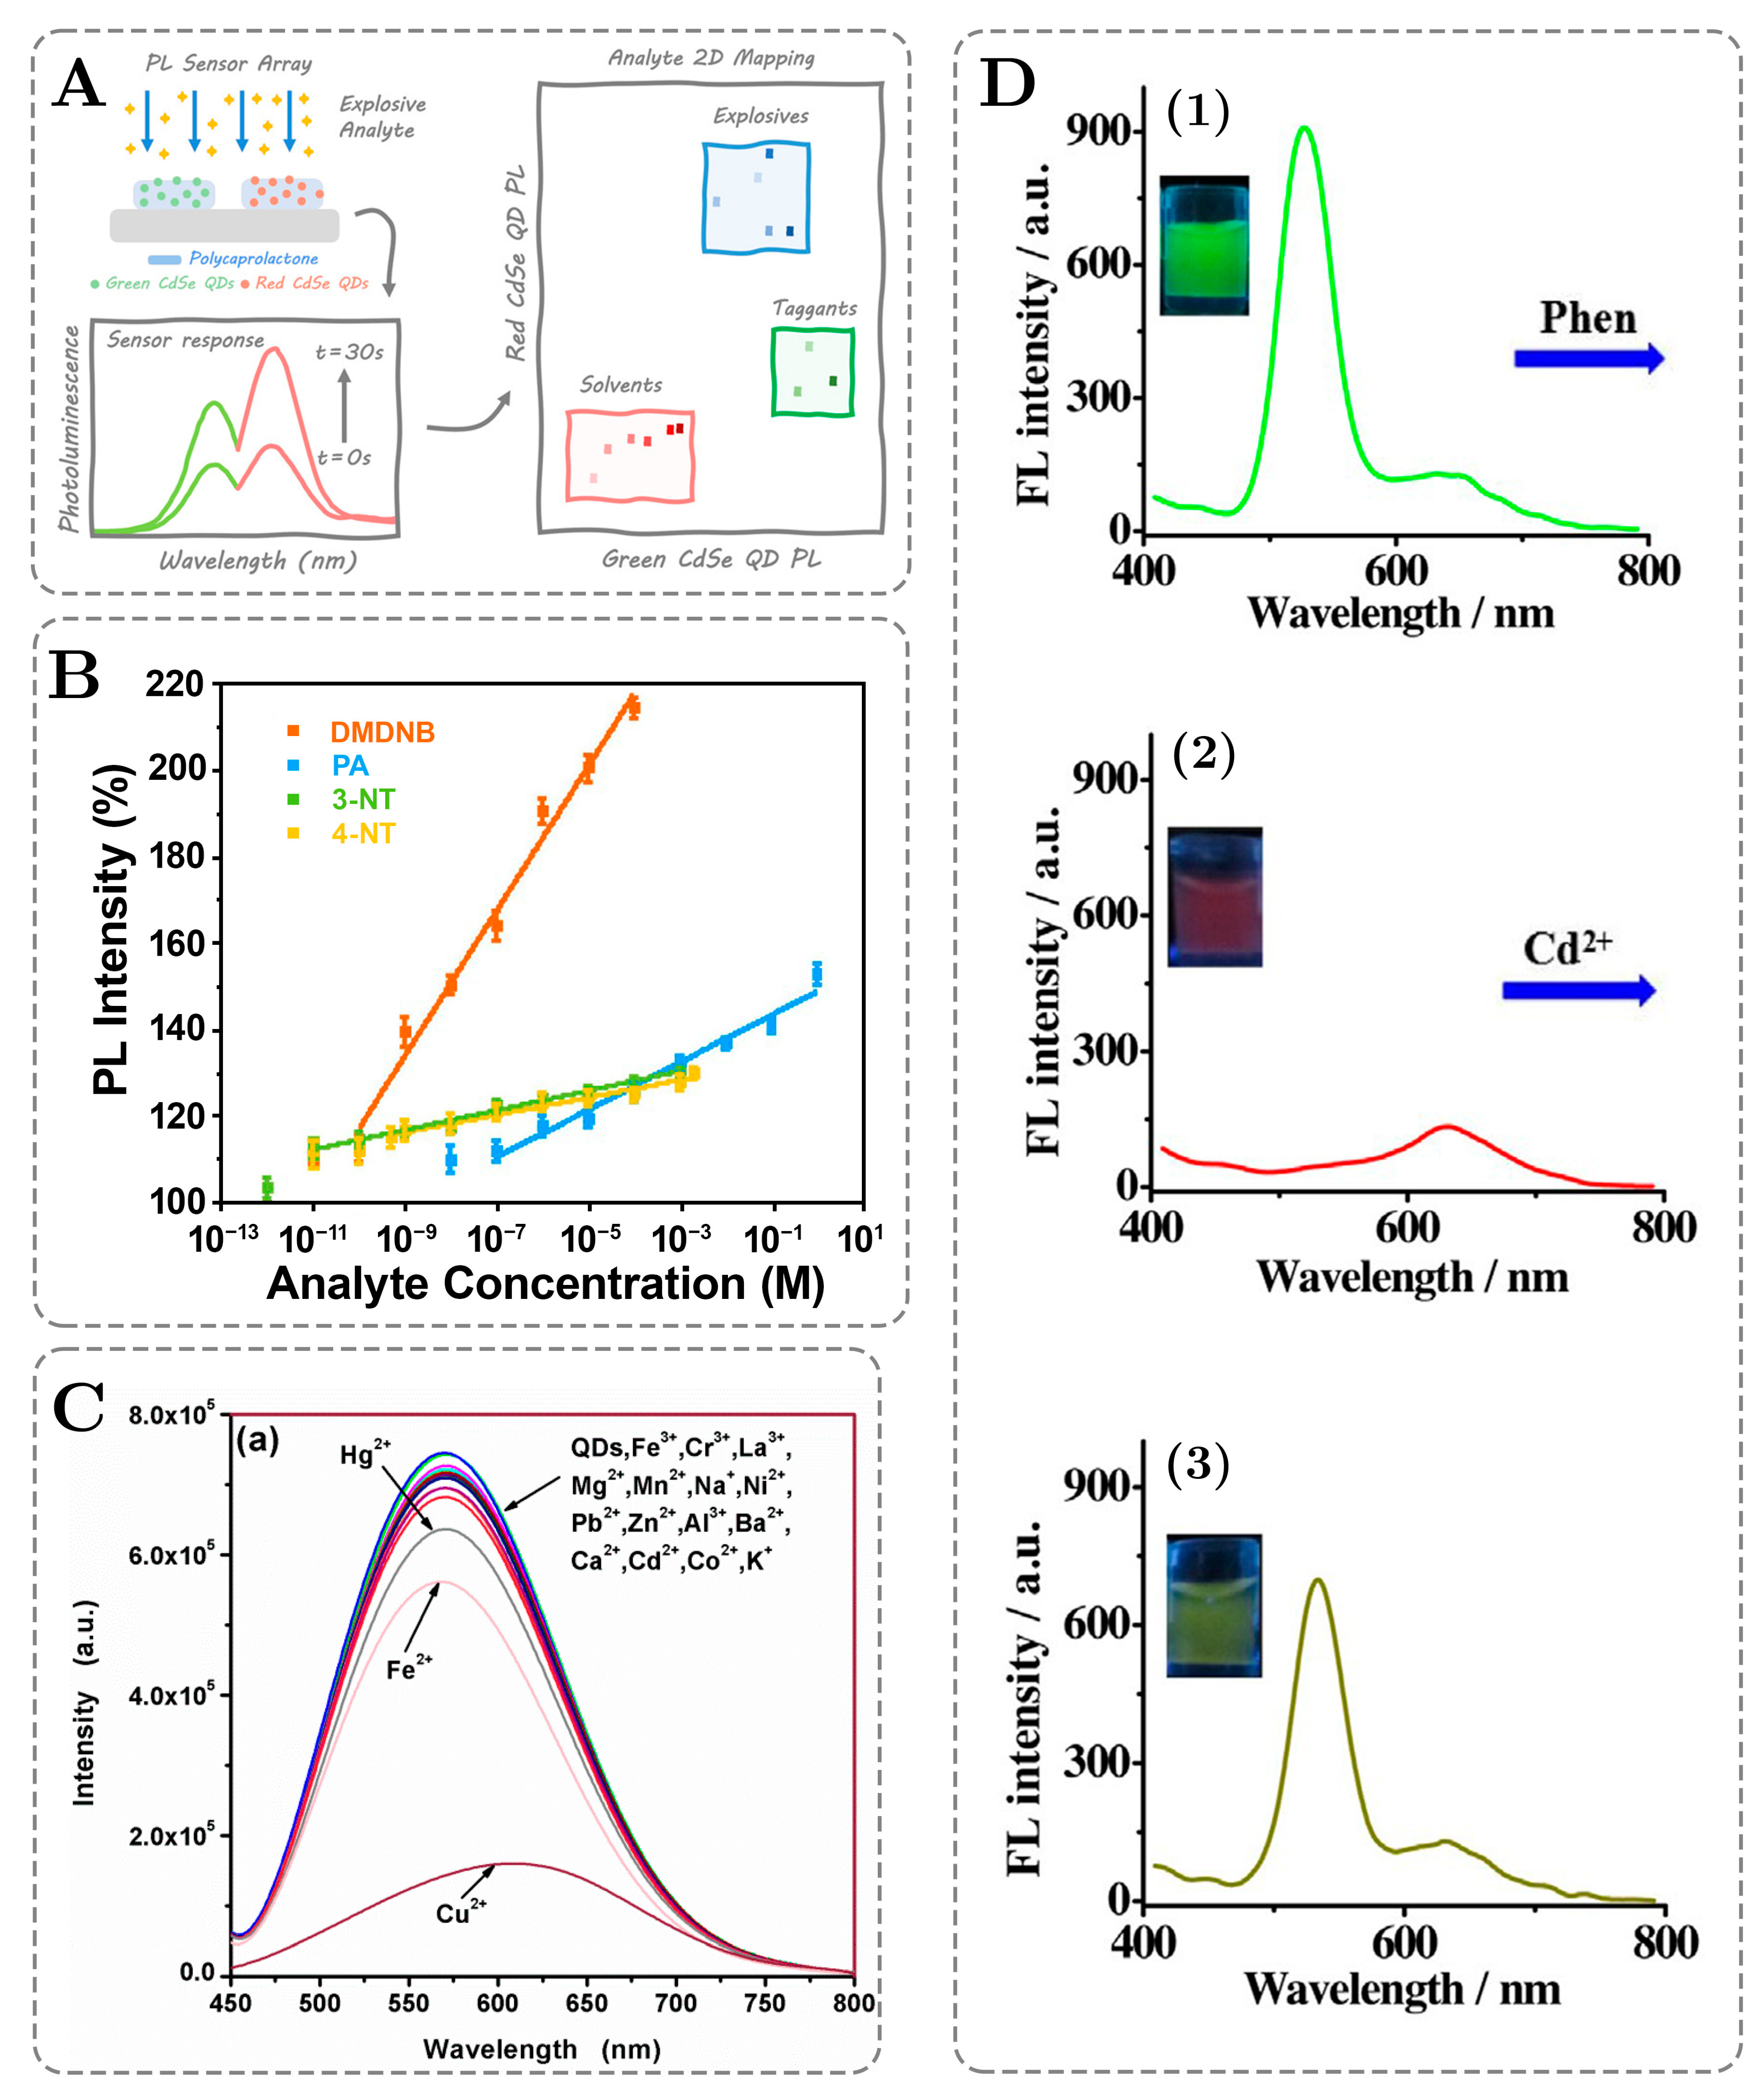
| Qian 2017, [64] | rQDs@SiO2@gQDs | 2.34 nm (gQDs); 3.62 nm (rQDs) | 1,10-phenanthroline (phen) | ex.: 365 nm, em.: 640 nm | static quenching | Cd2+ | 0.17 nM | 0.5–2000 nM | 3.60 | 5.37%; 4.2–6.7% | Recovery %: 96.4–101.4% | colloidal; Te powder, NaBH4, CdCl2, MPA |
| Tang 2017, [65] | aN QDs (amino-nitrogen) | 5.0 nm | cysteine | ex.: 320 nm, em.: 419 nm | FRET | cysteine | 0.10 µM | 0.3–3 µM | 1.00 | 2.83%; 1.5–3.7% | QY: 34%; Recovery %: 90.0–106.7% | microwave-assisted; 2-azido imidazole, ammonia |
| Yu 2017, [66] | Polymer CdTe/CdS QDs | 10 nm | CCP | ex.: 380 nm, em.: 420 nm | FRET | hydrogen peroxide | 0.10 mM | 0.2–4 mM | 1.30 | N/A | N/A | colloidal; Na2TeO3, NaBH4, CdCl2, MPA |
| Yu 2017, [66] | Polymer CdTe/CdS QDs | 10 nm | CCP | ex.: 380 nm, em.: 420 nm | FRET | glucose | 50 µM | 0.1–5 mM | 1.70 | N/A | Recovery %: 94.93–105.89% | colloidal; Na2TeO3, NaBH4, CdCl2, MPA |
| Zhou 2017, [67] | Eu-ZnO QDs | 5 nm | DPA | ex.: 360 nm, em.: 530 nm | no quenching | CaDPA | 3.0 nM | 0.004–4 µM | 3.00 | N/A | QY: 1.89% without DPA, 10.69% with DPA | sol-gel; Zn(OAc)2, KOH, APTES, Eu(NO3)3 |
| Liu 2018, [33] | Si QDs | 6.87 nm | N/A | ex.: 410 nm, em.: 512 nm | ET | hydroquinone | 2.6 µM | 6–100 μM | 1.22 | 2.17%; 1.242–3.464% | Recovery %: 92.5–105.1% | hydrothermal; DAMO |
| Pourghobadi 2018, [68] | TGA-CdTe QDs | 3 nm | TGA | ex.: 360 nm, em.: 580 nm | ET | dopamine | 0.35 µM | 0.5–10 μM | 1.30 | 4.92%; 2.5–6.28% | Recovery %: 92–106% | aqueous; Te powder, NaBH4, CdCl2, TGA |
| Xing 2018, [69] | MAA-ZnTe QDs | 12 nm | N/A | ex.: 289 nm, em.: 551 nm | static quenching | Fe3+ | 4.9 µM | 2–100 µM | 1.70 | 3.88% | N/A | colloidal; Zn(OAc)2, Na2TeO3, MAA |
| Zhao 2018, [70] | WS2 QDs | 8 nm | N/A | ex.: 360 nm, em.: 445 nm | FRET | dopamine | 3.3 µM | 5–50 μM | 1.00 | N/A | QY: 21.75% | liquid exfoliation of bulk crystals; WS2, 1-methyl-pyrrolidinone |
| Chen 2019, [23] | CdTe QDs | 2.25 nm | TGA | ex.: 330 nm, em.: 602 nm | dynamic quenching | Ag+ | 5.0 nM | 5–200 nM | 1.60 | 5.40%; 2.1–9.7% | QY: 56% compared with Rhodamine B in ethanol; Recovery %: 94.5–112.3% | aqueous; K2TeO3, NaBH4, Cd(OAc)2, TGA |
| Feng 2019, [71] | MIPs layer coated on CdTe QDs | N/A | MIPs | ex.: 350 nm, em.: 570 nm | static quenching | tetrabromobisphenol-A | 0.55 nM | 1.0–60.0 ng/mL | 1.78 | 3.11%; 0.9–6.2% | QY of QDs: 64%; QY of MIP-QDs: 35%; Recovery %: 89.6–107.9% | aqueous; CdCl2, K2TeO3 |
| Li 2019, [72] | SiQDs | 2.5 nm | N/A | ex.: 390 nm, em.: 460 nm | IFE | bovine hemoglobin | 12 nM | 0.01–10 μM | 3.00 | N/A | QY: 19.47%; Recovery %: 93.7–109.0% | hydrothermal; APTES, TSIM, L-AA |
| Najafi 2019, [73] | Pd-doped CdTe QDs | 3 nm | TGA | ex.: 340 nm, em.: 529 nm | static quenching | diazinon | 3.3 nM | 2.3–100 μM | 1.64 | 1.73%; 1.4–2.0% | Recovery %: 95.8–102.4% | hydrothermal; Te powder, NaBH4, CdCl2, Pd(OAc)2, TGA |
| Safari 2019, [74] | MPA-capped Ni-doped CdTe QDs | 2 nm | MPA | ex.: 330 nm, em.: 540 nm | static quenching | pyrazinamide | 0.50 µM | 2–100 μM | 1.70 | 3.13%; 2.9–3.4% | Recovery %: 97.5–101.0% | hydrothermal; Te powder, NaBH4, CdCl2, Ni(NO3)2 |
| Wang 2019, [75] | CA-CdS QDs | 8.2 nm | CA | ex.: 420 nm, em.: 570 nm | static quenching | Cu2+ | 9.2 nM | 10 nM–50 µM | 3.70 | 3.05%; 2.9–3.2% | QY: 18.82%; Recovery %: 95.80–99.70% | hydrothermal; CdCl2, thioacetamide, citric acid |
| Zhang 2019, [76] | CdTe QDs | N/A | MIPs | ex.: 350 nm, em.: 566 nm | ET | pesticide 2,4-D | 90 nM | 0.83–100 µM | 2.08 | 4.92%; 4.7–5.9% | Recovery %: 94.2–107.0% | hot injection method in aqueous phase; Cd(NO3)2·4H2O, Te powder, NaBH4 |
| Wang 2020, [24] | CdTe QDs | 3.5 nm | TGA | ex.: 350 nm, em.: 560 nm | static quenching | propafenone | 23 nM | 0.07615–20.50 μM (0.026–7.0 μg/mL) | 2.43 | 3.79%; 2.85–4.31% | Recovery %: 95.3–102.4% | aqueous; Te powder, NaBH4, CdCl2 |
| Zhang 2020, [77] | S-doped Si QDs | 4.77 nm | –NH2 | ex.: 345 nm, em.: 425 nm | FRET | Fe3+ | 0.21 µM | 1–20 µM | 1.30 | 0.73%; 0.00–2.14% | QY (ref quinine): 66%; Recovery %: 90–106% | hydrothermal; APTES, trisodium citrate |
| Gao 2021, [78] | AuNPs-CdTe QDs@MPA | N/A | cysteamine | ex.: 365 nm, em.: 540 nm | FRET | TNT | 0.24 nM | 1 nM–5 μM | 3.70 | 8.64%; 5.9–10.2% | Recovery %: 86.70–112.6% | hydrothermal; CdCl2, Te powder, NaBH4, MPA |
| Liu 2021, [79] | Ti3C2 MQDs (MXene QDs) | 2 nm | N/A | ex.: 330 nm, em.: 430 nm | FRET | curcumin | 0.20 µM | 0.05–10 μM | 2.30 | N/A | N/A | microwave-assisted; Ti3AlC2, HF |
| Liu 2021, [79] | Ti3C2 MQDs (MXene QDs) | 2 nm | N/A | ex.: 330 nm, em.: 430 nm | FRET | hypochlorite | 5.0 µM | 25–150 μM; 150–275 μM | 1.04 | N/A | N/A | microwave-assisted; Ti3AlC2, HF |
| Yang 2021, [80] | ZnCdS QDs@MIP; CdTeS QDs@SiO2 | 11 nm | APTES | ex.: 380 nm, em.: 530 nm | ET | ascorbic acid | 0.78 µM | 1–500 μM | 2.70 | 1.23%; 1.044–1.663% | Recovery %: 96.0–99.0% | ZnCdS: aqueous refluxing method; Zn(OAc)2, CdCl2, MPA, Na2S; CdTeS: two-step procedure; Te powder, NaBH4, CdCl2, thiourea |
| Yi 2021, [81] | β-CD-MoS2 QDs | 3 nm | β-CD | ex.: 295 nm, em.: 435 nm | PET | parathion-methyl | 13 nM | 0.01–18 mg/L (37.99 nM–68.39 μM) | 3.26 | 3.50%; 2.67–4.42% | Recovery %: 93–105.6% | hydrothermal; Na2MoO4·2H2O, glutathione |
| Zhang 2021, [82] | CdTe QDs | 5 nm | TGA | ex.: 365 nm, em.: 550 nm | static quenching | salbutamol | 42 nM | 62.7–209 nM | 0.52 | 6.17%; 5.15–7.21% | Recovery %: 81.1–89.3% | hydrothermal; Te powder, NaBH4, CdCl2, TGA |
| Zhao 2021, [83] | NALC-CdS QDs (N-acetyl-L-cysteines) | 2.03 nm | NALC | ex.: 360 nm, em.: 453 nm | ET | Cu2+ | 0.48 µM | 1–25 μM | 1.40 | 3.2%; 2.3–4.1% | QY: 34.31% (w.r.t. Rhodamine 6G in absolute ethanol); Recovery %: 99.6–101.6% | one-pot low-temperature hydrothermal route; CdCl2, NALC, thioaceamide |
| Aznar-Gadea 2022, [84] | green and red CdSe QDs | 2.9 nm | N/A | ex.: 404 nm, em.: 560 nm | ET, FRET | 3-nitrotoluene | 10 pM | 10 pM–1 mM | 8.00 | N/A | PL QY: 30% | hot injection method; CdO, Se solution |
| Aznar-Gadea 2022, [84] | green and red CdSe QDs | 2.9 nm | N/A | ex.: 404 nm, em.: 560 nm | ET, FRET | 4-nitrotoluene | 0.50 nM | 0.5 nM–1 mM | 6.30 | N/A | PL QY: 30% | hot injection method; CdO, Se solution |
| Aznar-Gadea 2022, [84] | green and red CdSe QDs | 2.9 nm | N/A | ex.: 404 nm, em.: 560 nm | ET, FRET | 2,3-dimethyl-2,3-dinitrobutane | 0.50 nM | 0.1 nM–0.1 mM | 6.00 | N/A | PL QY: 30% | hot injection method; CdO, Se solution |
| Aznar-Gadea 2022, [84] | green and red CdSe QDs | 2.9 nm | N/A | ex.: 404 nm, em.: 560 nm | ET, FRET | picric acid | 0.10 µM | 100 nM–1 M | 7.00 | N/A | PL QY: 30% | hot injection method; CdO, Se solution |
| Wang 2022, [85] | WxOy QDs | 3.35 nm | N/A | ex.: 320 nm, em.: 383 nm | IFE, FRET, PET | Tetracycline | 19 nM | 5–50 μM | 1.00 | 1.82%; 0.9–3.77% | Recovery %: 97.94–109.35% | one-pot ethanol–thermal method; WS2, H2O2 |
| Narasimhappa 2023, [86] | CdS QDs | N/A | N/A | ex.: 365 nm, em:. 440 nm | FRET | tetracycline | 23 nM | 10–100 µM | 1.00 | 1.82%; 0.90–3.77% | QY: 55.8%; Recovery %: 80.1–106.7% | extracellular synthesis; Citrobacter freundii, cysteine, CdCl2 |
| Zhong 2023, [87] | G-MoS2 QDs (glutathione) | 2 nm | GSH | ex.: 360 nm, em.: 430 nm | IFE | hypochlorite | 12 nM | 1–30 µM | 1.48 | 2.14%; 0.72–4.41% | QY: 6.81%; Recovery %: 99.5–102.96% | hydrothermal; Na2MoO4⋅2H2O, glutathione, MilliQ water |
| Singh 2024, [88] | Zn3N2 QDs | N/A | N/A | ex.: 320 nm, em.: 408 nm | dynamic quenching | Cu2+ | 22 nM | 2.5–50 µM | 1.30 | 2% | QY: 29.56% | hydrothermal; Zn(NO3)2×6H2O, NH3 |
| Singh 2024, [88] | Zn3N2 QDs | N/A | N/A | ex.: 320 nm, em.: 408 nm | dynamic quenching | Mn2+ | 64 nM | 0.05–5 µM | 2.00 | 2% | QY: 29.56% | hydrothermal; Zn(NO3)2×6H2O, NH3 |
| Velamala 2024, [89] | CsPbBr3@D-TA Per-QDs | 13.1 nm | D-TA | ex.: 380 nm, em.: 522 nm | static quenching (aggregation) | superoxide anion | 40 nM | 0.125–25 µM | 2.30 | 1.58%; 0.99–1.99% | QY: 29.8%; Recovery %: 98.43–99.81% | in-situ precipitation method; PbBr2, CsBr, D-TA |
| Zhang 2024, [90] | CdTe-MIP/SiO2 | N/A | MIPs | ex.: 365 nm, em.: 609 nm | FRET | malachite green | 3.7 nM | 0.01–20 μM | 3.30 | 1.40%; 0.5–2.5% | QY: 19.7%; Recovery %: 98.4–101.5% | hydrothermal; Te powder, NaBH4, CdCl2, MPA |
| Kailasa 2025, [91] | Malt@MAPbBr3 QDs | 7.25 nm | D-maltose | ex.: 430 nm, em.: 535 nm | static quenching | γ-aminobutyric acid (GABA) | 8.4 nM | 0.05–10 µM | 2.30 | 0.96%; 0.23–1.26% | QY: 23.74%; Quenching efficiency: >90%; Recovery %: 98.13–99.96% | ligand-assisted reprecipitation; MABr, PbBr2, 1-octadecene, oleyamine, maltose |
| Makwana 2025, [34] | LaSrO3 Per-QDs | 4.45 nm | N/A | ex.: 336 nm, em.: 421 nm | FRET | bilirubin (BR) | 10 nM | 0.025–25 µM | 3.00 | 0.70%; 0.48–0.86% | QY: 36.91%; Recovery %: 98.90–100.01% | microwave-assisted sol-gel method; La(NO3)3·6H2O, Sr(NO3)2, L-serine |
| Makwana 2025,[34] | LaSrO3 Per-QDs | 4.45 nm | N/A | ex.: 336 nm, em.: 421 nm | IFE | epinephrine (EP) | 17 nM | 0.05–10 µM | 2.30 | 0.48%; 0.30–0.77% | QY: 36.91%: Recovery %: 99.24–99.98% | microwave-assisted sol-gel method; La(NO3)3·6H2O, Sr(NO3)2, L-serine |
| Zhang L. 2025, [92] | MoS2 QDs | N/A | APBA | ex.: 320 nm, em.: 375 nm | dynamic and static quenching, IFE | glutathione (GSH) | 0.48 µM | 10–500 μM | 1.70 | 3.74%; 2.45–5.52% | Assay time: 1 min; Recovery %: 98.73–103.34% | hydrothermal; Na2MoO4·2H2O and cysteine |
| Zhang L. 2025, [92] | MoS2 QDs | N/A | APBA | ex.: 320 nm, em.: 375 nm | dynamic and static quenching, IFE | ascorbic acid | 0.19 µM | 10–100 μM | 1.00 | 2.71%; 0.48–6.91% | Assay time: 1 min; Recovery %: 97.44–104.7% | hydrothermal; Na2MoO4·2H2O and cysteine |
| Zhang Y. 2025, [28] | Si QDs | 3 nm | N/A | ex.: 367 nm, em.: 464 nm | ET, IFE | Hg2+ | 3.0 nM | 0.5–5 μM | 1.00 | 12.27%; 4.11–18.8% | QY: 29.4%; Recovery %: 80.3–109% | microwave-assisted; trisodium citrate dehydrate, DAMO, glycerol |
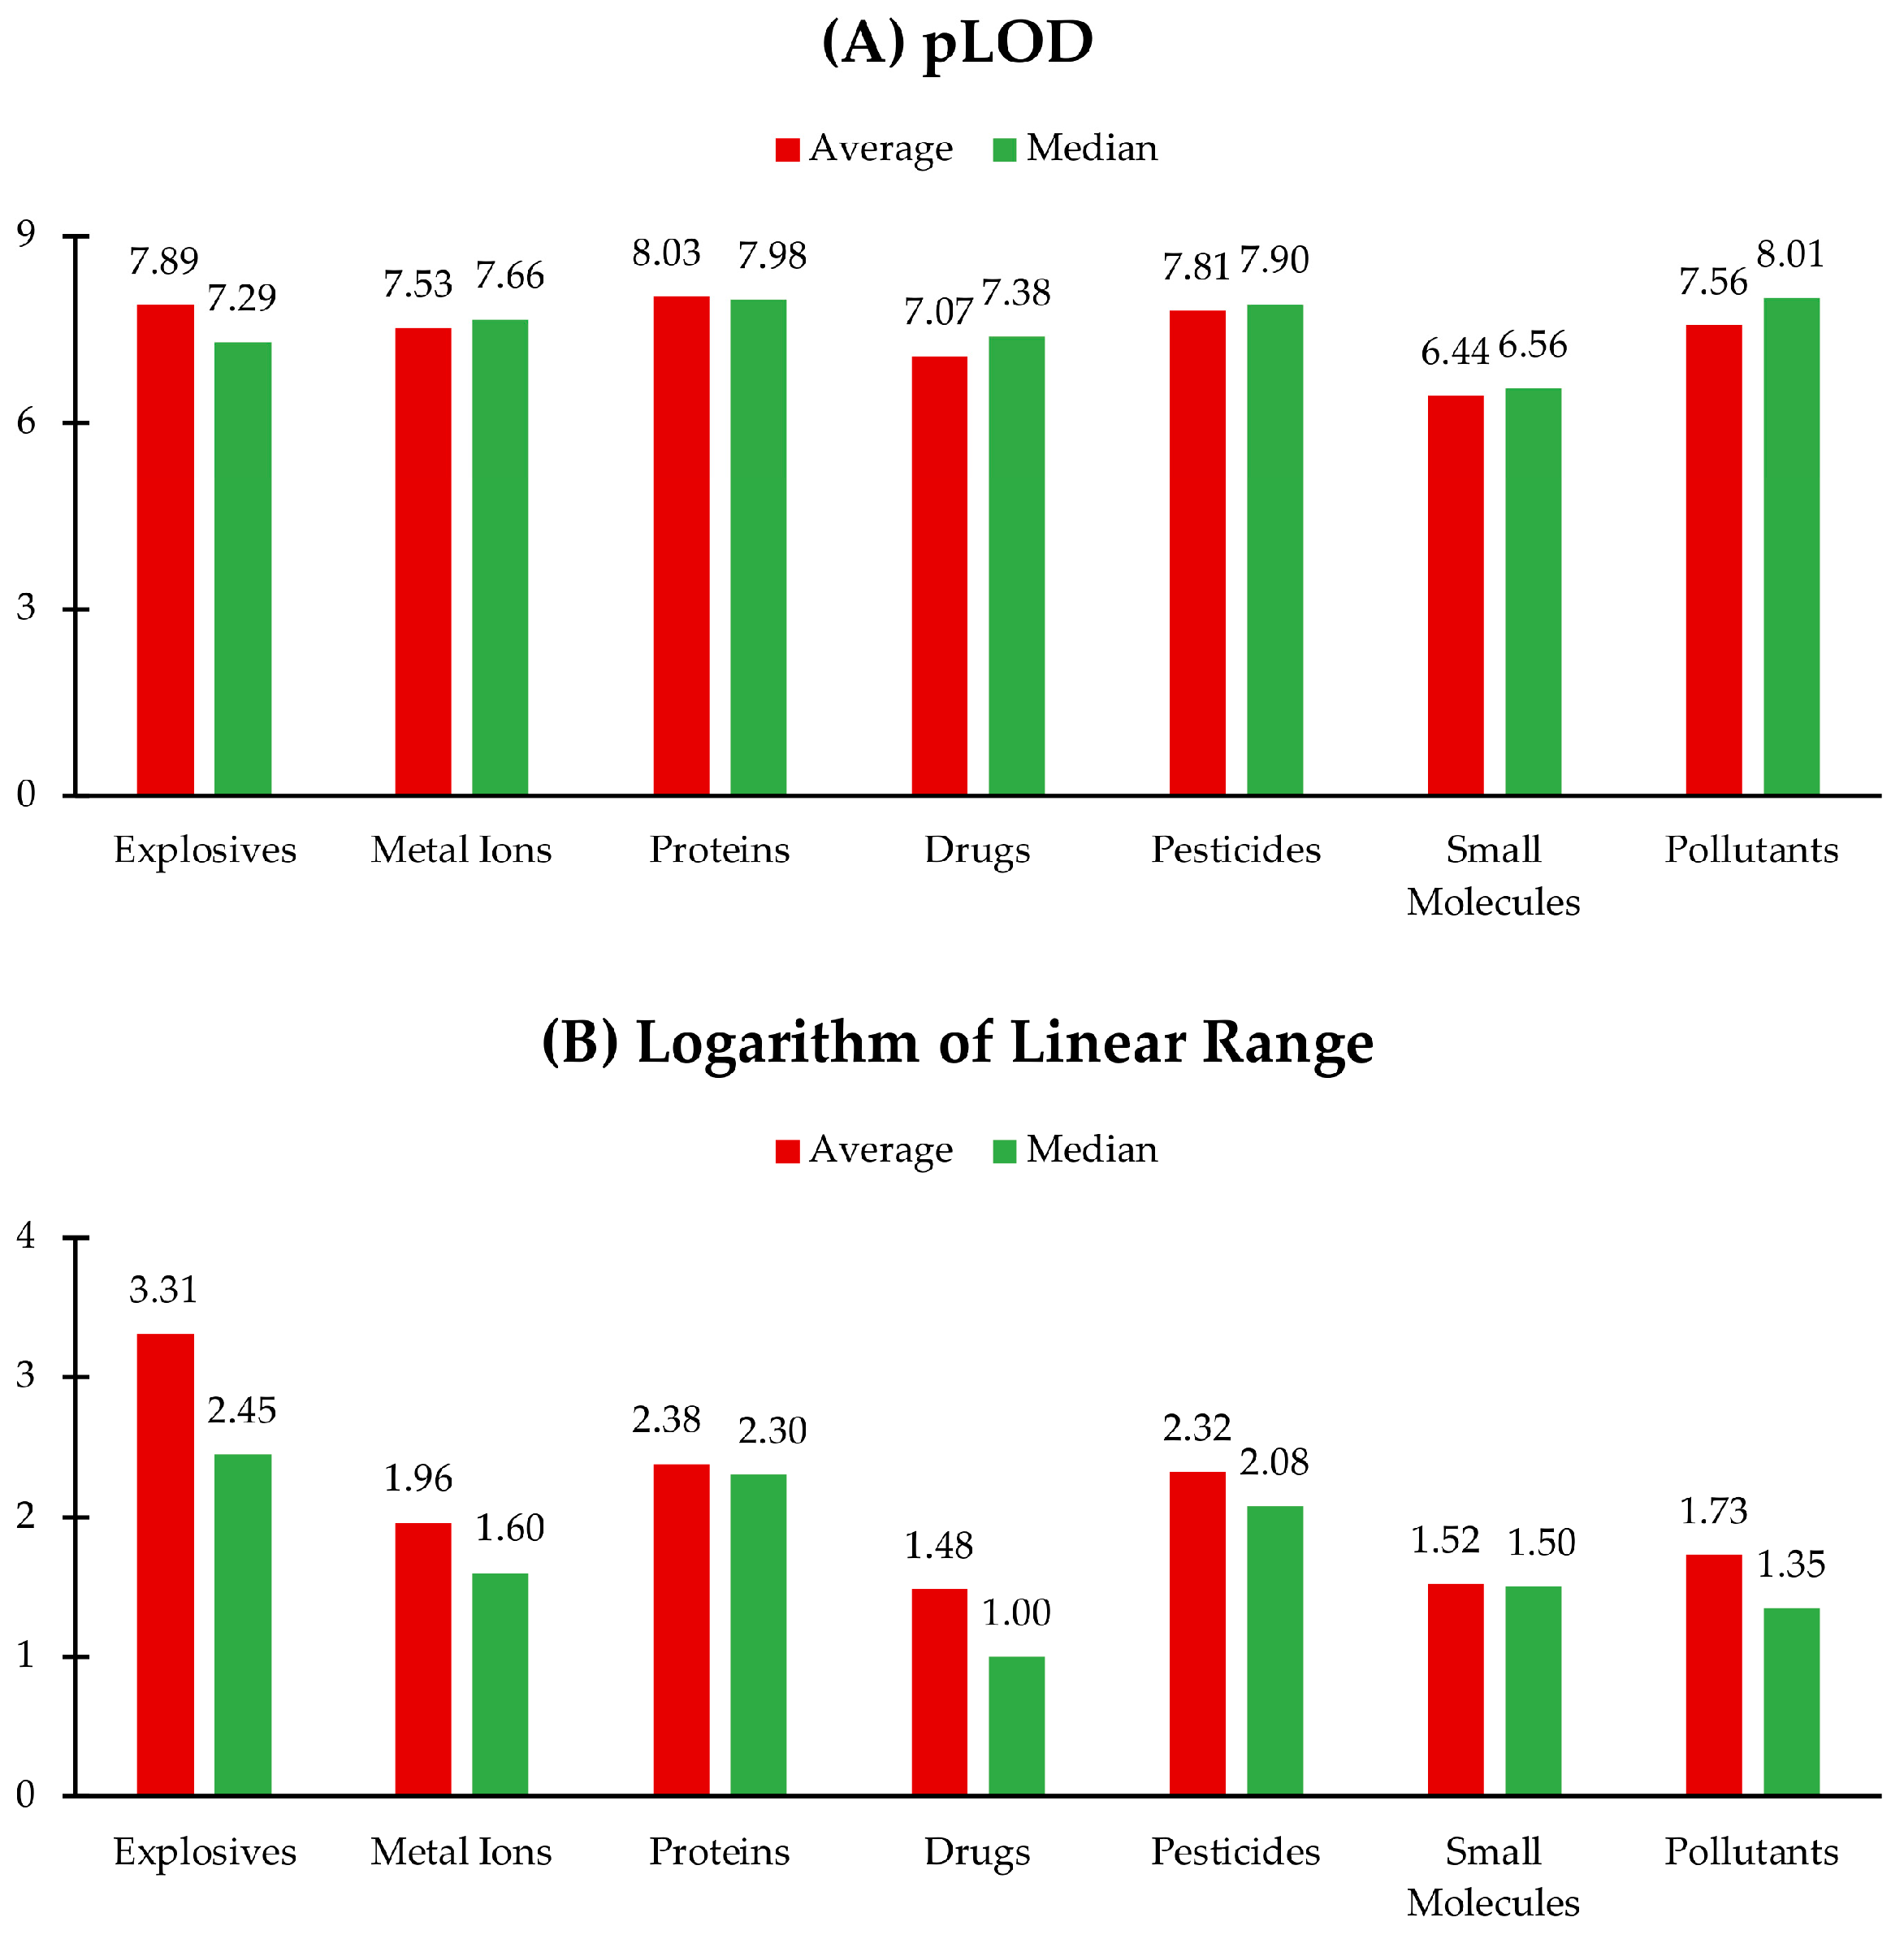
| Geometric mean (LOD) | 38.3 nM (54) |
| Median (LOD) | 23.0 nM (54) |
| Average (log(range)) | 2.14 (54) |
| Median (log(range)) | 1.70 (54) |
| Average (RSD) | 3.20% (36) |
3. Chemiluminescence of QDs: Applications in Sensing and Detection
| Year, Last Name | Nanostructure | Preparation (RS: Reflux Synthesis. TGA: Thioglycolic Acid. 3-MPA: 3-Mercaptopropionic Acid) | Analyte | LOD | Range | Size (nm) | Emission λ (nm) | RSD | R2 | Recovery |
|---|---|---|---|---|---|---|---|---|---|---|
| Han 2007, [95] | thiol-capped CdTe QDs | RS: CdCl2, TGA, NaHTe | hydrogen peroxide | 60 nM | (2.0 × 10⁻⁷–1.0 × 10⁻⁵) M | 3.32 | 620 | 4.80% | 0.999 | N/D |
| Wang 2012, [102] | SiO2-QD-Ab2 | Solution aging: CdCl2, methiopropamine, NaHTe | human IgG (HIgG) | 0.58 fM | (1.0 × 10⁻¹⁰–1.0 × 10⁻⁵) g/L | N/D | 705 | 4.60% | 0.996 | 83.8–120.6% |
| Fang 2012, [22] | CdSe QDs | RS: CdCl2, TGA, NaHSe | α-fetoprotein | 70 fM | (5.0 × 10⁻⁹–1.0 × 10⁻⁴) g/L | 2.5 | 575 (PL) | 1.50% | N/D | N/D |
| Liu 2014, [103] | CdSe QDs | RS; CdCl2, HMP, MPA, Na2SeO3, N2H4 | dopamine | 3.0 nM | (3.0 × 10⁻⁹–1.0 × 10⁻⁵) M | N/D | 541 | 4.30% | N/D | 104.5–106.9% |
| Dong 2014, [104] | CdSe@ZnS QDs | RS: CdCl2, TGA, NaHTe | thrombin | 1.4 fM | (1.0 × 10⁻¹⁴–1.0 × 10⁻¹⁰) M | 4.5 | 550 | 2.3% to 4.1% | 0.995 | 100.8–102.4% |
| Zhang 2015, [105] | CdS QDs | RS: CdCl2, methiopropamine, thioacetamide | microcystin-LR | 2.8 pM | (1.0 × 10⁻⁸–5.0 × 10⁻⁵) g/L | 3.5 | 646 (PL) | 3.36% | 0.999 | 97.7–101% |
| Wang 2015, [106] | CdTe/CdS coresmall/shellthick QDs | RS: CdCl2, methiopropamine, NaHTe | Cu2+ | 20 nM | (1.0 × 10⁻⁷–1.0 × 10⁻⁵) M | 4.8 | 710 | 3.3% | 0.998 | 93.3–104.6% |
| Dong 2017, [107] | CdTe QDs (QDs)-embedded mesoporous silica nanospheres | N/D | carcinoembryonic antigen | 1.7 fM | (1.0 × 10⁻⁹–8.0 × 10⁻⁵) g/L | 3.45 | 676 | 5.93% | 0.996 | 96.24–105.26% |
| Zhao 2017, [108] | MoS2-QDs | RS; MoS2, Pd-Au CHs | lipopolysaccharide | 0.07 fg/mL | (1.0 × 10⁻¹³–5.0 × 10⁻⁵) g/L | 4.2 | 625 | 1.53% | 0.998 | N/D |
| Wu 2017, [109] | Ag2S:Mn QDs | RS; 3-MPA, acetic acid, AgNO3, Na2S, Mn(Ac)2 | laminin | 3.6 fM | (1.0 × 10⁻⁸–1.0 × 10⁻⁴) g/L | 4 | 626 | N/D | 0.997 | 96.08–105.56% |
| Dong 2017, [110] | Si QDs | RS: aminopropyl trimethoxysilane, trisodium citrate | target DNA | 16 aM | (1.0 × 10⁻¹⁶–1.0 × 10⁻¹²) M | 6.72 | 475 | 3.50% | 0.994 | N/D |
| Yang 2018, [111] | CdTe QDs | RS; CdCl2, trisodium citrate dehydrate, Na2TeO3, MPA, NaBH4 | cardiac troponin-I antigen | 19 aM | (1.1 × 10⁻¹²–1.1 × 10⁻⁵) g/L | 5 | 650 | 0.92% | 0.999 | 93.6–109.7% |
| Hu 2018, [112] | CdSe QDs (CdSe QDs) | RS: sodium sulfite, selenium powder, CdCl2, 3-MPA, N2H4 | hydrogen peroxide | 0.50 µM | (5.0 × 10⁻⁷–5.0 × 10⁻⁴) M | 8 | 470, 610 | 4.90% | 0.972 | 87.6–104.3% |
| Zhang 2018, [113] | Black-P QDs | Sonication: black phosphorus powder, N-Methyl-2-pyrrolidone | dopamine | 22 pM | (1.0 × 10⁻¹⁰–5.0 × 10⁻⁸) M | 8.2 | 610 | 1.30% | 0.994 | 103 to 105% |
| Wang 2018, [114] | CdTe QDs | RS: NaHTe, CdCl2, TGA | clopyralid | 4.1 pM | (2.0 × 10⁻¹¹–3.5 × 10⁻⁸) M | 8 | N/D | 1.78–2.42% | 0.997 | 93.3–105.7% |
| Lei 2018, [115] | SnS2 QDs | Hydrothermal method: SnCl4, L-cysteine | anti-CMV pp65 | 0.33 fM | (1.0 × 10⁻¹⁵–1.0 × 10⁻⁷) M | 5 | 665 | N/D | 0.996 | 97.78–108.20% |
| Gao 2019, [116] | CdTe QDs | RS; CdCl2, Na2TeO3, 3-MPA, NaBH4 | ochratoxin A | 0.42 pM | (5.0 × 10⁻¹⁰–5.0 × 10⁻⁵) g/L | 3 | 585 | 2.90% | 0.999 | 96.1–100.7% |
| Liu 2019, [117] | Black-P QDs | Sonication: black phosphorus powder, N-Methyl-2-pyrrolidone | lysozyme | 2.0 fM | (1.0 × 10⁻¹⁰–1.0 × 10⁻⁷) g/L | 8.2 | N/D | 0.56% | 0.991 | 98–102% |
| Du 2020, [118] | MOF-5-wrapped CdS quantum dot | RS: CdCl2, Na2S, mercaptopropionic acid | cardiac Troponin I | 0.21 fM | (1.0 × 10⁻¹¹–1.0 × 10⁻⁶) g/L | 5.4 | 685475 | 9.25% | 0.993 | 98.0–104.7% |
| Chen 2020, [119] | CdTe QDs@NH2-MIL-88(Fe) | RS: CdCl2, Na2TeO3, trisodium citrate, NaBH4, 3-MPA | malathion | 0.91 fM | (1.0 × 10⁻¹²–1.0 × 10⁻⁶) g/L | 7.5 | 689 (1.8 eV) | 7.00% | 0.993 | 99.2–110% |
| Xu 2020, [120] | Multiwall, carbon-nanotube-enhanced, molecularly imprinted QDs | N/D | cyfluthrin | 0.11 nM | (2.0 × 10⁻⁷–1.0 × 10⁻³) g/L | N/D | N/D | 2.70% | 0.998 | 86.0–98.6% |
| Liu 2021, [121] | CdS QDs | RS: 3-MPA, CdCl2, NaOH, Na2S, ethanol. | 17β-estradiol | 0.11 pM | (1.0 × 10⁻¹¹–1.0 × 10⁻⁸) g/L | N/D | N/D | 1.1–2.5% | 0.99 | 98.9–118.4% |
| Feng 2021, [122] | MIL-53(Al)@CdS QDs | N/D | trichlorfon | 5.1 pM | (1.0 × 10⁻¹¹–1.0 × 10⁻⁴) M | <10 | 517 | 2.50% | 0.997 | 97–105% |
| Rasoulzadeh 2021, [123] | AgInS2 QDs | RS; AgNO3, InCl3, sodium citrate, TGA, thiourea, deionized water, ethanol. | glutathione | 0.28 nM | (1.0 × 10⁻⁹–5.0 × 10⁻⁶) M | 2 | 680 | 3.10% | 0.994 | 98–101% |
| Zhao 2021, [124] | Black-P-CdTe QDs | RS; CdCl2, BP-nanosheets, Na2TeO3, 3-MPA, NaBH4 | miRNA-126 | 29 aM | N/D | N/D | 709 | 1.19%, 2.85% | 0.998 | 98.8–104% |
| Yang 2021, [99] | Ir NRs@CdS QDs | RS: CdCl2, Na2S, L-cysteine | ethyl paraoxon | 1.7 pM | (5.0 × 10⁻¹²–5.0 × 10⁻⁸) M | N/D | 543 | 2.38%, 2.68% | 0.995 | 91.9–108.0% |
| Jia 2022, [125] | CdSe@CdS QDs | N/D | ochratoxin A | 2.2 nM | (1.0 × 10⁻⁶–1.0 × 10⁻⁴) g/L | 15 | 634 | 2.1–6.5% | 0.994 | 97.3–105.6% |
| Li 2022, [101] | CH3NH3PbBr3 QDs@SiO2 | Ligand-assisted reprecipitation method; PbBr2, CH3NH3Br, APTES, toluene | aflatoxin B1 | 27 fM | (1.0 × 10⁻¹¹–1.0 × 10⁻⁵) g/L | N/D | 566 | 1.2-2.8% | 0.997 | 101.7–106.7% |
| Liu 2022, [126] | luminol/MoS2 QDs@zeolitic imidazolate framework-8 | RS; MoS2, luminol, ZnNO3 solution | miRNA21 | 15 aM | N/D | 2 | N/D | N/D | 0.998 | N/D |
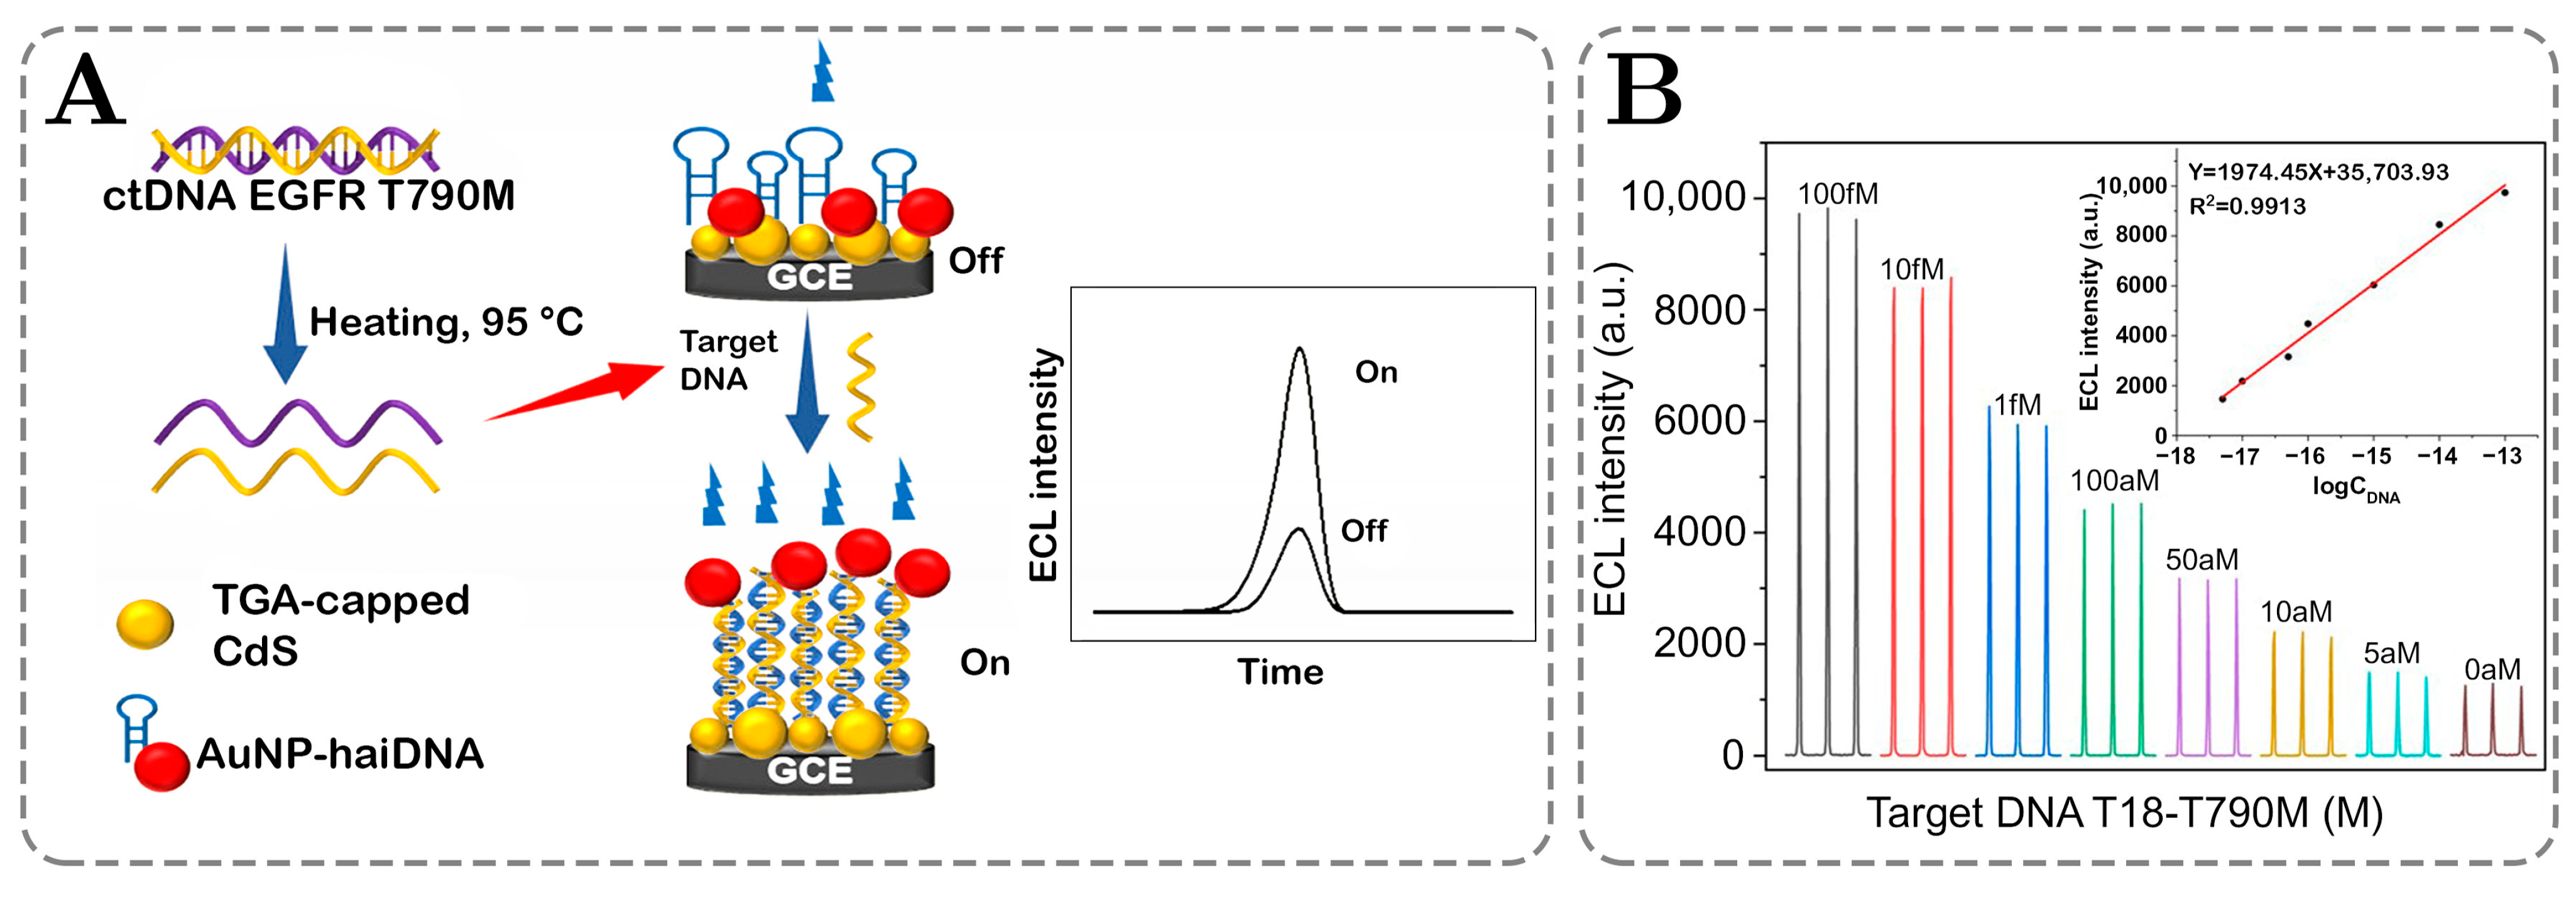
| Yang 2023, [127] | ECL-RET sensor with TGA-capped CdS QDs | RS: CdCl2, TGA, Na2S | EGFR T790M ctDNA | 3.4 aM | (1.0 × 10⁻¹⁷–1.0 × 10⁻¹³) M | 5.7 | 497 (FL) | 2.6% | 0.991 | N/D |
| Yang 2023, [127] | ECL-RET sensor with TGA-capped CdS QDs | RS: CdCl2, TGA, Na2S | EGFR T790M ctDNA | 8.1 aM | (5.0 × 10⁻¹⁷–1.0 × 10⁻¹³) M | 5.7 | 497 (FL) | 2.6% | 0.994 | N/D |
| Li 2023, [100] | Mo2TiC2 QDs | Acid etching, alkaline treatment, and microwave-assisted synthesis; Mo2TiAlC2 powder, NH4HF2, TMAOH, ultrapure water. | miRNA-27a-3p | 1.0 fM | (1.0 × 10⁻¹⁵–1.0 × 10⁻⁸) M | 2.7 | 594 | 2.00–2.59% | 0.992 | 89.1–104.2% |
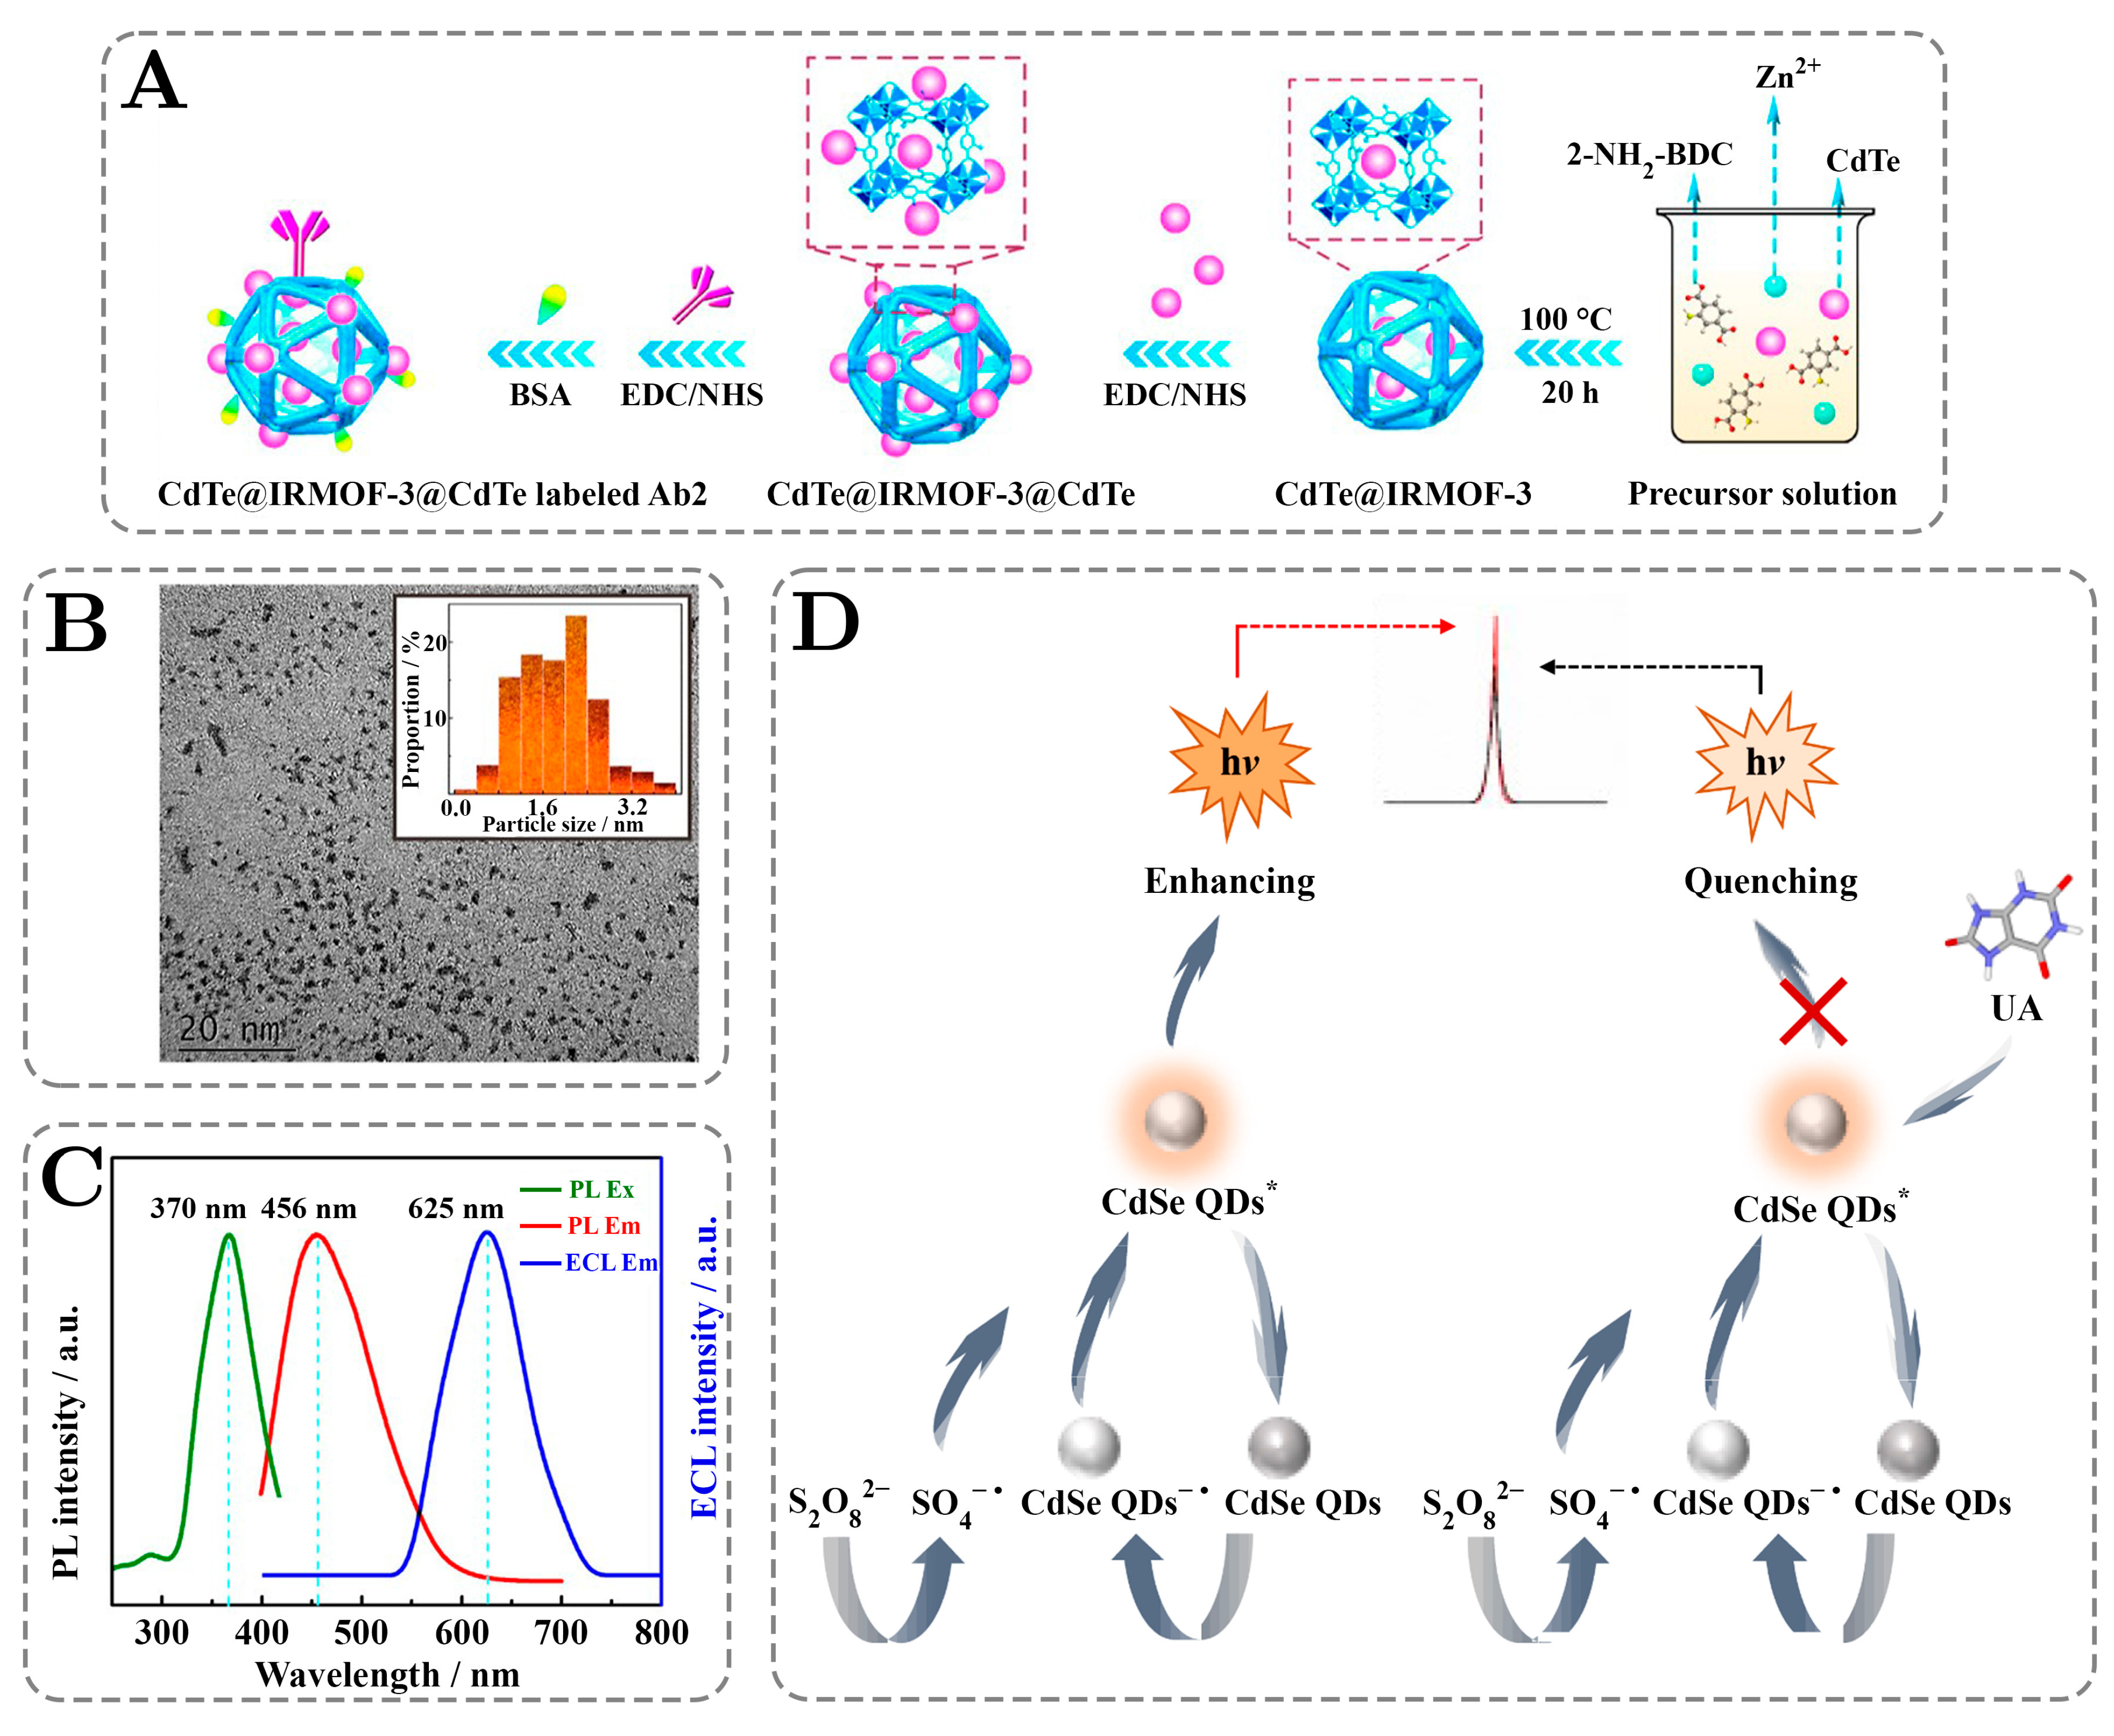
| Liu 2024, [128] | CdSe@ZnS/MXene@NaAsc | N/D | uric acid | 18 pM | (1.0 × 10⁻¹⁰–1.0 × 10⁻⁴) M | 4 | N/D | 2.81% | 0.987 | 88.40–94.65% |
| Gong 2025, [129] | AgInZnS QDs | RS: methiopropamine, AgNO3, In(Ac)3, Zn(Ac)2 | carcinoembryonic antigen | 16 fM | (5.0 × 10⁻¹⁴–1.0 × 10⁻⁸) M | N/D | 620 | 1.13% | 0.994 | 95.5–103.3% |
4. Phosphorescence of QDs: Applications in Sensing and Detection
| Year, Family Name | Nanostructure | Preparation | Analyte | LOD | Range | Diameter (nm) | RSD (%) | R2 | Excitation Wavelength (nm) | Emission Wavelength (nm) | Binding Molecule |
|---|---|---|---|---|---|---|---|---|---|---|---|
| Wu 2010, [132] | Mn-doped ZnS QDs | CS | Glucose | 3.0 µM | 10 µM–1 mM | 3 | 3.2 | 0.9855 | 290 | 595 | 1-ethyl-3-(3-dimethylaminopropy)carbodiimide (EDC)/N-hydroxysuccinimide (NHS) |
| Wang 2010, [141] | Mn-doped ZnS QDs | CS | ascorbic acid | 9.0 nM | 0.05–0.8 µM | 4.2 | 4.8 | 0.9913 | 337 | 595 | Sodium Tripolyphosphate |
| Wang 2011, [135] | ZnS QDs | Combination of colloidal and template-assisted synthesis | 2,4,6-trinitrotoluene | 50 nM | 0.05–1.8 µM | 5 | 3.5 | 0.9902 | 316 | 580 | 3-Aminopropyltriethoxysilane-functionalized manganese |
| Yu 2011, [142] | Mn-doped ZnS QDs | CS | DNA | 0.10 µM | 0.08–12 mg L−1 | 3.5 | 3.7 | N/D | 316 | 590 | methyl violet |
| Zhang 2013, [143] | Mn-doped ZnS QDs | N/D | DNA | 27 pM | 0 to 45 nM | N/D | 3.73 | 0.9991 | N/D | 581 | N/D |
| Wu 2013, [138] | Mn-doped ZnS QDs | Combination of colloidal and template-assisted synthesis | trypsin | 40 nM | 0.1–1.2 μM | 3.8 | N/D | 0.9917 | 280 | 590 | bovine serum albumin (BSA) |
| Dan 2013, [144] | Mn-doped ZnS QDs | N/D | domoic acid (DA) | 67 nM | 0.25−3.5 μM | N/D | 0.65 | 0.99 | 300 | 590 | Polyethyleneimine |
| Tan 2013, [145] | Mn-doped ZnS QDs | CS | bovine hemoglobin | 38 nM | 1.0 × 10⁻⁷–5.0 × 10⁻⁶ mol L−1 | 7 | 1.8 | 0.998 | 340 | 585 | 3-Mercaptopropyltriethoxysilane (MPTS) |
| Wang 2013, [146] | Mn-doped ZnS QDs | CS | catechol | 53 nM | 0.5–5 μM | N/D | 3.2 | 0.9962 | 316 | 595 | Sodium Tripolyphosphate |
| Bian 2013, [147] | Mn-doped ZnS QDs | CS | L-ascorbic acid | 0.72 µM | 2.5–37.5 µM | 9 | 1.4 | 0.9983 | 315 | 583 | N-acetyl-L-cysteine |
| 14 µM | 2.5–47.5 μM | 9 | 1.8 | 0.995 | 306 | 580 | L-cysteine | ||||
| Bian 2014, [148] | Mn-doped ZnS QDs | CS | Co2+ | 60 nM | 1.25 × 10⁻⁶–3.25 × 10⁻⁵ M | 10 | 2.3 | 0.9989 | 315 | 583 | N-acetyl-L-cysteine |
| Zhu 2014, [149] | Mn-doped ZnS QDs | Microwave-assisted synthesis | indapamide | 0.89 µM | 1.5–80 µM | 4.2 | 3.4 | 0.995 | 310 | 585 | MPA |
| Gong 2014, [150] | Mn-doped ZnS QDs | CS | clenbuterol | 12 nM | 5–1000 ng·mL−1 | 3.5 | 2.9 | 0.9985 | 295 | 590 | MPA |
| Zhang 2015, [151] | Mn-doped ZnS QDs | CS | protamine | 33 nM | 0.2–3.0 µg mL−1 | 3.5 | 2.76 | 295 | 590 | MPA | |
| Bi 2015, [152] | Mn-doped ZnS QDs | CS | DNA | 0.14 µM | 0.2–20 mg L−1 | 2.5 | 1.7 | 0.998 | 295 | 590 | MPA |
| Gong 2015, [153] | Mn-doped ZnS QDs | CS | phosphopeptides | N/D | 1.6–2800 ng mL−1 | 3.5 | 2.5 | 0.9969 | 295 | 590 | MPA |
| Zhang 2015, [154] | Mn-doped ZnS QDs | CS | quercetin | 0.16 µM | 0.1–6.0 mg mL−1 | 3.5 | 4.6 | 0.996 | 295 | 590 | MPA |
| Ertas 2015, [155] | Mn-doped ZnS QDs | CS | double stranded DNA/ idarubicin | 0.48 µM | 2.0–20.0 μM | 3.5 | 4.35 | 0.9943 | 290 | 590 | L-cysteine |
| Bian 2015, [156] | ZnS QDs | CS | histidine | 0.74 µM | 1.25–30 µM | 10 | 0.65 | 0.997 | 315 | 589 | Co2+-adsorbed N-acetylL-cysteine (NAC) |
| Zhang 2015, [157] | Mn-doped ZnS QDs | CS | glucose | 7.0 µM | 20–800 µM | 2.7 | 0.5 | 0.996 | 310 | 597 | N/D |
| Chang 2016, [133] | Mn-doped ZnS QDs | CS | human serum albumin | 10 nM | 0.02–1.0 µM | N/D | N/D | 0.9799 | 301 | 602 | Rhodamine B (Rh B) |
| Chen 2016, [158] | Mn-doped ZnS QDs | CS | Pb2+ ions | 2.2 nM | 1-100 μg L−1 | 3 | 0.54 | 0.9962 | 280 | 590 | glutathione |
| Gong 2016, [159] | Mn-doped ZnS QDs | CS | DNA | 46 pM | 15 μg L−1–40 mg L−1 | 3 | 1.9 | 0.998 | 295 | 590 | MPA |
| Liu 2017, [160] | Mn-doped ZnS QDs | CS | trypsin | 1.8 nM | 0.88–15.6 µg mL−1 | N/D | 5 | 0.993 | 316 | 598 | Cytochrome c (Cyt c) |
| Lv 2017, [161] | Mn-doped ZnS QDs | CS | miRNA-21 | 1.6 nM | 8–80 nM | 3.5 | 3.4 | 0.989 | 295 | 590 | ROX-DNA |
| Zhang 2017, [162] | Mn-doped ZnS QDs | N/D | alkaline phosphatase | N/D | 0.001–0.1 U/L | N/D | N/D | 0.999 | 312 | 600 | PNPP (p-nitrophenylphosphate) |
| Zhang 2017, [163] | Mn-doped ZnS QDs | Hydrothermal/CS | thiram | 25 nM | 50 nM–2.5 μM | 5 | N/D | 0.9975 | 312 | 590 | mercaptosuccinic acid (MSA) |
| Pacheco 2017, [164] | Mn-doped ZnS QDs | CS | warfarin | 4.7 µM | 1.07 × 10⁻⁵ M–4.50 × 10⁻⁵ M | 2.7 | N/D | 0.997 | 276 | 584 | l-cysteine (L-cys) |
| Zhang 2017, [165] | Mn-doped ZnS QDs | CS | patulin | 0.32 µM | 0.43-6.50 µmol L−1 | 10.25 | 4.2 | 0.9945 | 324 | 585 | 3-Mercaptopropyltriethoxysilane (MPTS) |
| Deng 2017, [166] | Mn-doped ZnS QDs | CS | permanganate anions (MnO4−) | 0.24 µM | 0.5–100 μM | 7.75 | 2.95 | 0.9981 | 315 | 585 | L-cysteine |
| Lv 2017, [167] | Mn-doped ZnS QDs | CS | transgenic 35S promoter DNA | 4.0 nM | 12–300 nM | 5 | 7.9 | 0.997 | 295 | 590 | DNA |
| Li 2018, [134] | Mn-doped ZnS QDs | CS | alkaline phosphatase | 0.15–18 U L−1 | 4 | 4.2 | 0.994 | 295 | 590 | Eu3+ | |
| Li 2018, [168] | Mn-doped ZnS QDs | CS | Micrococcal nuclease base | 2 × 10⁻³–8.0 × 10⁻² U mL−1 | 3.5 | 5.2 | 0.993 | 295 | 595 | DNA-ROX | |
| Wei 2018, [169] | Mn-doped ZnS QDs | CS | 2,4,6-trichlorophenol | 35 nM | 0.1–30 μmol L−1 | N/D | 4 | 0.99 | 320 | 594 | magnetite (Fe3O4) |
| Liu 2018, [170] | Mn-doped ZnS QDs | CS | adriamycin | 0.45 µM | 0.5–64.0 µM | 4.5 | N/D | 0.9932 | 316 | 585 | poly(diallyldimethylammonium chloride) (PDDA) |
| Li 2018, [134] | Mn-doped ZnS QDs | CS | hyaluronic acid (HA) | 79 fM | 0.08–2.8 μg mL−1 | 4 | 2.1 | 0.995 | 295 | 590 | MPA |
| Zou 2018, [171] | Mn-doped ZnS QDs | CS | copper(II) | 6.0 nM | 0.01–12 μM | 3.6 | 3.2 | 0.994 | 316 | 590 | alginate |
| Qin 2018, [172] | Mn-doped ZnS QDs | CS | resveratrol | 10 nM | 0.03–14 µM | 3.5 | 2.7 | N/D | 295 | 595 | MPA |
| Luo 2019, [173] | Mn-doped ZnS QDs | CS | 4-nitrophenol | 60 nM | 0.1–100 μM | 4 | 4.6 | 0.998 | 295 | 590 | N/D |
| Chen 2019, [174] | Mn-doped ZnS QDs | CS | cephalexin | 2.3 nM | 2.5–50 μg·L−1 | 5 | 0.9985 | 295 | 590 | thioglycolic acid (TGA) | |
| Zhao 2019, [175] | Mn-doped ZnS QDs | CS | picric acid | 6.1 nM | 2.0–180 ng mL−1 | 5.8 | 2.2 | 0.9985 | 316 | 600 | Melamine (MA) |
| Miao 2019, [137] | Mn-doped ZnS QDs | CS | melamine | 1.6 µM | 0.005–6 mM | 4 | 2.6 | 0.997 | 297 | 590 | ssDNA |
| Liu 2020, [176] | Mn-doped ZnS QDs | CS | tetracyclines | 8.6 nM | 50–1.5 × 10⁵ nM | 3.8 | 6 | 0.995 | 289 | 583 | L-Cysteine |
| Jayasinghe 2020, [177] | Mn-doped ZnS QDs | CS | aflatoxins | 11 pM | 2–20 µg L−1 | 2.3 | 20 | 0.9947 | 290 | 594 | Polyethylene glycol (PEG) |
| Jinadasa 2020, [178] | Mn-doped ZnS QDs | CS | As(III), As(V) | 0.12 nM | 0–20 μg L−1 | N/D | 10 | N/D | 289 | 595 | (3-aminopropyl) triethoxysilane and an As(III) ionic |
| Lv 2020, [179] | Mn-doped ZnS QDs | CS | phenol | 2.1 µM | 5.0 to 55 μmol L−1 | 5.5 | 3.7 | 0.9984 | 330 | 600 | 3-mercaptopropyltriethoxysilane (MPTS) |
| Liu 2021, [180] | Mn-doped ZnS QDs | CS | thyroxine | 2.0 nM | 4.85 nmol/L–1.59 μmol/L | 3.5 | N/D | 0.999 | 295 | 590 | MPA |
| carbamazepine | 3.4 nM | 7.9 nmol/L–1.555 μmol/L | 3.5 | N/D | 0.995 | 295 | 590 | ||||
| Qin 2021, [181] | Mn-doped ZnS QDs | CS | alkaline phosphatase | 0.2−10 U/L | 3.65 | N/D | 0.993 | 310 | 680 | pyrophosphate | |
| Chen 2021, [182] | Mn-doped ZnS QDs | CS with sol-gel synthesis | norfloxacin | 2.5 nM | 1–90 μg L−1 | 5.5 | 7 | 0.9993 | 300 | 590 | magnetite (Fe3O4) |
| Fan 2021, [139] | Mn-doped ZnS QDs | CS | chlorpyrifos | 0.89 µM | 0–80 μM | N/D | 1 | 0.99 | 275 | 600 | N/D |
| Kong 2023, [183] | Mn–ZnS QDs@g-C3N4 | N/D | 2,4,6-trinitrotoluene | 0.56 µM | 0–12 μM | 3.6 | 6 | 0.997 | 318 | 582 | mercaptoethylamine (MEA) |
| Yang 2025, [184] | Mn-doped ZnS QDs | CS | lead (II) | 2.6 nM | 5 × 10⁻⁶–100 mM | 2.12 | 0.9979 | 360 | 596 | 1-thioglycerol | |
| Summary of Average/Median Values in Table 4 | |||||||||||
| Median LOD (M) | 3.8 × 10⁻⁸ | Median Diameter (nm) | 3.7 | Median RSD (%) | 3.4 | Median R2 | 0.996 | Median Excitation wavelength (nm) | 300 | Median Emission wavelength (nm) | 590 |
| Geometric Average LOD (M) | 2.6 × 10⁻⁸ | Average Diameter (nm) | 4.6 | Average RSD (%) | 3.9 | Average R2 | 0.996 | Average Excitation wavelength (nm) | 304 | Average Emission wavelength (nm) | 590 |
5. Quantitative Analysis of Relationships Between Sensitivity and Other QD Parameters in QD-Based Sensing
6. Perspectives of Improvements in Sensing
7. Application of Machine Learning in QD-Based Luminescent Sensors
8. Conclusions
Author Contributions
Funding
Conflicts of Interest
References
- Zhang, Y.; Liu, B.; Liu, Z.; Li, J. Research progress in the synthesis and biological application of quantum dots. New J. Chem. 2022, 46, 20515–20539. [Google Scholar] [CrossRef]
- Brichkin, S.B.; Razumov, V.F. Colloidal quantum dots: Synthesis, properties and applications. Russ. Chem. Rev. 2016, 85, 1297. [Google Scholar] [CrossRef]
- Agarwal, K.; Rai, H.; Mondal, S. Quantum dots: An overview of synthesis, properties, and applications. Mater. Res. Express 2023, 10, 062001. [Google Scholar] [CrossRef]
- Valizadeh, A.; Mikaeili, H.; Samiei, M.; Farkhani, S.M.; Zarghami, N.; Kouhi, M.; Akbarzadeh, A.; Davaran, S. Quantum dots: Synthesis, bioapplications, and toxicity. Nanoscale Res. Lett. 2012, 7, 480. [Google Scholar] [CrossRef]
- Das, A.; Snee, P.T. Synthetic Developments of Nontoxic Quantum Dots. ChemPhysChem 2016, 17, 598–617. [Google Scholar] [CrossRef]
- Bawendi, M.G.; Wilson, W.L.; Rothberg, L.; Carroll, P.J.; Jedju, T.M.; Steigerwald, M.L.; Brus, L.E. Electronic structure and photoexcited-carrier dynamics in nanometer-size CdSe clusters. Phys. Rev. Lett. 1990, 65, 1623–1626. [Google Scholar] [CrossRef]
- Klimov, V.I. Spectral and Dynamical Properties of Multiexcitons in Semiconductor Nanocrystals. Annu. Rev. Phys. Chem. 2007, 58, 635–673. [Google Scholar] [CrossRef]
- Steckel, J.S.; Snee, P.; Coe-Sullivan, S.; Zimmer, J.P.; Halpert, J.E.; Anikeeva, P.; Kim, L.-A.; Bulovic, V.; Bawendi, M.G. Color-Saturated Green-Emitting QD-LEDs. Angew. Chem. Int. Ed. 2006, 45, 5796–5799. [Google Scholar] [CrossRef] [PubMed]
- Jang, E.; Jun, S.; Pu, L. High quality CdSeS nanocrystals synthesized by facile single injection process and their electroluminescence. Chem. Commun. 2003, 24, 2964–2965. [Google Scholar] [CrossRef]
- Rempel, A.A.; Ovchinnikov, O.V.; Weinstein, I.A.; Rempel, S.V.; Kuznetsova, Y.V.; Naumov, A.V.; Smirnov, M.S.; Eremchev, I.Y.; Vokhmintsev, A.S.; Savchenko, S.S. Quantum dots: Modern methods of synthesis and optical properties. Uspekhi Khimii 2024, 93, 1–62. [Google Scholar] [CrossRef]
- Ekimov, A.I.; Onushchenko, A.A. Quantum size effect in three-dimensional microscopic semiconductor crystals. Lett. JETP 1981, 34, 363. [Google Scholar] [CrossRef]
- Reed, M.A.; Bate, R.T.; Bradshaw, K.; Duncan, W.M.; Frensley, W.R.; Lee, J.W.; Shih, H.D. Spatial quantization in GaAs–AlGaAs multiple quantum dots. J. Vac. Sci. Technol. B Microelectron. Process. Phenom. 1986, 4, 358–360. [Google Scholar] [CrossRef]
- Ekimov, A.I.; Onushchenko, A.A. Size quantization of the electron energy spectrum in a microscopic semiconductor crystal. Lett. JETP 1984, 40, 337. [Google Scholar] [CrossRef]
- Ekimov, A.I.; Efros, A.L.; Onushchenko, A.A. Quantum size effect in semiconductor microcrystals. Solid State Commun. 1985, 56, 921–924. [Google Scholar] [CrossRef]
- Vandyshev, Y.V.; Dneprovskiǐ, V.S.; Ekimov, A.I.; Okorokov, D.K.; Popova, L.B.; Efros, A.L. Nonlinear optical properties of semiconductor microcrystals. Sov. J. Exp. Theor. Phys. Lett. 1987, 46, 495. [Google Scholar] [CrossRef]
- Ekimov, A.I.; Efros, A.L.; Ivanov, M.G.; Onushchenko, A.A.; Shumilov, S.K. Donor-like exciton in zero-dimension semiconductor structures. Solid State Commun. 1989, 69, 565–568. [Google Scholar] [CrossRef]
- Ekimov, A.I.; Efros, A.L.; Shubina, T.V.; Skvortsov, A.P. Quantum-size stark effect in semiconductor microcrystals. J. Lumin. 1990, 46, 97–100. [Google Scholar] [CrossRef]
- Ekimov, A.I.; Hache, F.; Schanne-Klein, M.C.; Ricard, D.; Flytzanis, C.; Kudryavtsev, I.A.; Yazeva, T.V.; Rodina, A.V.; Efros, A.L. Absorption and intensity-dependent photoluminescence measurements on CdSe quantum dots: Assignment of the first electronic transitions. JOSA B 1993, 10, 100–107. [Google Scholar] [CrossRef]
- Itoh, T.; Nishijima, M.; Ekimov, A.I.; Gourdon, C.; Efros, A.L.; Rosen, M. Polaron and exciton-phonon complexes in CuCl nanocrystals. Phys. Rev. Lett. 1995, 74, 1645. [Google Scholar] [CrossRef]
- Ekimov, A. Growth and optical properties of semiconductor nanocrystals in a glass matrix. J. Lumin. 1996, 70, 1–20. [Google Scholar] [CrossRef]
- Liu, B.; Altintas, Y.; Wang, L.; Shendre, S.; Sharma, M.; Sun, H.; Mutlugun, E.; Demir, H.V. Record High External Quantum Efficiency of 19.2% Achieved in Light-Emitting Diodes of Colloidal Quantum Wells Enabled by Hot-Injection Shell Growth. Adv. Mater. 2020, 32, 1905824. [Google Scholar] [CrossRef] [PubMed]
- Fang, X.; Han, M.; Lu, G.; Tu, W.; Dai, Z. Electrochemiluminescence of CdSe quantum dots for highly sensitive competitive immunosensing. Sens. Actuators B Chem. 2012, 168, 271–276. [Google Scholar] [CrossRef]
- Chen, B.; Liu, J.; Yang, T.; Chen, L.; Hou, J.; Feng, C.; Huang, C.Z. Development of a portable device for Ag+ sensing using CdTe QDs as fluorescence probe via an electron transfer process. Talanta 2019, 191, 357–363. [Google Scholar] [CrossRef] [PubMed]
- Wang, X.; Liu, Z.; Gao, P.; Li, Y.; Qu, X. Surface functionalized quantum dots as biosensor for highly selective and sensitive detection of ppb level of propafenone. Spectrochim. Acta Part A Mol. Biomol. Spectrosc. 2020, 227, 117709. [Google Scholar] [CrossRef]
- Yang, W.; Fidelis, T.T.; Sun, W.-H. Machine Learning in Catalysis, From Proposal to Practicing. ACS Omega 2020, 5, 83–88. [Google Scholar] [CrossRef]
- Mater, A.C.; Coote, M.L. Deep Learning in Chemistry. J. Chem. Inf. Model. 2019, 59, 2545–2559. [Google Scholar] [CrossRef]
- Krishnadasan, S.; Brown, R.J.C.; deMello, A.J.; deMello, J.C. Intelligent routes to the controlled synthesis of nanoparticles. Lab A Chip 2007, 7, 1434–1441. [Google Scholar] [CrossRef]
- Zhang, Y.; Ren, D.; Shi, Y.; Yuan, R.; Ye, H.; Yin, X.-B.; Chi, H. A smartphone sensing fluorescent detection of mercury ion based on silicon quantum dots in environment water. Spectrochim. Acta Part A Mol. Biomol. Spectrosc. 2025, 325, 125135. [Google Scholar] [CrossRef]
- Ma, Y.; Mei, H.; Li, Y.; Zhou, P.; Mao, G.; Wang, H.; Wang, X. A novel raiometric fluorescence probe based on silicon quantum dots and copper nanoclusters for visual assay of l-cysteine in milks. Food Chem. 2022, 379, 132155. [Google Scholar] [CrossRef]
- Wei, N.; Liang, Z.-Y.; Fang, W.-L.; Guo, X.-F.; Wang, H.; Zhang, H.-X. Facile synthesis of non-modified yellow emission silicon quantum dots and their visualization of hydrogen sulfide in living cells and onion tissues. J. Colloid Interface Sci. 2023, 642, 145–153. [Google Scholar] [CrossRef]
- Zhao, D.; Liu, H.; Zhang, Z.; Xiao, X.; Li, J. Preparation of green luminescent silicon quantum dots by synergistic method for VB12 detection and antimicrobial property research application. Colloids Surf. B Biointerfaces 2022, 220, 112868. [Google Scholar] [CrossRef] [PubMed]
- Wei, N.; Wei, M.-X.; Huang, B.-H.; Guo, X.-F.; Wang, H. One-pot facile synthesis of green-emitting fluorescent silicon quantum dots for the highly selective and sensitive detection of nitrite in food samples. Dye. Pigment. 2021, 184, 108848. [Google Scholar] [CrossRef]
- Liu, Y.; Wang, Q.; Guo, S.; Jia, P.; Shui, Y.; Yao, S.; Huang, C.; Zhang, M.; Wang, L. Highly selective and sensitive fluorescence detection of hydroquinone using novel silicon quantum dots. Sens. Actuators B Chem. 2018, 275, 415–421. [Google Scholar] [CrossRef]
- Makwana, K.P.; Deshpande, M.P.; Malek, N.I.; Park, T.J.; Kailasa, S.K. LaSrO3 perovskite quantum dots as a fluorescent probe for the detection of bilirubin and epinephrine via FRET and IFE mechanisms. J. Photochem. Photobiol. A Chem. 2025, 461, 116172. [Google Scholar] [CrossRef]
- Cernea, M.; Monnereau, O.; Llewellyn, P.; Tortet, L.; Galassi, C. Sol–gel synthesis and characterization of Ce doped-BaTiO3. J. Eur. Ceram. Soc. 2006, 26, 3241–3246. [Google Scholar] [CrossRef]
- Zhang, Q.; Jiang, M.; Yan, G.; Feng, Y.; Zhang, B. Surface ligand engineering involving fluorophenethyl ammonium for stable and strong emission CsPbBr3 quantum dots and high-performance QLEDs. J. Mater. Chem. C 2022, 10, 5849–5855. [Google Scholar] [CrossRef]
- Jiang, W.; Kim, B.; Chae, H. Phenethylamine ligand engineering of red InP quantum dots for improving the efficiency of quantum dot light-emitting diodes. Opt. Lett. 2020, 45, 5800–5803. [Google Scholar] [CrossRef]
- Chen, G.; Zhu, X.; Xing, C.; Wang, Y.; Xu, X.; Bao, J.; Huang, J.; Zhao, Y.; Wang, X.; Zhou, X.; et al. Machine Learning-Assisted Microfluidic Synthesis of Perovskite Quantum Dots. Adv. Photonics Res. 2023, 4, 2200230. [Google Scholar] [CrossRef]
- Abdel-Latif, K.; Epps, R.W.; Bateni, F.; Han, S.; Reyes, K.G.; Abolhasani, M. Self-Driven Multistep Quantum Dot Synthesis Enabled by Autonomous Robotic Experimentation in Flow. Adv. Intell. Syst. 2021, 3, 2000245. [Google Scholar] [CrossRef]
- Atabaev, T.S. Doped Carbon Dots for Sensing and Bioimaging Applications: A Minireview. Nanomaterials 2018, 8, 342. [Google Scholar] [CrossRef]
- Ding, R.; Chen, Y.; Wang, Q.; Wu, Z.; Zhang, X.; Li, B.; Lin, L. Recent advances in quantum dots-based biosensors for antibiotics detection. J. Pharm. Anal. 2022, 12, 355–364. [Google Scholar] [CrossRef]
- Sabzehmeidani, M.M.; Kazemzad, M. Quantum dots based sensitive nanosensors for detection of antibiotics in natural products: A review. Sci. Total Environ. 2022, 810, 151997. [Google Scholar] [CrossRef]
- Mehta, J.; Dilbaghi, N.; Kumar Singhal, N.; Marrazza, G.; Kaushik, A.; Kumar, S. Electrochemiluminescent quantum dots as emerging next generation sensing platforms. Chem. Eng. J. 2023, 477, 146958. [Google Scholar] [CrossRef]
- Sargazi, S.; Fatima, I.; Hassan Kiani, M.; Mohammadzadeh, V.; Arshad, R.; Bilal, M.; Rahdar, A.; Díez-Pascual, A.M.; Behzadmehr, R. Fluorescent-based nanosensors for selective detection of a wide range of biological macromolecules: A comprehensive review. Int. J. Biol. Macromol. 2022, 206, 115–147. [Google Scholar] [CrossRef] [PubMed]
- Wang, Z.; Yao, B.; Xiao, Y.; Tian, X.; Wang, Y. Fluorescent Quantum Dots and Its Composites for Highly Sensitive Detection of Heavy Metal Ions and Pesticide Residues: A Review. Chemosensors 2023, 11, 405. [Google Scholar] [CrossRef]
- Sudewi, S.; Sai Sashank, P.V.; Kamaraj, R.; Zulfajri, M.; Huang, G.G. Understanding Antibiotic Detection with Fluorescence Quantum Dots: A Review. J. Fluoresc. 2024, 35, 2527–2551. [Google Scholar] [CrossRef] [PubMed]
- Zhong, L.; Zhang, L.; Li, Y.; Liang, X.; Kong, L.; Shen, X.; Wu, T. Assessment of the Toxicity of Quantum Dots through Biliometric Analysis. Int. J. Environ. Res. Public Health 2021, 18, 5768. [Google Scholar] [CrossRef]
- Bian, F.; Sun, L.; Cai, L.; Wang, Y.; Zhao, Y. Quantum dots from microfluidics for nanomedical application. WIREs Nanomed. Nanobiotechnology 2019, 11, e1567. [Google Scholar] [CrossRef]
- Sun, B.; Xie, W.; Yi, G.; Chen, D.; Zhou, Y.; Cheng, J. Microminiaturized immunoassays using quantum dots as fluorescent label by laser confocal scanning fluorescence detection. J. Immunol. Methods 2001, 249, 85–89. [Google Scholar] [CrossRef]
- Sultangaziyev, A.; Bukasov, R. Review: Applications of surface-enhanced fluorescence (SEF) spectroscopy in bio-detection and biosensing. Sens. Bio-Sens. Res. 2020, 30, 100382. [Google Scholar] [CrossRef]
- Sultangaziyev, A.; Akhmetova, A.; Kunushpayeva, Z.; Rapikov, A.; Filchakova, O.; Bukasov, R. Aluminum foil as a substrate for metal enhanced fluorescence of bacteria labelled with quantum dots, shows very large enhancement and high contrast. Sens. Bio-Sens. Res. 2020, 28, 100332. [Google Scholar] [CrossRef]
- Bukasov, R.; Kunushpayeva, Z.; Rapikov, A.; Zhunussova, S.; Sultangaziyev, A.; Filchakova, O. High Contrast Surface Enhanced Fluorescence of Carbon Dot Labeled Bacteria Cells on Aluminum Foil. J. Fluoresc. 2020, 30, 1477–1482. [Google Scholar] [CrossRef]
- Bukasov, R.; Filchakova, O.; Gudun, K.; Bouhrara, M. Strong Surface Enhanced Florescence of Carbon Dot Labeled Bacteria Cells Observed with High Contrast on Gold Film. J. Fluoresc. 2018, 28, 1–4. [Google Scholar] [CrossRef]
- Qiushu, C.; Alper, K.; Xudong, F. An Optofluidic FRET Laser Using Quantum Dots as Donor; SPIE: San Francisco, CA, USA, 2016; p. 97250I. [Google Scholar]
- Shopova, S.I.; Cupps, J.M.; Zhang, P.; Henderson, E.P.; Lacey, S.; Fan, X. Opto-fluidic ring resonator lasers based on highly efficient resonant energy transfer. Opt. Express 2007, 15, 12735–12742. [Google Scholar] [CrossRef] [PubMed]
- Hong, J.; Pei, D.; Guo, X. Quantum dot-Eu3+ conjugate as a luminescence turn-on sensor for ultrasensitive detection of nucleoside triphosphates. Talanta 2012, 99, 939–943. [Google Scholar] [CrossRef]
- Ban, R.; Zheng, F.; Zhang, J. A highly sensitive fluorescence assay for 2,4,6-trinitrotoluene using amine-capped silicon quantum dots as a probe. Anal. Methods 2015, 7, 1732–1737. [Google Scholar] [CrossRef]
- Peveler, W.J.; Roldan, A.; Hollingsworth, N.; Porter, M.J.; Parkin, I.P. Multichannel Detection and Differentiation of Explosives with a Quantum Dot Array. ACS Nano 2016, 10, 1139–1146. [Google Scholar] [CrossRef]
- Zhang, Z.; Li, J.; Wang, X.; Shen, D.; Chen, L. Quantum Dots Based Mesoporous Structured Imprinting Microspheres for the Sensitive Fluorescent Detection of Phycocyanin. ACS Appl. Mater. Interfaces 2015, 7, 9118–9127. [Google Scholar] [CrossRef]
- Li, Y.; Xu, J.; Wang, L.; Huang, Y.; Guo, J.; Cao, X.; Shen, F.; Luo, Y.; Sun, C. Aptamer-based fluorescent detection of bisphenol A using nonconjugated gold nanoparticles and CdTe quantum dots. Sens. Actuators B Chem. 2016, 222, 815–822. [Google Scholar] [CrossRef]
- Qian, J.; Hua, M.; Wang, C.; Wang, K.; Liu, Q.; Hao, N.; Wang, K. Fabrication of l-cysteine-capped CdTe quantum dots based ratiometric fluorescence nanosensor for onsite visual determination of trace TNT explosive. Anal. Chim. Acta 2016, 946, 80–87. [Google Scholar] [CrossRef]
- Singh, K.; Mehta, S.K. Luminescent ZnO quantum dots as an efficient sensor for free chlorine detection in water. Analyst 2016, 141, 2487–2492. [Google Scholar] [CrossRef]
- Chang, L.; He, X.; Chen, L.; Zhang, Y. Mercaptophenylboronic acid-capped Mn-doped ZnS quantum dots for highly selective and sensitive fluorescence detection of glycoproteins. Sens. Actuators B Chem. 2017, 243, 72–77. [Google Scholar] [CrossRef]
- Qian, J.; Wang, K.; Wang, C.; Ren, C.; Liu, Q.; Hao, N.; Wang, K. Ratiometric fluorescence nanosensor for selective and visual detection of cadmium ions using quencher displacement-induced fluorescence recovery of CdTe quantum dots-based hybrid probe. Sens. Actuators B Chem. 2017, 241, 1153–1160. [Google Scholar] [CrossRef]
- Tang, Z.; Lin, Z.; Li, G.; Hu, Y. Amino Nitrogen Quantum Dots-Based Nanoprobe for Fluorescence Detection and Imaging of Cysteine in Biological Samples. Anal. Chem. 2017, 89, 4238–4245. [Google Scholar] [CrossRef] [PubMed]
- Yu, M.; Zhao, K.; Zhu, X.; Tang, S.; Nie, Z.; Huang, Y.; Zhao, P.; Yao, S. Development of near-infrared ratiometric fluorescent probe based on cationic conjugated polymer and CdTe/CdS QDs for label-free determination of glucose in human body fluids. Biosens. Bioelectron. 2017, 95, 41–47. [Google Scholar] [CrossRef]
- Zhou, R.; Zhao, Q.; Liu, K.-K.; Lu, Y.-J.; Dong, L.; Shan, C.-X. Europium-decorated ZnO quantum dots as a fluorescent sensor for the detection of an anthrax biomarker. J. Mater. Chem. C 2017, 5, 1685–1691. [Google Scholar] [CrossRef]
- Pourghobadi, Z.; Mirahmadpour, P.; Zare, H. Fluorescent biosensor for the selective determination of dopamine by TGA-capped CdTe quantum dots in human plasma samples. Opt. Mater. 2018, 84, 757–762. [Google Scholar] [CrossRef]
- Xing, X.; Wang, D.; Chen, Z.; Zheng, B.; Li, B.; Wu, D. ZnTe quantum dots as fluorescence sensors for the detection of iron ions. J. Mater. Sci. Mater. Electron. 2018, 29, 14192–14199. [Google Scholar] [CrossRef]
- Zhao, X.; He, D.; Wang, Y.; Fu, C. Facile fabrication of tungsten disulfide quantum dots (WS2 QDs) as effective probes for fluorescence detection of dopamine (DA). Mater. Chem. Phys. 2018, 207, 130–134. [Google Scholar] [CrossRef]
- Feng, J.; Tao, Y.; Shen, X.; Jin, H.; Zhou, T.; Zhou, Y.; Hu, L.; Luo, D.; Mei, S.; Lee, Y.-I. Highly sensitive and selective fluorescent sensor for tetrabromobisphenol-A in electronic waste samples using molecularly imprinted polymer coated quantum dots. Microchem. J. 2019, 144, 93–101. [Google Scholar] [CrossRef]
- Li, D.; Xu, X.; Zhou, P.; Huang, Y.; Feng, Y.; Gu, Y.; Wang, M.; Liu, Y. A facile synthesis of hybrid silicon quantum dots and fluorescent detection of bovine hemoglobin. New J. Chem. 2019, 43, 19338–19343. [Google Scholar] [CrossRef]
- Najafi, S.; Safari, M.; Amani, S.; Mansouri, K.; Shahlaei, M. Preparation, characterization and cell cytotoxicity of Pd-doped CdTe quantum dots and its application as a sensitive fluorescent nanoprobe. J. Mater. Sci. Mater. Electron. 2019, 30, 14233–14242. [Google Scholar] [CrossRef]
- Safari, M.; Najafi, S.; Arkan, E.; Amani, S.; Shahlaei, M. Facile aqueous synthesis of Ni-doped CdTe quantum dots as fluorescent probes for detecting pyrazinamide in plasma. Microchem. J. 2019, 146, 293–299. [Google Scholar] [CrossRef]
- Wang, Z.; Xiao, X.; Zou, T.; Yang, Y.; Xing, X.; Zhao, R.; Wang, Z.; Wang, Y. Citric Acid Capped CdS Quantum Dots for Fluorescence Detection of Copper Ions (II) in Aqueous Solution. Nanomaterials 2019, 9, 32. [Google Scholar] [CrossRef]
- Zhang, Z.; Ma, X.; Jia, M.; Li, B.; Rong, J.; Yang, X. Deposition of CdTe quantum dots on microfluidic paper chips for rapid fluorescence detection of pesticide 2,4-D. Analyst 2019, 144, 1282–1291. [Google Scholar] [CrossRef] [PubMed]
- Zhang, X.; Li, C.; Zhao, S.; Pang, H.; Han, Y.; Luo, X.; Tang, W.; Li, Z. S doped silicon quantum dots with high quantum yield as a fluorescent sensor for determination of Fe3+ in water. Opt. Mater. 2020, 110, 110461. [Google Scholar] [CrossRef]
- Gao, R.; Li, D.; Zhang, Q.; Zheng, S.; Ren, X.; Deng, W. GNPs-QDs core–satellites assembly: Trimodal platform for on-site identification and detection of TNT in complex media. Sens. Actuators B Chem. 2021, 328, 128960. [Google Scholar] [CrossRef]
- Liu, M.; Bai, Y.; He, Y.; Zhou, J.; Ge, Y.; Zhou, J.; Song, G. Facile microwave-assisted synthesis of Ti3C2 MXene quantum dots for ratiometric fluorescence detection of hypochlorite. Microchim. Acta 2021, 188, 15. [Google Scholar] [CrossRef]
- Yang, M.; Wang, C.; Liu, E.; Hu, X.; Hao, H.; Fan, J. A novel ascorbic acid ratiometric fluorescent sensor based on ZnCdS quantum dots embedded molecularly imprinted polymer and silica-coated CdTeS quantum dots. J. Mol. Liq. 2021, 337, 116438. [Google Scholar] [CrossRef]
- Yi, Y.; Zeng, W.; Zhu, G. β-Cyclodextrin functionalized molybdenum disulfide quantum dots as nanoprobe for sensitive fluorescent detection of parathion-methyl. Talanta 2021, 222, 121703. [Google Scholar] [CrossRef]
- Zhang, J.; Wei, Y.; Qiu, S.; Xiong, Y. A highly selective and simple fluorescent probe for salbutamol detection based on thioglycolic acid-capped CdTe quantum dots. Spectrochim. Acta Part A Mol. Biomol. Spectrosc. 2021, 247, 119107. [Google Scholar] [CrossRef] [PubMed]
- Zhao, R.; Wang, Z.; Tian, X.; Shu, H.; Yang, Y.; Xiao, X.; Wang, Y. Excellent fluorescence detection of Cu2+ in water system using N-acetyl-L-cysteines modified CdS quantum dots as fluorescence probe. Nanotechnology 2021, 32, 405707. [Google Scholar] [CrossRef]
- Aznar-Gadea, E.; Rodriguez-Canto, P.J.; Sánchez, S.A.; Martínez-Pastor, J.P.; Abargues, R. Luminescent CdSe Quantum Dot Arrays for Rapid Sensing of Explosive Taggants. ACS Appl. Nano Mater. 2022, 5, 6717–6725. [Google Scholar] [CrossRef]
- Wang, X.; Li, L.; Jiang, H.; Zhangsun, H.; Wang, Q.; Sun, X.; Wang, L. Highly selective and sensitive fluorescence detection of tetracyclines based on novel tungsten oxide quantum dots. Food Chem. 2022, 374, 131774. [Google Scholar] [CrossRef] [PubMed]
- Narasimhappa, P.; Singh, S.; Ramamurthy, P.C. Synthesis of water-soluble CdS quantum dots for the fluorescence detection of tetracycline. Environ. Pollut. 2023, 338, 122682. [Google Scholar] [CrossRef] [PubMed]
- Zhong, Y.; Guo, L.; Zou, Y.; Chen, Y.; Lu, Z.; Wang, D. Rapid and ratiometric fluorescent detection of hypochlorite by glutathione functionalized molybdenum disulfide quantum dots. Spectrochim. Acta Part A Mol. Biomol. Spectrosc. 2023, 295, 122649. [Google Scholar] [CrossRef] [PubMed]
- Singh, P.D.D.; Murthy, Z.V.P.; Kailasa, S.K. Zinc nitride quantum dots as an efficient probe for simultaneous fluorescence detection of Cu2+ and Mn2+ ions in water samples. Microchim. Acta 2024, 191, 161. [Google Scholar] [CrossRef]
- Velamala, L.K.; Patel, M.R.; Deshpande, M.P.; Gul, A.R.; Park, T.J.; Kailasa, S.K. Fluorescence detection of superoxide anion with CsPbBr3 perovskite quantum dots in aqueous media. J. Mol. Liq. 2024, 414, 126211. [Google Scholar] [CrossRef]
- Zhang, Y.; Wang, C.; Wei, G.; Wang, X.; Liu, W.; Yang, G.; Zhang, P.; Li, Q.; Geng, X.; Chen, L.; et al. Facile fluorescence detection of malachite green in fish using molecularly imprinted polymers doped CdTe quantum dots based system. Food Chem. 2024, 442, 138458. [Google Scholar] [CrossRef]
- Kailasa, S.K.; Patel, M.R.; Deshpande, M.P.; Shin, E.; Choi, Y.; Park, T.J. Maltose-functionalized MAPbBr3 fluorescent perovskite quantum dots with strong water resistance for detection of γ-aminobutyric acid as a neurological biomarker. J. Photochem. Photobiol. A Chem. 2025, 463, 116282. [Google Scholar] [CrossRef]
- Zhang, L.; Shao, K.; Zhong, Y.; Guo, L.; Ge, J.; Lu, Z.; Wang, D. Molybdenum disulfide quantum dots for rapid fluorescence detection of glutathione and ascorbic acid. Spectrochim. Acta Part A Mol. Biomol. Spectrosc. 2025, 326, 125189. [Google Scholar] [CrossRef] [PubMed]
- Creeden, J.F.; Gordon, D.M.; Stec, D.E.; Hinds, T.D. Bilirubin as a metabolic hormone: The physiological relevance of low levels. Am. J. Physiol.-Endocrinol. Metab. 2020, 320, E191–E207. [Google Scholar] [CrossRef] [PubMed]
- Tzani, M.A.; Gioftsidou, D.K.; Kallitsakis, M.G.; Pliatsios, N.V.; Kalogiouri, N.P.; Angaridis, P.A.; Lykakis, I.N.; Terzidis, M.A. Direct and Indirect Chemiluminescence: Reactions, Mechanisms and Challenges. Molecules 2021, 26, 7664. [Google Scholar] [CrossRef] [PubMed]
- Han, H.; Sheng, Z.; Liang, J. Electrogenerated chemiluminescence from thiol-capped CdTe quantum dots and its sensing application in aqueous solution. Anal. Chim. Acta 2007, 596, 73–78. [Google Scholar] [CrossRef]
- Lin, Z.; Xue, W.; Chen, H.; Lin, J.-M. Peroxynitrous-Acid-Induced Chemiluminescence of Fluorescent Carbon Dots for Nitrite Sensing. Anal. Chem. 2011, 83, 8245–8251. [Google Scholar] [CrossRef]
- Yang, E.; Zhang, Y.; Shen, Y. Quantum dots for electrochemiluminescence bioanalysis—A review. Anal. Chim. Acta 2022, 1209, 339140. [Google Scholar] [CrossRef]
- Song, H.; Su, Y.; Zhang, L.; Lv, Y. Quantum dots-based chemiluminescence probes: An overview. Luminescence 2019, 34, 530–543. [Google Scholar] [CrossRef]
- Yang, G.; He, Y.; Zhao, J.; Chen, S.; Yuan, R. Ratiometric electrochemiluminescence biosensor based on Ir nanorods and CdS quantum dots for the detection of organophosphorus pesticides. Sens. Actuators B Chem. 2021, 341, 130008. [Google Scholar] [CrossRef]
- Li, M.; Li, Z.; Wang, P.; Ma, Q. A novel bimetallic MXene derivative QD-based ECL sensor for miRNA-27a-3p detection. Biosens. Bioelectron. 2023, 228, 115225. [Google Scholar] [CrossRef]
- Li, J.; Wang, Q.; Xiong, C.; Deng, Q.; Zhang, X.; Wang, S.; Chen, M.-M. An ultrasensitive CH3NH3PbBr3 quantum dots@SiO2-based electrochemiluminescence sensing platform using an organic electrolyte for aflatoxin B1 detection in corn oil. Food Chem. 2022, 390, 133200. [Google Scholar] [CrossRef]
- Wang, J.; Han, H.; Jiang, X.; Huang, L.; Chen, L.; Li, N. Quantum Dot-Based Near-Infrared Electrochemiluminescent Immunosensor with Gold Nanoparticle-Graphene Nanosheet Hybrids and Silica Nanospheres Double-Assisted Signal Amplification. Anal. Chem. 2012, 84, 4893–4899. [Google Scholar] [CrossRef] [PubMed]
- Liu, S.; Zhang, X.; Yu, Y.; Zou, G. A Monochromatic Electrochemiluminescence Sensing Strategy for Dopamine with Dual-Stabilizers-Capped CdSe Quantum Dots as Emitters. Anal. Chem. 2014, 86, 2784–2788. [Google Scholar] [CrossRef] [PubMed]
- Dong, Y.-P.; Gao, T.-T.; Zhou, Y.; Zhu, J.-J. Electrogenerated Chemiluminescence Resonance Energy Transfer between Luminol and CdSe@ZnS Quantum Dots and Its Sensing Application in the Determination of Thrombin. Anal. Chem. 2014, 86, 11373–11379. [Google Scholar] [CrossRef]
- Zhang, J.-J.; Kang, T.-F.; Hao, Y.-C.; Lu, L.-P.; Cheng, S.-Y. Electrochemiluminescent immunosensor based on CdS quantum dots for ultrasensitive detection of microcystin-LR. Sens. Actuators B Chem. 2015, 214, 117–123. [Google Scholar] [CrossRef]
- Wang, J.; Jiang, X. Anodic near-infrared electrochemiluminescence from CdTe/CdS coresmall/shellthick quantum dots and their sensing ability of Cu2+. Sens. Actuators B Chem. 2015, 207, 552–555. [Google Scholar] [CrossRef]
- Dong, H.; Han, T.-T.; Ren, L.-L.; Ding, S.-N. Novel sandwich-structured electrochemiluminescence immunosensing platform via CdTe quantum dots-embedded mesoporous silica nanospheres as enhanced signal labels and Fe3O4@SiO2@PS nanocomposites as magnetic separable carriers. J. Electroanal. Chem. 2017, 806, 32–40. [Google Scholar] [CrossRef]
- Zhao, M.; Chen, A.-Y.; Huang, D.; Chai, Y.-Q.; Zhuo, Y.; Yuan, R. MoS2 Quantum Dots as New Electrochemiluminescence Emitters for Ultrasensitive Bioanalysis of Lipopolysaccharide. Anal. Chem. 2017, 89, 8335–8342. [Google Scholar] [CrossRef]
- Wu, F.-F.; Zhou, Y.; Wang, J.-X.; Zhuo, Y.; Yuan, R.; Chai, Y.-Q. A novel electrochemiluminescence immunosensor based on Mn doped Ag2S quantum dots probe for laminin detection. Sens. Actuators B Chem. 2017, 243, 1067–1074. [Google Scholar] [CrossRef]
- Dong, Y.-P.; Wang, J.; Peng, Y.; Zhu, J.-J. Electrogenerated chemiluminescence of Si quantum dots in neutral aqueous solution and its biosensing application. Biosens. Bioelectron. 2017, 89, 1053–1058. [Google Scholar] [CrossRef]
- Yang, X.; Yu, Y.-Q.; Peng, L.-Z.; Lei, Y.-M.; Chai, Y.-Q.; Yuan, R.; Zhuo, Y. Strong Electrochemiluminescence from MOF Accelerator Enriched Quantum Dots for Enhanced Sensing of Trace cTnI. Anal. Chem. 2018, 90, 3995–4002. [Google Scholar] [CrossRef]
- Hu, Y.; Chen, C.; Liu, Y.; Wang, S.; Guo, Z.; Hu, Y. Dual-signals electrochemiluminescence ratiometry based the synergic effect between luminol and CdSe quantum dots for direct detection of hydrogen peroxide. J. Electroanal. Chem. 2018, 815, 61–67. [Google Scholar] [CrossRef]
- Zhang, L.; Tian, K.; Dong, Y.; Ding, H.; Wang, C. Electrogenerated chemiluminescence of Ru(bpy)32+ at a black phosphorus quantum dot modified electrode and its sensing application. Analyst 2018, 143, 304–310. [Google Scholar] [CrossRef] [PubMed]
- Wang, Q.; Li, S.; Li, J. A molecularly imprinted sensor with enzymatic enhancement of electrochemiluminescence of quantum dots for ultratrace clopyralid determination. Anal. Bioanal. Chem. 2018, 410, 5165–5172. [Google Scholar] [CrossRef]
- Lei, Y.-M.; Zhou, J.; Chai, Y.-Q.; Zhuo, Y.; Yuan, R. SnS2 Quantum Dots as New Emitters with Strong Electrochemiluminescence for Ultrasensitive Antibody Detection. Anal. Chem. 2018, 90, 12270–12277. [Google Scholar] [CrossRef] [PubMed]
- Gao, J.; Chen, Z.; Mao, L.; Zhang, W.; Wen, W.; Zhang, X.; Wang, S. Electrochemiluminescent aptasensor based on resonance energy transfer system between CdTe quantum dots and cyanine dyes for the sensitive detection of Ochratoxin A. Talanta 2019, 199, 178–183. [Google Scholar] [CrossRef] [PubMed]
- Liu, H.; Zhang, Y.; Dong, Y.; Chu, X. Electrogenerated chemiluminescence aptasensor for lysozyme based on copolymer nanospheres encapsulated black phosphorus quantum dots. Talanta 2019, 199, 507–512. [Google Scholar] [CrossRef]
- Du, D.; Shu, J.; Guo, M.; Haghighatbin, M.A.; Yang, D.; Bian, Z.; Cui, H. Potential-Resolved Differential Electrochemiluminescence Immunosensor for Cardiac Troponin I Based on MOF-5-Wrapped CdS Quantum Dot Nanoluminophores. Anal. Chem. 2020, 92, 14113–14121. [Google Scholar] [CrossRef]
- Chen, P.; Liu, Z.; Liu, J.; Liu, H.; Bian, W.; Tian, D.; Xia, F.; Zhou, C. A novel electrochemiluminescence aptasensor based CdTe QDs@NH2-MIL-88(Fe) for signal amplification. Electrochim. Acta 2020, 354, 136644. [Google Scholar] [CrossRef]
- Xu, J.; Zhang, R.; Liu, C.; Sun, A.; Chen, J.; Zhang, Z.; Shi, X. Highly Selective Electrochemiluminescence Sensor Based on Molecularly Imprinted-quantum Dots for the Sensitive Detection of Cyfluthrin. Sensors 2020, 20, 884. [Google Scholar] [CrossRef]
- Liu, Y.; Li, B.; Yao, Y.; Yang, B.; Tian, T.; Miao, Y.; Liu, B. An electrochemiluminescence sensor for 17β-estradiol detection based on resonance energy transfer in α-FeOOH@CdS/Ag NCs. Talanta 2021, 221, 121479. [Google Scholar] [CrossRef]
- Feng, D.; Wei, F.; Wu, Y.; Tan, X.; Li, F.; Lu, Y.; Fan, G.; Han, H. A novel signal amplified electrochemiluminescence biosensor based on MIL-53(Al)@CdS QDs and SiO2@AuNPs for trichlorfon detection. Analyst 2021, 146, 1295–1302. [Google Scholar] [CrossRef]
- Rasoulzadeh, F.; Amjadi, M. The chemiluminescence of AgInS2 quantum dots and its application as a sensing platform for glutathione assay. J. Photochem. Photobiol. A Chem. 2021, 420, 113493. [Google Scholar] [CrossRef]
- Zhao, J.; He, Y.; Tan, K.; Yang, J.; Chen, S.; Yuan, R. Novel Ratiometric Electrochemiluminescence Biosensor Based on BP-CdTe QDs with Dual Emission for Detecting MicroRNA-126. Anal. Chem. 2021, 93, 12400–12408. [Google Scholar] [CrossRef]
- Jia, M.; Jia, B.; Liao, X.; Shi, L.; Zhang, Z.; Liu, M.; Zhou, L.; Li, D.; Kong, W. A CdSe@CdS quantum dots based electrochemiluminescence aptasensor for sensitive detection of ochratoxin A. Chemosphere 2022, 287, 131994. [Google Scholar] [CrossRef]
- Liu, W.; Su, M.; Chen, A.; Peng, K.; Chai, Y.; Yuan, R. Highly Efficient Electrochemiluminescence Based on Luminol/MoS2 Quantum Dots@Zeolitic Imidazolate Framework-8 as an Emitter for Ultrasensitive Detection of MicroRNA. Anal. Chem. 2022, 94, 9106–9113. [Google Scholar] [CrossRef] [PubMed]
- Yang, F.; Gong, J.; Li, M.; Jiang, X.; Zhang, J.; Liao, M.; Zhang, H.; Tremblay, P.-L.; Zhang, T. Electrochemiluminescent CdS Quantum Dots Biosensor for Cancer Mutation Detection at Different Positions on Linear DNA Analytes. Anal. Chem. 2023, 95, 14016–14024. [Google Scholar] [CrossRef] [PubMed]
- Liu, M.; Wang, Y.; Tang, S.; Wang, W.; Liang, A.; Luo, A. A ratiometric molecular imprinted electrochemiluminescence sensor based on enhanced luminescence of CdSe@ZnS quantum dots by MXene@NaAsc for detecting uric acid. Bioelectrochemistry 2024, 156, 108610. [Google Scholar] [CrossRef]
- Gong, Q.; Guo, Y.; Wang, X.; Zhang, L.; Liu, D.; Nie, G. Dual quenching ECL strategy based on AgInZnS quantum dots and a new co-reaction promoter oxygen vacancy-modified P5AIn/TiO2 for sensitive CEA detection. Sens. Actuators B Chem. 2025, 423, 136844. [Google Scholar] [CrossRef]
- Chinnadayyala, S.R.; Park, J.; Le, H.T.N.; Santhosh, M.; Kadam, A.N.; Cho, S. Recent advances in microfluidic paper-based electrochemiluminescence analytical devices for point-of-care testing applications. Biosens. Bioelectron. 2019, 126, 68–81. [Google Scholar] [CrossRef]
- Veamatahau, A.; Jiang, B.; Seifert, T.; Makuta, S.; Latham, K.; Kanehara, M.; Teranishi, T.; Tachibana, Y. Origin of surface trap states in CdS quantum dots: Relationship between size dependent photoluminescence and sulfur vacancy trap states. Phys. Chem. Chem. Phys. 2015, 17, 2850–2858. [Google Scholar] [CrossRef]
- Wu, P.; He, Y.; Wang, H.-F.; Yan, X.-P. Conjugation of Glucose Oxidase onto Mn-Doped ZnS Quantum Dots for Phosphorescent Sensing of Glucose in Biological Fluids. Anal. Chem. 2010, 82, 1427–1433. [Google Scholar] [CrossRef]
- Chang, N.; Mao, J.; Lu, Y.; Yang, J.; Pu, Y.; Zhang, S.; Liu, Y. Time-resolved phosphorescent sensor array based on quantum dots for recognition of proteins. Sens. Actuators B Chem. 2016, 233, 17–24. [Google Scholar] [CrossRef]
- Li, D.; Qin, J.; Lv, J.; Yang, J.; Yan, G. “Turn on” room-temperature phosphorescent biosensors for detection of hyaluronic acid based on manganese-doped ZnS quantum dots. RSC Adv. 2018, 8, 2873–2879. [Google Scholar] [CrossRef]
- Wang, Y.-Q.; Zou, W.-S. 3-Aminopropyltriethoxysilane-functionalized manganese doped ZnS quantum dots for room-temperature phosphorescence sensing ultratrace 2,4,6-trinitrotoluene in aqueous solution. Talanta 2011, 85, 469–475. [Google Scholar] [CrossRef]
- He, Y.; Wang, H.-F.; Yan, X.-P. Exploring Mn-Doped ZnS Quantum Dots for the Room-Temperature Phosphorescence Detection of Enoxacin in Biological Fluids. Anal. Chem. 2008, 80, 3832–3837. [Google Scholar] [CrossRef] [PubMed]
- Miao, Y.; Wang, R.; Suna, X.; Yan, G. Preparation of DNA functional phosphorescent quantum dots and application in melamine detection in milk. RSC Adv. 2019, 9, 21147–21154. [Google Scholar] [CrossRef]
- Wu, P.; Zhao, T.; Tian, Y.; Wu, L.; Hou, X. Protein-Directed Synthesis of Mn-Doped ZnS Quantum Dots: A Dual-Channel Biosensor for Two Proteins. Chemistry 2013, 19, 7473–7479. [Google Scholar] [CrossRef] [PubMed]
- Fan, M.; Gan, T.; Yin, G.; Cheng, F.; Zhao, N. Molecularly imprinted polymer coated Mn-doped ZnS quantum dots embedded in a metal–organic framework as a probe for selective room temperature phosphorescence detection of chlorpyrifos. RSC Adv. 2021, 11, 27845–27854. [Google Scholar] [CrossRef]
- Verma, N.; Singh, A.K.; Saini, N. Synthesis and characterization of ZnS quantum dots and application for development of arginine biosensor. Sens. Bio-Sens. Res. 2017, 15, 41–45. [Google Scholar] [CrossRef]
- Wang, H.F.; Li, Y.; Wu, Y.Y.; He, Y.; Yan, X.P. Ascorbic acid induced enhancement of room temperature phosphorescence of sodium tripolyphosphate-capped Mn-Doped ZnS quantum dots: Mechanism and bioprobe applications. Chemistry 2010, 16, 12988–12994. [Google Scholar] [CrossRef]
- He, Y.; Yan, X. Mn-doped ZnS quantum dots/methyl violet nanohybrids for room temperature phosphorescence sensing of DNA. Sci. China Chem. 2011, 54, 1254–1259. [Google Scholar] [CrossRef]
- Zhang, L.; Zhang, R.; Cui, P.; Cao, W.; Gao, F. An efficient phosphorescence energy transfer between quantum dots and carbon nanotubes for ultrasensitive turn-on detection of DNA. Chem. Commun. 2013, 49, 8102–8104. [Google Scholar] [CrossRef]
- Dan, L.; Wang, H.-F. Mn-Doped ZnS Quantum Dot Imbedded Two-Fragment Imprinting Silica for Enhanced Room Temperature Phosphorescence Probing of Domoic Acid. Anal. Chem. 2013, 85, 4844–4848. [Google Scholar] [CrossRef] [PubMed]
- Tan, L.; Kang, C.; Xu, S.; Tang, Y. Selective room temperature phosphorescence sensing of target protein using Mn-doped ZnS QDs-embedded molecularly imprinted polymer. Biosens. Bioelectron. 2013, 48, 216–223. [Google Scholar] [CrossRef] [PubMed]
- Wang, H.-F.; Wu, Y.-Y.; Yan, X.-P. Room-Temperature Phosphorescent Discrimination of Catechol from Resorcinol and Hydroquinone Based on Sodium Tripolyphosphate Capped Mn-Doped ZnS Quantum Dots. Anal. Chem. 2013, 85, 1920–1925. [Google Scholar] [CrossRef] [PubMed]
- Bian, W.; Ma, J.; Guo, W.; Lu, D.; Fan, M.; Wei, Y.; Li, Y.; Shuang, S.; Choi, M.M.F. Phosphorescence detection of L-ascorbic acid with surface-attached N-acetyl-L-cysteine and L-cysteine Mn doped ZnS quantum dots. Talanta 2013, 116, 794–800. [Google Scholar] [CrossRef]
- Bian, W.; Ma, J.; Liu, Q.; Wei, Y.; Li, Y.; Dong, C.; Shuang, S. A novel phosphorescence sensor for Co2+ ion based on Mn-doped ZnS quantum dots. Luminescence 2014, 29, 151–157. [Google Scholar] [CrossRef]
- Zhu, D.; Li, W.; Wen, H.-M.; Chen, Q.; Ma, L.; Hu, Y. Microwave-assisted aqueous synthesis of Mn-doped ZnS quantum dots and their room-temperature phosphorescence detection of indapamide. Anal. Methods 2014, 6, 7489–7495. [Google Scholar] [CrossRef]
- Gong, Y.; Fan, Z. Melamine-modulated mercaptopropionic acid-capped manganese doped zinc sulfide quantum dots as a room-temperature phosphorescence sensor for detecting clenbuterol in biological fluids. Sens. Actuators B Chem. 2014, 202, 638–644. [Google Scholar] [CrossRef]
- Zhang, Z.; Miao, Y.; Zhang, Q.; Yan, G. Facile and sensitive detection of protamine by enhanced room-temperature phosphorescence of Mn-doped ZnS quantum dots. Anal. Biochem. 2015, 478, 90–95. [Google Scholar] [CrossRef]
- Bi, L.; Yu, Y.-H. Phosphorescent quantum dots/ethidium bromide nanohybrids based on photoinduced electron transfer for DNA detection. Spectrochim. Acta Part A Mol. Biomol. Spectrosc. 2015, 140, 479–483. [Google Scholar] [CrossRef] [PubMed]
- Gong, Y.; Fan, Z. Highly selective manganese-doped zinc sulfide quantum dots based label free phosphorescent sensor for phosphopeptides in presence of zirconium (IV). Biosens. Bioelectron. 2015, 66, 533–538. [Google Scholar] [CrossRef]
- Zhang, Z.; Miao, Y.; Lian, L.; Yan, G. Detection of quercetin based on Al3+-amplified phosphorescence signals of manganese-doped ZnS quantum dots. Anal. Biochem. 2015, 489, 17–24. [Google Scholar] [CrossRef]
- Ertas, N.; Satana Kara, H.E. l-Cysteine capped Mn-doped ZnS quantum dots as a room temperature phosphorescence sensor for in-vitro binding assay of idarubicin and DNA. Biosens. Bioelectron. 2015, 70, 345–350. [Google Scholar] [CrossRef] [PubMed]
- Bian, W.; Wang, F.; Wei, Y.; Wang, L.; Liu, Q.; Dong, W.; Shuang, S.; Choi, M.M.F. Doped zinc sulfide quantum dots based phosphorescence turn-off/on probe for detecting histidine in biological fluid. Anal. Chim. Acta 2015, 856, 82–89. [Google Scholar] [CrossRef] [PubMed]
- Zhang, J.; Zhu, A.; Zhao, T.; Wu, L.; Wu, P.; Hou, X. Glucose oxidase-directed, instant synthesis of Mn-doped ZnS quantum dots in neutral media with retained enzymatic activity: Mechanistic study and biosensing application. J. Mater. Chem. B 2015, 3, 5942–5950. [Google Scholar] [CrossRef]
- Chen, J.; Zhu, Y.; Zhang, Y. Glutathione-capped Mn-doped ZnS quantum dots as a room-temperature phosphorescence sensor for the detection of Pb2+ ions. Spectrochim. Acta Part A Mol. Biomol. Spectrosc. 2016, 164, 98–102. [Google Scholar] [CrossRef]
- Gong, Y.; Fan, Z. Room-Temperature Phosphorescence Turn-on Detection of DNA Based on Riboflavin-Modulated Manganese Doped Zinc Sulfide Quantum Dots. J. Fluoresc. 2016, 26, 385–393. [Google Scholar] [CrossRef]
- Liu, W.; Li, H.; Wei, Y.; Dong, C. A label-free phosphorescence sensing platform for trypsin based on Mn-ZnS QDs. RSC Adv. 2017, 7, 26930–26934. [Google Scholar] [CrossRef]
- Lv, J.; Miao, Y.; Yan, G. Detection of tumor marker miRNA21 based on phosphorescent resonance energy transfer of Mn–ZnS QDs. RSC Adv. 2017, 7, 41063–41069. [Google Scholar] [CrossRef]
- Zhang, J.; Lu, X.; Lei, Y.; Hou, X.; Wu, P. Exploring the tunable excitation of QDs to maximize the overlap with the absorber for inner filter effect-based phosphorescence sensing of alkaline phosphatase. Nanoscale 2017, 9, 15606–15611. [Google Scholar] [CrossRef] [PubMed]
- Zhang, C.; Zhang, K.; Zhao, T.; Liu, B.; Wang, Z.; Zhang, Z. Selective phosphorescence sensing of pesticide based on the inhibition of silver(I) quenched ZnS:Mn2+ quantum dots. Sens. Actuators B Chem. 2017, 252, 1083–1088. [Google Scholar] [CrossRef]
- Pacheco, M.E.; Castells, C.B.; Bruzzone, L. Mn-doped ZnS phosphorescent quantum dots: Coumarins optical sensors. Sens. Actuators B Chem. 2017, 238, 660–666. [Google Scholar] [CrossRef]
- Zhang, W.; Han, Y.; Chen, X.; Luo, X.; Wang, J.; Yue, T.; Li, Z. Surface molecularly imprinted polymer capped Mn-doped ZnS quantum dots as a phosphorescent nanosensor for detecting patulin in apple juice. Food Chem. 2017, 232, 145–154. [Google Scholar] [CrossRef]
- Deng, P.; Lu, L.-Q.; Cao, W.-C.; Tian, X.-K. Phosphorescence detection of manganese(VII) based on Mn-doped ZnS quantum dots. Spectrochim. Acta Part A Mol. Biomol. Spectrosc. 2017, 173, 578–583. [Google Scholar] [CrossRef]
- Lv, J.; Miao, Y.; Yang, J.; Qin, J.; Li, D.; Yan, G. A DNA probe based on phosphorescent resonance energy transfer for detection of transgenic 35S promoter DNA. Biosens. Bioelectron. 2017, 91, 560–565. [Google Scholar] [CrossRef]
- Li, D.; Qin, J.; Yan, G. A phosphorescent sensor for detection of Micrococcal nuclease base on phosphorescent resonance energy transfer between quantum dots and DNA-ROX. Sens. Actuators B Chem. 2018, 255, 529–535. [Google Scholar] [CrossRef]
- Wei, X.; Yu, M.; Li, C.; Gong, X.; Qin, F.; Wang, Z. Magnetic nanoparticles coated with a molecularly imprinted polymer doped with manganese-doped ZnS quantum dots for the determination of 2,4,6-trichlorophenol. Microchim. Acta 2018, 185, 208. [Google Scholar] [CrossRef] [PubMed]
- Liu, C.L.; Hou, C.J.; Huo, D.Q. Enhanced Room-Temperature Phosphorescence of Mn-Doped ZnS Quantum Dots Composited with PDDA for Detection of Adriamycin. J. Nanosci. Nanotechnol. 2018, 18, 2993–2999. [Google Scholar] [CrossRef]
- Zou, W.S.; Deng, M.Y.; Wang, Y.Q.; Zhao, X.; Li, W.H.; Huang, X.H. Alginate capped and manganese doped ZnS quantum dots as a phosphorescent probe for time-resolved detection of copper(II). Mikrochim. Acta 2018, 186, 41. [Google Scholar] [CrossRef]
- Qin, J.; Zheng, J.; Fang, X.; Yan, G. Detection of resveratrol by phosphorescence quantum dots without conjunction and mutual impact exploration. RSC Adv. 2018, 8, 25997–26003. [Google Scholar] [CrossRef]
- Luo, S.; Miao, Y.; Guo, J.; Sun, X.; Yan, G. Phosphorimetric determination of 4-nitrophenol using mesoporous molecular imprinting polymers containing manganese(II)-doped ZnS quantum dots. Mikrochim. Acta 2019, 186, 249. [Google Scholar] [CrossRef]
- Chen, S.; Li, Y.; Wu, S.; Jiang, X.; Yang, H.; Su, X.; He, L.; Zou, L.; Ao, X.; Liu, S.; et al. A phosphorescent probe for cephalexin consisting of mesoporous thioglycolic acid-modified Mn:ZnS quantum dots coated with a molecularly imprinted polymer. Mikrochim. Acta 2019, 187, 40. [Google Scholar] [CrossRef]
- Zhao, J.; Fan, Z. Aggregation-induced phosphorescence quenching method for the detection of picric acid based on melamine-passivated Mn-doped ZnS quantum dots. Spectrochim. Acta Part A Mol. Biomol. Spectrosc. 2019, 223, 117323. [Google Scholar] [CrossRef] [PubMed]
- Liu, Z.; Hou, J.; He, Q.; Luo, X.; Huo, D.; Hou, C. New application of Mn-doped ZnS quantum dots: Phosphorescent sensor for the rapid screening of chloramphenicol and tetracycline residues. Anal. Methods 2020, 12, 3513–3522. [Google Scholar] [CrossRef] [PubMed]
- Madurangika Jayasinghe, G.D.T.; Domínguez-González, R.; Bermejo-Barrera, P.; Moreda-Piñeiro, A. Room temperature phosphorescent determination of aflatoxins in fish feed based on molecularly imprinted polymer—Mn-doped ZnS quantum dots. Anal. Chim. Acta 2020, 1103, 183–191. [Google Scholar] [CrossRef] [PubMed]
- Jinadasa, K.K.; Peña-Vázquez, E.; Bermejo-Barrera, P.; Moreda-Piñeiro, A. Synthesis and application of a surface ionic imprinting polymer on silica-coated Mn-doped ZnS quantum dots as a chemosensor for the selective quantification of inorganic arsenic in fish. Anal. Bioanal. Chem. 2020, 412, 1663–1673. [Google Scholar] [CrossRef]
- Lv, X.; Gao, P. An optical sensor for selective detection of phenol via double cross-linker precipitation polymerization. RSC Adv. 2020, 10, 25402–25407. [Google Scholar] [CrossRef]
- Liu, S.; Li, D.; Shi, D.; Zhang, G.; Luo, X.; Xu, Q.; Zhao, L.; Guo, J.; Yan, G. Construction of a room-temperature phosphorescent quantum dot probe and quantitative detection of thyroxine and carbamazepine. J. Mol. Struct. 2021, 1229, 129582. [Google Scholar] [CrossRef]
- Qin, G.; Zuo, L.; Wei, Y.; Wang, L.; Bodwell, G. Highly sensitive detection for alkaline phosphatase using doped ZnS quantum dots with room temperature phosphorescence and its logic gate function. Colloids Surf. B Biointerfaces 2021, 206, 111968. [Google Scholar] [CrossRef]
- Chen, S.; Su, X.; Yuan, C.; Jia, C.Q.; Qiao, Y.; Li, Y.; He, L.; Zou, L.; Ao, X.; Liu, A.; et al. A magnetic phosphorescence molecularly imprinted polymers probe based on manganese-doped ZnS quantum dots for rapid detection of trace norfloxacin residual in food. Spectrochim. Acta Part A Mol. Biomol. Spectrosc. 2021, 253, 119577. [Google Scholar] [CrossRef] [PubMed]
- Kong, W.; Liu, M.; Zhang, J.; Wu, H.; Wang, Y.; Su, Q.; Li, Q.; Zhang, J.; Wu, C.; Zou, W.-S. Room-temperature phosphorescence and fluorescence nanocomposites as a ratiometric chemosensor for high-contrast and selective detection of 2,4,6-trinitrotoluene. Anal. Chim. Acta 2023, 1282, 341930. [Google Scholar] [CrossRef] [PubMed]
- Yang, J.; Zhe, L.; Bo, Y.; Xiangdong, G.; Feiyong, Q.; Yanping, M.; Dehui, L.; Hongmei, G.; Li, W. Determination of Lead (II) by Phosphorescence Using Manganese-Doped Zinc Sulfide Quantum Dots. Anal. Lett. 2025, 58, 1495–1505. [Google Scholar] [CrossRef]
- Forcada, S.; Sánchez-Visedo, A.; Melendreras, C.; Menéndez-Miranda, M.; Costa-Fernández, J.M.; Royo, L.J.; Soldado, A. Design and Evaluation of a Competitive Phosphorescent Immunosensor for Aflatoxin M1 Quantification in Milk Samples Using Mn:ZnS Quantum Dots as Antibody Tags. Chemosensors 2022, 10, 41. [Google Scholar] [CrossRef]
- Hua, L.; Han, H.; Zhang, X. Size-dependent electrochemiluminescence behavior of water-soluble CdTe quantum dots and selective sensing of l-cysteine. Talanta 2009, 77, 1654–1659. [Google Scholar] [CrossRef] [PubMed]
- Nakayama, M.; Kitano, T.; Ye, J.; Jin, J. Anodic Electrochemiluminescence of CdTe Quantum Dots Using Tripropylamine as Coreactant: Size-dependent Effect. Anal. Sci. 2020, 36, 859–863. [Google Scholar] [CrossRef]
- Zhang, Y.; Clapp, A. Overview of Stabilizing Ligands for Biocompatible Quantum Dot Nanocrystals. Sensors 2011, 11, 11036–11055. [Google Scholar] [CrossRef]
- Wang, S.; Du, L.; Jin, Z.; Xin, Y.; Mattoussi, H. Enhanced Stabilization and Easy Phase Transfer of CsPbBr3 Perovskite Quantum Dots Promoted by High-Affinity Polyzwitterionic Ligands. J. Am. Chem. Soc. 2020, 142, 12669–12680. [Google Scholar] [CrossRef]
- Kovalenko, M.V.; Protesescu, L.; Bodnarchuk, M.I. Properties and potential optoelectronic applications of lead halide perovskite nanocrystals. Science 2017, 358, 745–750. [Google Scholar] [CrossRef]
- Sanjayan, C.G.; Jyothiab, M.S.; Balakrishna, R.G. Stabilization of CsPbBr3 quantum dots for photocatalysis, imaging and optical sensing in water and biological medium: A review. J. Mater. Chem. C 2022, 10, 6935–6956. [Google Scholar] [CrossRef]
- Yu, M.; Yang, J.; Zhang, X.; Yuan, M.; Zhang, J.; Gao, L.; Tang, J.; Lan, X. In-Synthesis Se-Stabilization Enables Defect and Doping Engineering of HgTe Colloidal Quantum Dots. Adv. Mater. 2024, 36, 2311830. [Google Scholar] [CrossRef] [PubMed]
- Parani, S.; Pandian, K.; Oluwafemi, O.S. Gelatin stabilization of quantum dots for improved stability and biocompatibility. Int. J. Biol. Macromol. 2018, 107, 635–641. [Google Scholar] [CrossRef] [PubMed]
- Wang, M.; Zhang, M.; Qian, J.; Zhao, F.; Shen, L.; Scholes, G.D.; Winnik, M.A. Enhancing the Photoluminescence of Polymer-Stabilized CdSe/CdS/ZnS Core/Shell/Shell and CdSe/ZnS Core/Shell Quantum Dots in Water through a Chemical-Activation Approach. Langmuir 2009, 25, 11732–11740. [Google Scholar] [CrossRef] [PubMed]
- Nie, Q.; Tan, W.B.; Zhang, Y. Synthesis and characterization of monodisperse chitosan nanoparticles with embedded quantum dots. Nanotechnology 2006, 17, 140. [Google Scholar] [CrossRef]
- Ali, M.; Zayed, D.; Ramadan, W.; Kamel, O.A.; Shehab, M.; Ebrahim, S. Synthesis, characterization and cytotoxicity of polyethylene glycol-encapsulated CdTe quantum dots. Int. Nano Lett. 2019, 9, 61–71. [Google Scholar] [CrossRef]
- Hens, B.; Smothers, J.; Rizvanovic, H.; Patel, R.; Wu, Q.; Kim, K. The Future of Anticancer Drugs: A Cytotoxicity Assessment Study of CdSe/ZnS Quantum Dots. J. Nanotheranostics 2020, 1, 19–38. [Google Scholar] [CrossRef]
- Cheng, Q.; Duan, Y.; Fan, W.; Li, D.; Zhu, C.; Ma, T.; Liu, J.; Yu, M. Cellular uptake, intracellular behavior, and acute/sub-acute cytotoxicity of a PEG-modified quantum dot with promising in-vivo biomedical applications. Heliyon 2023, 9, e20028. [Google Scholar] [CrossRef]
- Zhang, J.; Zhou, W.; Qi, H.; He, X. Deep-Learning-Assisted Digital Fluorescence Immunoassay on Magnetic Beads for Ultrasensitive Determination of Protein Biomarkers. Anal. Chem. 2025, 97, 2393–2401. [Google Scholar] [CrossRef]
- Saren, G.; Zhu, L.; Han, Y. Quantitative Detection of Gastrointestinal Tumor Markers Using a Machine Learning Algorithm and Multicolor Quantum Dot Biosensor. Comput. Intell. Neurosci. 2022, 2022, 9022821. [Google Scholar] [CrossRef]
- Zhang, S.; Zhu, W.; Zhang, X.; Mei, L.; Liu, J.; Wang, F. Machine learning-driven fluorescent sensor array using aqueous CsPbBr3 perovskite quantum dots for rapid detection and sterilization of foodborne pathogens. J. Hazard. Mater. 2025, 483, 136655. [Google Scholar] [CrossRef]
| Parameter | Size | Excitation λ | Emission λ | |||||||
|---|---|---|---|---|---|---|---|---|---|---|
| Type | FL | P | CL | FL | P | CL | FL | P | CL | |
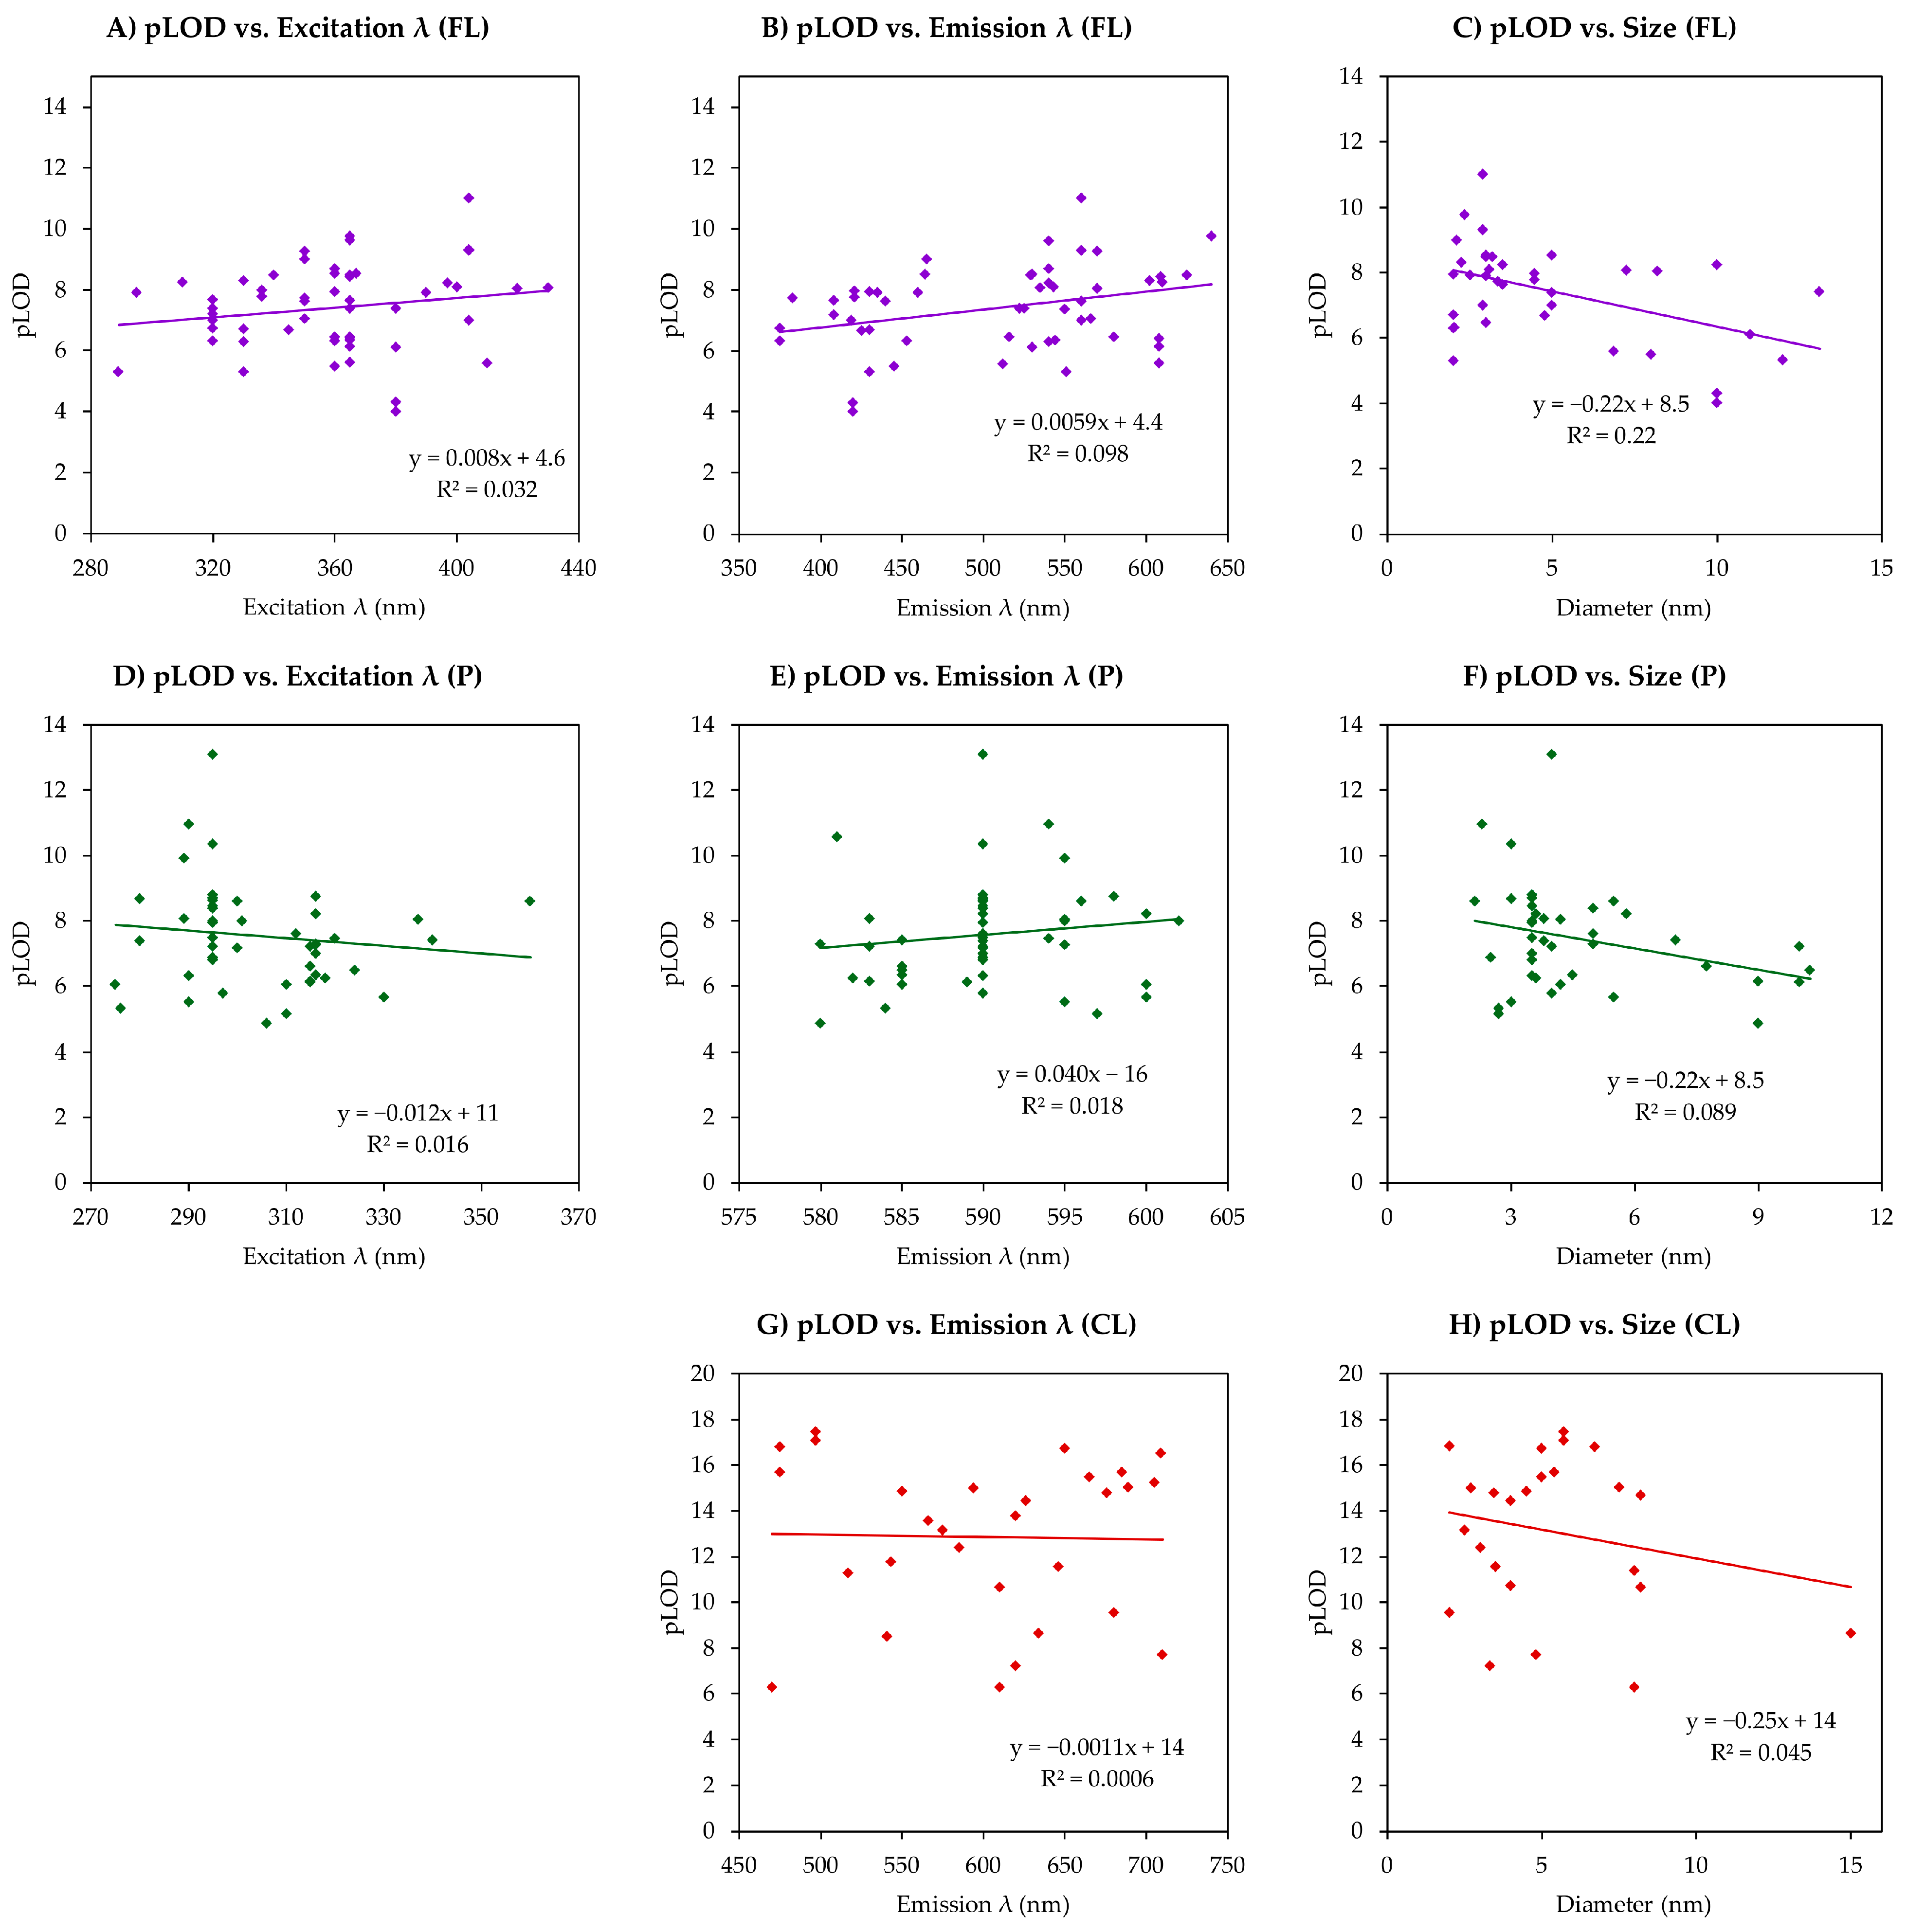
| Correl | LOD | 0.384 | 0.181 | 0.181 | 0.115 | −0.043 | - | −0.227 | −0.163 | −0.210 |
| pLOD | −0.466 | −0.299 | −0.211 | 0.179 | −0.126 | - | 0.313 | 0.133 | −0.024 | |
| Sample Size | 38 | 35 | 25 | 54 | 49 | - | 54 | 50 | 30 | |
| Average | FL | P | CL | Median | FL | P | CL |
|---|---|---|---|---|---|---|---|
| pLOD | 7.4 | 7.6 | 13.0 | pLOD | 7.6 | 7.4 | 13.6 |
| Excitation λ | 359 | 304 | - | Excitation λ | 360 | 299 | - |
| Emission λ | 509 | 590 | 602 | Emission λ | 530 | 590 | 615 |
| Size | 4.9 | 4.6 | 5.3 | Size | 3.3 | 3.8 | 4.8 |
Disclaimer/Publisher’s Note: The statements, opinions and data contained in all publications are solely those of the individual author(s) and contributor(s) and not of MDPI and/or the editor(s). MDPI and/or the editor(s) disclaim responsibility for any injury to people or property resulting from any ideas, methods, instructions or products referred to in the content. |
© 2025 by the authors. Licensee MDPI, Basel, Switzerland. This article is an open access article distributed under the terms and conditions of the Creative Commons Attribution (CC BY) license (https://creativecommons.org/licenses/by/4.0/).
Share and Cite
Loskutova, A.; Seitkali, A.; Aliyev, D.; Bukasov, R. Quantum Dot-Based Luminescent Sensors: Review from Analytical Perspective. Int. J. Mol. Sci. 2025, 26, 6674. https://doi.org/10.3390/ijms26146674
Loskutova A, Seitkali A, Aliyev D, Bukasov R. Quantum Dot-Based Luminescent Sensors: Review from Analytical Perspective. International Journal of Molecular Sciences. 2025; 26(14):6674. https://doi.org/10.3390/ijms26146674
Chicago/Turabian StyleLoskutova, Alissa, Ansar Seitkali, Dinmukhamed Aliyev, and Rostislav Bukasov. 2025. "Quantum Dot-Based Luminescent Sensors: Review from Analytical Perspective" International Journal of Molecular Sciences 26, no. 14: 6674. https://doi.org/10.3390/ijms26146674
APA StyleLoskutova, A., Seitkali, A., Aliyev, D., & Bukasov, R. (2025). Quantum Dot-Based Luminescent Sensors: Review from Analytical Perspective. International Journal of Molecular Sciences, 26(14), 6674. https://doi.org/10.3390/ijms26146674