

Comparison of Quantification Using UV-Vis, NMR, and HPLC Methods of Retinol-Like Bakuchiol Present in Cosmetic Products

 ,
,  , and
, and 
Abstract
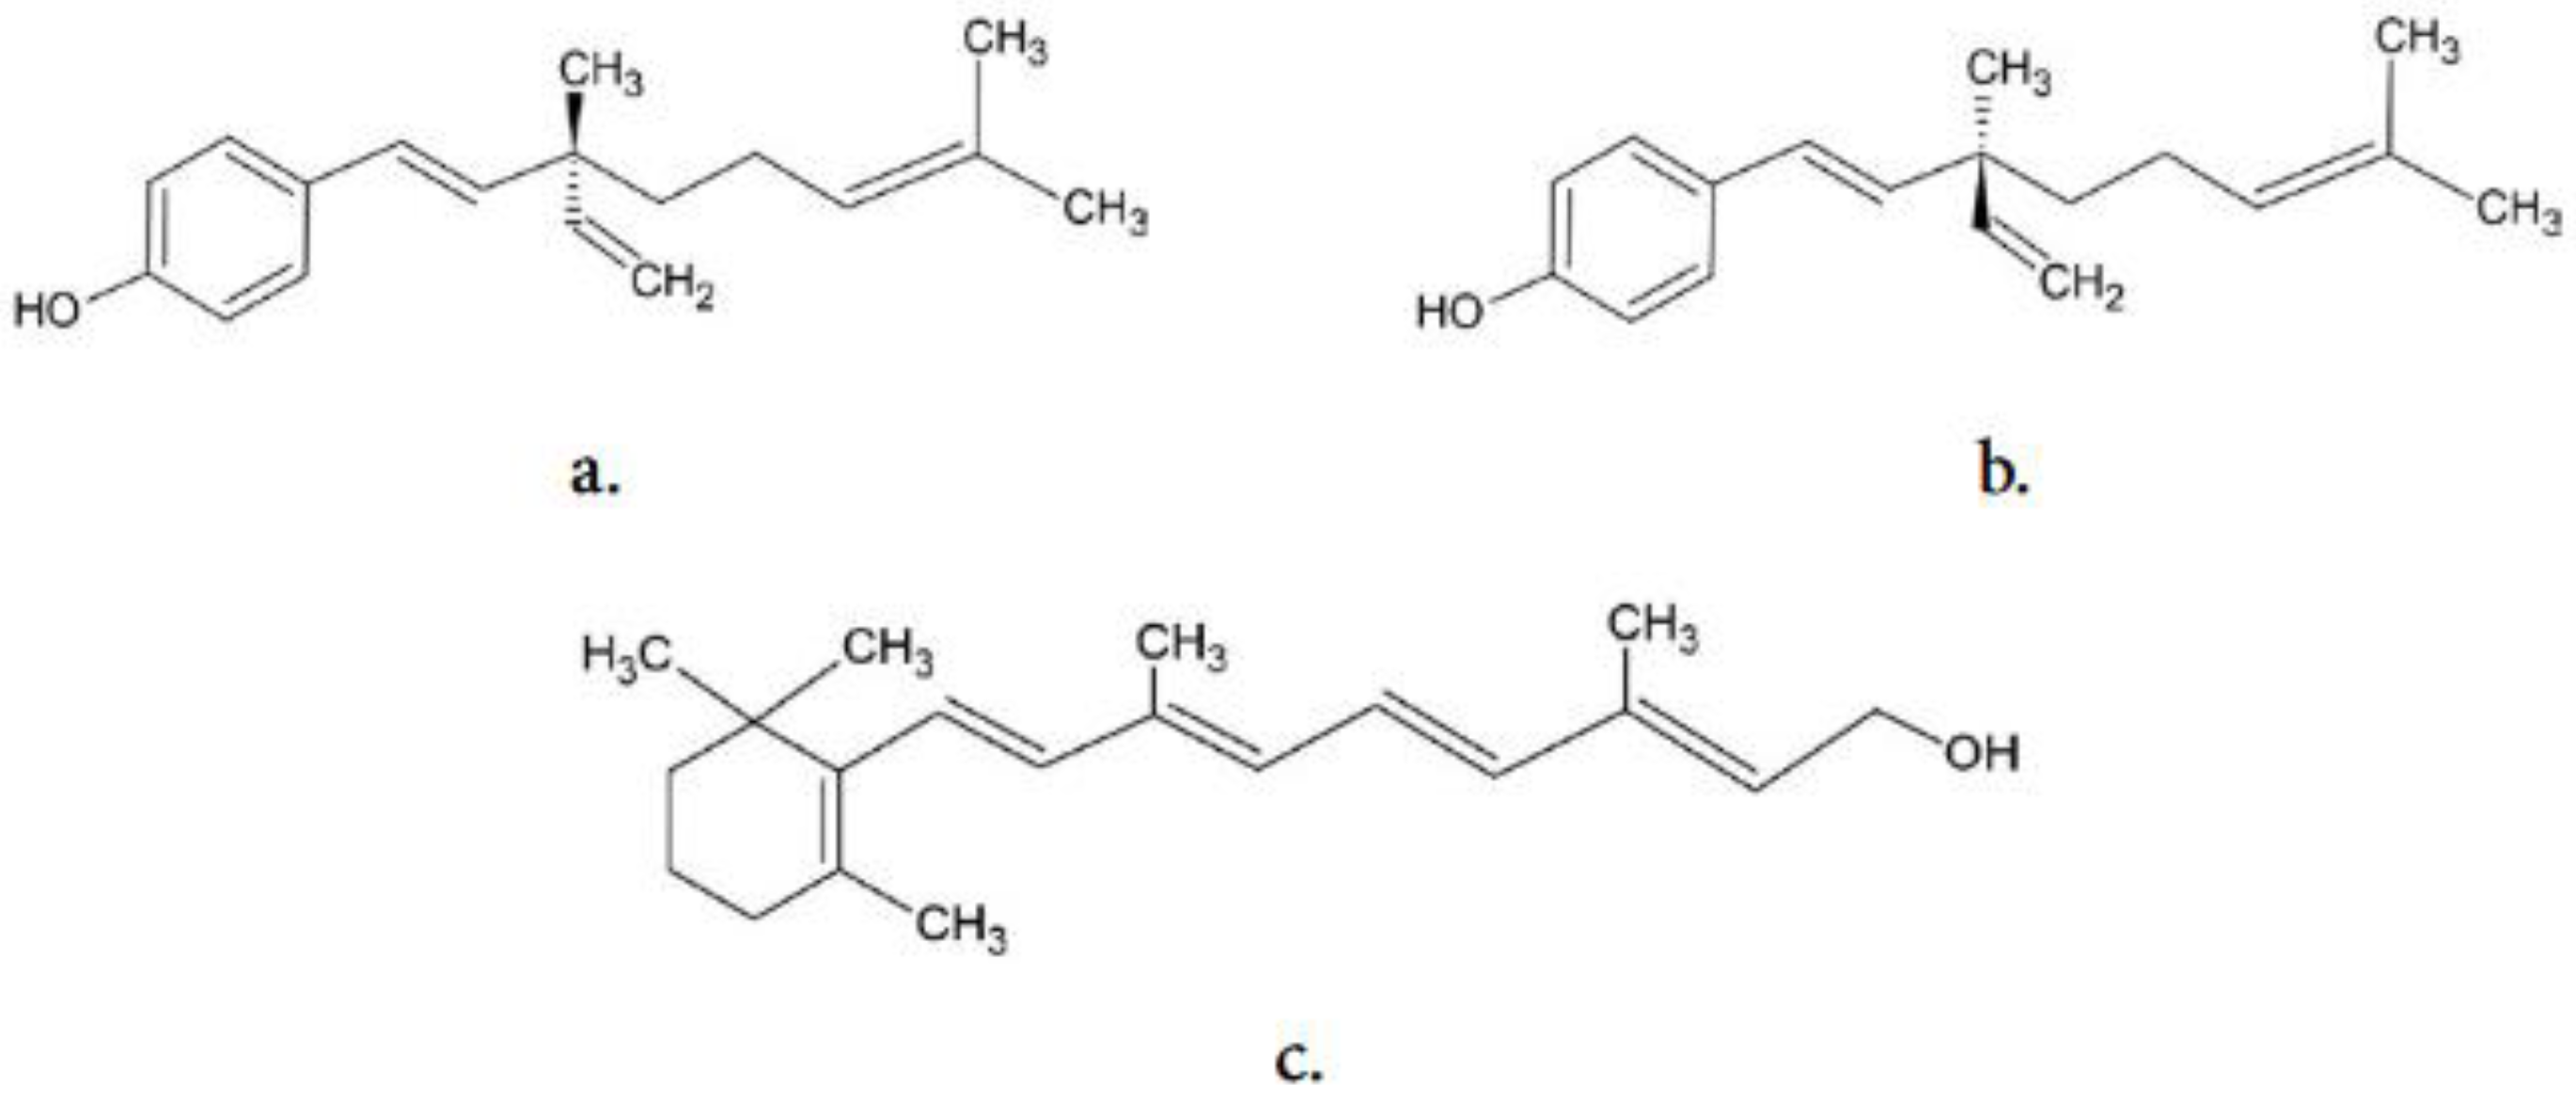
1. Introduction
2. Results
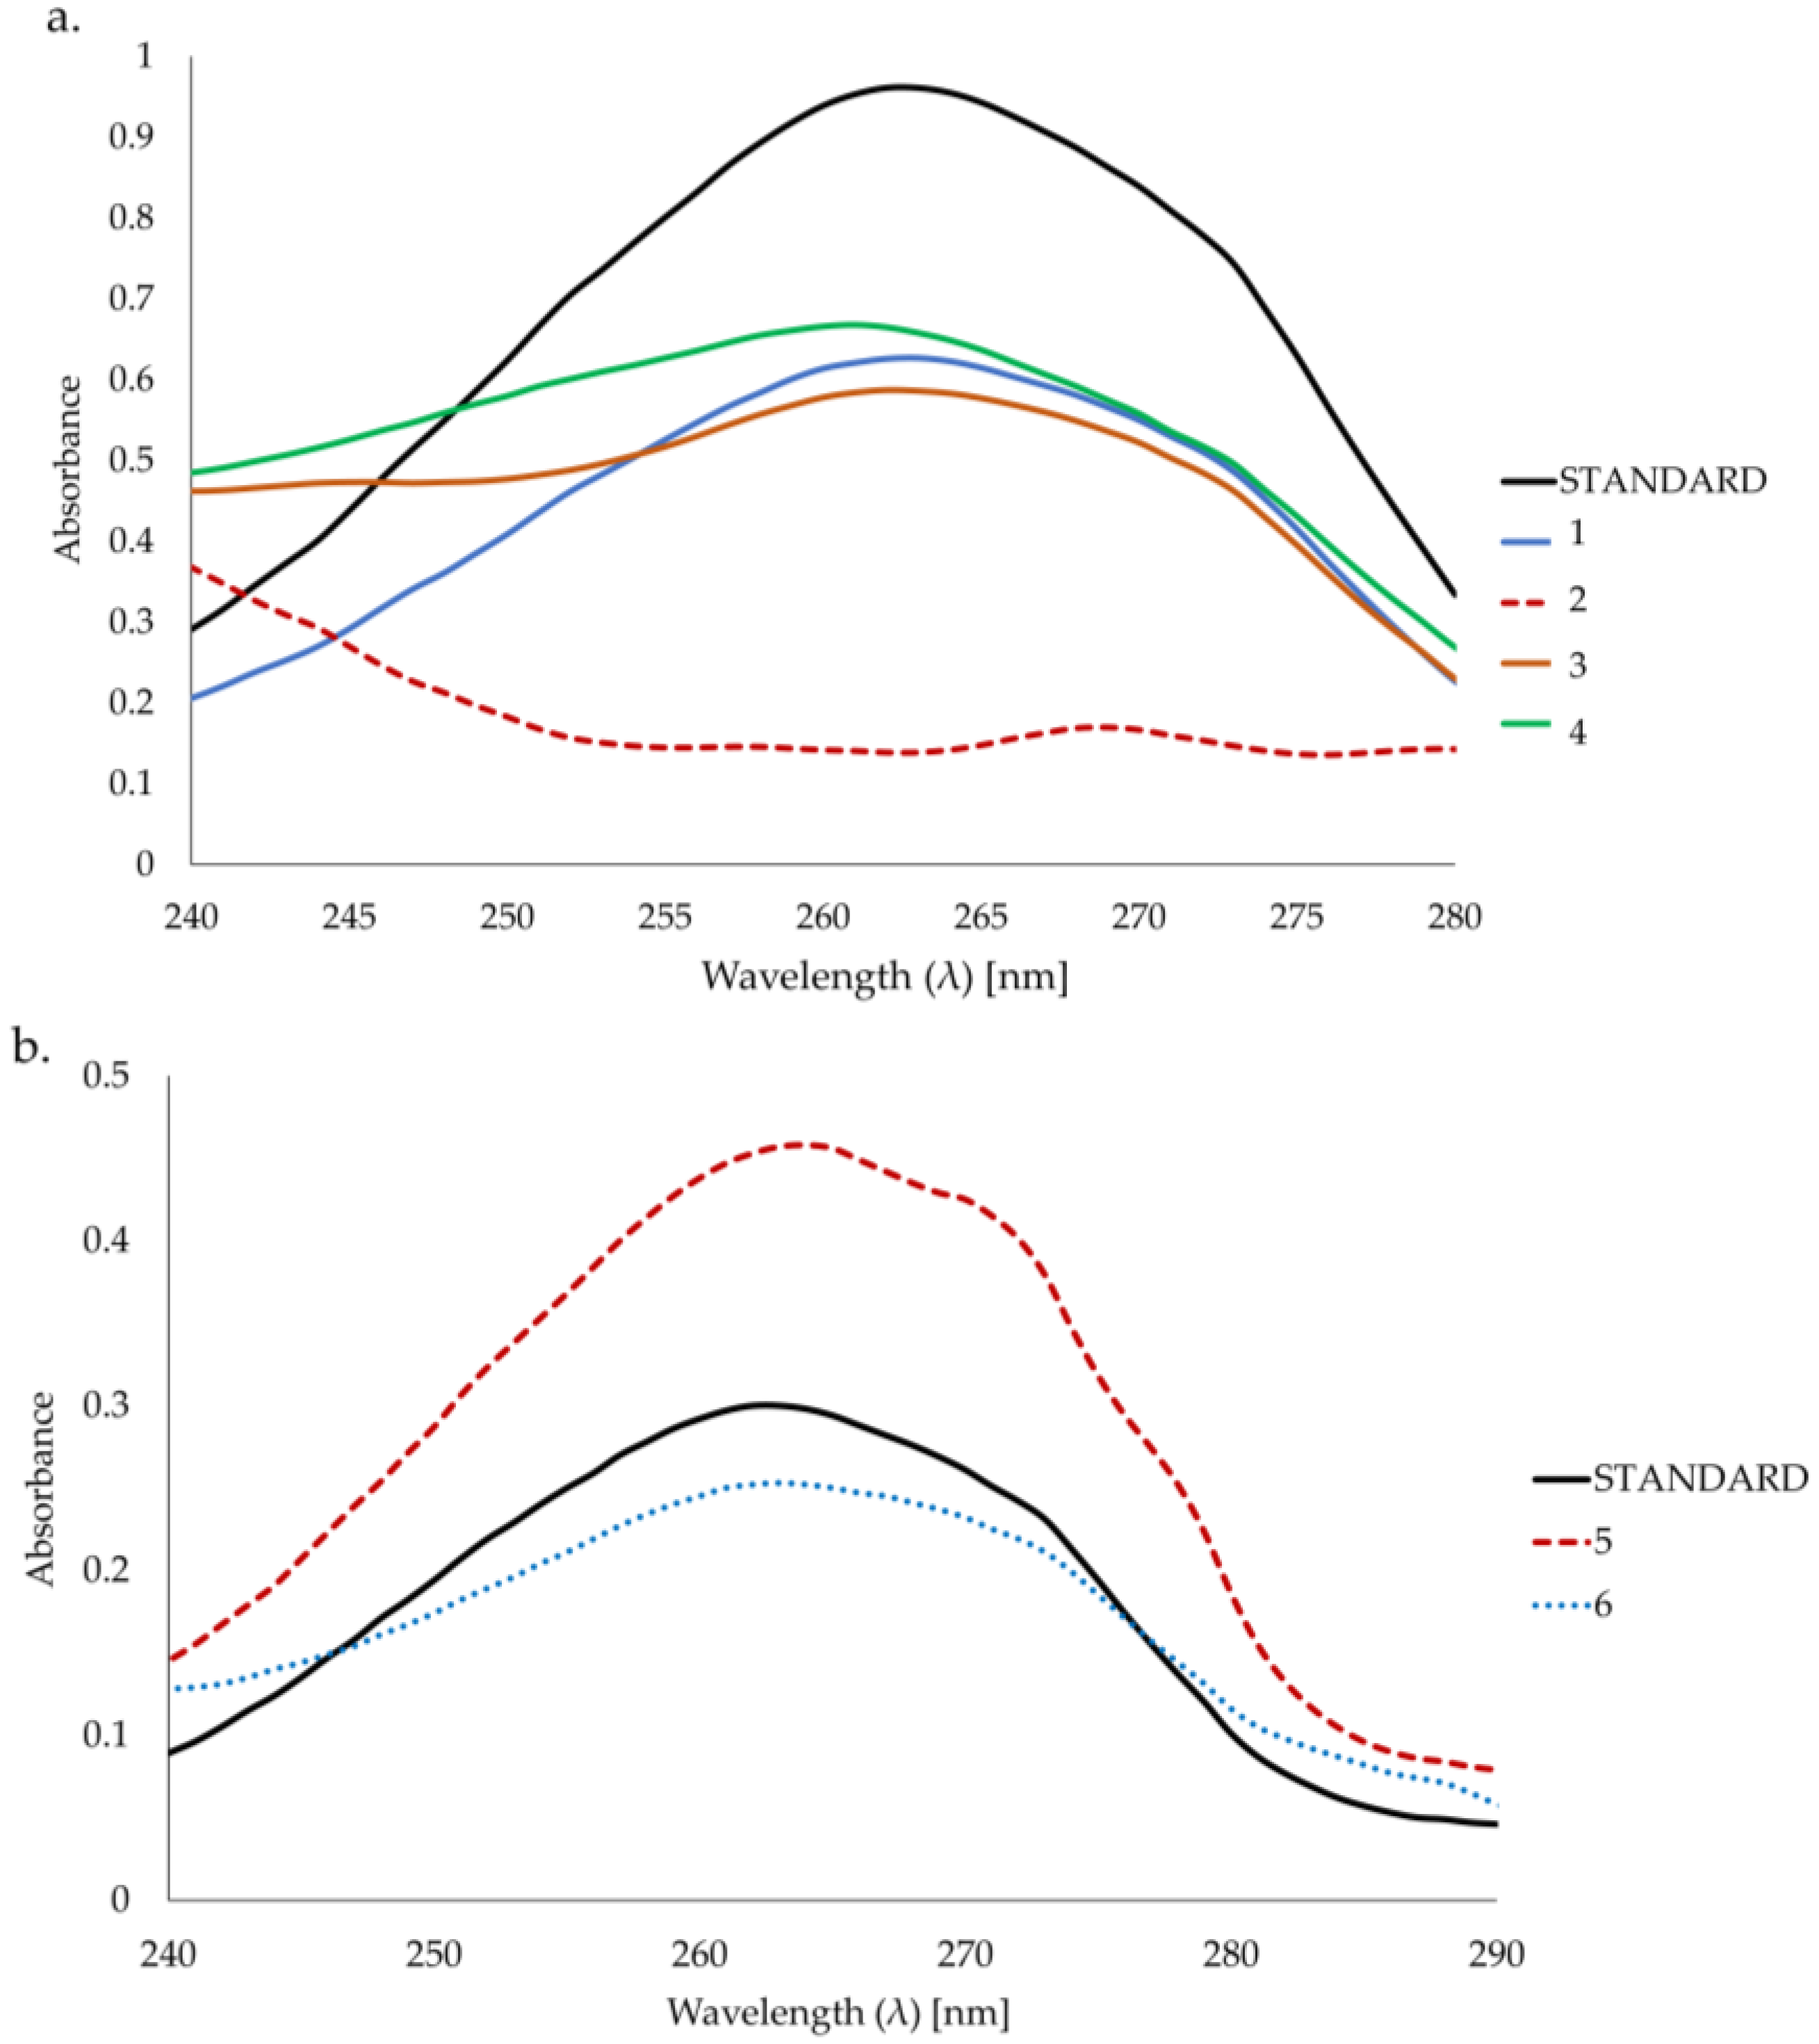
2.1. UV-Vis Analysis
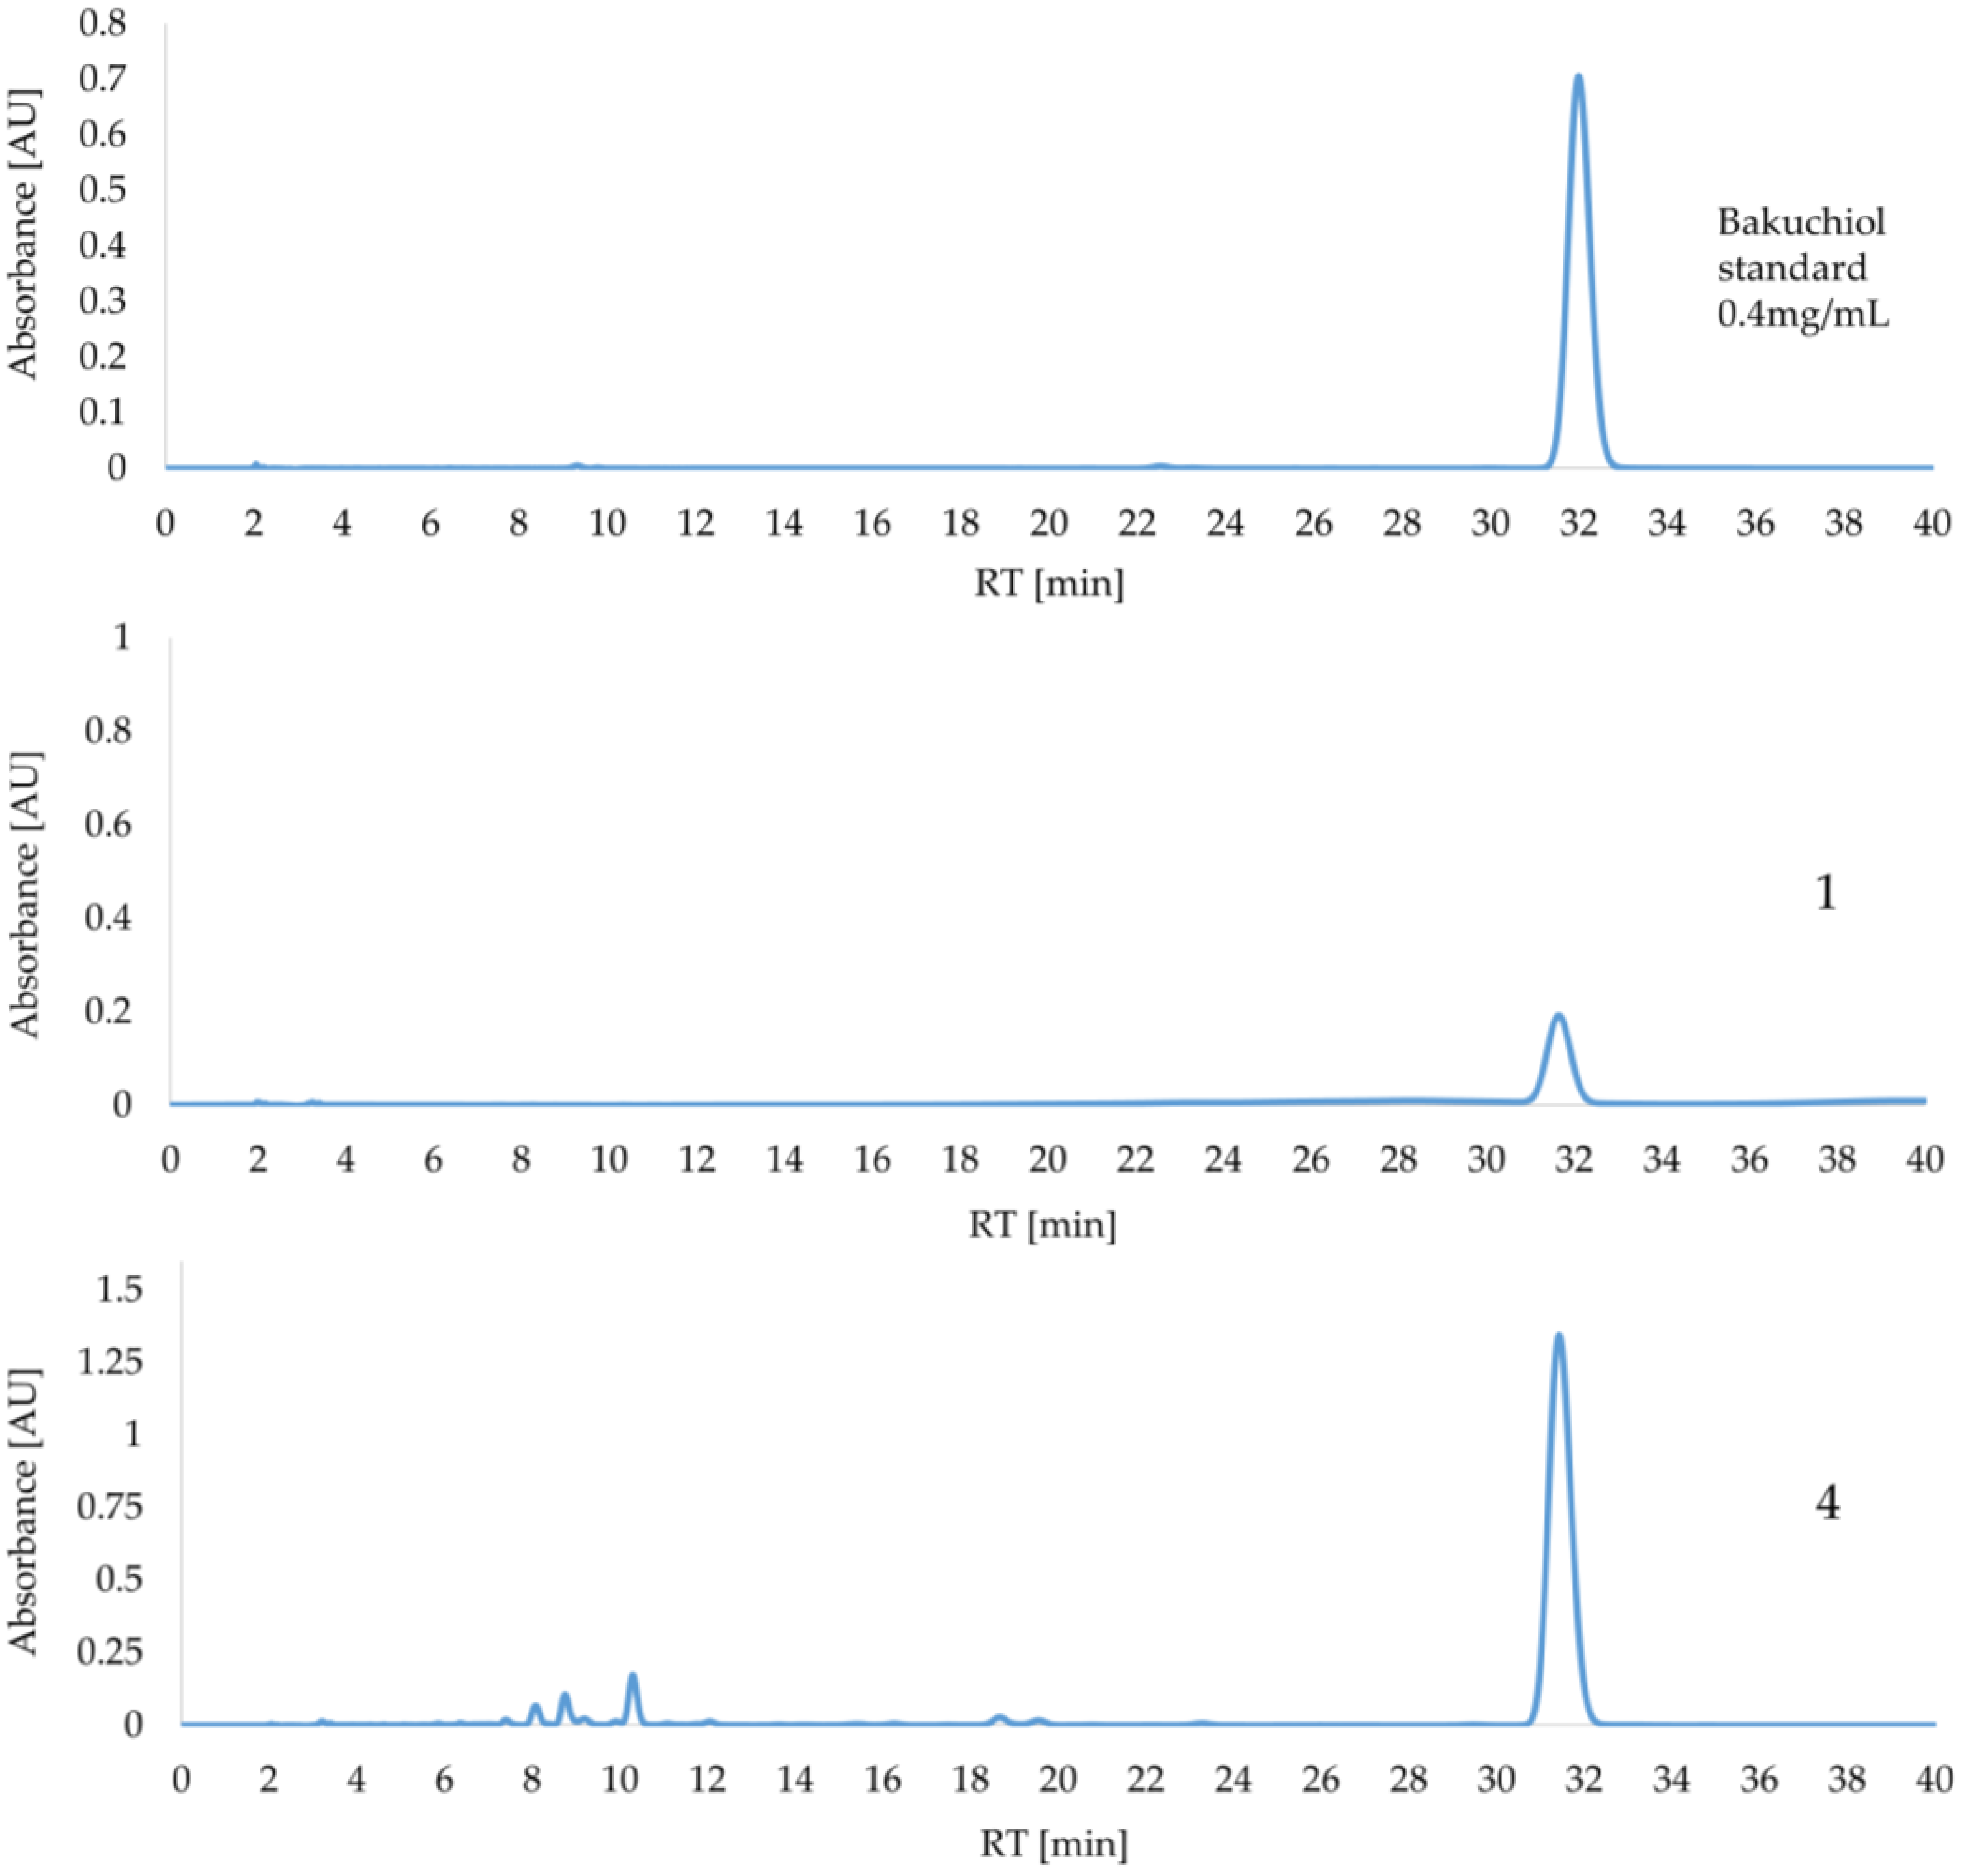
2.2. HPLC Analysis
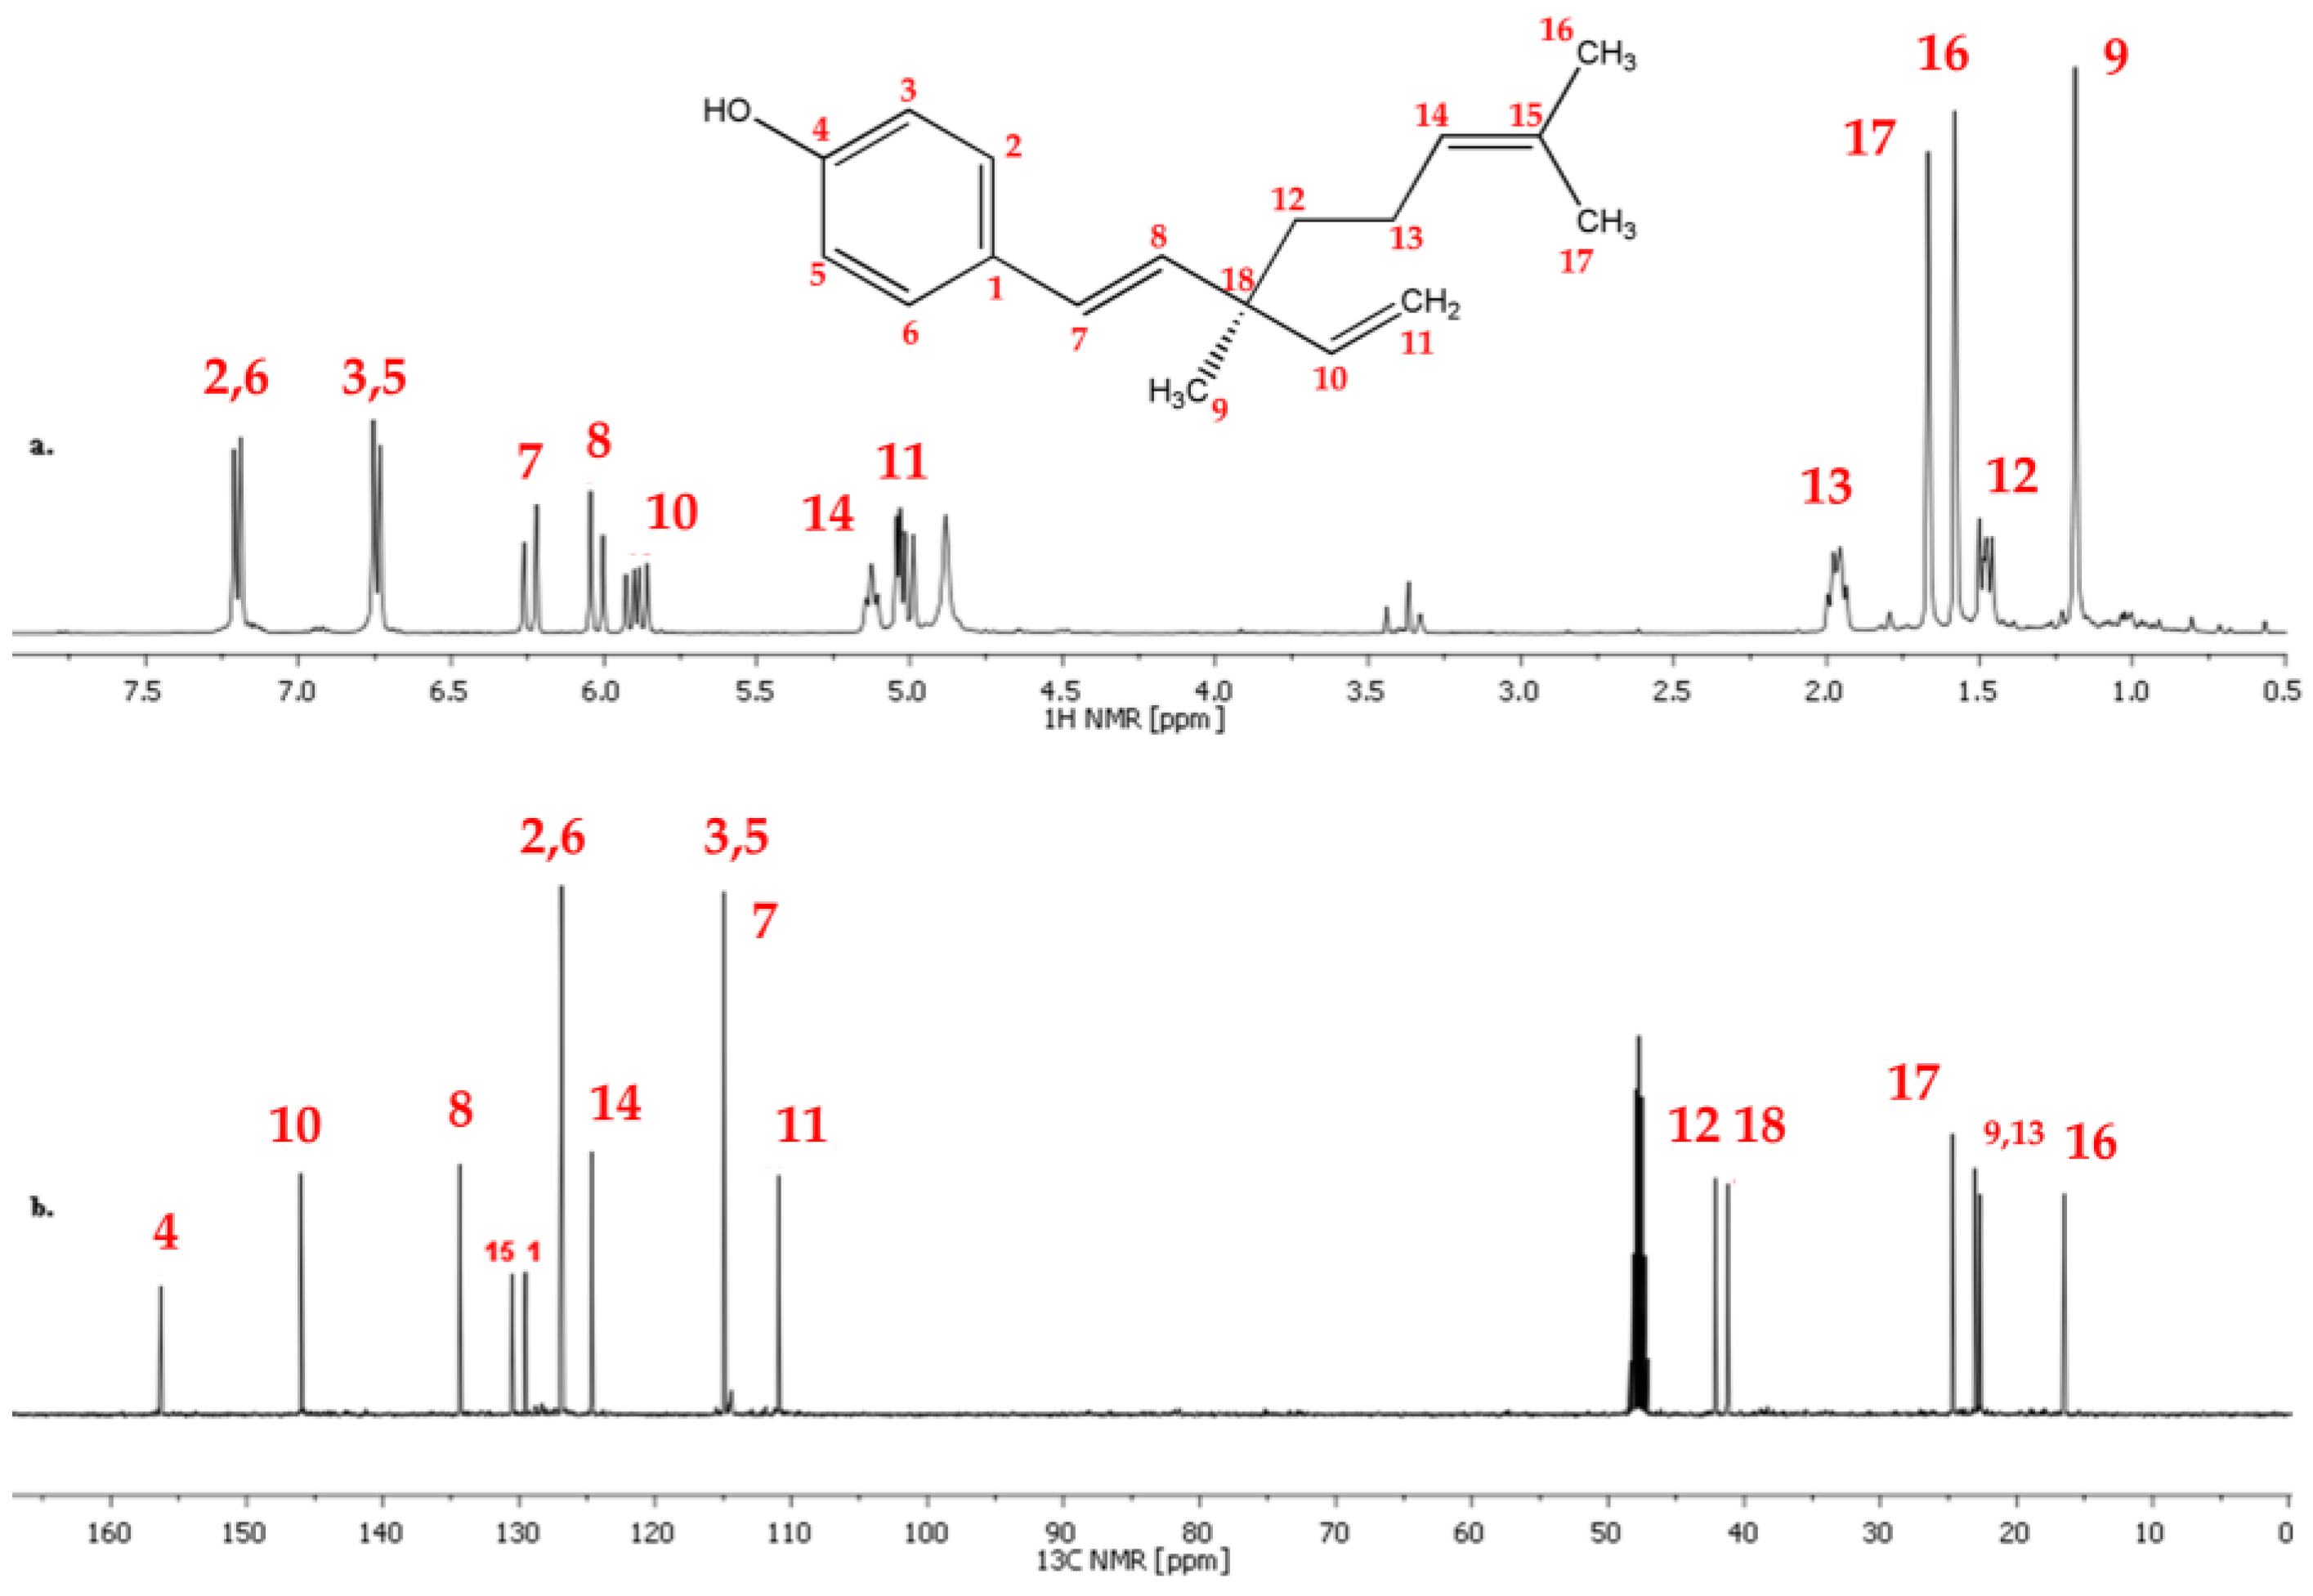
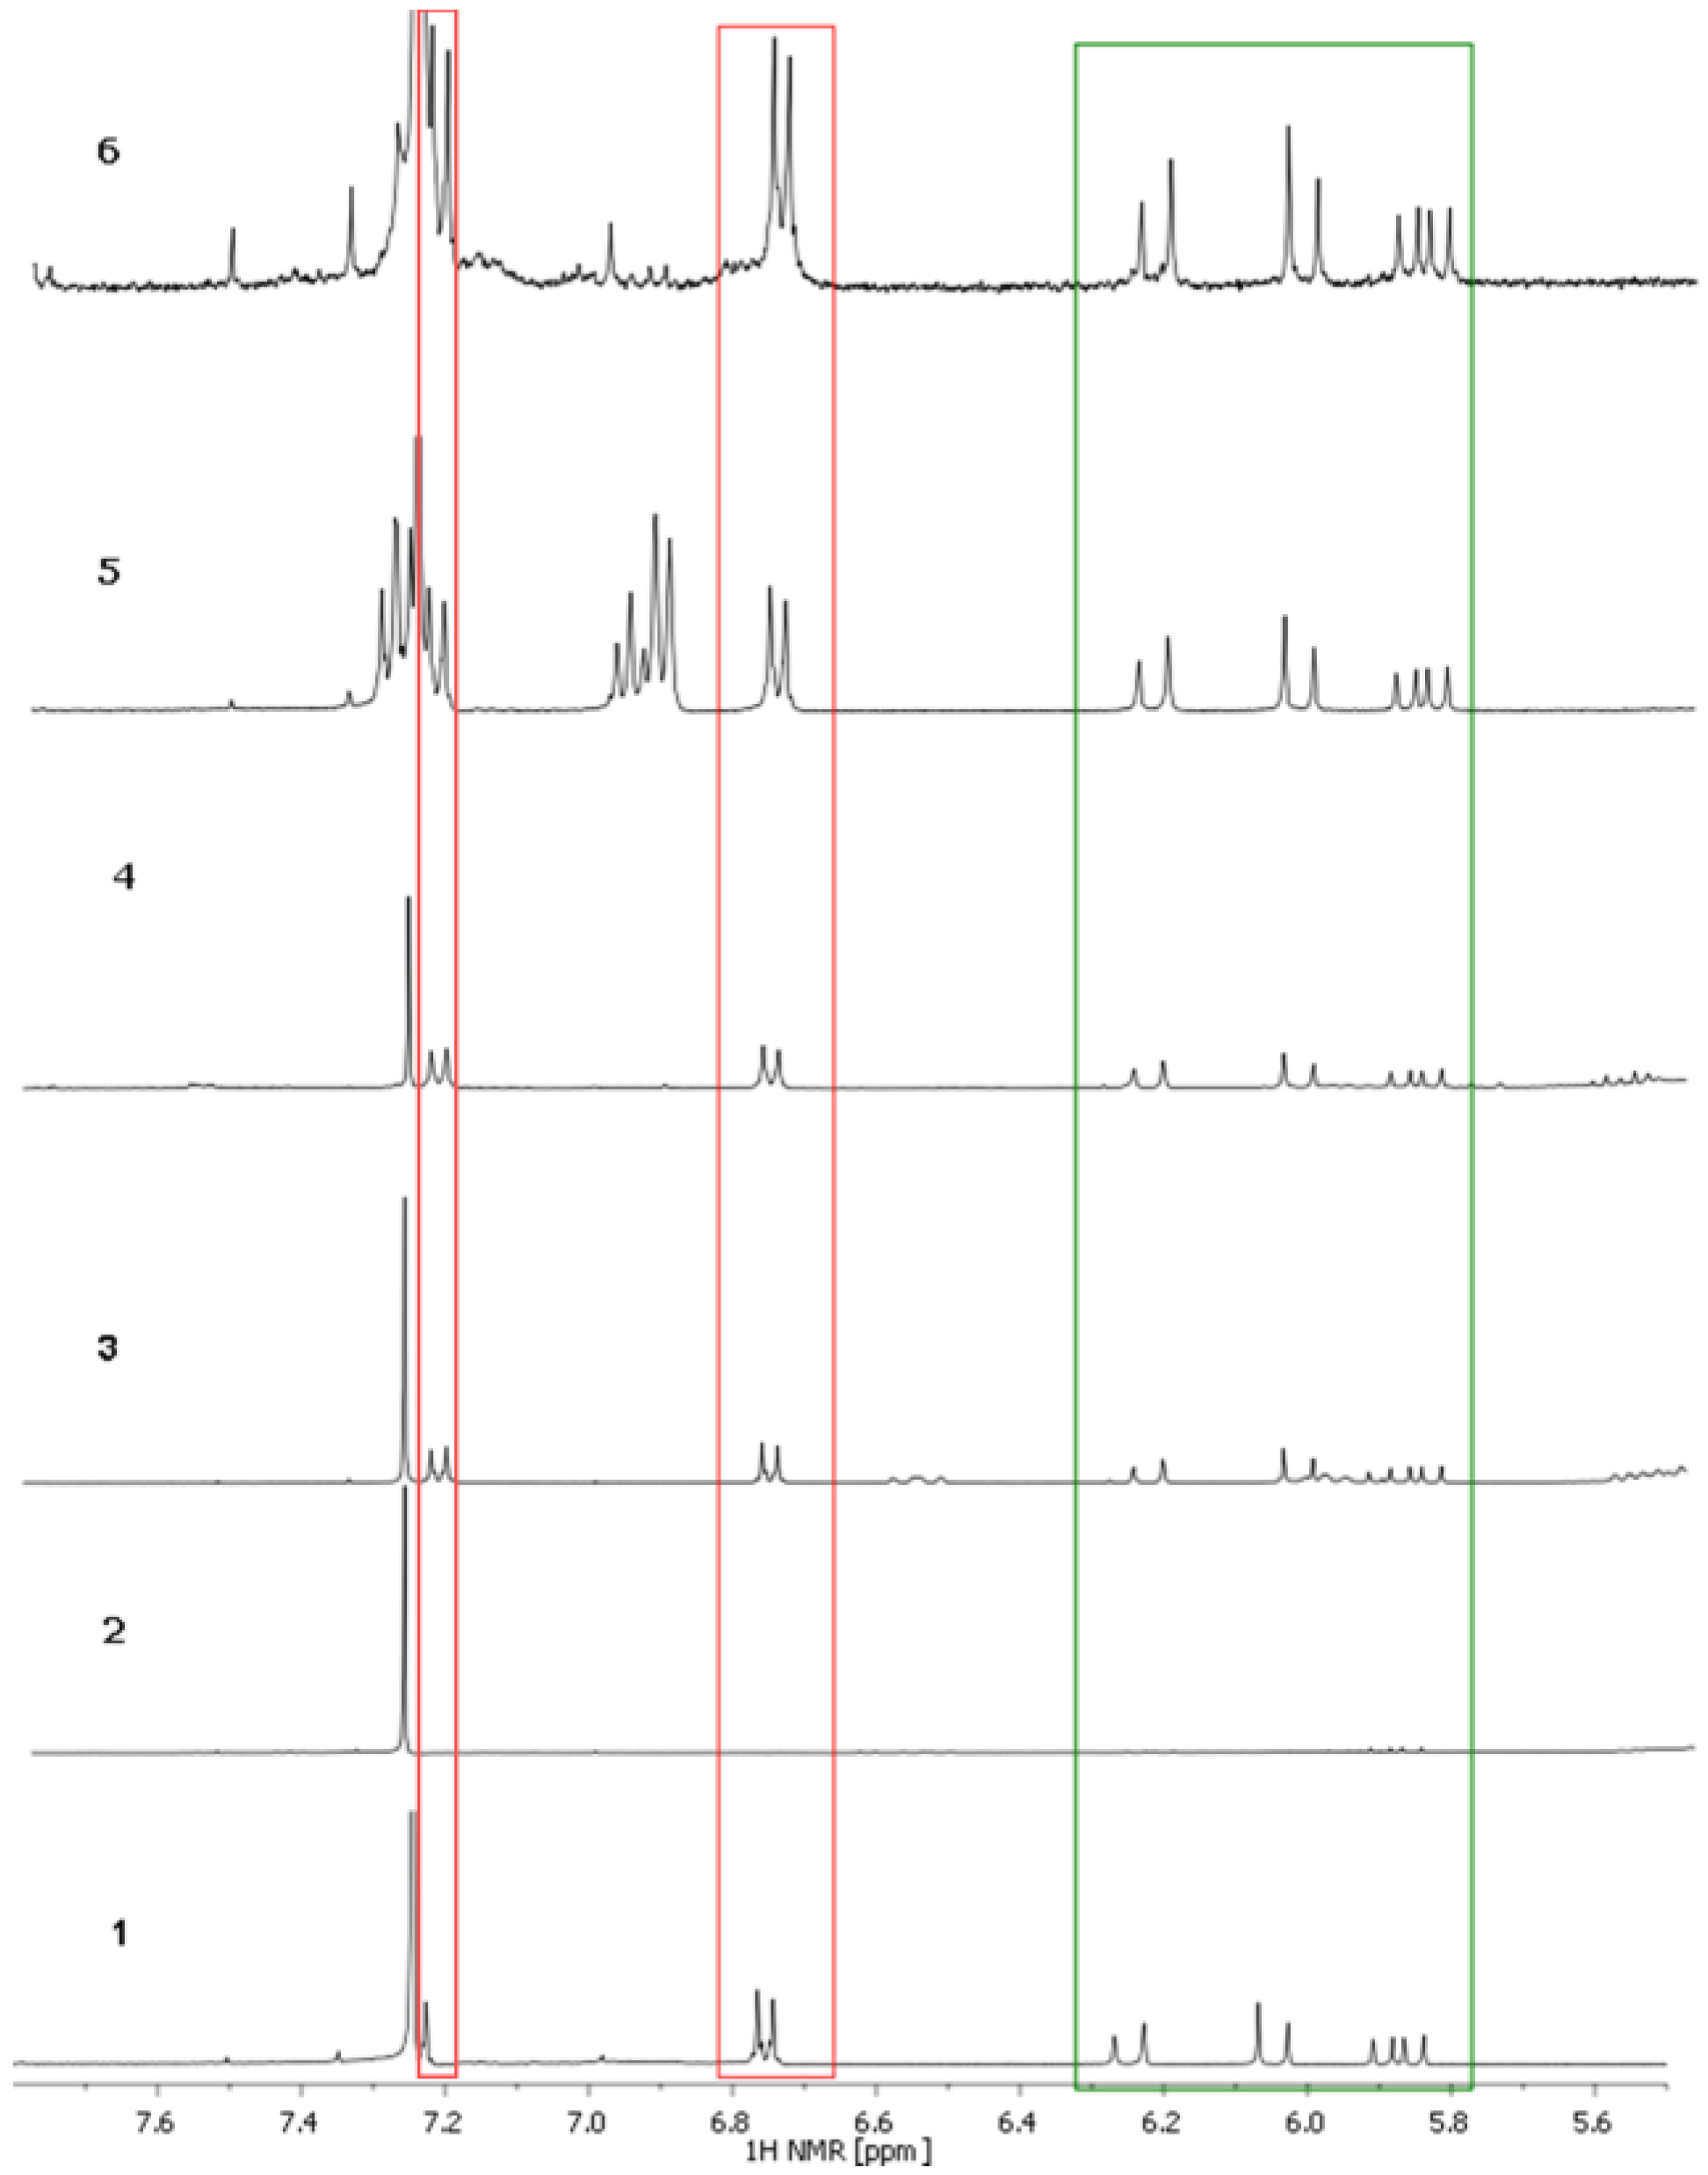
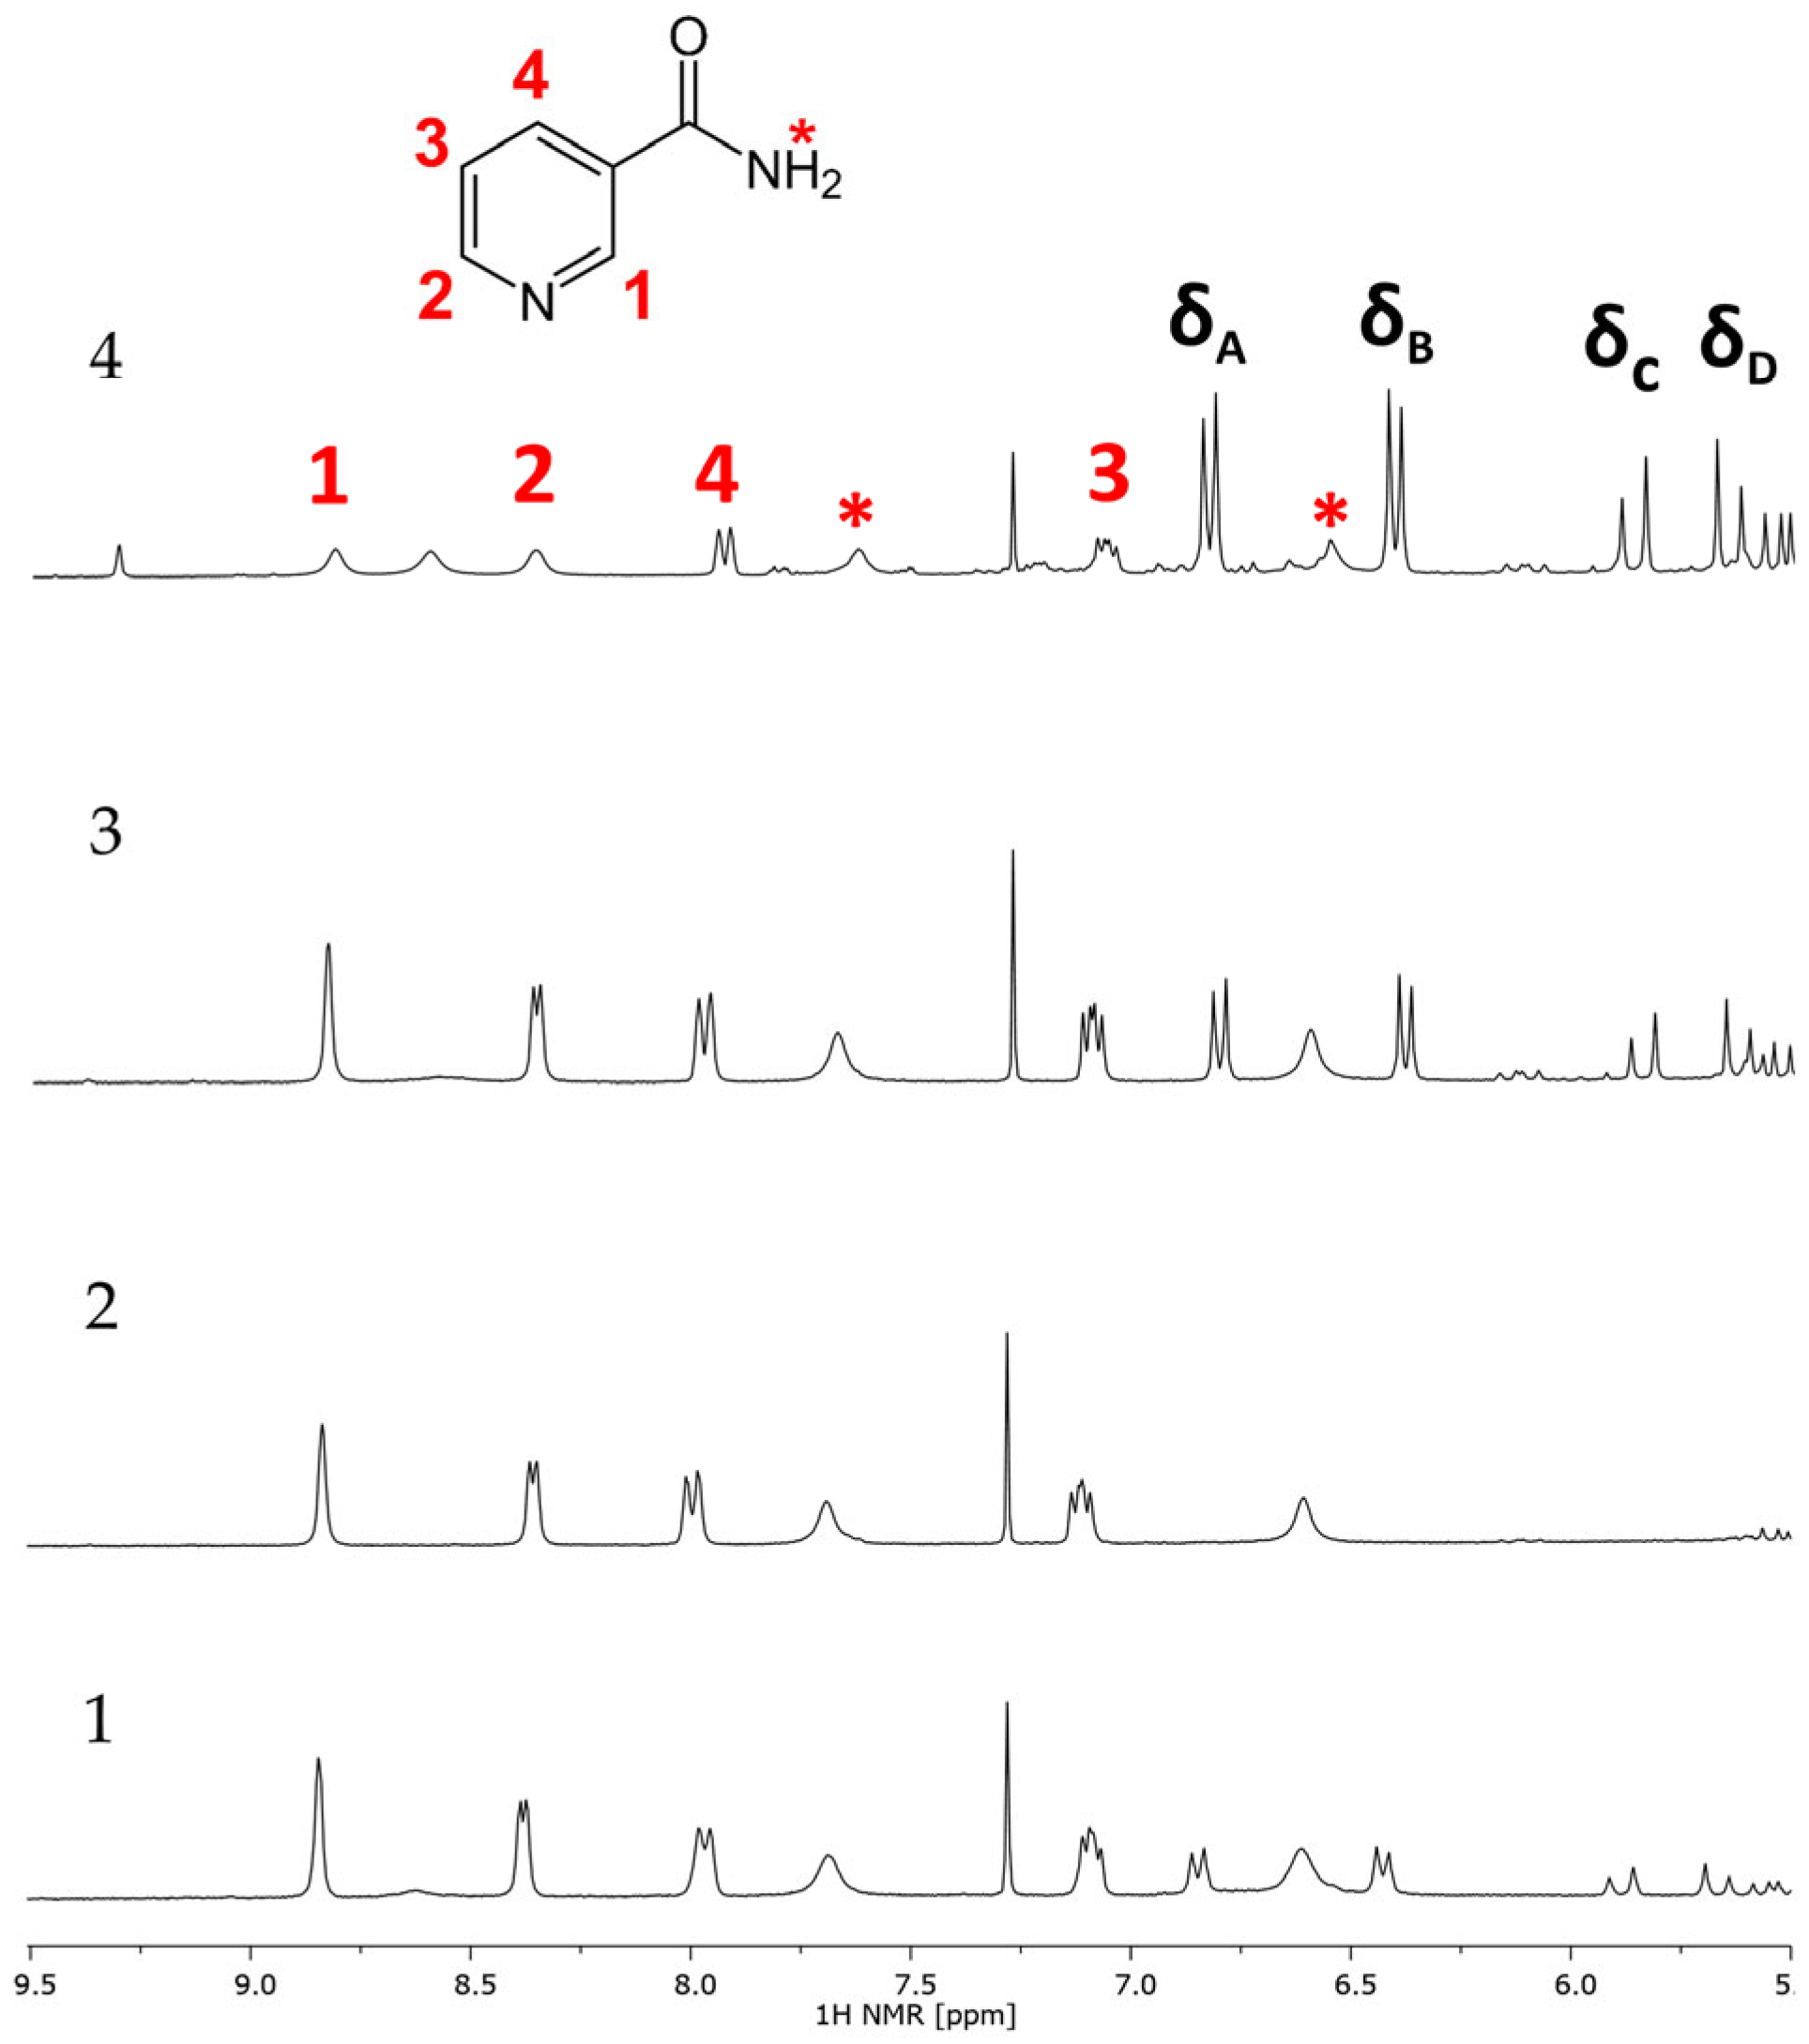
2.3. NMR Analysis
3. Discussion
4. Materials and Methods
4.1. Materials
4.2. Methods
4.2.1. UV-Vis
4.2.2. HPLC
4.2.3. 1H and 13C NMR
4.2.4. qNMR Internal Standard (IS)
5. Conclusions
Supplementary Materials
Author Contributions
Funding
Institutional Review Board Statement
Informed Consent Statement
Data Availability Statement
Conflicts of Interest
References
- Glass, G.E. Cosmeceuticals: The Principles and Practice of Skin Rejuvenation by Nonprescription Topical Therapy. Aesthet. Surg. J. Open Forum 2020, 2, ojaa038. [Google Scholar] [CrossRef] [PubMed]
- Fisher, G.J.; Voorhees, J.J. Molecular mechanisms of retinoid actions in skin. FASEB J. 1996, 10, 1002–1013. [Google Scholar] [CrossRef] [PubMed]
- Li, B.; Cai, S.-Y.; Boyer, J.L. The role of the retinoid receptor, RAR/RXR heterodimer, in liver physiology. Biochim. Biophys. Acta (BBA)-Mol. Basis Dis. 2021, 1867, 166085. [Google Scholar] [CrossRef] [PubMed]
- Adhikari, S.; Joshi, R.; Patro, B.S.; Ghanty, T.K.; Chintalwar, G.J.; Sharma, A.; Chattopadhyay, S.; Mukherjee, T. Antioxidant activity of bakuchiol: Experimental evidences and theoretical treatments on the possible involvement of the terpenoid chain. Chem. Res. Toxicol. 2003, 16, 1062–1069. [Google Scholar] [CrossRef]
- Chaudhuri, R.K.; Bojanowski, K. Bakuchiol: A retinol-like functional compound revealed by gene expression profiling and clinically proven to have anti-aging effects. Int. J. Cosmet. Sci. 2014, 36, 221–230. [Google Scholar] [CrossRef]
- Mehta, G.N.U.R.; Nayak, U.R.; Dev, S. Bakuchiol, a novel monoterpenoid. Tetrahedron Lett. 1966, 7, 4561–4567. [Google Scholar] [CrossRef]
- Prakasa Rao, A.S.C.; Bhalla, V.K.; Nayak, U.R. Meroterpenoids—II: Psoralea corylifolia Linn.—2. Absolute configuration of (+)-bakuchiol. Tetrahedron 1973, 29, 1127–1130. [Google Scholar]
- Banerji, A.; Chintalwar, G.J. Biosynthesis of bakuchiol from cinnamic and p-coumaric acids. Phytochemistry 1984, 23, 1605–1606. [Google Scholar] [CrossRef]
- Ruan, B.; Kong, L.-Y.; Takaya, Y.; Niwa, M. Studies on the chemical constituents of Psoralea corylifolia L. J. Asian Nat. Prod. Res. 2007, 9, 41–44. [Google Scholar] [CrossRef]
- Yao, S.; Yang, B.; Xu, Z. Determination of bakuchiol in the fruit of Psoralea corylifolia L. China J. Chin. Mater. Medica 1995, 20, 681–683. [Google Scholar]
- Rao, G.V.; Kavitha, K.; Gopalakrishnan, M.; Mukhopadhyay, T. Isolation and characterization of a potent antimicrobial compound from Aerva sanguinolenta Blume: An alternative source of bakuchiol. J. Pharm. Res. 2012, 5, 174–176. [Google Scholar]
- Ohno, O.; Watabe, T.; Nakamura, K.; Kawagoshi, M.; Uotsu, N.; Chiba, T.; Yamada, M.; Yamaguchi, K.; Yamada, K.; Miyamoto, K.; et al. Inhibitory effects of bakuchiol, bavachin, and isobavachalcone isolated from Piper longum on melanin production in B16 mouse melanoma cells. Biosci. Biotechnol. Biochem. 2010, 74, 1504–1506. [Google Scholar] [CrossRef] [PubMed]
- Choi, S.Y.; Lee, S.; Choi, W.H.; Lee, Y.; Jo, Y.O.; Ha, T.Y. Isolation and anti-inflammatory activity of Bakuchiol from Ulmus davidiana var. japonica. J. Med. Food 2010, 13, 1019–1023. [Google Scholar] [CrossRef] [PubMed]
- Krenisky, J.M.; Luo, J.; Reed, M.J.; Carney, J.R. Isolation and antihyperglycemic activity of bakuchiol from Otholobium pubescens (Fabaceae), a Peruvian medicinal plant used for the treatment of diabetes. Biol. Pharm. Bull. 1999, 22, 1137–1140. [Google Scholar] [CrossRef]
- Lystvan, K.; Belokurova, V.; Sheludko, Y.; Ingham, J.L.; Prykhodko, V.; Kishchenko, O.; Paton, E.; Kuchuk, M. Production of bakuchiol by in vitro systems of Psoralea drupacea Bge. Plant Cell Tissue Organ Cult. (PCTOC) 2010, 101, 99–103. [Google Scholar] [CrossRef]
- Backhouse, N.; Delporte, C.; Negrete, R.; Salinas, P.; Pinto, A.; Aravena, S.; Cassels, B.K. Active constituents isolated from Psoralea glandulosa L. with antiinflammatory and antipyretic activities. J. Ethnopharmacol. 2001, 78, 27–31. [Google Scholar] [CrossRef]
- Hsu, P.J.; Miller, J.S.; Berger, J.M. Bakuchiol, an antibacterial component of Psoralidium tenuiflorum. Nat. Prod. Res. 2009, 23, 781–788. [Google Scholar] [CrossRef]
- Chaudhuri, R.K. Bakuchiol: A retinol-like functional compound, modulating multiple retinol and non-retinol targets. In Cosmeceuticals and Active Cosmetics, 3rd ed.; Taylor & Francis Group: Boca Raton, FL, USA, 2015; pp. 1–8. [Google Scholar]
- Mascarenhas-Melo, F.; Ribeiro, M.M.; Kahkesh, K.H.; Parida, S.; Pawar, K.D.; Velsankar, K.; Jha, N.K.; Damiri, F.; Costa, G.; Veiga, F.; et al. Comprehensive review of the skin use of bakuchiol: Physicochemical properties, sources, bioactivities, nanotechnology delivery systems, regulatory and toxicological concerns. Phytochem. Rev. 2024, 23, 1377–1413. [Google Scholar] [CrossRef]
- Raj, M.G.; Rani, M.P.; Rameshkumar, K. Detection of coconut oil adulteration with palm oil through NMR spectroscopic method. Grasas Y Aceites 2024, 75, 2012. [Google Scholar]
- Jeong, M.; Hong, T.; Lee, K.; Hwangbo, H.; Kim, M.; Ma, W.; Zahn, M. HPLC method for simultaneous quantification of bakuchiol and minor furocoumarins in bakuchiol extract from Psoralea corylifolia. J. AOAC Int. 2015, 98, 902–906. [Google Scholar] [CrossRef]
- Sanches Filho, P.J.; Silveira, L.A.; Betemps, G.R.; Oliveira, P.K.; Sampaio, D.M.; de los Santos, D.G. Use of lyophilization as analytical strategy for chromatographic characterization of aqueous phase of bio-oil produced by rice husk pyrolysis. Microchem. J. 2020, 152, 104457. [Google Scholar] [CrossRef]
- Kurpet, K.; Chwatko, G. Development of a new chromatographic method for the determination of bakuchiol in cosmetic products. Sci. Rep. 2023, 13, 13893. [Google Scholar] [CrossRef] [PubMed]
- Pramod, K.; Ilyas, U.K.; Kamal, Y.T.; Ahmad, S.; Ansari, S.H.; Ali, J. Development and validation of RP-HPLC-PDA method for the quantification of eugenol in developed nanoemulsion gel and nanoparticles. J. Anal. Sci. Technol. 2013, 4, 1–6. [Google Scholar] [CrossRef]


| Sample | Declared Bakuchiol Content | Ingredients (INCI) |
|---|---|---|
| 1 | 1% | Squalane, Bakuchiol |
| 2 | No declaration | Caprylic/Capric Triglyceride, Coco-Caprylate/Caprate, Helianthus Annuus (Sunflower) Seed Oil, Squalane, Bakuchiol, Bacillus Ferment Lysate, Mangifera Indica (Mango) Seed Butter, Tocopherol, Parfum, Citral, Citronellol, Geraniol, Limonene, Linalool |
| 3 | 1% | Argania Spinosa Kernel Oil, Prunus Amygdalus Dulcis Oil, Vitis Vinifera Seed Oil, Caprylic/Capric Triglycerides, Squalane, Coco-Caprylate, Bakuchiol, Isoamyl Laurate, Isoamyl Cocoate, Oenothera Biennis Seed Oil, Carum Petroselinum Seed Oil, Rosa Canina (Fruit) Oil, Simmondsia Chinensis Seed Oil, Rubus Idaeus Seed Oil |
| 4 | No declaration | Squalane (Olive), Alpha Lipoic Acid, Bakuchiol, Geraniol, Linalool, Citral, Limonene |
| 5 | 1% | Aqua, Propanediol, Isopropyl myristate, Caprylic/capric triglyceride, Vitis vinifera seed oil, Bakuchiol, Phenoxyethanol, Polyacrylamide, Xanthan gum, C13–14 isoparaffin, Titanium dioxide, Laureth-7, Ethylhexylglycerin, Ci 17200 (red 33), Ci 42090 (blue 1) |
| 6 | No declaration | Aqua, Rosa damascena flower water, Alcohol, Xanthan gum, Glycerin, Bakuchiol, Parfum, Citric acid, Benzyl salicylate, Tartaric acid, Lactic acid, Citronellol, Limonene, Geraniol |
| δ 1H [ppm] | δ 13C [ppm] | |
|---|---|---|
| 1 | - | 129 |
| 2 | 7.20 | 126 |
| 3 | 6.74 | 115 |
| 4 | - | 155 |
| 5 | 6.74 | 115 |
| 6 | 7.20 | 126 |
| 7 | 6.24 | 126 |
| 8 | 6.02 | 134 |
| 9 | 1.19 | 22 |
| 10 | 5.90 | 146 |
| 11 | 5.03 | 111 |
| 12 | 1.48 | 41 |
| 13 | 1.97 | 23 |
| 14 | 5.12 | 124 |
| 15 | - | 130 |
| 16 | 1.58 | 16 |
| 17 | 1.68 | 25 |
| 18 | - | 42 |
| Declared Bakuchiol Content | Result ± SD | |||
|---|---|---|---|---|
| Sample | NMR-IS | UV-Vis | HPLC-DAD | |
| 1 | 1% | 0.59% ± 0.06 | 0.55% ± 0.001 | 0.51 ± 0.01 |
| 2 | No declaration | ND | 0.17% ± 0.001 | ND |
| 3 | 1% | 0.83% ± 0.01 | 1.04% ± 0.001 | 1.06 ± 0.01 |
| 4 | No declaration | 3.57% ± 0.21 | 3.99% ± 0.004 | 3.62 ± 0.01 |
| 5 | 1% | - | 0.45% ± 0.001 | - |
| 6 | No declaration | - | 0.23% ± 0.001 | - |
| Calibration Curve | R2 | Linear Range (µg/mL) | LOD (µg/mL) | LOQ (µg/mL) |
|---|---|---|---|---|
| A = 0.0699 C − 0.0724 | 0.999 | 5–30 | 0.88 | 2.67 |
| Calibration Curve | R2 | RT [min] | Linear Range (mg/mL) | LOD (mg/mL) | LOQ (mg/mL) |
|---|---|---|---|---|---|
| A = 45,717,172 C − 6656 | 0.997 | 31.8 | 0.05–0.5 | 0.023 | 0.069 |
Disclaimer/Publisher’s Note: The statements, opinions and data contained in all publications are solely those of the individual author(s) and contributor(s) and not of MDPI and/or the editor(s). MDPI and/or the editor(s) disclaim responsibility for any injury to people or property resulting from any ideas, methods, instructions or products referred to in the content. |
© 2025 by the authors. Licensee MDPI, Basel, Switzerland. This article is an open access article distributed under the terms and conditions of the Creative Commons Attribution (CC BY) license (https://creativecommons.org/licenses/by/4.0/).
Share and Cite
Grzelecka, M.; Siudem, P.; Tyburc, N.; Triyasmono, L.; Holzgrabe, U.; Paradowska, K. Comparison of Quantification Using UV-Vis, NMR, and HPLC Methods of Retinol-Like Bakuchiol Present in Cosmetic Products. Int. J. Mol. Sci. 2025, 26, 6638. https://doi.org/10.3390/ijms26146638
Grzelecka M, Siudem P, Tyburc N, Triyasmono L, Holzgrabe U, Paradowska K. Comparison of Quantification Using UV-Vis, NMR, and HPLC Methods of Retinol-Like Bakuchiol Present in Cosmetic Products. International Journal of Molecular Sciences. 2025; 26(14):6638. https://doi.org/10.3390/ijms26146638
Chicago/Turabian StyleGrzelecka, Matylda, Paweł Siudem, Natalia Tyburc, Liling Triyasmono, Ulrike Holzgrabe, and Katarzyna Paradowska. 2025. "Comparison of Quantification Using UV-Vis, NMR, and HPLC Methods of Retinol-Like Bakuchiol Present in Cosmetic Products" International Journal of Molecular Sciences 26, no. 14: 6638. https://doi.org/10.3390/ijms26146638
APA StyleGrzelecka, M., Siudem, P., Tyburc, N., Triyasmono, L., Holzgrabe, U., & Paradowska, K. (2025). Comparison of Quantification Using UV-Vis, NMR, and HPLC Methods of Retinol-Like Bakuchiol Present in Cosmetic Products. International Journal of Molecular Sciences, 26(14), 6638. https://doi.org/10.3390/ijms26146638