1. Introduction
Alzheimer’s disease (AD), the predominant form of dementia, represents an urgent health challenge worldwide. With the increase in life expectancy, the incidence of AD is generally increasing as well, and it is estimated to be doubled by 2050. AD is a progressive neurodegenerative disorder characterized by initial memory impairment and cognitive decline. The causes are not yet well known; nevertheless, aging, genetics, and the environment seem to be the factors involved [
1]. AD is marked by memory loss and cognitive decline that become worse over time. This is caused by neuropathological features like β-amyloid (Aβ) plaques, neurofibrillary tangles (NFTs), astrogliosis, and neuronal loss, which are all closely linked to oxidative stress, mitochondrial dysfunction, and regulated cell death pathways [
2,
3,
4,
5,
6,
7]. Reactive oxygen species (ROS) are produced mostly by altered mitochondria; they increase Aβ and tau accumulation and cause neuroinflammation and cell death. These changes disrupt neuronal homeostasis and contribute to synaptic failure and cognitive decline. AD causes the dysregulation of important signaling proteins that are essential in neuronal survival and plasticity, including CREB and ERK. Oxidative stress caused by Aβ may inhibit the transcription of neuroprotective genes such as BDNF through CREB, and abnormal ERK activity has been linked to inflammation and tau phosphorylation [
8,
9]. Current FDA-approved treatments, such as memantine, acetylcholinesterase inhibitors, and anti-amyloid antibodies, may alleviate symptoms or target disease-modifying pathways, but their long-term effectiveness is still unknown, and their clinical advantages are still restricted [
10]. Pulsed electromagnetic fields (PEMFs) are non-invasive biophysical stimuli that can alter cellular function. PEMFs can influence the cell membrane and its embedded molecules, including voltage-gated calcium channels, due to the very high gradient of the electric field at this location, affecting differentiation and proliferation. In addition, they reduce oxidative stress, improve mitochondrial function, and enhance synaptic plasticity [
11]. Regarding their effects on neurons, data suggest that they can control molecular pathways such as PI3K/Akt, CREB, and MAPK/ERK, which supports the differentiation and survival of human bone marrow-derived mesenchymal stem cells [
12]. PEMFs have shown anti-inflammatory and anti-apoptotic properties, along with increased neuronal survival, in both in vitro and in vivo models of neurodegeneration. Through a number of molecular pathways, PEMFs may specifically have beneficial impacts by regulating cell viability, proliferation, apoptosis, and necrosis, which may have important neuroprotective effects at the neural level [
13]. PEMFs support neuronal survival against hypoxia by reducing ROS production, increasing antioxidant enzyme activity, and activating protective signaling cascades like the p38 MAPK pathway and CREB, according to experimental studies conducted using neuronal cell lines like PC12 and SH-SY5Y [
14,
15,
16,
17]. Furthermore, PEMFs support neuronal regeneration and plasticity by promoting the production of neurotrophic and anti-apoptotic proteins such as BDNF and Bcl-2 [
17,
18]. In terms of synaptic plasticity, PEMFs have been shown to influence neurite outgrowth and enhance intracellular cAMP levels, critical mediators of synaptic remodeling in MN9D dopaminergic neurons [
19]. Additionally, PEMFs may modulate gene expression in peripheral blood mononuclear cells, potentially rebalancing dysregulated pathways in AD, and stimulate epigenetic regulation via miRNAs, which could aid in disease management, although the underlying mechanisms remain to be fully elucidated and require further validation [
20]. Recently, in SHSY5Y and N9 cells insulted with hydrogen peroxide (H
2O
2) and with an analog of peptide Aβ
1-42, O-acyl isopeptide (CP), PEMFs reduced ROS, improved mitochondrial function, and reduced cell death, providing substantial evidence of their efficacy in mitigating neuronal damage [
15]. In this context, the present study aims to explore the potential neuroprotective effects of PEMFs in a PC12 cell model subjected to Aβ- and H
2O
2-induced injury. By assessing cell viability, mitochondrial function, oxidative stress, and the activation of relevant signaling pathways, this in vitro investigation seeks to contribute to the understanding of PEMF-mediated mechanisms of neuronal resilience.
3. Discussion
The aim of this study was to investigate the protective effects of PEMFs on rat neuron-like PC12 cells insulted with H
2O
2 and Aβ peptide in order to mimic key aspects of AD pathophysiology. Due to their neuronal characteristics and oxidative stress sensitivity, PC12 cells are widely used as an in vitro model for the study of AD-related mechanisms [
23]. H
2O
2 is a powerful oxidative stressor producing ROS in PC12 cells, thus exacerbating oxidative damage [
24,
25]. Similarly, Aβ peptide contributes to the formation of senile plaques and induces oxidative stress through mitochondrial dysfunction and other cellular pathways. In particular, in PC12 cells, Aβ exposure leads to elevated ROS production, which in turn promotes cellular damage and apoptosis [
26,
27].
The present work offers a comprehensive view of the neuroprotective action of PEMFs, acting via the orchestrated modulation of multiple signaling pathways in NGF-differentiated PC12 cells exposed to oxidative and amyloidogenic insults. The data highlight that PEMFs do not act through a single molecular entity but through multitarget signaling that stabilizes the redox balance, suppresses pro-death agents, and activates neurotrophic pathways.
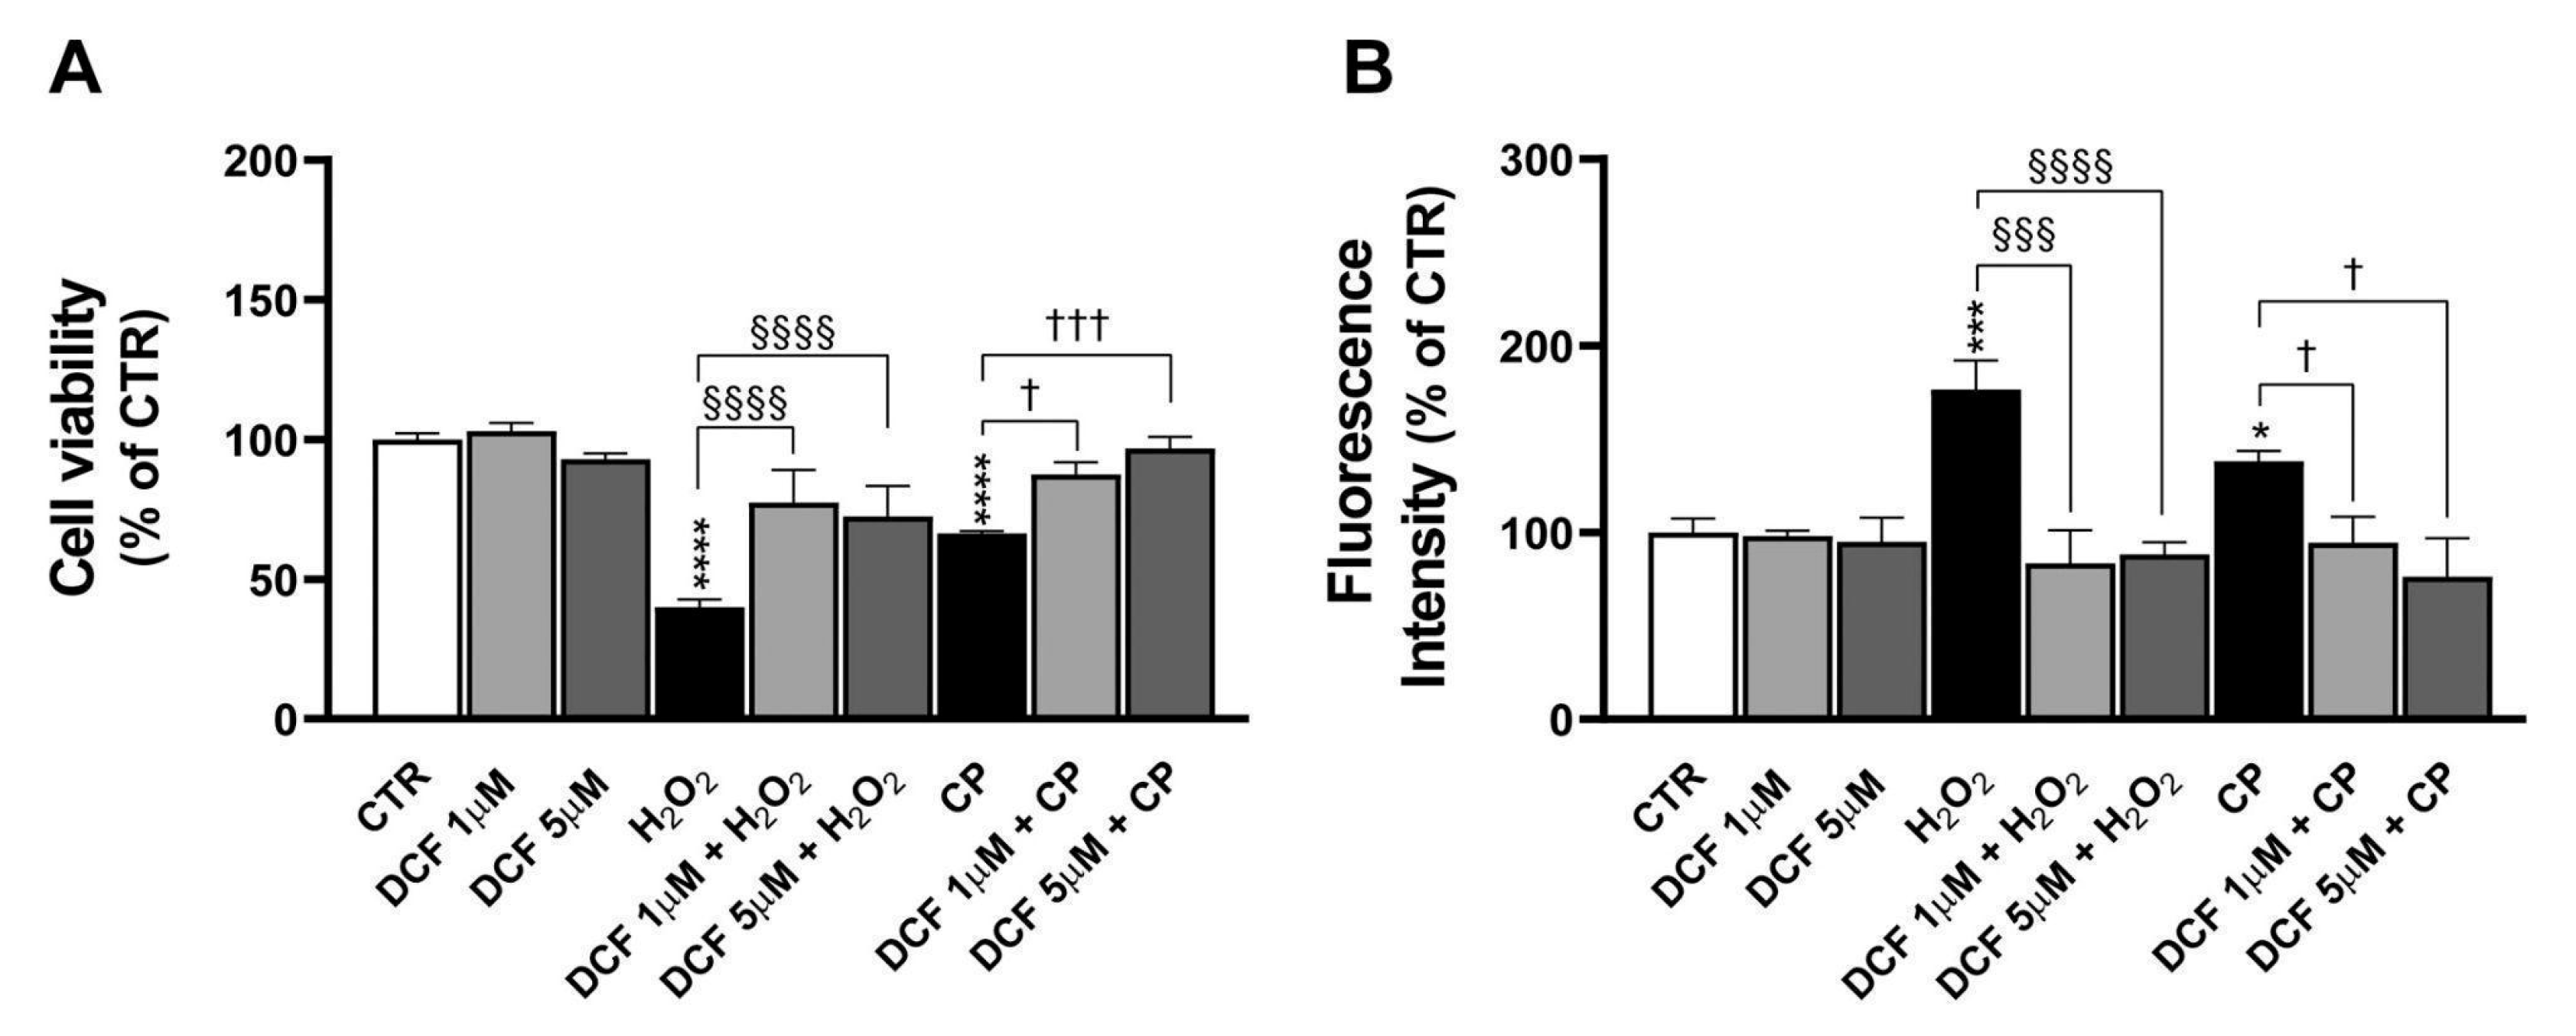
In particular, this study found that PEMF exposure significantly reduced neuronal cell death induced by H2O2 and CP in PC12 cells. As for the mechanistic aspect of their protection, it was found that the damage caused by these insults was at least in part recovered by a caspase-3 inhibitor and by Trolox, a known antioxidant agent, suggesting that the protective effects of PEMFs may be mediated through the modulation of apoptotic pathways and oxidative stress.
Caspase-3 is a key enzyme in the apoptotic pathway and serves as a critical marker in neurodegenerative diseases such as AD. In our study, the use of a caspase-3 inhibitor protected injured PC12 cells from cell death, suggesting the involvement of this apoptotic protein in the observed damage. To gain deeper insights into this mechanism, we analyzed cleaved caspase-3 protein expression, which was significantly upregulated in cells treated with H
2O
2 and CP, confirming its role in the programmed cell death pathways activated in our model. At the nuclear level, PEMFs suppressed caspase-3 activation and reduced chromatin condensation, demonstrating the blockade of the executioner phase of apoptosis. These findings align with prior in vitro and in vivo evidence demonstrating decreased neuronal or neuroblastoma cell death, reduced infarct volumes, and enhanced recovery following extremely low-frequency magnetic field (ELF-MF) or PEMF therapy in experimental stroke models [
28,
29,
30,
31,
32]. Similar results were found following chronic exposure to 50 Hz ELF-MFs in primary rat cortical neurons, showing enhanced cell viability and reduced apoptosis without inducing overt oxidative damage. Although the ROS levels showed a slight increase, this was effectively counterbalanced by intracellular glutathione, whose levels correlated inversely with apoptosis and directly with ROS, suggesting dynamic redox adaptation [
33].
Trolox, a water-soluble analog of vitamin E, is well known for its potent antioxidant properties. It exerts protective effects on H
2O
2-treated PC12 cells through multiple mechanisms, including the direct scavenging of ROS, attenuation of oxidative stress, and prevention of cellular damage. Additionally, Trolox inhibits lipid peroxidation, thereby preserving membrane integrity, and enhances endogenous antioxidant defenses by upregulating antioxidant enzymes [
34]. Consistent with previous findings in the AD mouse model, our results show that Trolox partially mitigated the cytotoxic effects induced by H
2O
2 or CP in PC12 cells, supporting the involvement of oxidative stress in the observed cell death [
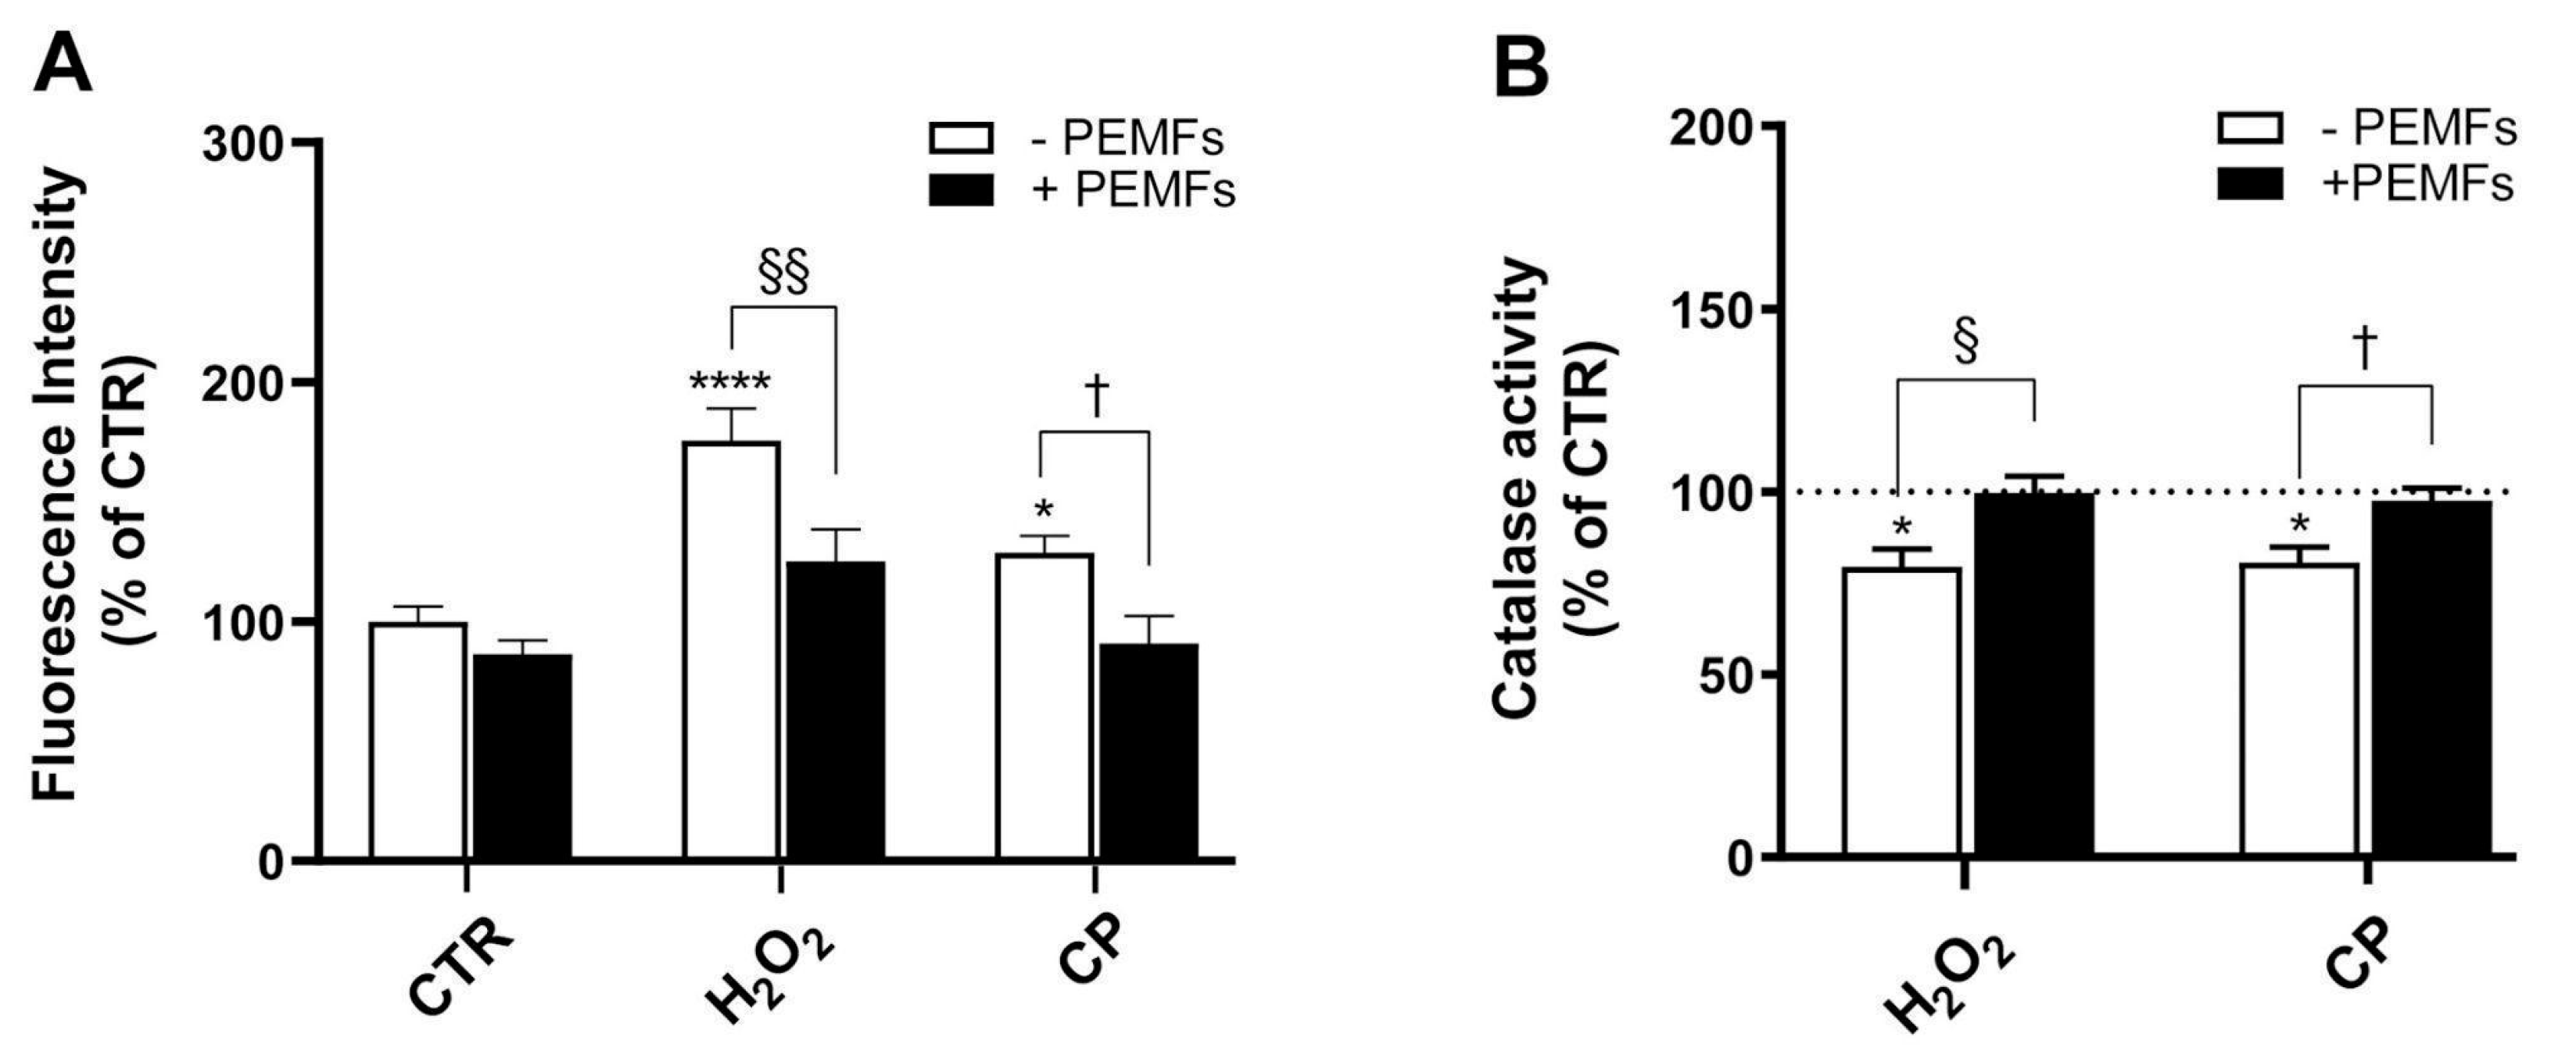
35]. Specifically, exposure to PEMFs significantly reduces oxidative stress. This is evidenced by decreased levels of reactive oxygen species (ROS) and the restoration of catalase activity, indicating that the treatment acts upstream in the oxidative cascade. This result was confirmed in SH-SY5Y cells damaged with H
2O
2 or CP, where high-frequency low-intensity pulsed electric fields (H-LIPEFs) as well as PEMFs were able to reduce ROS [
15,
18]. Furthermore, recent studies have reinforced the neuroprotective potential of PEMFs across various models of neurodegeneration. For instance, it has been demonstrated that PEMFs modulate mitochondrial and oxidative stress-related pathways in SH-SY5Y cells within a Parkinson’s disease model, using a metabolomic approach to highlight conserved cellular responses to PEMF exposure [
36]. Similarly, PEMFs exerted indirect neuroprotective effects by stimulating vascular endothelial growth factor release from human astrocytes, which in turn protected SH-SY5Y neurons from ischemic-like injury [
37]. This suggests that PEMFs may act on multiple cellular components of the neurovascular unit, including glial cells, to promote neuronal resilience. Taken together with our findings in PC12 cells, these studies underscore the robustness and versatility of PEMF-induced neuroprotection across different neuronal models and pathological contexts.
While our study focused on CAT activity as a marker of antioxidant defense, other enzymes, such as superoxide dismutase (SOD) and glutathione peroxidase (GPx), also play crucial roles in cellular redox homeostasis. CAT was selected due to its direct role in detoxifying H
2O
2, the primary oxidative agent used in our model. This choice was supported by previous studies demonstrating CAT’s sensitivity to oxidative stress in PC12 cells [
38,
39]. Nonetheless, future investigations will include a broader panel of antioxidant enzymes to fully elucidate the spectrum of PEMF-induced antioxidant responses. Indeed, it has been reported that PEMFs enhance mitochondrial superoxide dismutase (MnSOD) activity and reduce ROS accumulation in drug-resistant SK-N-BE(2) neuroblastoma cells exposed to H
2O
2, further supporting their role in oxidative stress mitigation [
40].
In PC12 cells, exposure to H
2O
2 results in the significant loss of MMP, indicating impaired mitochondrial function [
38]. This disruption of MMP can trigger the release of cytochrome c from mitochondria to the cytosol, activating caspases and promoting apoptosis [
41]. On the other hand, Aβ in mitochondria specifically can directly induce apoptotic cell death by disrupting mitochondrial function [
42]. We employed the JC-1 assay to evaluate MMP as an indicator of mitochondrial integrity [
43]. Our results demonstrated that treatment with H
2O
2 and CP led to a significant reduction in MMP. However, exposure to PEMFs partially mitigated this effect. In the groups subjected to PEMFs during injury treatments, an increased presence of JC-1 aggregates (dimers), which colocalized with monomers, was observed, suggesting a protective effect on mitochondrial function. The preservation of MMP further confirms the centrality of mitochondrial protection in PEMF-mediated effects. These findings align with prior studies showing that PEMFs or H-LIPEFs mitigate mitochondrial dysfunction and apoptosis in SH-SY5Y cells exposed to H
2O
2 or Aβ [
15,
44].
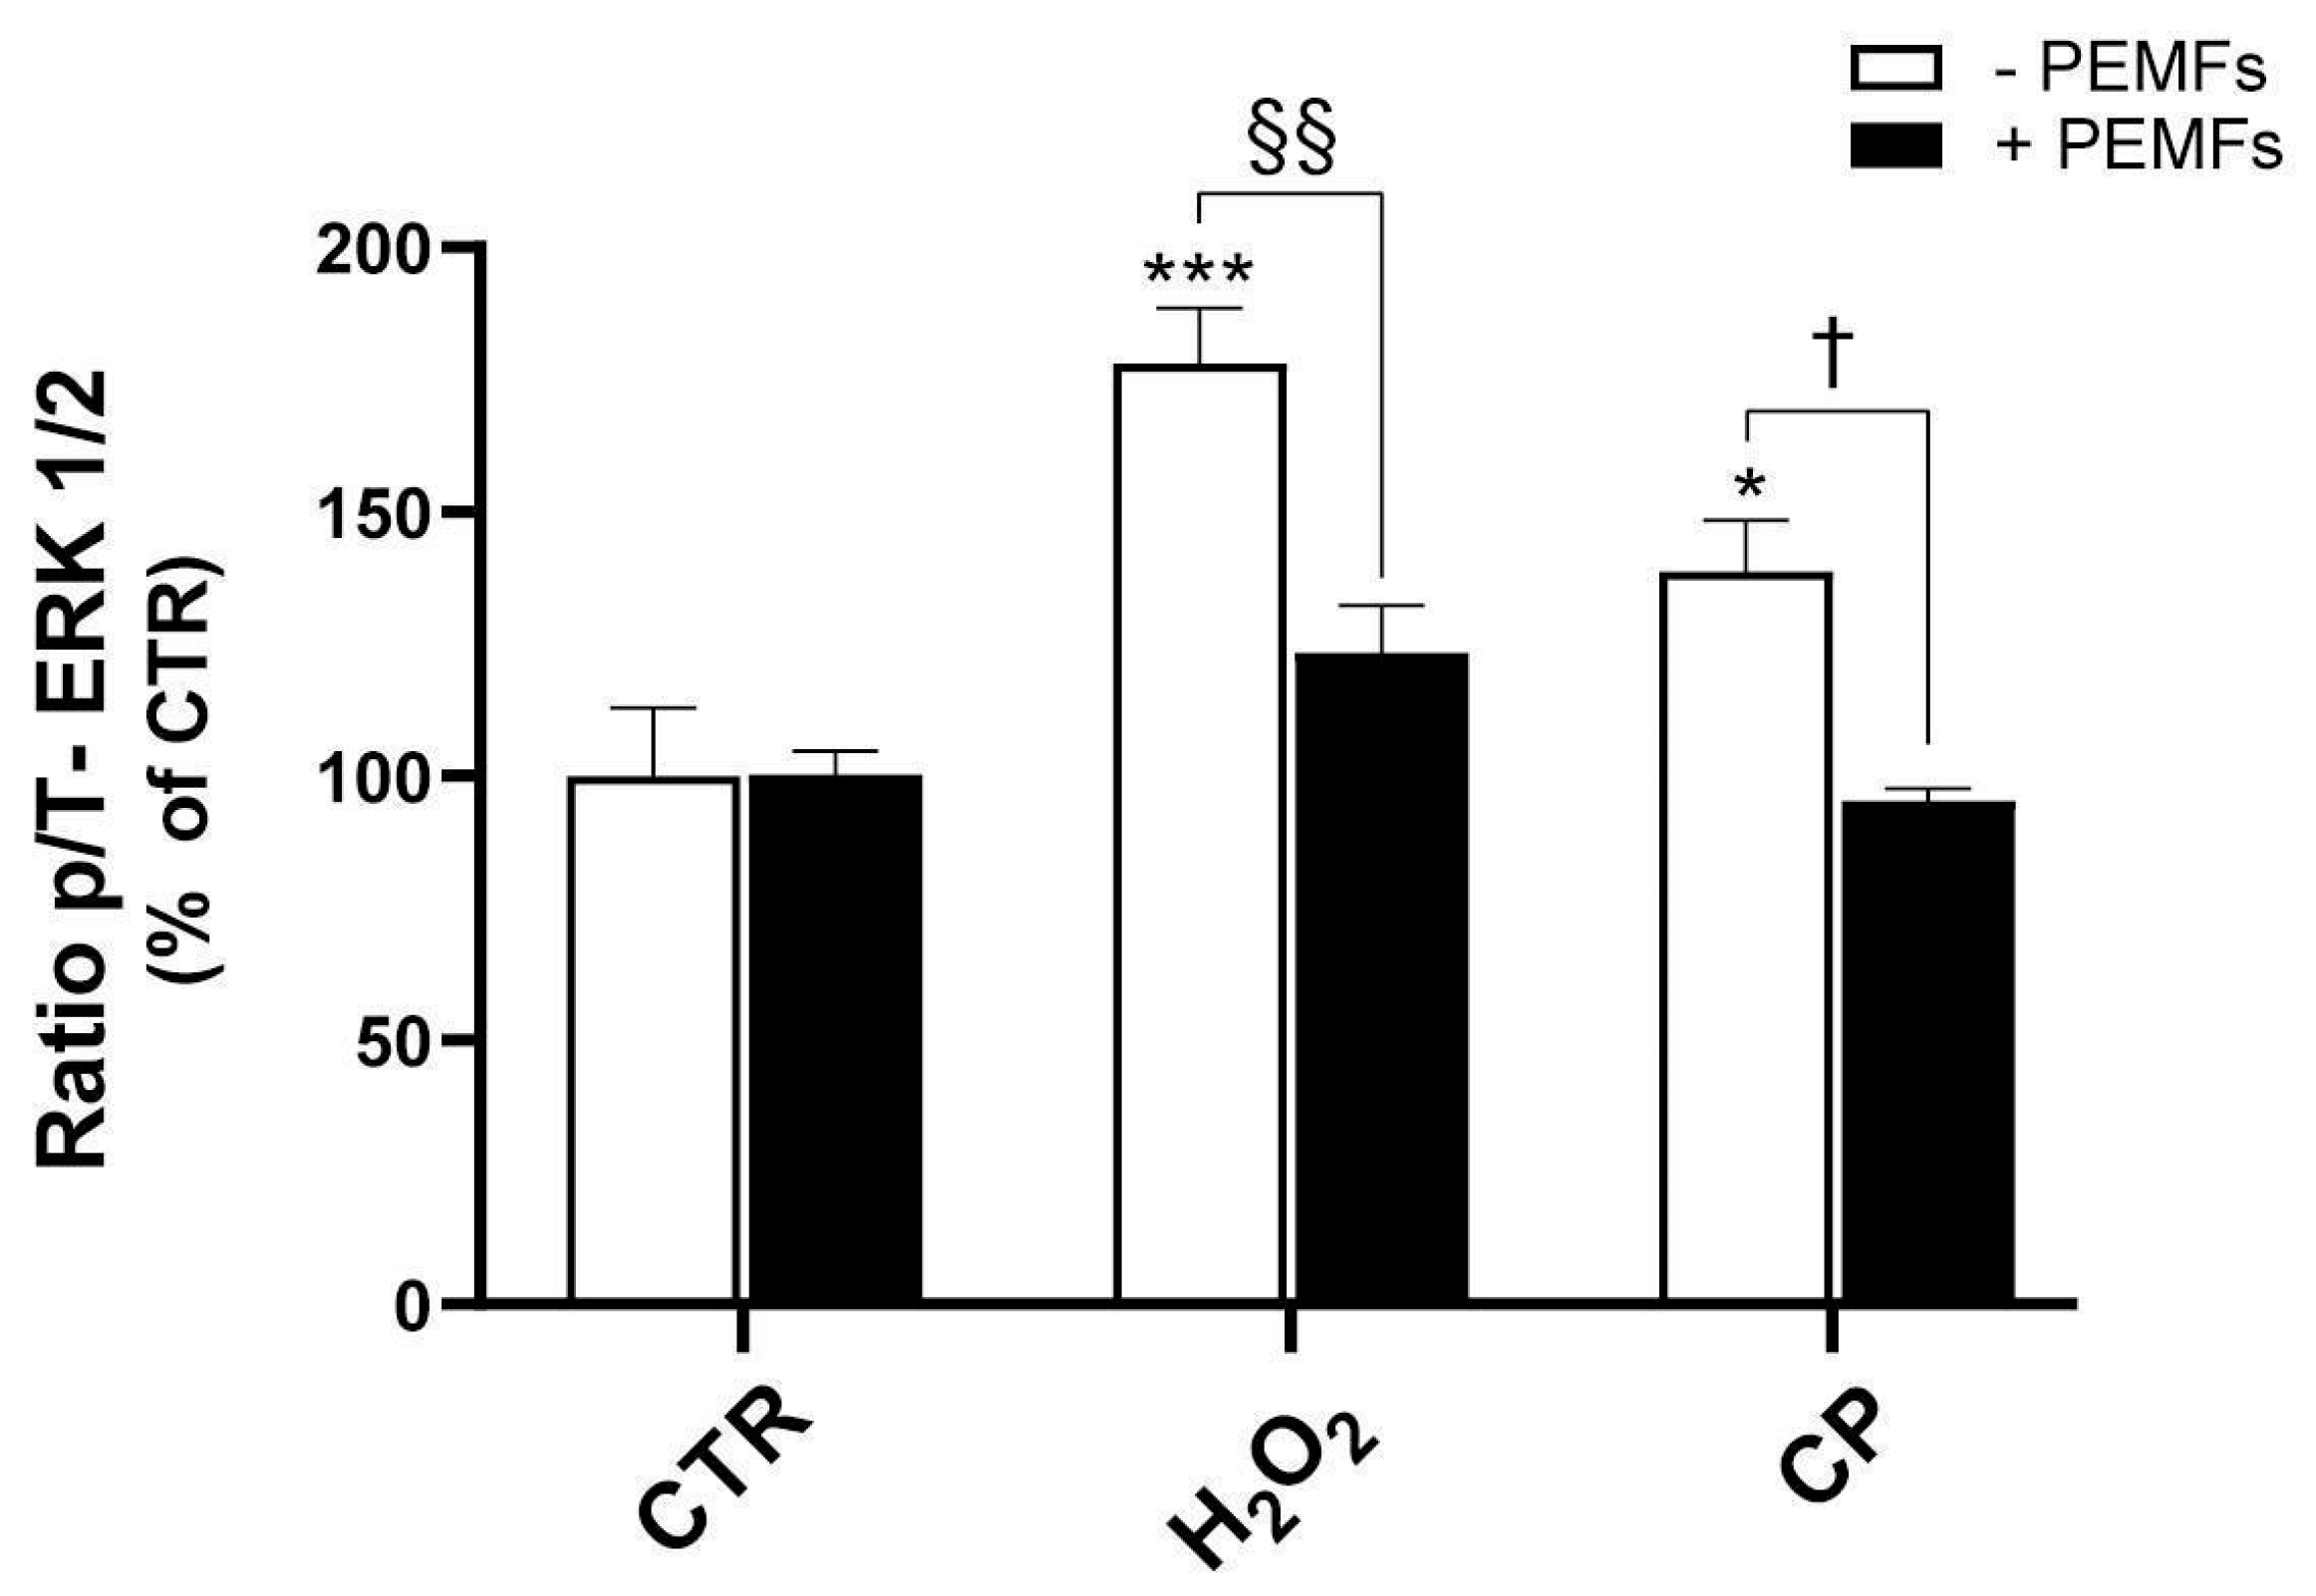
Existing research indicates that ERK1/2 is dysregulated in AD patients [
9]. In particular, the altered APP expression and thus Aβ production cause the activation and phosphorylation of ERK1/2 proteins, with potential implications for AD pathology, including tau phosphorylation and neuroinflammation [
9]. Our findings confirm that the exposure of PC12 cells to the toxic agents H
2O
2 and CP results in a marked increase in ERK1/2 phosphorylation, suggesting the activation of stress-related signaling pathways. Interestingly, treatment with PEMFs effectively counteracted this effect, reducing ERK1/2 activation, as shown by the reduced phosphorylation of ERK1/2. The pharmacological inhibition of MEK with U0126 produced partial protection, reinforcing the contribution of ERK in the cytotoxic response. These data confirm a trend already observed in SH-SY5Y cells insulted with H
2O
2 or Aβ, where stimuli were applied for a short period of time, such as 20 min [
15]. However, it is important to note that the role of ERK signaling in neuronal survival is highly context-dependent and not always pro-apoptotic. Indeed, H-LIPEFs applied to SH-SY5Y cells exposed to H
2O
2 or Aβ for 24 h resulted in the activation of the ERK pathway, which was associated with neuroprotection [
18,
44]. These findings highlight the complex and time-dependent nature of ERK signaling in neuronal cells, suggesting that its modulation by PEMFs may have different outcomes depending on the cellular context and timing of activation.
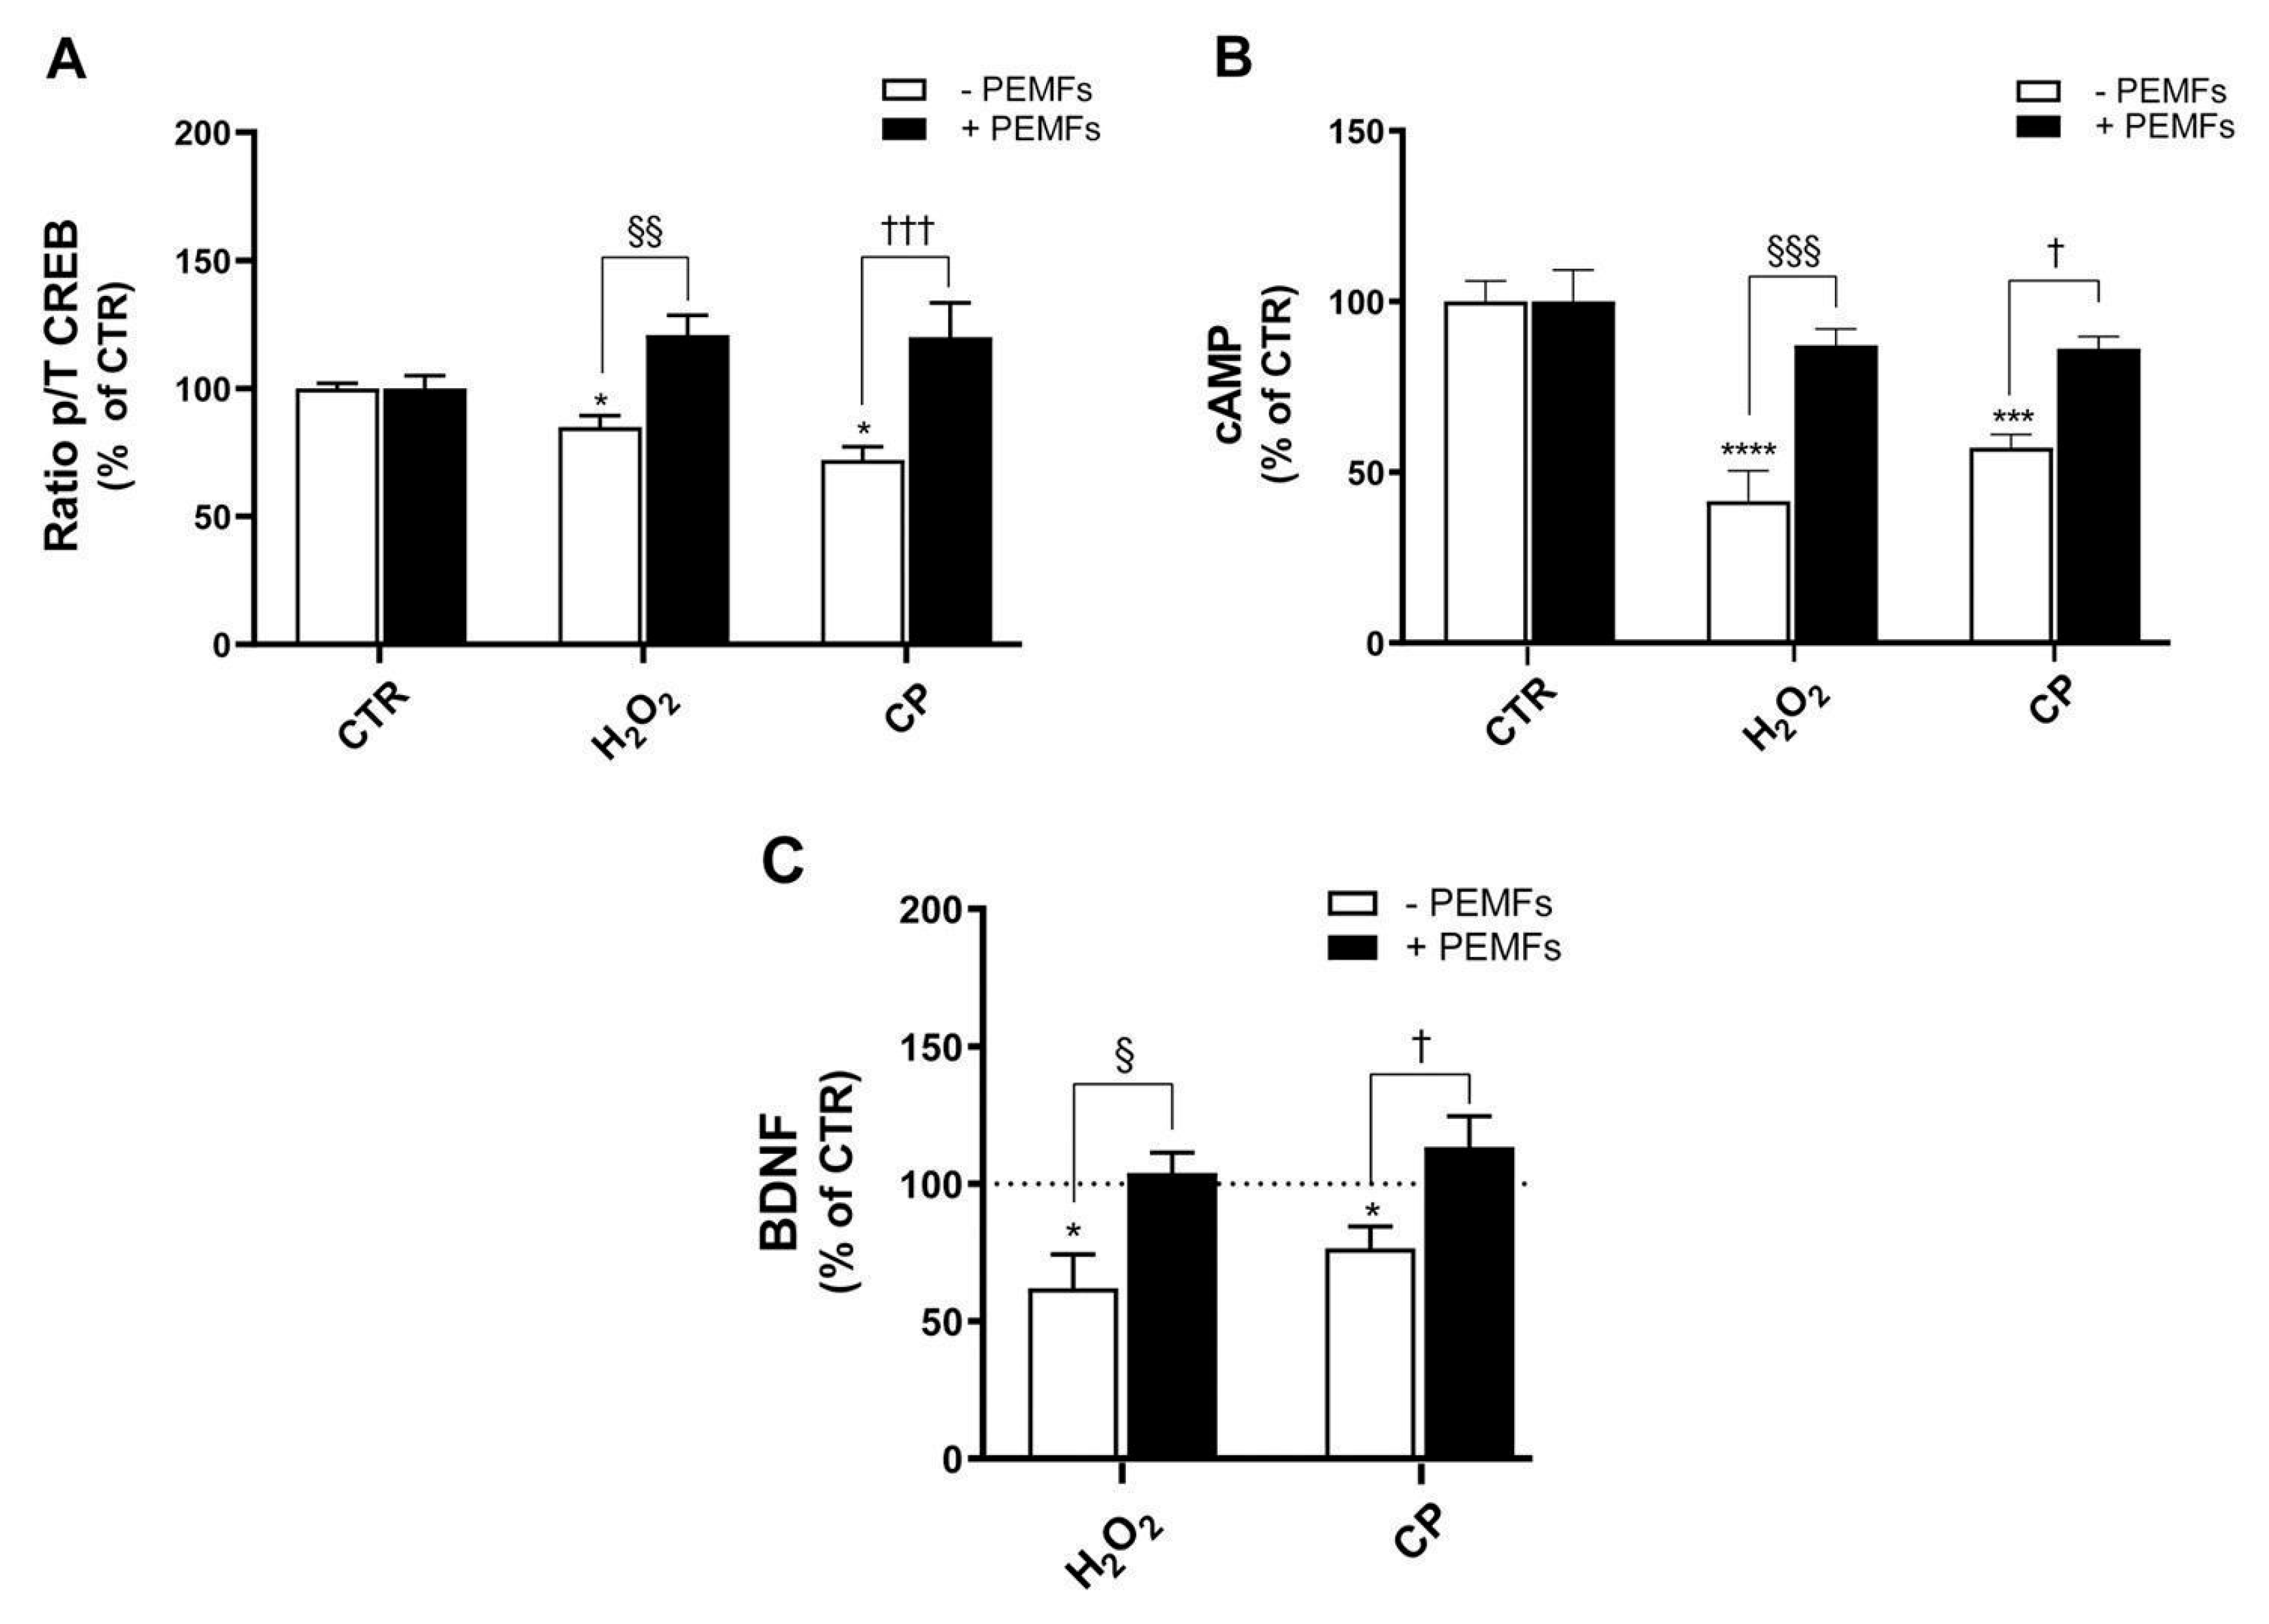
In addition, evidence from the literature reports CREB to be involved in neurodegenerative diseases. In fact, its downregulation is related to the pathology of AD, since reduced CREB phosphorylation results in lower transcriptional activity, which in turn affects synaptic plasticity and neuronal loss. Thus, increasing CREB expression has been considered as a potential therapeutic strategy for AD [
45,
46]. In PC12 cells, the inhibition of CREB has been described to reduce the protective effects of neurotrophic factors, making cells more susceptible to oxidative stress and Aβ-induced damage [
47]. PEMFs reactivated the cAMP/CREB/BDNF axis, a key neurotrophic signaling pathway typically impaired under oxidative or amyloidogenic stress. Our experiments showed that PEMFs restored the intracellular cAMP levels, increased CREB phosphorylation, and enhanced BDNF secretion. The CREB inhibitor 666-15 increases cell death induced by H
2O
2 and CP, confirming the role of CREB as a downstream effector. Accordingly, in SH-SY5Y cells, the application of H-LIPEFs activated the ERK/CREB pathway, producing protective pro-survival effects [
18,
44]. Notably, PEMF exposure activated BDNF/TrkB/Akt signaling in ischemic mice, contributing to synaptic recovery and functional improvement [
48]. Furthermore, the ability of PEMFs to simultaneously enhance cAMP, p-CREB, and BDNF expression while downregulating ERK1/2 activity highlights their potential to provide neuroprotective effects. This dynamic interplay underscores the importance of targeting multiple signaling pathways to restore neuronal homeostasis and support cognitive function. Indeed, several signaling mechanisms are potentially modulated by PEMFs, and future studies will be aimed at investigating additional pathways, including PI3K/Akt and NF-κB, to further elucidate the multifaceted molecular effects of PEMFs.
Finally, this study also compared the effects of PEMFs with those of DCF, a widely used non-steroidal anti-inflammatory drug (NSAIDs). DCF exerts its anti-inflammatory action by inhibiting cyclooxygenase enzymes, thereby reducing the synthesis of pro-inflammatory prostaglandins. This mechanism directly targets the inflammatory cascade, which is a key contributor to neurodegeneration [
49]. In contrast, PEMFs act through the biophysical modulation of intracellular signaling pathways, including the suppression of ERK1/2 activation and the enhancement of the cAMP/CREB/BDNF axis, as shown in our study. These distinct modes of action suggest that PEMFs and NSAIDs could be used in combination to achieve broader neuroprotection. Future studies should investigate the potential synergistic or additive effects of such combined approaches, which may offer enhanced efficacy while minimizing the dosages and side effects of pharmacological agents. Compared to current pharmacological treatments for AD, such as Lecanemab, a monoclonal antibody targeting amyloid-beta, PEMFs offer a non-invasive and potentially safer alternative. While Lecanemab has demonstrated modest efficacy in slowing cognitive decline in early AD, its use is limited by high costs, intravenous administration, and the risk of amyloid-related imaging abnormalities, which require regular magnetic resonance imaging monitoring [
50,
51]. In contrast, PEMFs are well tolerated, do not require systemic delivery, and have shown neuroprotective effects through the modulation of multiple signaling pathways. Although further preclinical and clinical validation is needed, PEMFs may represent a valuable adjunct or alternative to current therapies, especially in long-term management scenarios.
4. Materials and Methods
4.1. Materials
Penicillin–streptomycin (10,000 units penicillin–10 mg streptomycin/mL), 200 mM L-glutamine, RPMI-1640 medium, Dulbecco’s modified eagle’s medium high-glucose (DMEM), Hanks’ balanced salt solution (HBSS), 4-(2-hydroxyethyl)piperazine-1-ethanesulfonic acid (HEPES (CAS N. 7365-45-9), H2O2 solution, phosphate-buffered saline (PBS), anhydrous DMSO, 0.01% poly-L-lysine, diclofenac (DCF) (CAS N. 15307-79-6), bovine serum albumin (BSA), forskolin (CAS N. 66575-29-9), RO (CAS N. 29925-17-5), Trolox (CAS N. 53188-07-1), and rat recombinant NGF were purchased from Merck (Milan, Italy). Donor horse serum and fetal bovine serum were purchased from EuroClone (Milan, Italy). Caspase-3 inhibitor was purchased from Merck (Milan, Italy). The ROS detection assay kit (dichlorofluorescin diacetate/2′,7′-dichlorodihydrofluorescein diacetate; DCFDA/H2DCFDA) was from Canvax Biotech (Voden, MB, Italy). The CellTiter 96®® AQueous One Solution MTS Cell Proliferation Assay was from Promega (Milan, Italy). The mitochondrial membrane potential (MMP) assay kit (ab113850 JC-1: 5,5′,6,6′-tetrachloro-1,1′,3,3′-tetraethylbenzimidazolylcarbocyanine iodide) was from Abcam (Cambridge, UK). The catalase colorimetric activity kit (EIACATC) and multispecies ERK1/ERK2 (ERK1/2) (total/phospho) InstantOne™ ELISA kit (catalog number: 85-86013) were from ThermoFisher Scientific (Milan, Italy). The rat BDNF enzyme-linked immunosorbent (ELISA) assay kit (catalog number: ELK5459) was from ELK Biotechnology (Denver, CO, USA). Click-peptide Aβ1-42 (CP) was from GenScript Biotech (Twin Helix, Milan, Italy). Rat pheochromocytoma PC12 cells were purchased from the American Type Culture Collection (Manassas, VA, USA). Rabbit anti-caspase-3 (Cleaved Asp175) polyclonal antibody and goat anti-rabbit IgG (H+L) cross-adsorbed secondary antibody Alexa Fluor™ 488 were purchased from ThermoFisher Scientific (Milan, Italy). Paraformaldehyde (4%) solution and Triton X-100 were from Merck (Milan, Italy). The Alpha Screen cyclic adenosine monophosphate (cAMP) detection kit (catalog number: 6760635D) and AlphaLISA™ SureFire®® Ultra™ total (catalog number: ALSU-TCREB-A-HV) and phospho-CREB (catalog number: ALSU-PCREB-A-HV) were from Revvity (Milan, Italy).
4.2. Electromagnetic Field Exposure System
The PEMF exposure system has already been described in detail [
52]. PC12 cells were exposed to PEMFs generated by a pair of rectangular coils (14 × 23 cm), composed of 1400 turns of copper wire placed opposite to each other. The cells were placed between coils so that the plane of the coils was perpendicular to the culture plate. The coils were powered by the PEMF generator system (IGEA, Carpi, Italy). The selection of PEMF parameters (pulse duration 1.3 ms, frequency 75 Hz, magnetic field intensity 1.5 ± 0.2 mT) was based on previous studies using the same exposure system in neuronal and glial models [
14,
15,
52]. In particular, both 1.5 mT and 3.0 mT PEMFs, applied with identical pulse characteristics, induced consistent biological effects [
52]. The 1.5 mT intensity was selected in the present study as it represents the lowest effective dose capable of eliciting neuroprotective responses, ensuring both biological efficacy and safety. The peak intensity of the magnetic field and peak intensity of the induced electric voltage were detected in air between two coils from one side to the other, at the level of the culture plate. The peak values measured between two coils in air had a maximum variation of 1% in the whole area in which the culture plates were placed. The peak intensity of the magnetic field was detected using the Hall probe (HTD61-0608-05-T, 8 F.W. Bell, Sypris Solutions, Louisville, KY, USA) of a gaussmeter (DG500, Laboratorio Elettrofisico, Milan, Italy), with reading sensitivity of 0.2%. The corresponding peak amplitude of the induced electric voltage was 2.0 ± 0.5 mV. It was detected using a standard coil probe (50 turns, 0.5 cm internal diameter of the coil probe, 0.2 mm copper diameter), and the temporal pattern of the signal was displayed using a digital oscilloscope (Le Croy, Chestnut Ridge, NY, USA). The shape of the induced electric voltage and its impulse length were kept constant.
4.3. Cell Cultures
PC12 cells were cultured in RPMI-1640 medium supplemented with 2 mM L-glutamine, 1% (
v/v) penicillin–streptomycin, 10% (
v/v) horse serum (HS), and 5% (
v/v) fetal bovine serum (FBS) at 37 °C in a 5% CO
2-humidified incubator. For neuron-like induced differentiation, PC12 cells were cultured in DMEM high-glucose medium supplemented with 2 mM L-glutamine, 1% (
v/v) penicillin–streptomycin, 10% (
v/v) HS, and 5% (
v/v) FBS containing 100 ng/mL of NGF and maintained in these conditions (differentiation medium) for 3 days. All experiments included in this study were performed with NGF-differentiated PC12 cells. Before the experiments, to perform appropriate treatments, the differentiation medium was replaced with serum-free fresh differentiation medium [
53]. PC12 cells, although responsive to NGF and capable of acquiring neuron-like properties, do not fully replicate the complexity of primary neurons or the in vivo environment. They lack the full repertoire of synaptic connections, glial interactions, and genetic background relevant to AD pathology. In addition, their response to stimuli may differ from that of primary neurons or transgenic animal models, which should be employed in future studies.
4.4. Cell Treatments
In order to mimic cell insult, two types of compounds were used: (i) H2O2 (200 or 1000 μM), an oxygen radical causing neuronal toxicity, and (ii) CP (20 μM) for the induction of toxicity and inflammation. Cells were treated with H2O2 or CP, in the presence or the absence of PEMFs. The exposure times were carefully chosen based on preliminary dose–response studies that identified optimal 24 h damage conditions using 1 mM H2O2 and 20 µM CP. The durations were also adapted to the expected kinetics of the biological processes investigated: 90 min for acute effects like mitochondrial membrane potential depolarization (JC-1 test) and chromatin alterations (Hoechst 33342 staining), 20 min for rapid molecular responses such as ERK1/2 and CREB phosphorylation, 1 h for cyclic AMP (cAMP) quantification, and 4 h for catalase enzyme activity.
4.5. Preparation of CP Stocks
CP possesses an ester bond at the Gly (25)-Ser (26) sequence. It is a water-soluble and non-aggregative precursor molecule that is promptly converted to Aβ
1-42 (t
1/2 10 s) at pH 7.4 via an O-to-N intramolecular acyl migration reaction. It was prepared as already described [
15]. To ensure accurate interpretation, the effects observed in this study should be considered as attributable to CP, rather than to physiological Aβ
1-42 or its aggregated forms.
4.6. MTS Assay
The 3-(4,5-dimethylthiazol-2-yl)-5-(3-carboxymethoxyphenyl)-2-(4-sulfophenyl)-2h-tetrazolium (MTS) assay was performed to determine cell viability, following the manufacturer’s instructions. In brief, 3.1 × 10⁴ cells/cm2 were seeded in 96-well plates (Nunc™ MicroWell™ 96-well microplate, Thermo Fisher Scientific) and cultured for 3 days in differentiation medium. On the day of the assay, the medium was removed, and cell treatments were performed in serum-free differentiation medium. For the PEMF-exposed group of cells, the culture plate was positioned inside the PEMF exposure system for 4 h before treatments and then for 24 h during the compound’s treatment time. At the end of the incubation period, 20 μL of MTS solution was added to each well, they were incubated for 1 h, and the optical density was read using the EnSight multimode plate reader (Perkin Elmer, Milan, Italy) at 490 nm.
4.7. ROS Detection Assay (DCFDA/H2DCFDA)
ROS production in PC12 cells was tested by the H2DCFDA assay. A total of 3.1 × 10⁴ cells/cm2 were seeded in black 96-well plates (Nunc™ MicroWell™ 96-well, Thermo Fisher Scientific) and cultured for 3 days in differentiation conditions. After removing the medium, 100 μL of 20 μM H2DCFDA solution was added to each well. The plate was kept in the incubator for 1 h and subsequently washed once with 1X assay buffer. Thereafter, treatments were performed in serum-free differentiation medium, and the fluorescence was read after 24 h with the EnSight multimode plate reader (Perkin Elmer, Milan, Italy) (excitation 485 nm, emission 530 nm). For the PEMF-exposed group of cells, the culture plate was positioned inside the PEMF exposure system during the compound’s treatment time.
4.8. ERK1/2 Assay
The total and phospho ERK1/2 protein levels were determined by the InstantOne
TM ELISA kit specified in the
Section 4.1, following the manufacturer’s instructions. Cells were seeded in 24-well plates at a density of 1 × 10
5 cells/cm
2 and cultured for 3 days in differentiation medium. On the day of the assay, the medium was changed for serum-free differentiation medium and cells were treated with 1 mM H
2O
2 or 20 μM CP for 20 min. Cell extracts were prepared using the specific lysis buffer provided in the kit. In brief, samples were incubated with the total or phosphor ERK1/2 capture/detection antibody cocktail (1 h at RT). After washing, the wells were incubated with the detection solution for 20 min at RT, and, finally, the stop solution was added. Wells were read at a 450 nm wavelength with the EnSight multimode plate reader (Perkin Elmer, Milan, Italy).
4.9. JC-1 Test
The JC-1 MMP assay kit was used for the measurement of the mitochondrial membrane potential (MMP, Δψm). This kit contains tetraethyl benzimidazolyl carbocyanine iodide (JC-1), a cationic dye that accumulates in mitochondria. At high concentrations (due to high MMP), JC-1 aggregates, yielding a red-to-orange-colored emission (590 ± 17.5 nm). At low concentrations (due to low MMP), the dye is predominantly a monomer that yields green fluorescence with emission at 530 ± 15 nm. Therefore, a decrease in the aggregate red fluorescent signal is indicative of depolarization, whereas an increase is indicative of hyperpolarization.
Cells were seeded in black 96-well plates at 3.1 × 10⁴ cells/cm2 and cultured for 3 days in differentiation conditions. The assay was performed following the manufacturer’s instructions. Briefly, on the day of the assay, the medium was removed and 100 μL of 20 μM JC-1 was added to each well. Cells were kept in the incubator for 30 min and subsequently washed twice with 1X dilution buffer. Then, treatments were performed in serum-free differentiation medium and lasted for 90 min. For the PEMF-exposed group of cells, the culture plate was positioned inside the PEMF exposure system during compounds’ treatment. At the end of the incubation time, plates’ fluorescence was read using the EnSight multimode plate reader (Perkin Elmer, Milan, Italy) (red aggregates: excitation 535 nm, emission 590 nm; green monomers: excitation 475 nm, emission 530 nm).
4.10. Microscopy Imaging of JC-1 MMP
The MMP was studied using a fluorescence microscope. For this purpose, cells were seeded in 8-well chamber slides (Millicell EZ SLIDE 8-well glass slide, Merck, Italy) at 3.6 × 10⁵ cells/cm2 and cultured for 3 days in NGF differentiation conditions. The assay was performed following the protocol described above. On the day of the assay, after treatment with 1 mM H2O2 or 20 μM CP for 90 min, cells were analyzed under a fluorescence microscope with TRITC and FITC filters. Red and green fluorescence images were acquired using the Nikon Eclipse 5i fluorescence microscope equipped with a cooled charge-coupled device (CCD) camera (Nikon DS-Qi1). The images were analyzed using the software NIS Elements v 5.11.
4.11. Immunocytochemistry
Cells were seeded onto poly-L-lysine-coated chamber slides at a density of 3.6 × 10⁵ cells/cm2 and cultured for 3 days in NGF medium. On the day of the assay, cells were treated in serum-free medium (1 mM H2O2 or 20 μM CP for 90 min) and then fixed with 4% paraformaldehyde for 20 min at RT. After blocking non-specific binding, as well as permeabilization by incubating cells with a 0.3% Triton X-100/2% bovine serum albumin in PBS solution for 1 h at RT, the cells were incubated with caspase-3 (cleaved Asp175) primary antibody (rabbit, 1:250) overnight at 4 °C. Cells were then washed and incubated for 1 h at RT with Alexa Fluor™ 488 goat anti-rabbit secondary antibody (1:500). For nuclear labeling, PC12 cells were stained with Hoechst 33342 solution (1 μg/mL) for 20 min at RT and then washed with PBS. Finally, the slides were mounted in an anti-fade 1,4-phenylenediamine solution in PBS–glycerol (2.5%, 1:3). In order to check for non-specific labeling of the secondary antibody, staining was tested in the absence of the primary antibody and no fluorescent signal was observed. Fluorescence images were acquired using the Nikon Eclipse 5i fluorescence microscope. The analysis of both cleaved caspase-3 and Hoechst 33342 fluorescent signals was performed on at least five different fields of each sample well using the software NIS Elements v 5.11. The total number of cells in each field analyzed was counted through Hoechst 33342 staining, as well as the number of cells with chromatin-altered nuclei.
4.12. Catalase (CAT) Assay
The CAT activity of PC12 cells was quantitatively measured using a catalase colorimetric kit. Cells were seeded onto a 6-well plate at a density of 5.3 × 10⁵ cells/cm2 and cultured for 3 days in differentiation conditions. On the day of the assay, cells were treated with 200 μM H2O2 or 20 μM CP in serum-free differentiation medium and incubated for 4 h at 37 °C in the incubator. After removing the medium, cells were scraped and collected by centrifugation at 9000× g for 2 min at 4 °C. The pellet was homogenized in 1X assay buffer and centrifuged at 10,000× g for 15 min at 4 °C to obtain the supernatant, which was conserved at −80 °C till the day of the assay. The instructions described by the kit manufacturers were followed to perform the assay.
4.13. BDNF Assay
The extracellular levels of BDNF were measured in the supernatants of PC12 cells using a BDNF ELISA assay kit. Cells were seeded in 24-well plates at a density of 1.6 × 10⁵ cells/cm2 and cultured for 3 days in differentiation medium. Then, the medium was changed for serum-free differentiation medium, and cells were treated with 200 μM H2O2 or 20 μM CP for 24 h. On the day of the assay 100 μL of each sample or standard was loaded into the wells of the plate and incubated at 37 °C for 1 h 20 min. After washing (3 times with 1X wash buffer), 100 μL of biotinylated BDNF antibody working solution (1:100 in biotinylated antibody diluent) was added to each well, and the plate was incubated at 37 °C for 50 min. After washing (3 times with 1X wash buffer), 100 μL of streptavidin–HRP working solution (1:100 in HRP diluent) was added to each well, and the plate was incubated at 37 °C for another 50 min. After washing (5 times with 1X wash buffer), 90 μL of TMB substrate solution was added to each well and they were incubated at 37 °C for 20 min in the dark. Finally, the reaction was stopped by adding 50 μL of stop solution to each well, and the plate was shaken for 1 min to mix. Absorbance was immediately measured at 450 nm using the EnSight multimode plate reader (Perkin Elmer, Milan, Italy).
4.14. Total/Phospho CREB Assay
The AlphaLISA™ SureFire® Ultra™ assay was used to measure the phosphorylated and total CREB protein in cellular extracts. Cells were seeded in 24-well plates at a density of 1 × 10⁵ cells/cm2 and cultured for 3 days in differentiation medium. On the day of the assay, the medium was changed for serum-free differentiation medium, and cells were treated with 1 mM H2O2 or 20 μM CP for 20 min. After removing the medium, cell extracts were prepared using the lysis buffer provided by the kit, and the assay was performed in a half-area OptiPlateTM 96 (Perkin Elmer, Milan, Italy), following the manufacturer’s instructions and avoiding direct light. In brief, 30 μL of each sample was incubated with an acceptor mix composed of reaction buffer 1, reaction buffer 2, activation buffer, and acceptor beads. After 1 h of incubation at RT, the donor mix composed of beads and diluent was added to the samples and they were incubated for 1 h at RT. The plate was then read using the EnSight multimode plate reader (Perkin Elmer, Milan, Italy). The amount of light emission measured was directly proportional to the amount of target protein present in the sample.
4.15. cAMP Quantification
The second messenger cAMP was quantified using the ALPHAscreen cAMP assay kit, following the manufacturer’s instructions. Cells were cultured for 3 days in differentiation medium. On the day of the assay, cells were resuspended in a stimulation buffer consisting of HBSS, 5 mM HEPES, 0.5 mM MgCl2, 100 μM RO, and 0.05% BSA, at pH 7.4 and counted, and a cell suspension of 107 cells/mL was prepared, which was mixed with 10X acceptor beads (1:1). Reactions were performed in 96-well half-area microplates. Each sample consisted of 2.5 × 10⁴ cells in 5X acceptor beads. When appropriate, cells were treated with 1 mM H2O2 or 20 μM CP, which lasted for 1 h at 37 °C. Then, 1 μM forskolin was added, and samples were incubated for 30 min at 37 °C. Finally, the detection mix solution consisting of 41.7 nM biotin–cAMP tracer and 33.3 μg/mL streptavidin donor beads diluted in 1X immunoassay buffer was added to all sample wells and they were incubated for 1 h at 37 °C. The standard curve was prepared and processed in parallel to the samples. The plate was read using the EnSight multimode plate reader.
4.16. Data Analysis and Statistics
All data in the figures and text are presented as the mean ± standard error of mean (SEM) of at least three independent experiments performed in duplicate. Additionally, the same graphs including standard deviations are provided in the
Supplementary File (Figures S3–S9). Data sets were examined by one-way analysis of variance (ANOVA) and Sidak’s multiple comparison test. A
p value < 0.05 was considered a standard for statistically significant differences among the groups. Data analysis and statistical analysis were performed using the GraphPad Prism 8.0.1 software.


 ,
, 


