Article

The Purinergic Receptor P2X5 Modulates Glucose Metabolism and Expression of Thermogenic Genes in Brown Adipose Tissue

1
Department of Biochemistry and Molecular Cell Biology, University Medical Center Hamburg-Eppendorf, 20246 Hamburg, Germany
2
Institute of Immunology, University Medical Center Hamburg-Eppendorf, 20246 Hamburg, Germany
*
Author to whom correspondence should be addressed.
These authors contributed equally to this work.
Int. J. Mol. Sci. 2025, 26(13), 6474; https://doi.org/10.3390/ijms26136474
Submission received: 7 May 2025 / Revised: 26 June 2025 / Accepted: 3 July 2025 / Published: 4 July 2025

Abstract

Next to adrenergic signalling, purinergic pathways mediated by extracellular adenine nucleotides have been described to shape thermogenic and metabolic functions in brown adipose tissue (BAT). Here we describe high expression of P2X5 that is activated by ATP in mature adipocytes of BAT and differentiated brown adipocytes in vitro. The levels of other P2X family members were much lower, or expression was restricted to tissue-resident macrophages or endothelial cells. Global and brown adipocyte-specific P2rx5 deficiency resulted in lower expression of the uncoupling protein 1 (UCP1). However, indirect calorimetry studies showed that P2X5 did not affect systemic energy expenditure. Of note, glucose tolerance was impaired under chow and obesogenic high-fat diet conditions, which can be explained by lower glucose disposal into BAT but not into other organs. In summary, these data indicate a modulatory role of P2X5 in systemic and BAT-specific glucose metabolism.

1. Introduction

With their central role in energy handling, adipose tissues are essential for maintaining whole-body metabolic homeostasis. Accordingly, dysregulations in adipose tissue depots and excessive nutrient storage drive the development of metabolic diseases and chronic inflammatory processes [1,2]. The incidence of obesity and type 2 diabetes has risen dramatically in recent decades, leading to associated diseases becoming one of the main causes of morbidity and mortality in modern societies. In recent years, the stimulation of energy combustion by brown and white adipose tissues (BAT, WAT) has been suggested as a novel target for combating obesity and associated comorbidities [3,4,5,6]. The main function of thermogenic brown adipocytes within BAT and beige adipocytes present in WAT is to generate heat for body temperature maintenance at cold ambient temperatures. In this process, known as adaptive thermogenesis, activated brown and beige adipocytes internalize and burn large amounts of glucose as well as fatty acids delivered by triglyceride-rich lipoproteins [7,8,9]. In addition, a number of studies suggest that activated BAT modulates energy homeostasis by secreting endocrine factors, thereby orchestrating systemic metabolism of, e.g., the liver, heart, and muscles [10,11,12,13]. Accordingly, due to its potential to burn excess calories and by the secretion of endocrine hormones, BAT activation and/or the prevention of BAT degeneration observed in response to ageing have been proposed as a therapeutic target for the treatment of age- and obesity-associated diseases [3,14,15]. Energy uptake and activation of thermogenic adipocytes is primarily induced by norepinephrine, which is released from sympathetic nerves innervating BAT and WAT. Subsequent beta-adrenergic signalling and heat generation in thermogenic adipocytes is mediated by the uncoupling protein 1 (UCP1) at the inner mitochondrial membrane. By causing a proton leak, UCP1 uncouples the respiratory chain from ATP synthesis and releases the energy stored in the protein gradient as heat. In addition to UCP1-dependent thermogenesis, a number of so-called futile cycles have been identified that contribute to adaptive thermogenesis in heat-producing adipocytes [16].
In the context of the current study, it is of note that mice lacking all beta-adrenergic receptors (β1, β2, β3) are able to adapt to cold conditions and display even higher UCP1 levels in BAT, suggesting additional regulatory pathways that shape thermogenic responses, e.g., purinergic signalling [17]. This hypothesis was supported by the observation that extracellular ATP levels rise in parallel with norepinephrine in response to BAT stimulation [18]. This can be explained by co-secretion of ATP and norepinephrine, which are stored in the same vesicles of sympathetic neurons [17,19,20]. However, the relevance of ATP as a purinergic signal sensed by thermogenic adipocytes has not been fully elucidated. As a ligand of the purinergic receptors of the P2X family, extracellular ATP can shape ion channel-mediated signalling pathways [21,22]. With this ability to regulate cytosolic ion concentrations, e.g., Ca2+, and downstream signalling cascades, P2X receptors are responsible for the activation of various cellular processes [23,24,25], and thus possibly also thermogenic responses in brown or beige adipocytes. Recently, we showed that P2X7 is dispensable for energy expenditure and metabolic homeostasis in response to cold exposure [26]. However, P2X7 is mainly expressed by myeloid cells in WAT and BAT, which may explain the negative outcome. Of note, one member of the P2X family, namely the ATP receptor P2X5, has been shown to be highly expressed in BAT compared to various other tissues, serving as a novel marker for brown adipocytes [27]. For its ion channel function it is known that P2X5 can form functional homo- and heterotrimers by assembling with other P2X subunits such as P2X1 and P2X6 [24,28,29]. However, the relevance of P2X5 expressed by brown adipocytes for adaptive thermogenesis and its potential metabolic function have not been studied so far.
In the current study, we confirmed the high expression of P2X5 primarily by brown adipocytes in mice and its induction upon adipogenic differentiation. To further assess the relevance of P2X5 in thermogenesis and metabolic homeostasis, we generated a whole-body and a brown adipocyte-specific P2rx5-knockout mouse model. In mild cold exposure, P2rx5-deficiency resulted in reduced expression of thermogenic genes such as Ucp1, an observation that was confirmed in differentiated brown adipocytes in vitro. Nevertheless, indirect calorimetry studies indicated that P2X5 did not influence systemic energy expenditure in mice housed at different ambient temperatures. On the other hand, P2X5 influenced metabolic parameters, as shown by lower plasma cholesterol and free fatty acid levels observed in mice with brown adipocyte-specific P2rx5-deletion. Notably, under chow and in high-fat diet-fed obesogenic conditions, P2rx5 deficiency in brown adipocytes resulted in an impaired glucose tolerance which was explained by lower glucose disposal into BAT. Overall, our data show that purinergic signalling via P2X5 is dispensable for energy expenditure but that it shapes expression of thermogenic genes and systemic glucose handling.

2. Results

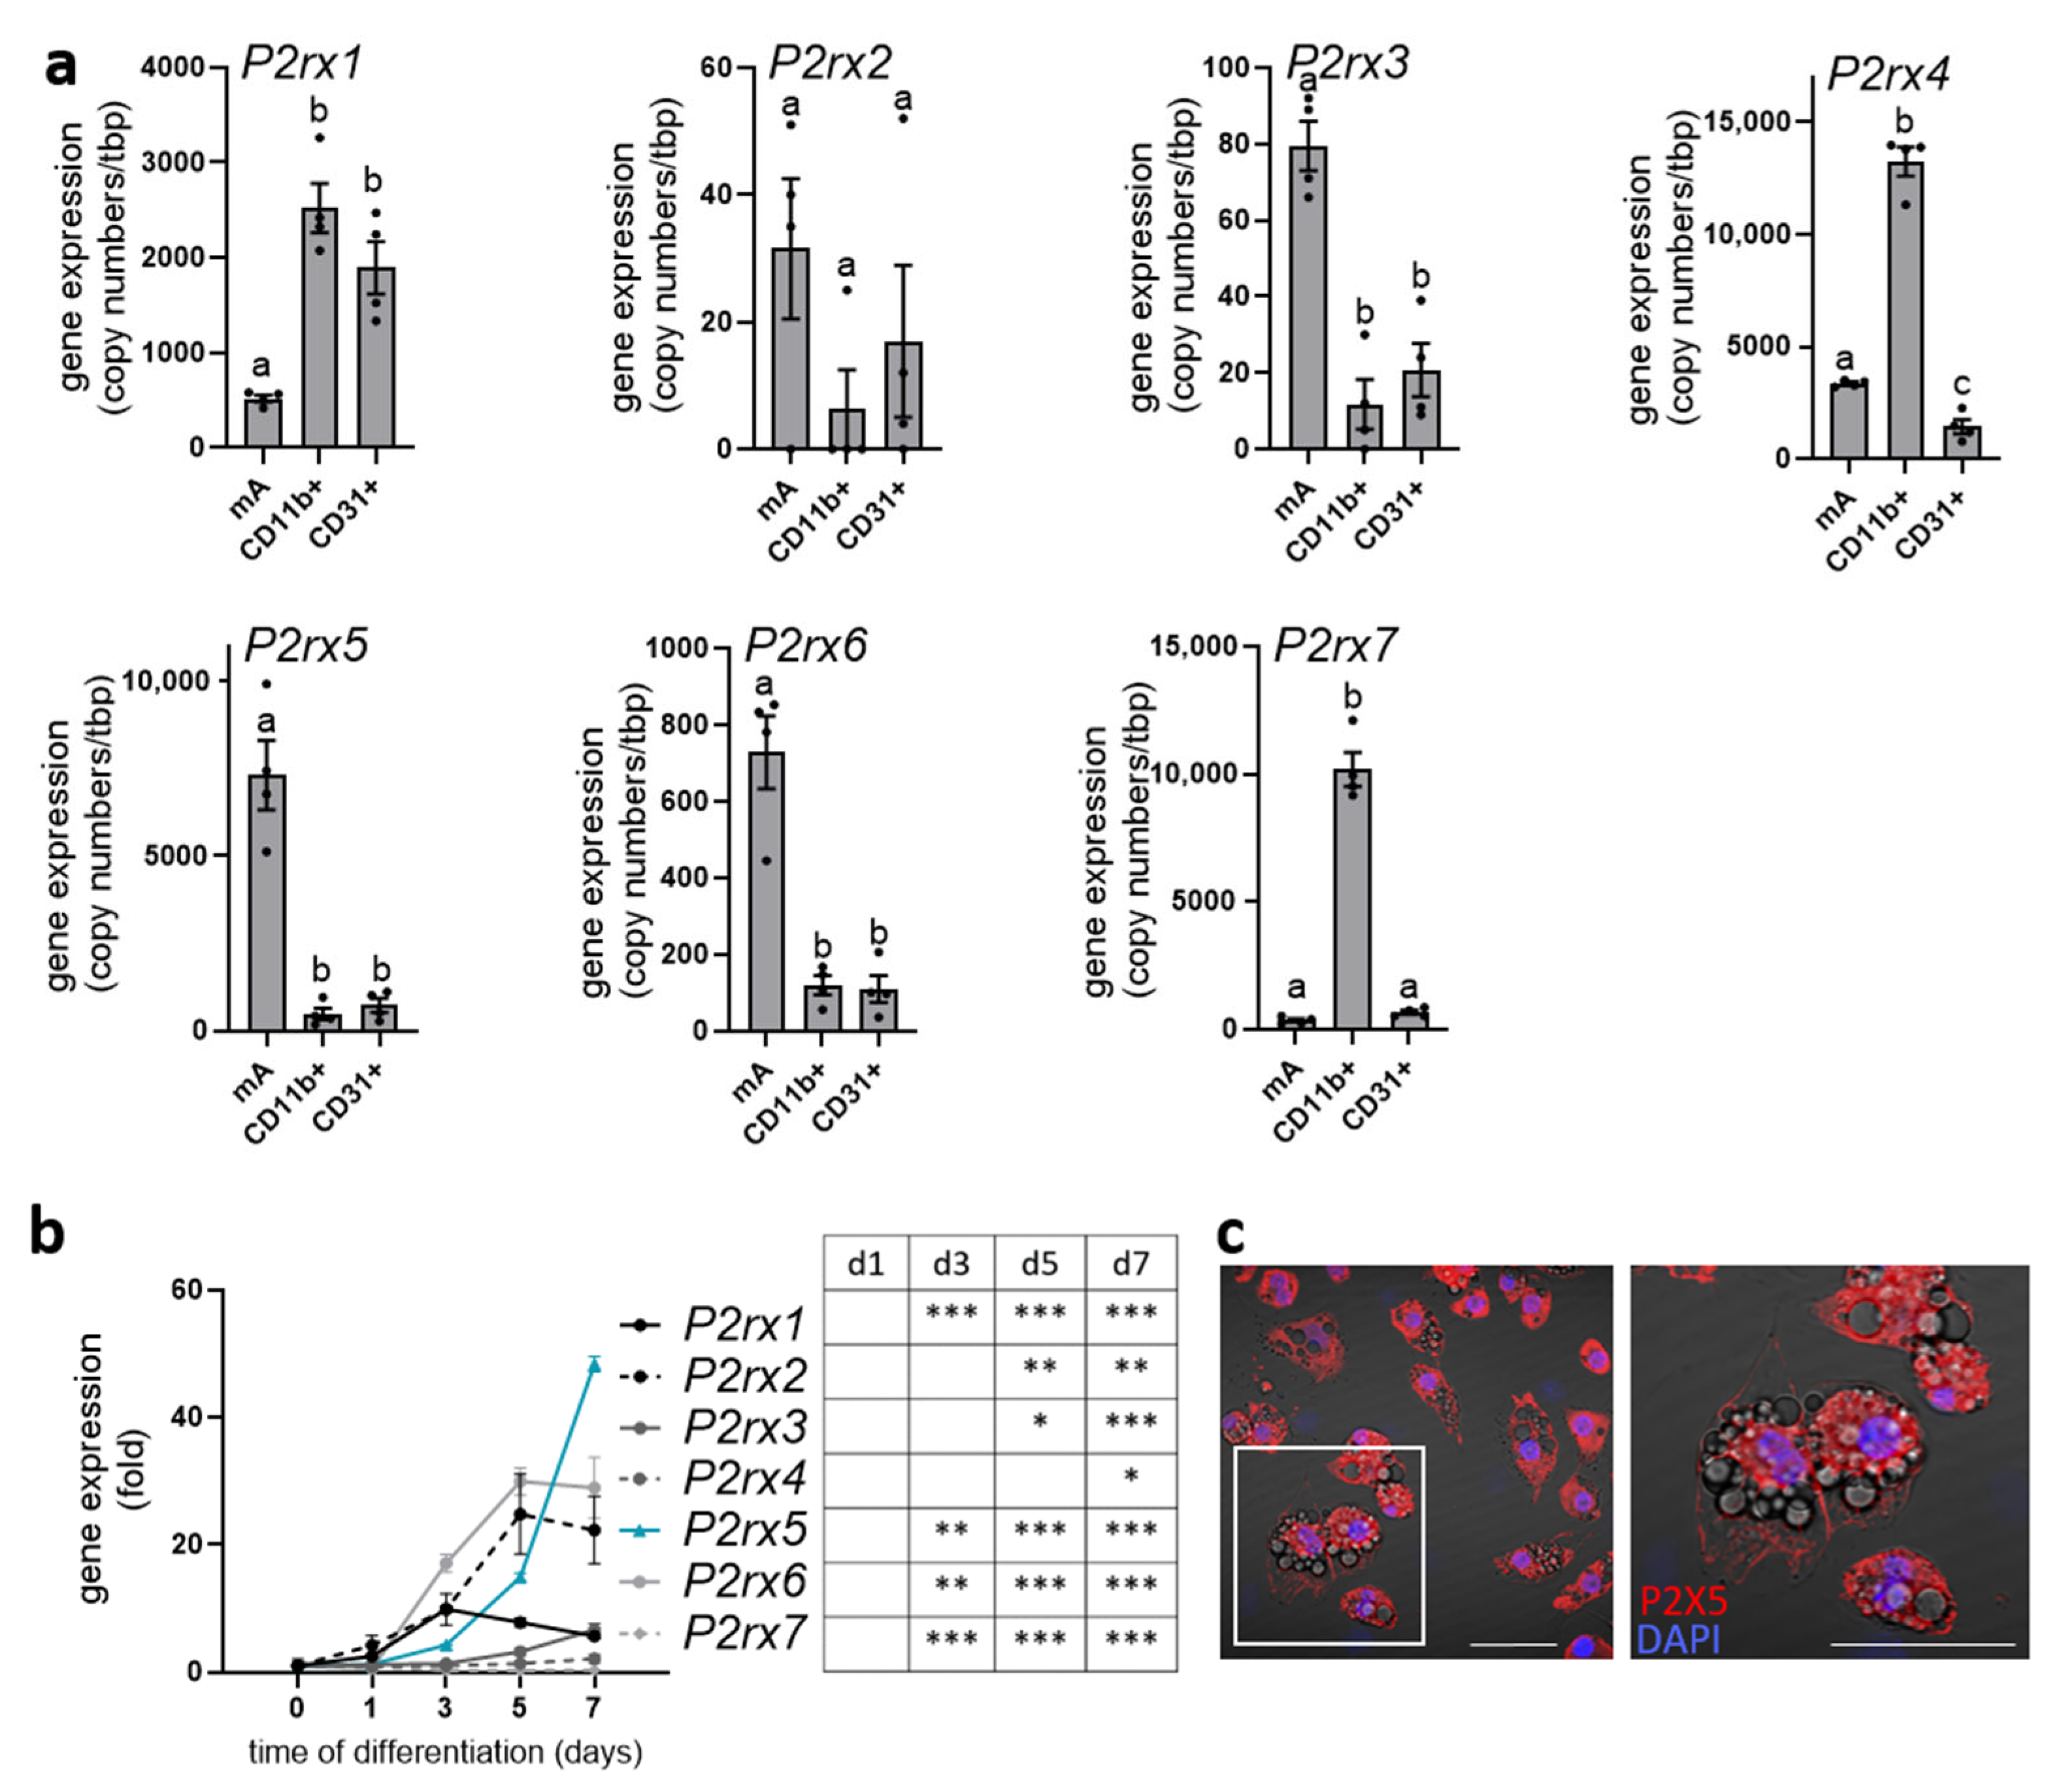
2.1. P2rx5 Is Highly Expressed by Mature Brown Adipocytes

P2X5 was described as a cell surface marker for brown adipocytes, with its highest expression in brown adipose tissue (BAT) compared to other organs such as white adipose tissue, the heart, or the liver (Supplementary Figure S1) [27]. To further study the cell type-specific expression of all purinergic P2X receptors (P2rx17) in BAT, we isolated mature brown adipocytes (mA), tissue-resident myeloid cells including macrophages (CD11b+), and endothelial cells (CD31+) by magnetic-activated cell sorting (MACS®) (Figure 1a). Of note, P2rx5 was predominantly expressed by mature brown adipocytes with a high copy number. Similarly, P2rx3 and P2rx6 were mainly detected in the brown adipocyte fraction but at a lower abundance, as indicated by much lower copy numbers. While P2rx1 was expressed by myeloid and endothelial cells, P2rx4 and P2rx7 were marker genes for myeloid cells in the BAT. Moreover, P2rx5 gene expression increased during the differentiation of BAT-derived stromal vascular cells to mature brown adipocytes and displayed the highest fold induction of all P2X receptors (Figure 1b). Next to gene expression, we detected endogenous P2X5 protein at the plasma membrane of terminally differentiated brown adipocytes (Figure 1c). In line with previous studies describing P2X5 as a brown adipocyte cell surface marker [27], these data confirm that P2rx5 is predominantly expressed by mature brown adipocytes in BAT and is upregulated upon adipogenic differentiation.

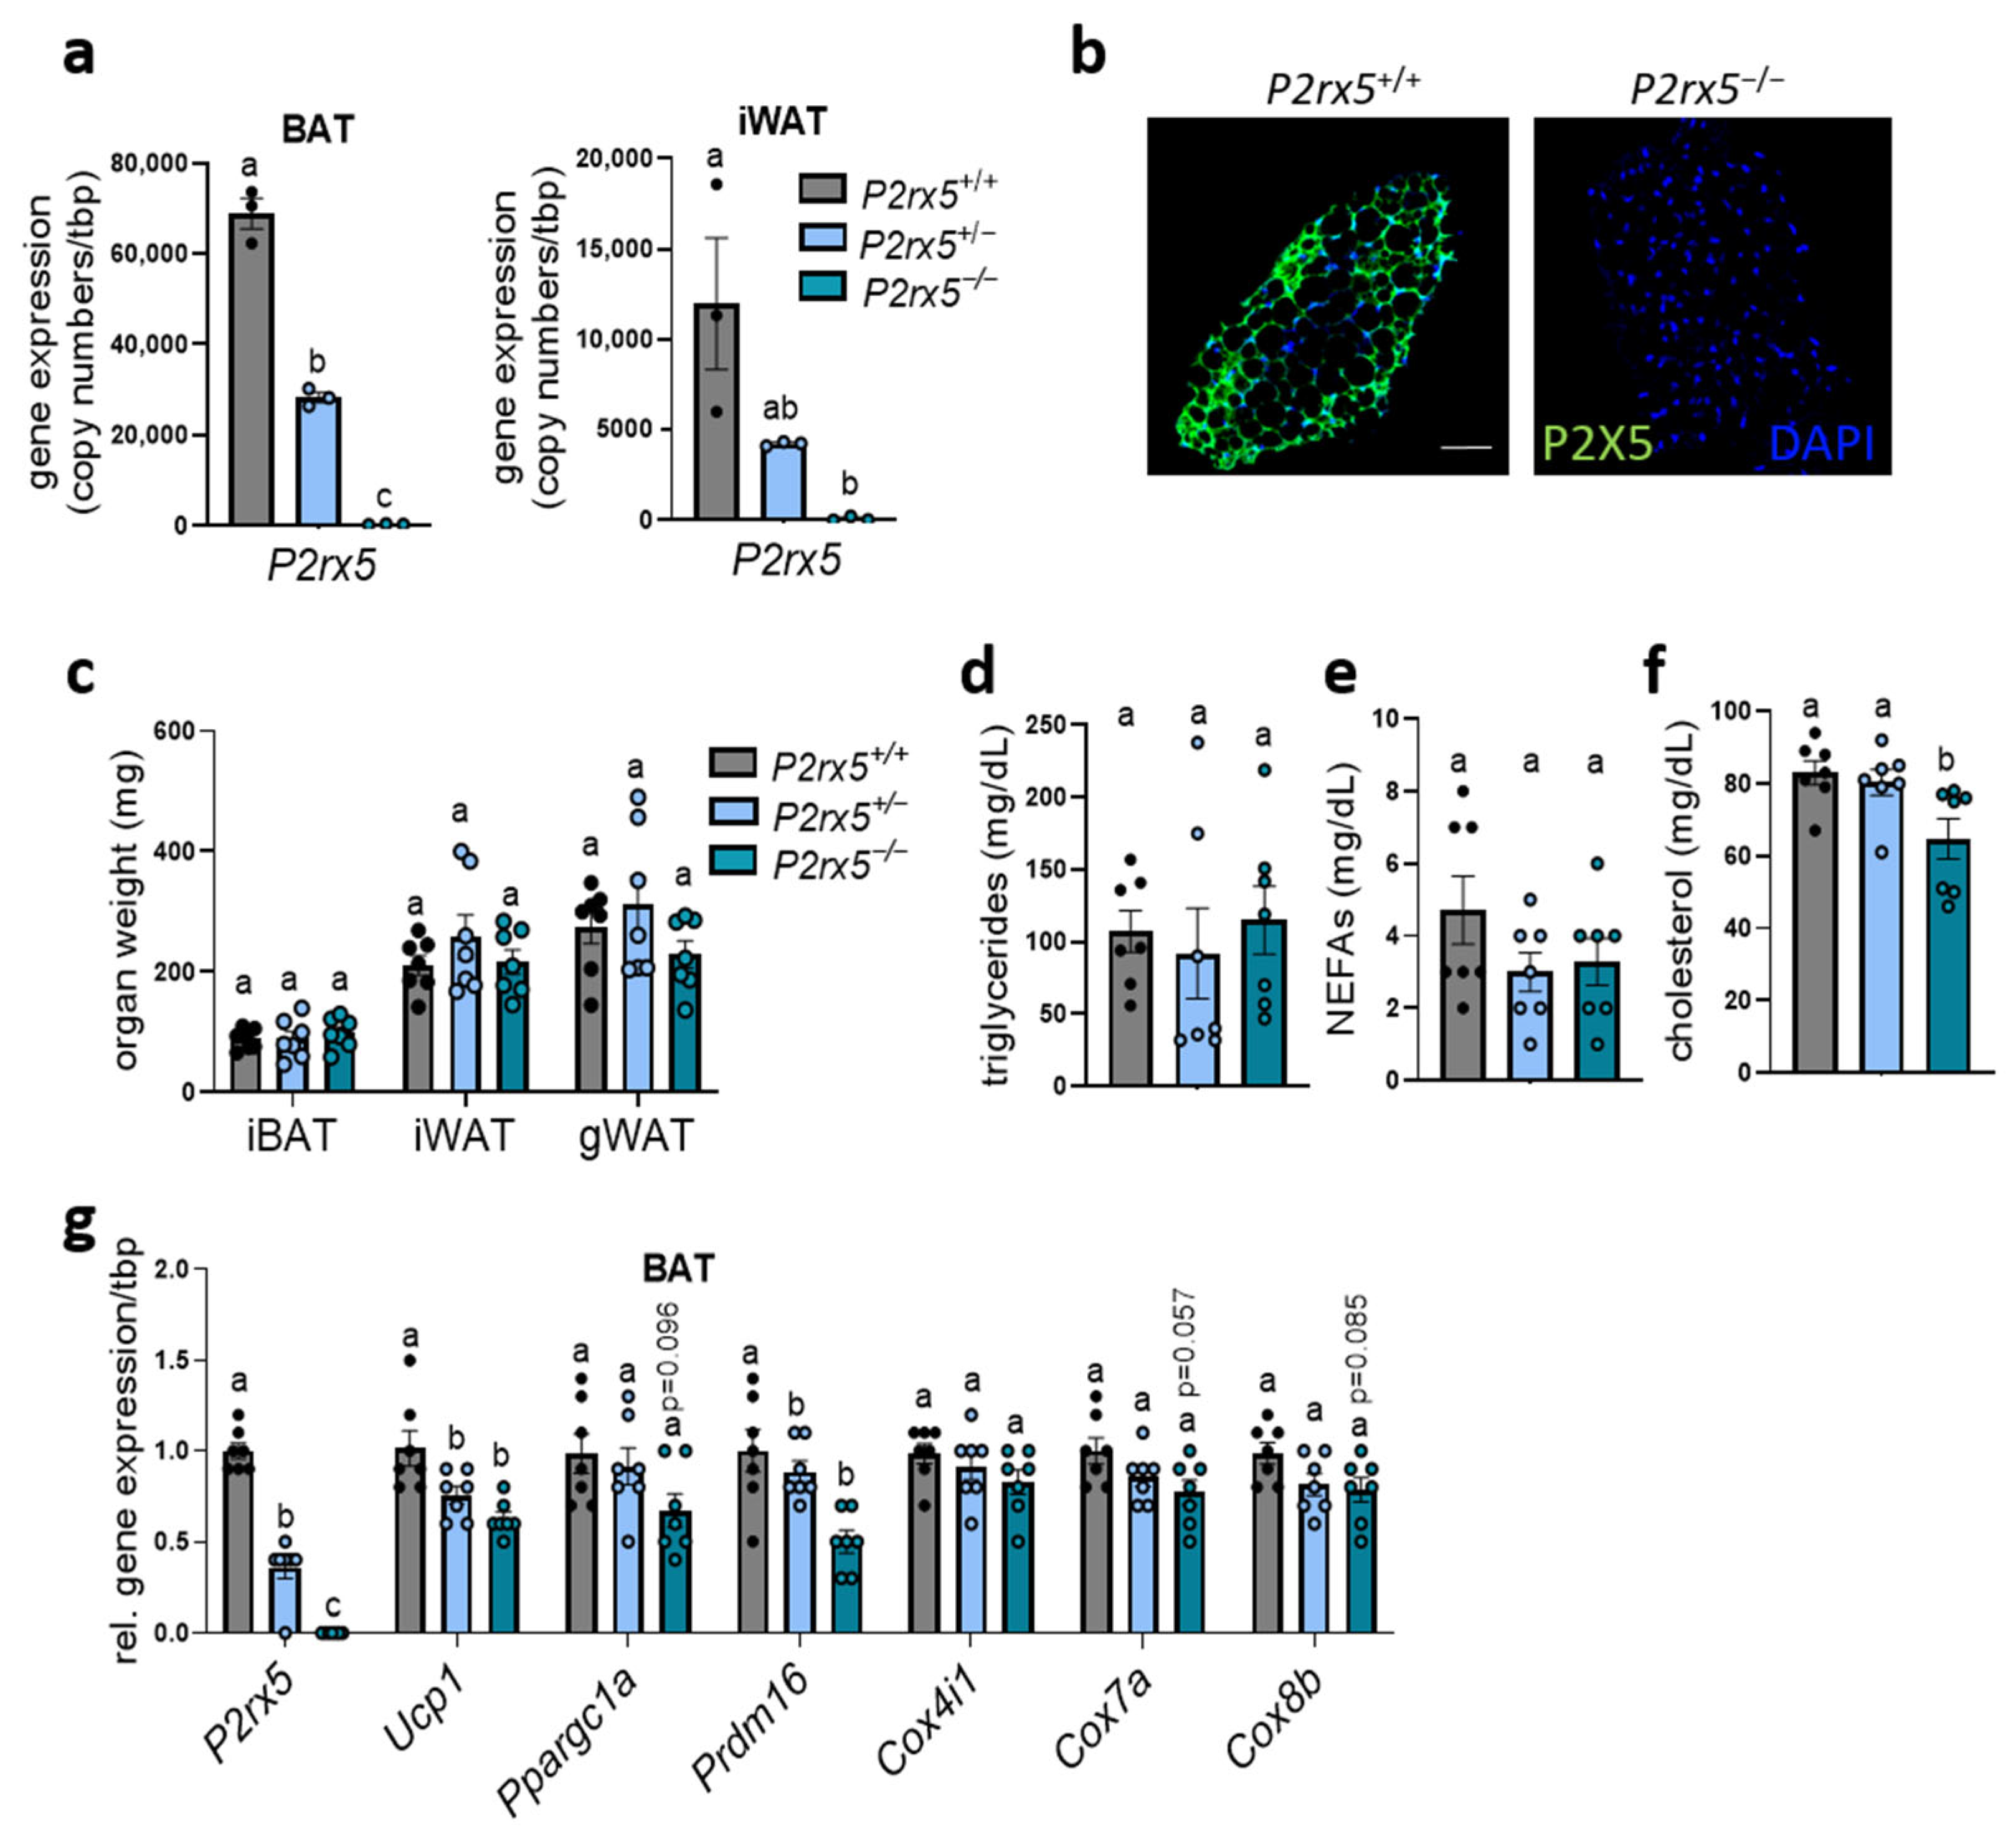
2.2. P2rx5 Deficiency Resulted in Lower Expression of Thermogenic Markers in BAT

To investigate the relevance of P2rx5 for adaptive thermogenesis, we generated a whole-body-deficient P2rx5 mouse model. Basal characteristics were determined in homozygous (P2rx5−/−), heterozygous (P2rx5+/−) knockout and wild type (P2rx5+/+) littermates housed at room temperature (22 °C), which is a mild cold exposure for mice. In BAT, we observed a high P2rx5 expression in wild type mice, whereas heterozygous mice display a 50% reduction (Figure 2a). Next to gene expression, we confirmed the successful deletion of P2X5 on a protein level by immunohistological staining of BAT comparing wild type and homozygous P2rx5 knockout mice (Figure 2b). A similar pattern, but with a lower expression level, was observed in WAT, which is most likely due to P2rx5 expression by beige adipocytes. In these and other tissues, we showed a complete deletion of P2rx5 in homozygous knockout mice (Figure 2a, Supplementary Figure S1). Under these conditions we detected similar adipose tissue weights (interscapular BAT, inguinal WAT, and gonadal WAT), plasma triglycerides, and non-esterified fatty acids, as well as lower cholesterol levels, when comparing the different groups (Figure 2c–f). In the BAT of P2rx5-knockout mice, gene expression of thermogenic marker genes was significantly lower (Ucp1, Prdm16) or showed a tendency (Ppargc1a, Cox7a, Cox8b) to be decreased compared to the control or heterozygous mice (Figure 2g).
In line with this, protein levels of UCP1 and the respiratory OXPHOS complexes were lower in the BAT of mice lacking P2rx5 (Figure 3a,b). The importance of P2rx5 for systemic energy expenditure during different ambient temperatures was directly investigated by housing P2rx5-knockout and control mice in an indirect calorimetry system. Here, the housing temperature was decreased stepwise (6 °C per day) starting at thermoneutrality (30 °C) down to 6 °C. Despite lower UCP1 expression, the energy expenditure, body core temperature, and body weights of P2rx5-knockout mice were comparable to wild type controls (Figure 3c, Supplementary Figure S2).
Next to its contribution to systemic energy expenditure, BAT has a capacity to internalize energy-rich substrates such as glucose [8]. As extracellular ATP released by pannexin 1 has been shown to regulate adipocyte glucose uptake [30], we determined a potential role of P2rx5 for systemic glucose metabolism. Compared to control wild type littermates, basal plasma insulin levels were higher in P2rx5−/− mice (Figure 3d), which is in line with the impaired insulin sensitivity shown by higher glucose levels during insulin tolerance tests (Figure 3e). Moreover, global P2rx5 deficiency resulted in a slightly impaired glucose tolerance (Figure 3f) that can be explained by lower glucose uptake specifically by BAT but not other organs, as shown by diminished uptake of the orally applied radioactive tracer 3H-deoxyglucose (Figure 3g). Overall, these findings indicate that P2rx5 regulates the expression of thermogenic mediators such as UCP1 but is dispensable for whole-body energy expenditure in mice exposed to different ambient temperatures. Notably, P2rx5 promotes glucose disposal by BAT and thereby it regulates systemic glucose homeostasis.

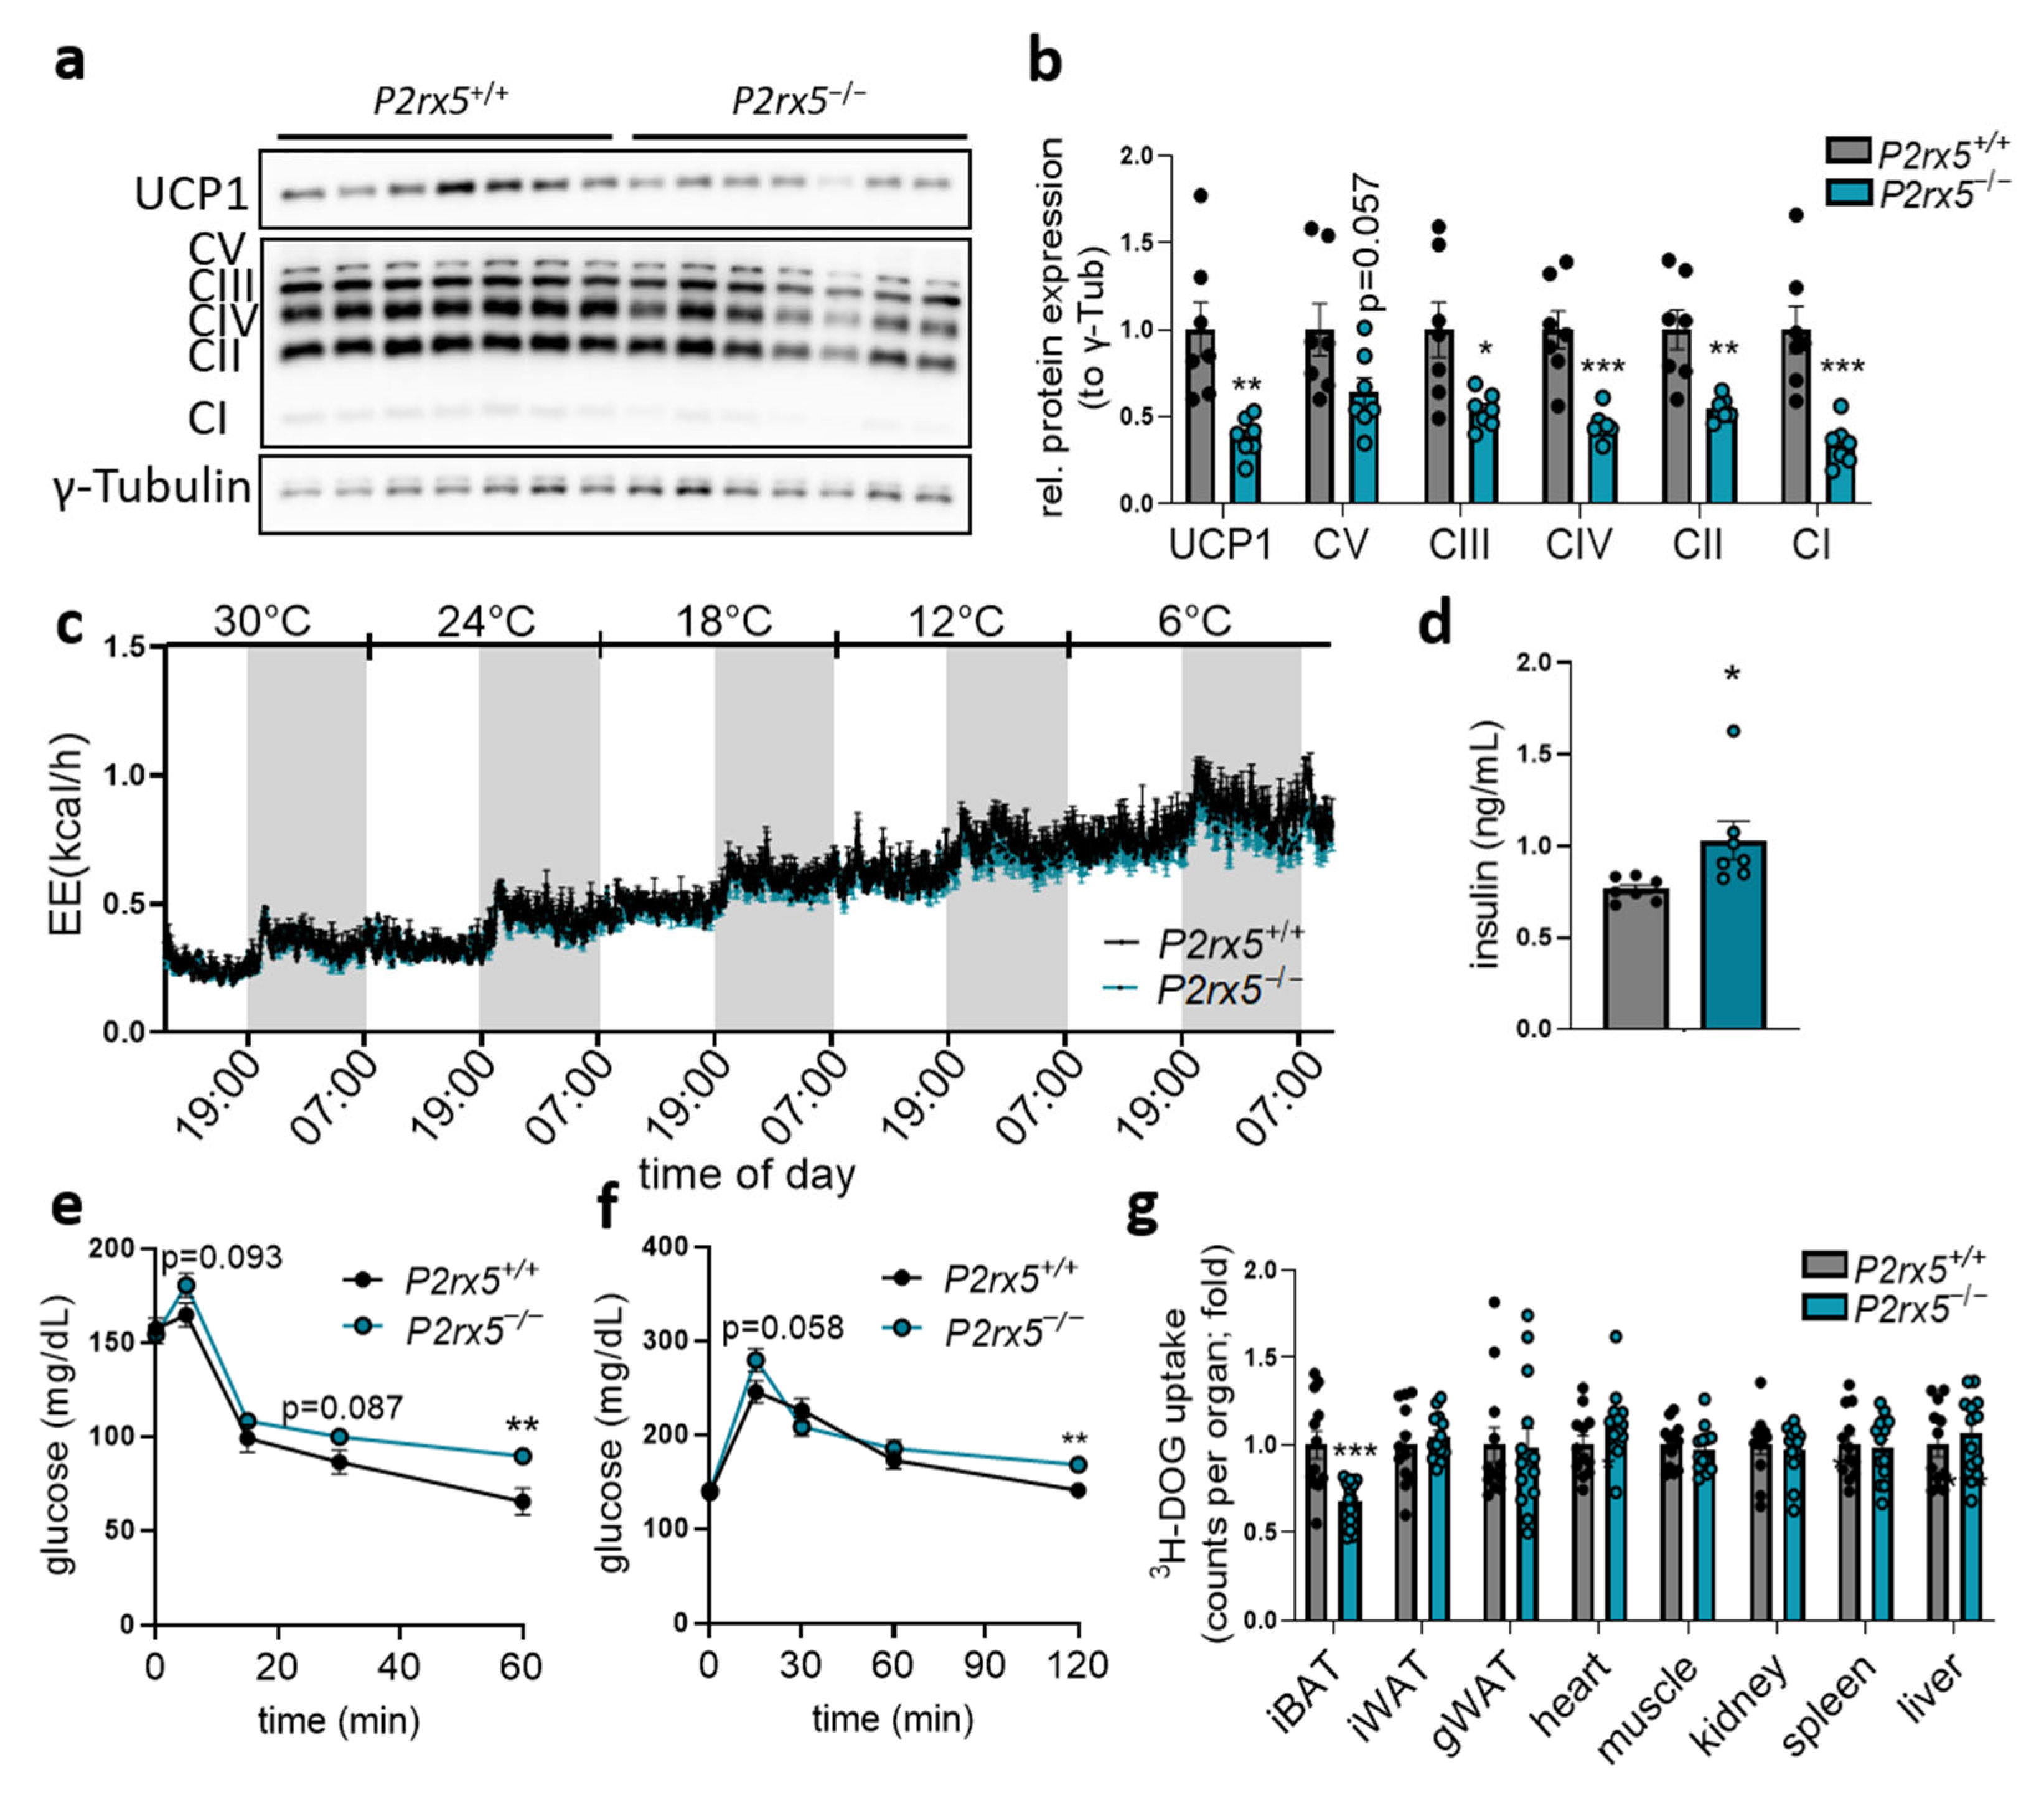
2.3. Brown Adipocyte-Specific P2rx5 Deletion Resulted in Lower UCP1 Expression and Impaired Glucose Tolerance

To assess the cell type specific role of P2rx5 expressed by brown adipocytes, we generated brown adipocyte-specific P2rx5-knockout mice (P2rx5fl/fl-Ucp1Cre+) as well as control littermates (P2rx5fl/fl-Ucp1Cre−). Successful deletion of P2rx5 was detected in BAT, again verifying P2rx5 to be predominantly expressed by the brown adipocytes but not other cell types in thermogenic adipose tissues (Figure 4a). Since Ucp1+ positive beige adipocytes are present in WAT depots upon thermogenic activation in mice housed below thermoneutrality, a lower expression of P2rx5 was also detected in iWAT and gonadal WAT (gWAT) of P2rx5fl/fl-Ucp1Cre+ compared to P2rx5fl/fl-Ucp1Cre− controls (Figure 4a). In various other organs, e.g., the heart, muscle, and the liver, P2rx5 expression levels were unaffected (Figure 4a). In line with the mRNA expression data, efficient depletion of P2X5 in BAT could be demonstrated by immunohistochemistry (Figure 4b). Under these conditions, P2rx5fl/fl-Ucp1Cre+ and P2rx5fl/fl-Ucp1Cre− mice display comparable adipose tissue weights as well as plasma triglyceride levels (Figure 4c,d). Plasma non-esterified fatty acid and cholesterol levels were decreased in P2rx5fl/fl-Ucp1Cre+ mice compared to controls (Figure 4e,f). Similarly to whole-body P2rx5-knockout mice, lack of P2rx5 in brown adipocytes resulted in lower Ucp1 expression (Figure 4g). To confirm this finding on a cellular level, we knocked-down P2rx5 in differentiated primary and immortalized murine brown adipocytes in vitro using an siRNA-mediated approach. In line with the results obtained in vivo, P2rx5 knockdown is associated with lower Ucp1 expression (Figure 4h,i).
Protein levels of UCP1 and the respiratory OXPHOS complexes were decreased in the BAT of mice lacking P2rx5 specifically in brown adipocytes (Figure 5a,b). Similarly to the whole-body knockout, indirect calorimetry studies indicated comparable energy expenditure as well as similar body core temperature and body weights of P2rx5fl/fl-Ucp1Cre+ and P2rx5fl/fl-Ucp1Cre− mice at different temperature conditions (Figure 5c, Supplementary Figure S3). In line with the global knockouts, we observed a trend for higher basal plasma insulin (Figure 5d) and an impaired blood glucose clearance in P2rx5fl/fl-Ucp1Cre+ mice compared to P2rx5fl/fl-Ucp1Cre− mice (Figure 5e). Altogether, these data suggest that P2rx5 expressed in brown adipocytes regulates Ucp1 expression and influences systemic glucose metabolism.

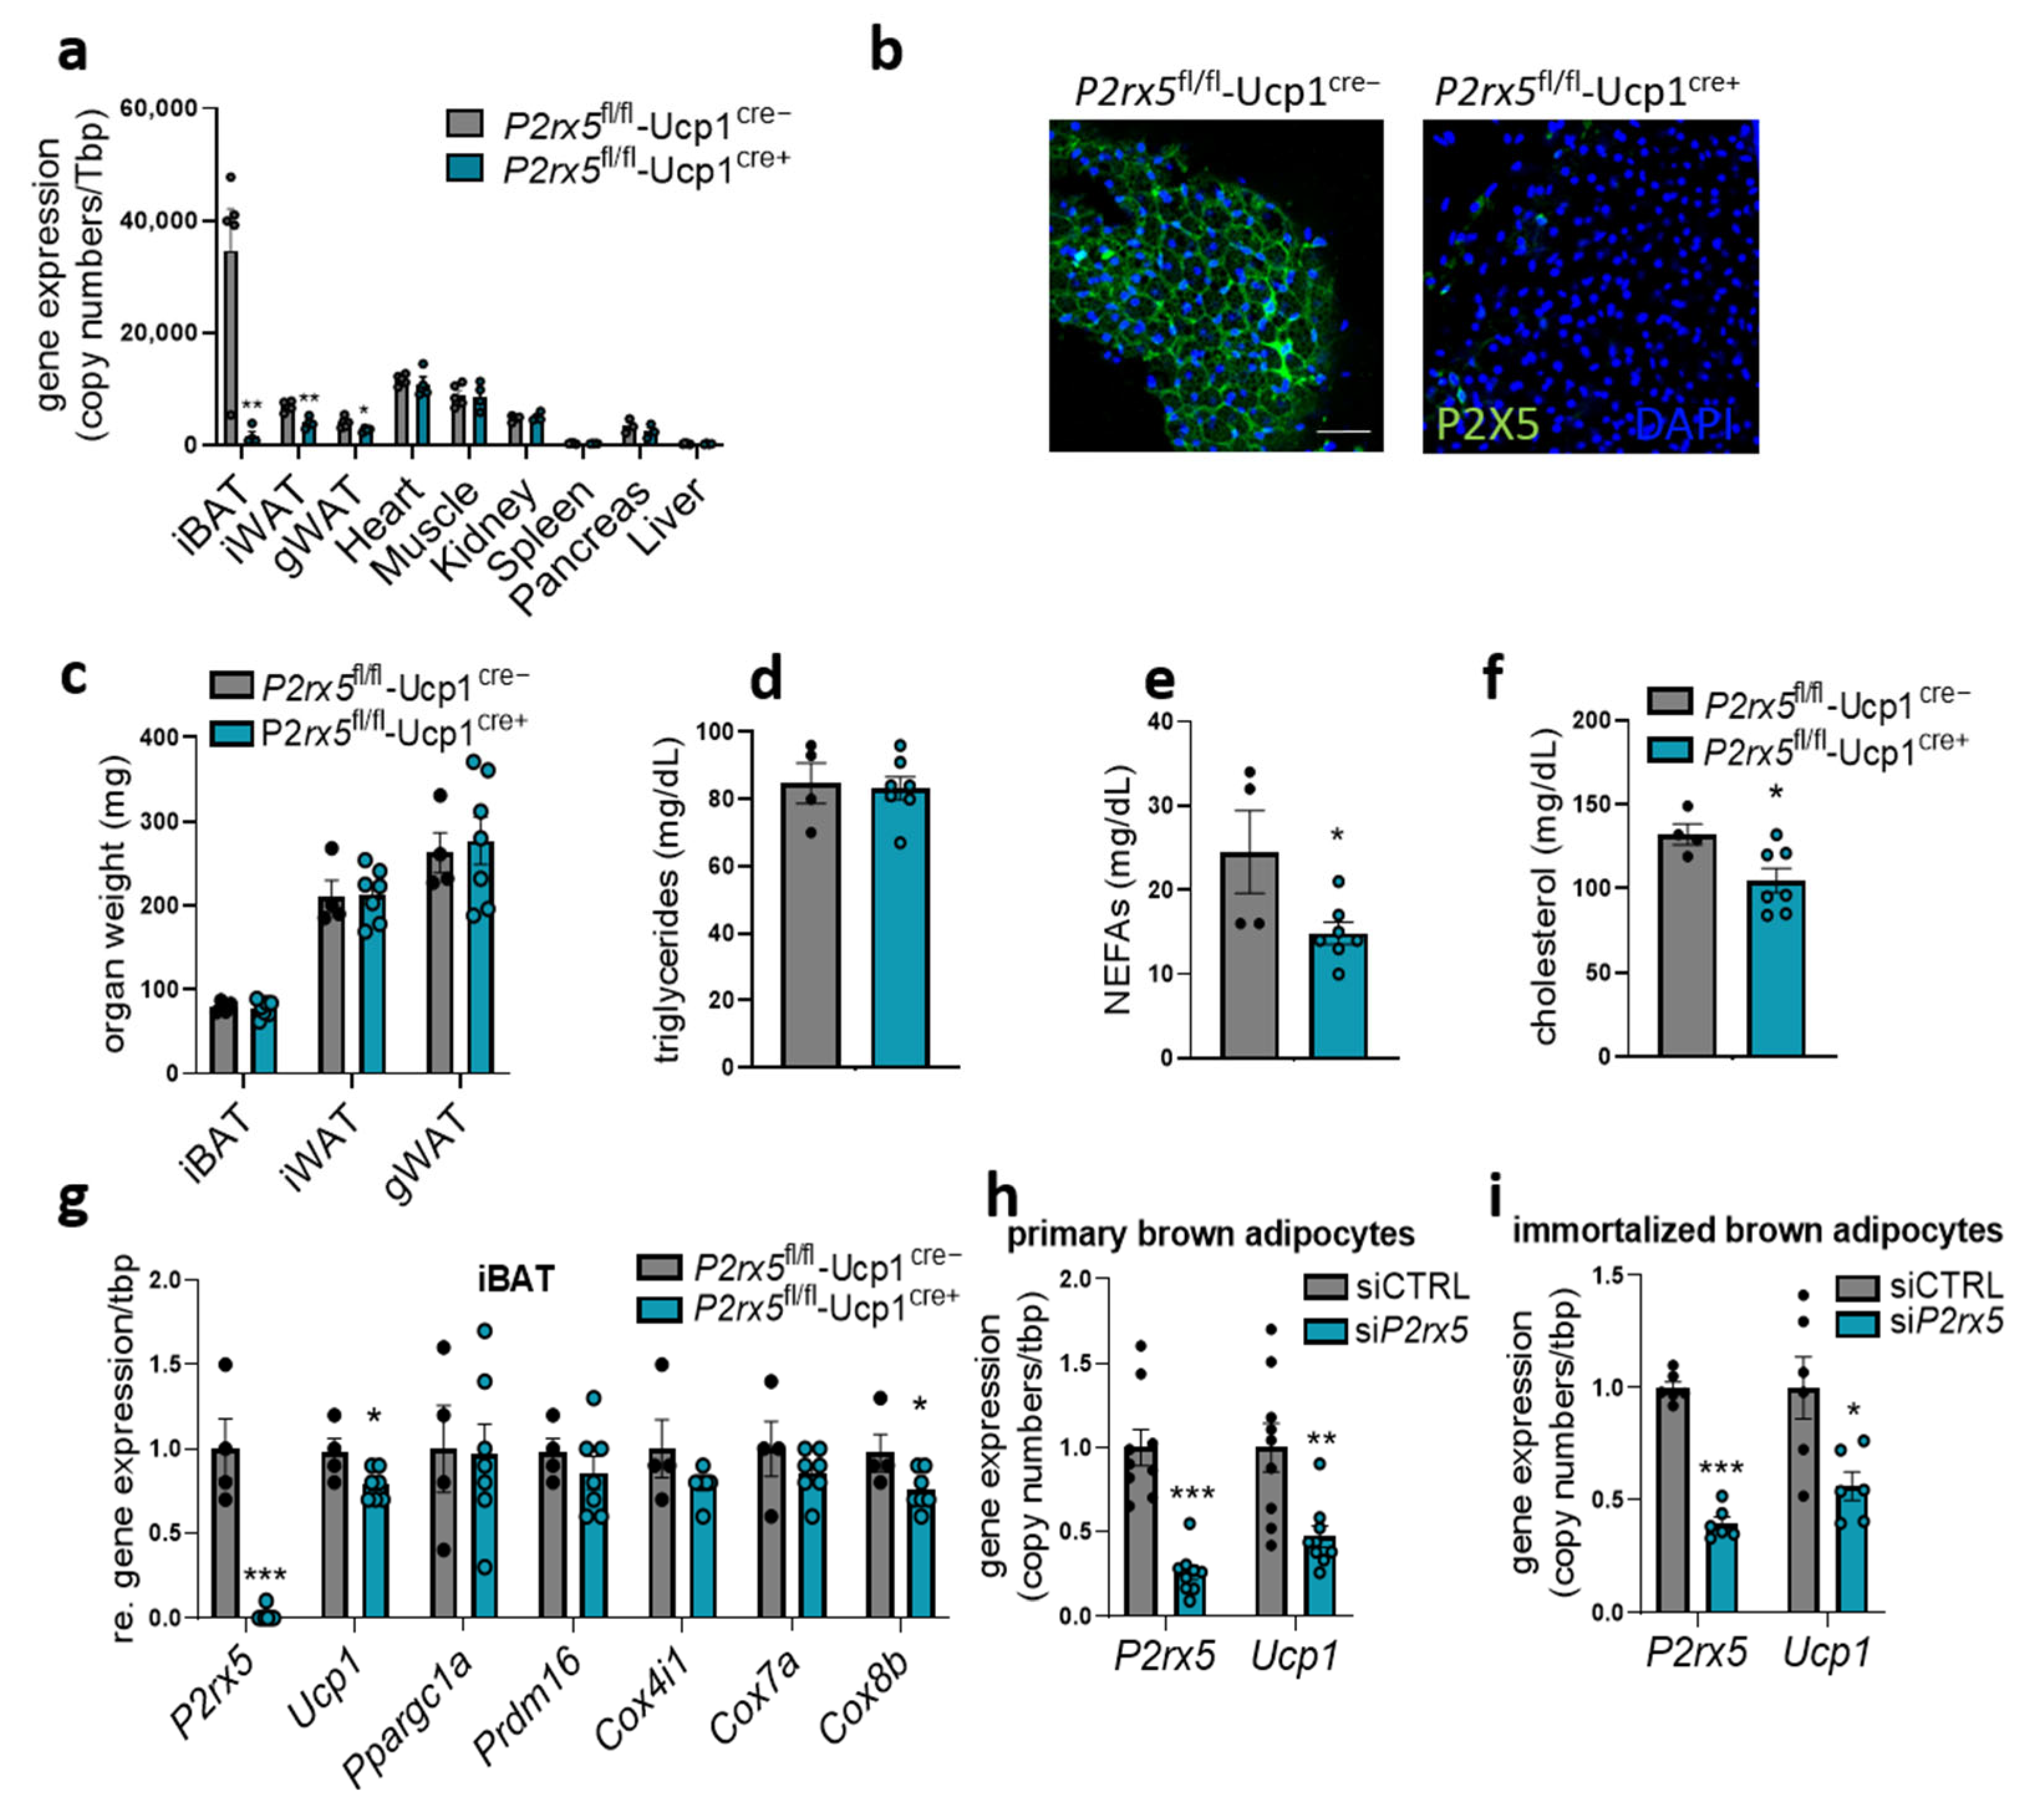
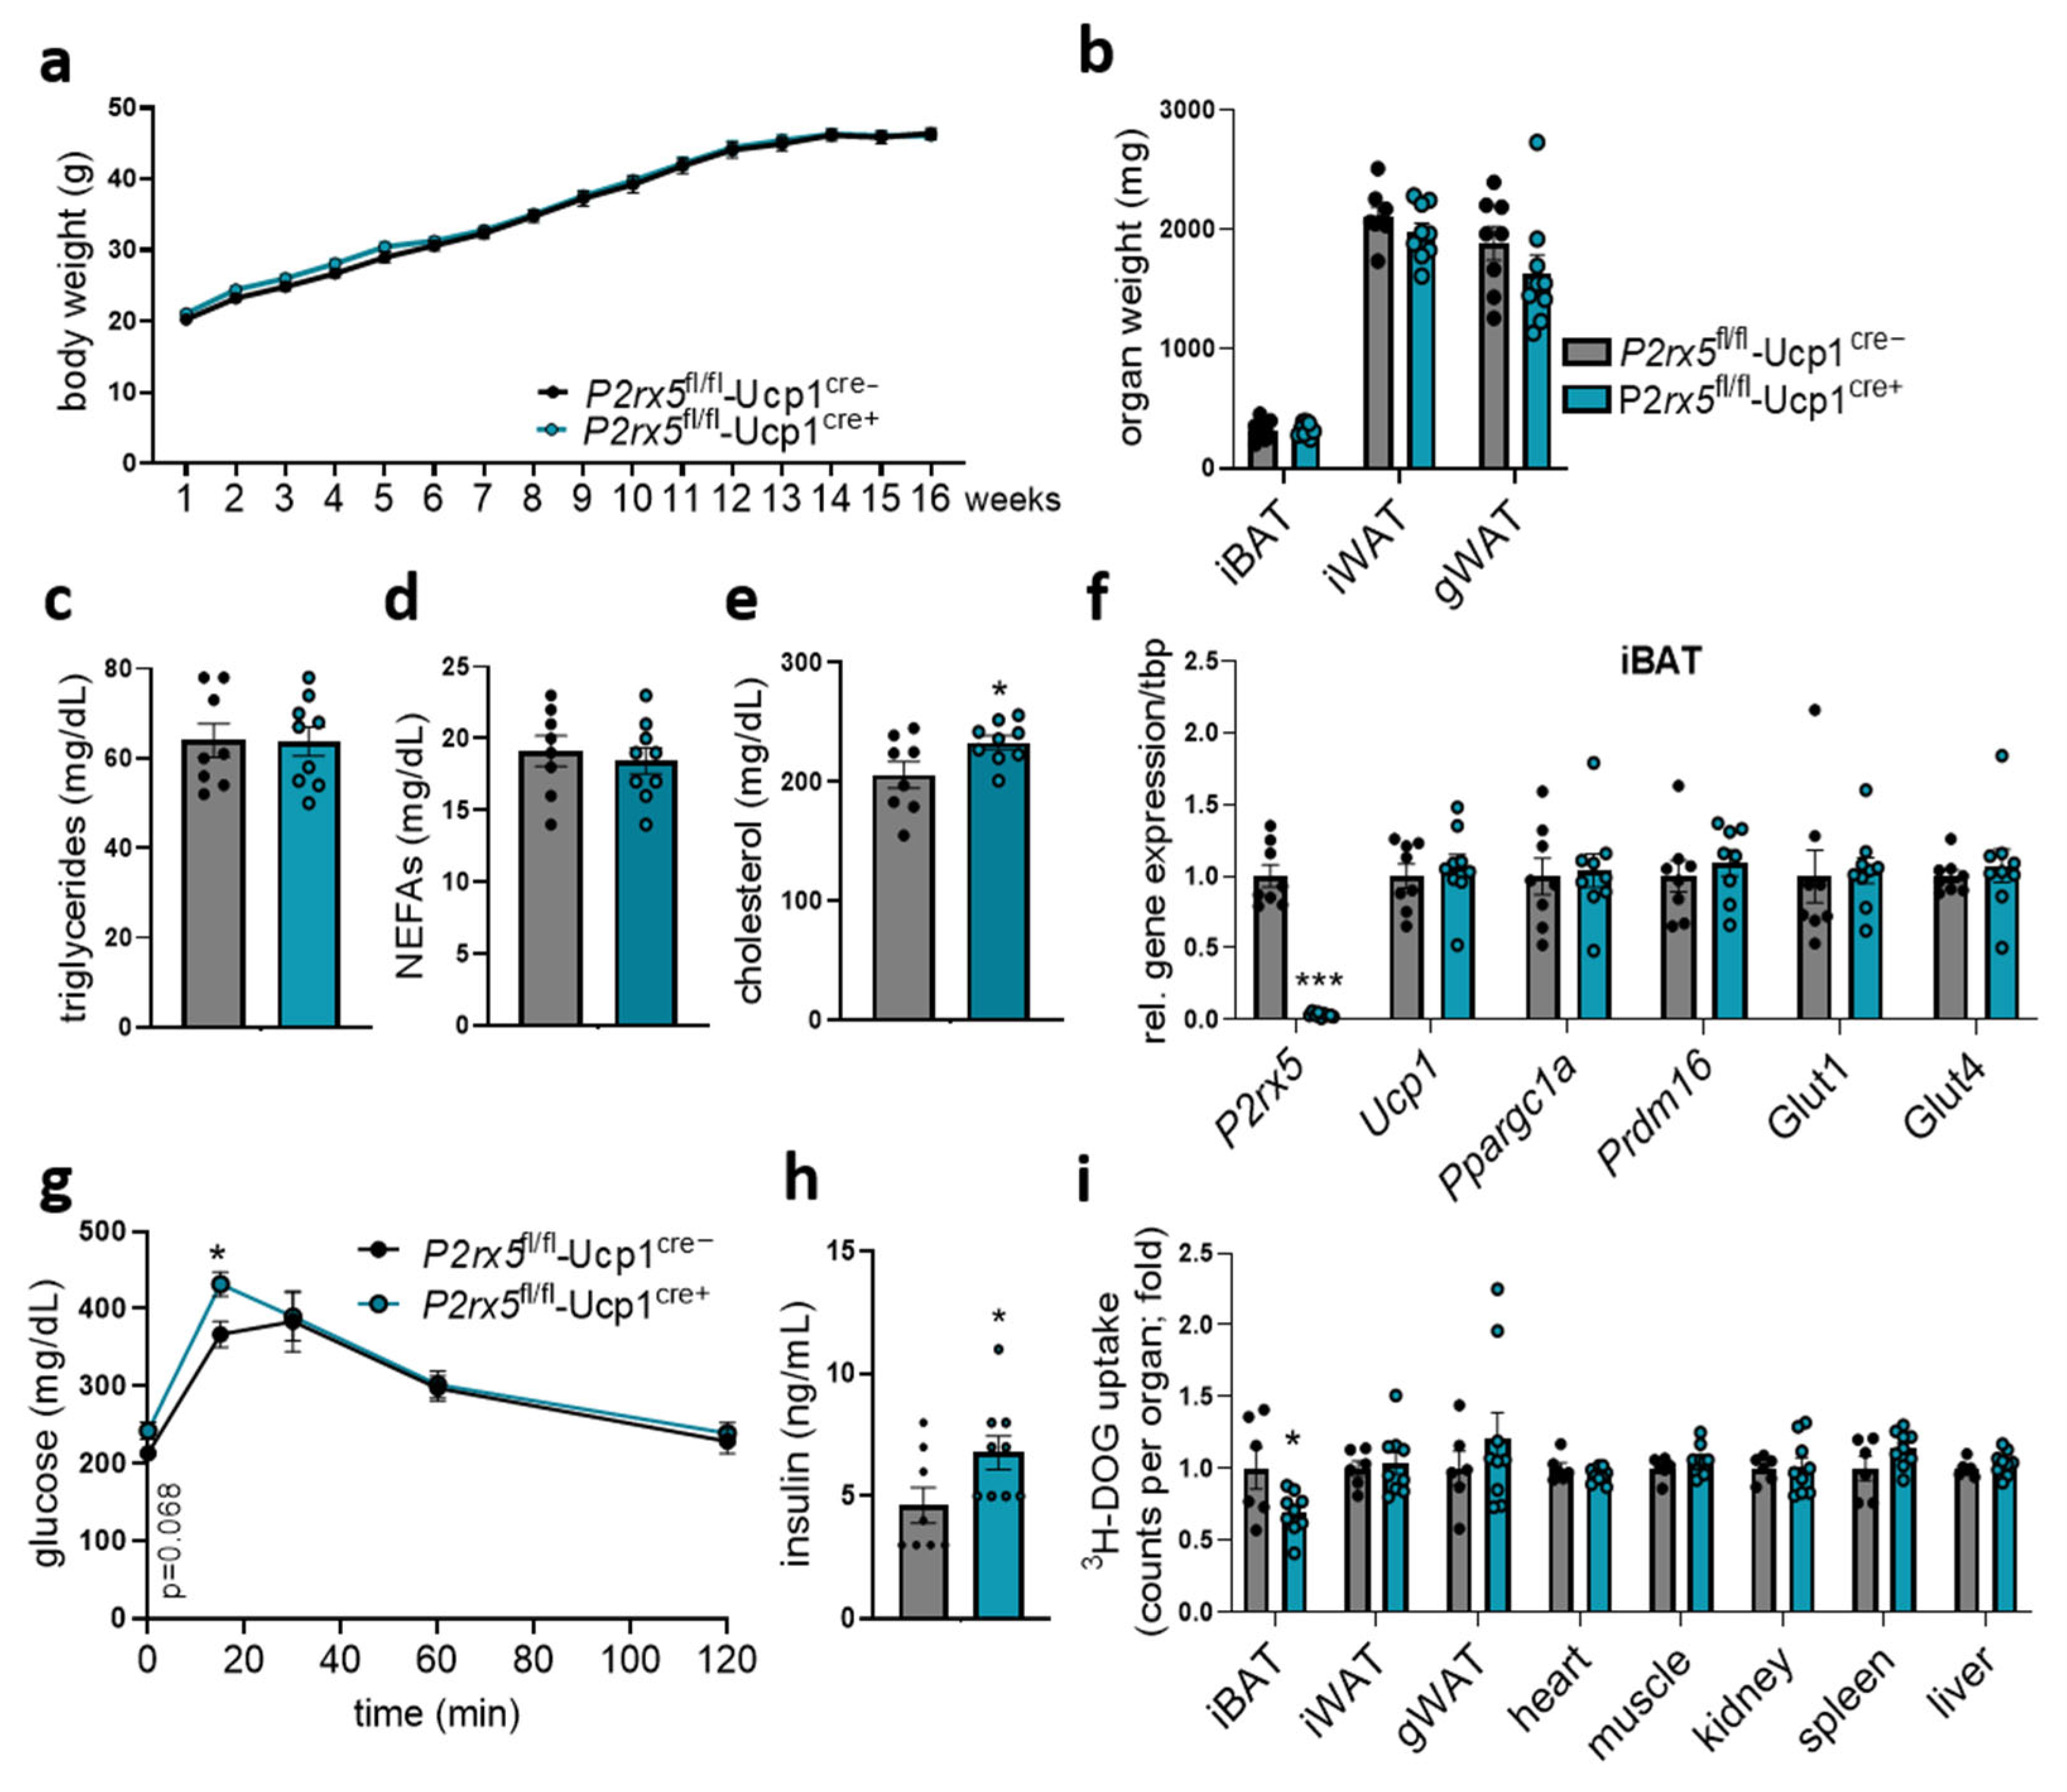
2.4. Brown Adipocyte-Specific P2rx5 Deficiency Impaired Glucose Tolerance and Uptake into BAT of Diet-Induced Obese Mice

In obesity, insulin-resistant adipose tissue is associated with defective systemic glucose handling. To investigate glucose metabolism under obesogenic conditions, we challenged P2rx5fl/fl-Ucp1Cre+ mice and littermate controls by feeding a high-fat diet (HFD) to induce diet-induced obesity. After 16 weeks of HFD feeding, P2rx5fl/fl-Ucp1Cre+ mice and controls had similar body weights and organ weights, as well as plasma triglyceride and non-esterified fatty acid levels (Figure 6a–d). Plasma cholesterol levels were slightly elevated in mice lacking P2rx5 in brown adipocytes (Figure 6e). Moreover, gene expression of thermogenic markers in BAT was unaffected in P2rx5fl/fl-Ucp1Cre+ mice compared to P2rx5fl/fl-Ucp1Cre− mice (Figure 6f). In line with impaired blood glucose tolerance in conditions of regular diet feeding, obese mice with brown adipocyte-specific P2rx5 deficiency had higher blood glucose levels at basal and 15 min after oral glucose gavage (Figure 6g), as well as elevated plasma insulin levels (Figure 6h). To quantify the organ-specific glucose uptake, we traced the glucose gavage solution with radiolabeled 3H-deoxyglucose. Remarkably, elevated systemic glucose levels can be explained by reduced 3H-deoxyglucose disposal by the BAT of mice lacking P2rx5 in brown adipocytes (Figure 6i). Taken together, these data indicate that in brown adipocytes P2rx5 shapes systemic glucose handling in both basal and obese conditions.

3. Discussion

Norepinephrine released by sympathetic nerves innervating the BAT induces heat production via adrenergic stimulation. The subsequent cAMP-mediated signalling cascades orchestrate the efficient handling of nutrients including the liberation of fatty acids from lipid droplets and the gene expression of thermogenic genes [3]. However, additional stimulatory but also inhibitory signalling pathways regulated by hormones and lipokines have been shown to modulate thermogenic responses in BAT and WAT. For instance, the adipocyte-derived released C-terminal fragment of Slit2 induces a thermogenic programme through the protein kinase A signalling pathway, enhancing energy expenditure and glucose disposal in vivo [31]. Also, lipids with signalling properties, such as 12,13-dihydroxy-9Z-octadecenoic acid (12,13-diHOME), can be released by adipocytes in response to cold exposure to mediate uptake of energy-rich substrates including glucose and fatty acids [32]. Next to proteins and lipokines, adenine nucleotides have also been suggested to shape intercellular crosstalk and thermogenic function [33]. It is known that the levels of extracellular ATP increase in response to BAT stimulation, e.g., by electric field stimulation [18]. The subsequent hydrolysis by several ectoenzymes results in the formation of ADP, AMP, adenosine, and inosine. The latter have been intensively studied in adipose tissues, showing that both adenosine and inosine induce browning and activate thermogenesis via A2A- and A2B-receptor signalling [18,34,35]. In addition, adenosine generated by the ectoenzyme CD73 can be internalized and converted to AMP by intracellular adenosine kinase, shaping AMP kinase activity and thus endogenous lipid synthesis in adipocytes [36]. While these pathways focused on the degradation products of ATP, the potential relevance of direct ATP sensing by thermogenic adipocytes is less well understood. In this context it is of note that the intensively studied ATP receptor P2X7 is dispensable for energy expenditure under conditions of both diet-induced and cold-stimulated thermogenesis [26]. However, P2X7 is primarily expressed by immune cells present in WAT and BAT, while another member of this family, P2X5, has been identified as a cell surface marker of brown adipocytes [27]. In the current study, we confirmed that P2rx5 is highly abundant in mature brown adipocytes. Based on metabolic studies using whole-body and brown adipocyte-specific P2rx5 knockout mice, we found that P2X5 modulates thermogenic marker expression in BAT but is dispensable for systemic energy expenditure. Interestingly, global and brown adipocyte-specific P2rx5 deficiency is associated with impaired glucose tolerance in both lean and diet-induced obese mice, most likely due to it regulating glucose disposal into BAT depots. In a recent report studying global P2X5 knockout mice, an anti-obesity effect was described in response to P2X5 agonism using a stabilized ATP analogue in mice which was explained by enhanced BAT recruitment [37]. Although lower UCP1 levels and OXPHOS proteins in the BAT of global and brown adipocyte-specific P2rx5 deficient mice were detected in the current study, whole-body energy expenditure and body weight gain were similar when comparing the different genotypes. These discrepancies might be explained by different experimental study designs, as we did not administer pharmacological doses of ATP. Moreover, we show that P2X5 modulates BAT glucose uptake, which is associated with systemic glucose homeostasis. In light of the lower UCP1 expression levels, we cannot rule out the possibility that lower glucose uptake is also associated with impaired BAT-mediated energy expenditure. However, this mild effect may be too small to be detected in whole-body energy expenditure, which was determined by indirect calorimetry. Functioning as an ion channel, P2X5 has the potential to shuttle different ions between extra- and intracellular space and to evoke ion-driven signals [38]. Other ion channels have also been suggested to influence brown adipocyte thermogenesis by altering membrane potential during sympathetic activation. For instance, the potassium two-pore domain channel subfamily K member 3 (KCNK3) expressed by adipocytes limits Ca2+ influx by antagonizing membrane depolarization in response to norepinephrine [39]. Consequently, Ca2+ impulses needed for efficient activation of adenylate cyclase-dependent cAMP generation are dampened, lowering adaptive thermogenesis [39]. On the other hand, calcium-permeable channels of the transient receptor potential (TRP) ion channel family are described to induce thermogenic gene expression and mediating adipocyte thermogenesis [40]. For instance, the TRP vanilloid 2 (TRPV2) acts synergistically with beta-adrenergic signalling by inducing Ca2+ influx [41]. Furthermore, the depletion of the non-voltage-activated Ca2+ channel TRP melastatin 2 (TRPM2) resulted in the lower expression of thermogenic genes such as Pgc1α and Ucp1 as well as diminished energy expenditure in response to cold exposure and the beta-3-adrenergic agonist CL316,243 [42]. In a similar manner, the observed decrease in UCP1 expression and impaired glucose disposal into BAT of P2rx5-deficient mice could be explained by lower ATP-induced Ca2+ influx and the subsequent dampening of cAMP-dependent signalling. In the current study, the lower expression of thermogenic markers does not impact whole-body energy expenditure and thermogenic capacity, which suggest compensatory mechanisms by other P2X receptors and/or TRP channels. In the human context it is of note that a single nucleotide polymorphism (SNP) in the 3′ splice site of P2rx5 exon 10 is present in almost the entire European population but not in African populations [43]. This SNP results in a truncated dysfunctional protein [44], questioning from a European perspective to what extent P2X5 regulates human physiology. On the other hand, recent studies show that human populations that lived in extreme cold conditions have a number of genetic variants, e.g., in UCP1, tribbles pseudo-kinase 2 or beta-3-adrenergic receptor, that are associated with leanness and higher basal BAT thermogenesis [45]. Future studies are needed to investigate whether expression of the functional human P2X5 protein would result in reduced BAT activity and if it may explain the lower basal metabolic rates described for populations with African ancestry.
In conclusion, we report here that extracellular ATP could directly modulate thermogenic gene expression and systemic glucose metabolism via P2X5 expressed by brown adipocytes. In whole-body and brown adipocyte-specific knockout mice, P2X5 has no effect on energy expenditure.

4. Materials and Methods

4.1. Mice

All experiments were approved by the Behörde für Gesundheit und Verbraucherschutz, Hamburg (N082/2020). Mice were housed in the animal facility of the UKE at a 12 h light/12 h dark cycle with access to food and water ad libitum. Wild type mice (C57BL/6) were purchased from Charles River or bred in-house. P2rx5 knockout mice (C57BL/6N-P2rx5 <tm1a(EUCOMM)Hmgu>/Ieg) were obtained from the European Mouse Mutant Archive (EMMA), Institute of Experimental Genetics, Helmholtz Zentrum, München (EMMA strain ID: EM:09185). To generate P2rx5tm1c mice with a floxed exon 2 in the P2rx5 gene, P2rx5 <tm1a(EUCOMM)Hmgu>/Ieg mice were bred with flippase (Flp)-expressing mice, deleting the FRT-flanked LacZ cassette. For the generation of a brown adipocyte-specific P2rx5 knockout mouse model, these mice were then crossed with B6.FVB-Tg(Ucp1-Cre)1Evdr mice that were expressing the Cre-recombinase under the control of the UCP1 promotor (Jackson Laboratories stock #024670, Bar Harbor, ME, USA). For high-fat diet (HFD) feeding, the mice were fed for 16 weeks (D14010701; ResearchDiets, Inc., New Brunswick, NJ, USA). For organ harvest and blood collection, the mice were anesthetized by ketamine (180 mg/kg) and xylazine (24 mg/kg) injection after 4 h fasting.

4.2. Isolation of Adipocytes, Tissue-Resident Macrophages and Endothelial Cells

Isolation of cell type fractions from interscapular BAT was performed by magnetic-activated cell sorting (MACS®), as described previously [36]. Briefly, a pool of BAT derived from 4 mice was digested for 45 min using a buffer containing 1.5 U/mL collagenase D and 2.4 U/mL dispase II. The obtained cell suspension was passed through a 100 µm cell strainer and pelleted by centrifugation (5 min, 600× g). To harvest mature brown adipocytes (mA), the floating fraction was collected. The pellet was resuspended in PBS-based buffer containing 2 mM EDTA, 0.5% BSA, and 2 mM glucose. The sample was filtered through a 40 µm cell strainer, centrifuged (5 min, 600× g), and the remaining cell pellet resuspended. To isolate the macrophage fraction, the sample was incubated with CD11b microbeads (Miltenyi, 10 µL beads/107 cells, Auburn, CA, USA) for 15 min. The CD11b+-fraction was separated using magnetic LS columns (Miltenyi). For endothelial cell isolation, remaining flow through was incubated with CD31 microbeads (Miltenyi). The obtained cell pellets of each fraction were dissolved in TRIzol® for RNA isolation.

4.3. Gene Expression Analysis

For RNA isolation from whole-tissue samples, BAT cell fractions, or adipocyte cell cultures, TRIzol® reagent and a NucleoSpin RNAII kit (Macherey & Nagel, Düren, Germany) were used according to the manufacturer’s instructions. A NanoPhotometer® N60 spectrophotometer (IMPLEN, Munich, Germany) was used to determine RNA concentrations. Afterwards, 400 ng of RNA was transcribed into cDNA (High-Capacity cDNA Reverse Transcription Kit, Applied Biosystems, Waltham, MA, USA) following the company’s protocol. Quantitative real-time RT-PCR was performed on a QuantStudio 5 Real-Time-PCR System (ThermoFischer Scientific, Waltham, MA, USA). For this purpose the following TaqMan® Assay-on-Demand primer sets were used: mCox4i1 (Mm00438289_g1), mCox7a (Mm00438297_g1), mCox8b (Mm00432648_m1), mGlut1 (Mm00441480_m1), mGlut4 (Mm01245502_m1), mP2rx1 (Mm00435460_m1), mP2rx2 (Mm00462952_m1), mP2rx3 (Mm00523699_m1), mP2rx4 (Mm00501787_m1), mP2rx5 (Mm00473677_m1/Mm01242356_m1), mP2rx6 (Mm00440591_m1), mP2rx7 (Mm01199500_m1), mPpargc1a (Mm00447183_m1), mPrdm16 (Mm00712556_m1), mTbp (Mm00446973_m1), and mUcp1 (Mm00494069_m1). Gene expression data obtained by qRT-PCR was either shown as copy number or as a relative comparison of the different groups. Copy numbers were calculated according to standard equations (copy number = 10ct-intercept/slope) using qPCR device-specific constants. The obtained copy numbers were displayed as a normalized virtual quantity by dividing them by the housekeeper’s copy number and multiplying by a factor of 104. Relative mRNA expression was normalized to mTbp (TATA-box binding protein) as housekeeper and calculated via the ΔΔCT method. The P2rx5 mRNA levels of the global knockout can be considered to be neglectable. However, the TaqMan probe used for analysis of the global knockout detected P2rx5 expression with a high CT value. This can be explained as the TaqMan probe detected P2rx5 at exon10/11, which suggests that an unstable P2rx5 mRNA lacking exon 2 is expressed at a very low level.

4.4. Glucose Uptake Studies

For the oral glucose tolerance test (OGTT), mice received a glucose gavage containing 2 mg/g body weight glucose. To determine glucose uptake into organs, the gavage solution was traced with radiolabelled 3H-deoxyglucose (1.7 kBq/g body weight). At different time points (0, 15, 30, 60, and 120 min) after gavage, blood glucose concentrations were measured in blood taken from the tail vein using AccuCheck Aviva glucose sticks (Roche, Basel, Switzerland). After OGTT, mice were anesthetized and transcardially perfused with phosphate-buffered saline containing 10 U/mL heparin. Harvested tissues were dissolved in SolvableTM and radioactivities were determined using liquid scintillation counting (Tricarb, Perkin Elmer, Shelton, CT, USA).

4.5. Insulin Tolerance Test

For the insulin tolerance test (ITT), mice received an insulin injection (i.p.; 1 U/kg body weight) after 4 h of fasting. Blood glucose levels were determined in tail blood at different time points (0, 5, 15, 30, and 60 min) after injection.

4.6. Indirect Calorimetry

For indirect calorimetry, mice were kept in metabolic cages (Promethion®, Sable Systems, Las Vegas, NV, USA) and exposed to various ambient temperatures (as indicated). Here, the housing temperature was either decreased stepwise (6 °C per day) starting at thermoneutrality (30 °C) down to 6 °C or decreased every second day from thermoneutrality (30 °C) to 22 °C and 6 °C. Oxygen consumption and carbon dioxide production were monitored continuously. Analysis of the obtained data files was performed according to the manufacturer (Sable Systems) using the Macro interpreter software (v2.41).

4.7. Plasma Parameters

Lipid levels in plasma samples (cholesterol, triacylglycerides, and non-esterified fatty acids) were determined by enzymatic-colorimetric assays (cholesterol/triglyceride: Roche; non-esterified fatty acids: FUJIFILM Wako Chemicals Europe GMBH, Neuss, Germany) according to the manufacturer’s instructions. Insulin levels in the plasma samples were detected by ELISA (Crystal Chem, Elk Grove, IL, USA) according to the manufacturer’s protocol.

4.8. Cell Culture and siRNA-Mediated Knockdown

Primary brown adipocytes were obtained by isolation of the stromal-vascular fractions (SVF) from the BAT of wild type mice (C57BL/6J, male, age 4–6 weeks), as described previously [36]. For differentiation to mature adipocytes, SVF-derived cells were cultured in DMEM/high glucose GlutaMAX (Gibco, Grand Island, NY, USA) supplemented with 10% neonatal calf serum, 1% penicillin and streptomycin, 1% antibiotic-antimycotic, 2.4 nM of insulin, and 1 µM of rosiglitazone (Cayman Chemicals, Ann Arbor, MI, USA).
For immortalized brown adipocyte cell culture, precursor cells (WT1; [46]) were cultured in DMEM/high glucose supplemented with 10% FBS (Gibco) and 1% penicillin and streptomycin (maintenance media). Differentiation was induced two days post confluency by changing to differentiation media (DMEM/high glucose supplemented with 10% FBS (Gibco), 1% penicillin and streptomycin, 10 µg/mL insulin (Sigma, St. Louis, MO, USA), 1 µM IBMX (Sigma), 1 µM dexamethasone (Sigma), 1 µM rosiglitazone (Cayman Chemicals), 1 nM T3 (Sigma), and 50 µM indomethacine (Sigma)). At day 2 of differentiation, culture media was changed to maintenance media containing 10 µg/mL insulin, 1 µM rosiglitazone, and 1 nM T3. At day 4 of differentiation, cells received maintenance media supplemented with 10 µg/mL insulin. Media was changed to a regular maintenance medium at day 6.
siRNA-mediated knockdown of P2rx5 was induced by incubating primary or immortalized brown adipocytes with either anti-P2rx5 Silencer® Select siRNA (Assay ID: s206955; ThermoFisher Scientific) or Silencer® Negative Control #1 siRNA (AM4611, Invitrogen). For the siRNA transfection, Lipofectamine® RNAiMAX Reagent (13778, ThermoFisher) was used according to manufacturer’s instructions. In brief, siRNA stocks were diluted in OptiMEM® Medium (Gibco) to obtain a final concentration of 100 pmol/mL. Lipofectamine® RNAiMAX Reagent was diluted in OptiMEM® Medium, as described by the company. Diluted siRNA was added to the diluted Lipofectamine® RNAiMAX Reagent in a 1:1 ratio. After 5 min of incubation, the mix was added dropwise to the cells. Cells were harvested in Trizol® after 48 h of siRNA-mediated knockdown.

4.9. Western Blotting

Lysis of snap-frozen brown adipose tissue was performed in a RIPA buffer containing protease inhibitors (Complete Mini protease inhibitor cocktail; Roche), 0,1% SDS, and phosphatase inhibitors (1% phosphatase inhibitor A + B; bimake) using the TissueLyser (Qiagen, Hilden, Germany). Protein samples (20 µg) were separated on 10% and 12.5% acrylamide SDS-PAGE gels. After Western blot transfer, the nitrocellulose membranes were blocked in 5-milk in TBS-T (20 mM Tris, 150 mM NaCl, 0.1% (v/v) Tween 20) for 1 h. Incubation with primary antibodies (diluted in 5% BSA in TBS-T) was performed overnight at 4 °C. Afterwards, the membranes were washed with TBS-T and incubated with secondary HRP-conjugated antibodies (1:5000) for 1 h. Used primary antibodies were as follows: rabbit-anti-gTubulin (1:2000; Abcam #ab179503, Cambridge, UK; RRID: N/A), mouse-anti-OXPHOS (1:20,000; Abcam #ab110413; RRID:AB_2629281), and mouse-anti UCP1 (1:2500; R&D MAB6158; RRID:AB_10572490). Used secondary antibodies were as follows: Peroxidase-conjugated AffiniPure goat-anti-mouse IgG (H + L) (1:5000; Jackson ImmunoResearch #115-035-003, Philadelphia, PA, USA; RRID:AB_10015289) and Peroxidase-conjugated AffiniPure goat-anti-rabbit IgG (H + L) (1:5000; Jackson ImmunoResearch #111-035-144; RRID:AB_ 2307391). Enhanced chemiluminescence was detected using an Amersham Imager 600 (GE Healthcare, Chicago, IL, USA). For Signal quantification, ImageStudio Lite 5.2 (Licor, Lincoln, NE, USA; RRID:SCR_013715) was used.

4.10. Immunofluorescence Staining

Primary brown adipocytes were fixed with 4% paraformaldehyde and permeabilized with 0.2% TritonX100 in PBS. Afterwards, cells were blocked with 3% BSA in PBS and incubated with a polyclonal serum of rats immunized with murine P2X5 diluted in blocking buffer overnight at 4 °C. Secondary antibody incubation was performed for 2 h at room temperature using Cy5-donkey-anti-rat (1:300; Jackson ImmunoResearch Labs #712-175-153, RRID:AB_2340672). DAPI staining was performed during the subsequent mounting process by using ROTI®Mount FluorCare DAPI (ROTH, Karlsruhe, Germany).
For whole-mount immunofluorescent staining, the BAT was fixed with 4% paraformaldehyde and cut into small pieces. The tissue was washed three times with PBS, then immersed in 5% glycine for 45 min to quench autofluorescence. After blocking and permeabilization for 2 h using 3% BSA, 0.3% Triton X100, and 0.1% sodium citrate in PBS, the tissues were incubated with the above-mentioned polyclonal serum of rats immunized with murine P2X5 diluted in blocking buffer over night at 4 °C. Subsequently, the tissue pieces were washed three times with PBS and incubated with either a secondary Alexa Fluor® 488-donkey-anti-rat or Cy3-donkey-anti-rat (1:300; Jackson ImmunoResearch Labs #712-546-153/#712-165-153, RRID:AB_2340686/RRID:AB_2340667) for 2 h at room temperature. Afterwards, tissues were washed three times with PBS and nuclei were stained using DAPI. For imaging, BAT pieces were transferred to dishes with a glass bottom and visualized using a NikonA1 Ti confocal microscope (Tokyo, Japan).

4.11. Quantification and Statistics

Data are expressed as mean ± S.E.M. Two groups were compared by an unpaired, two-tailed Student’s t-test, and more than two groups were compared by ANOVA. The statistical parameters such as p values and numbers of replicates are presented in the figure legends. Statistical analysis and presentation of data were conducted using Microsoft Excel 2016 (RRID:SCR_016137) and GraphPadPrism 9.0 (RRID:SCR_002798).

Supplementary Materials

The following supporting information can be downloaded at: https://www.mdpi.com/article/10.3390/ijms26136474/s1.

Author Contributions

Conceptualization, M.Y.J., F.K.-N. and J.H.; methodology, M.Y.J. and J.H.; investigation, M.Y.J., L.M., J.B., T.S., B.-P.D. and M.H.; resources, F.K.-N.; writing—original draft preparation, M.Y.J. and J.H.; supervision, J.H.; funding acquisition, F.K.-N., B.-P.D. and J.H. All authors have read and agreed to the published version of the manuscript.

Funding

This research was funded by the DFG-funded research consortia SFB1328, project-ID: 335447717 to J.H., B.P.D., and F.K.N.

Institutional Review Board Statement

The animal study protocol was approved by the Institutional Review Board “Behörde für Gesundheit und Verbraucherschutz Hamburg” (N082/2020, date of approval 21 October 2020).

Informed Consent Statement

Not applicable.

Data Availability Statement

Data is contained within the article and Supplementary Materials.

Acknowledgments

We acknowledge the excellent technical support of Jennifer Brieger.

Conflicts of Interest

The authors declare no conflicts of interest. The funders had no role in the design of the study; in the collection, analyses, or interpretation of data; in the writing of the manuscript; or in the decision to publish the results.

Abbreviations

The following abbreviations are used in this manuscript:
ATPAdenosine triphosphate
BATBrown adipose tissue
DOGDeoxyglucose
WATWhite adipose tissue
SVFStromal-vascular fractions
UCP1Uncoupling protein 1

References

  1. Gregor, M.F.; Hotamisligil, G.S. Inflammatory mechanisms in obesity. Annu. Rev. Immunol. 2011, 29, 415–445. [Google Scholar] [CrossRef]
  2. Hotamisligil, G.S. Inflammation, metaflammation and immunometabolic disorders. Nature 2017, 542, 177–185. [Google Scholar] [CrossRef]
  3. Bartelt, A.; Heeren, J. Adipose tissue browning and metabolic health. Nat. Rev. Endocrinol. 2014, 10, 24–36. [Google Scholar] [CrossRef]
  4. Chondronikola, M.; Volpi, E.; Borsheim, E.; Porter, C.; Annamalai, P.; Enerback, S.; Lidell, M.E.; Saraf, M.K.; Labbe, S.M.; Hurren, N.M.; et al. Brown adipose tissue improves whole-body glucose homeostasis and insulin sensitivity in humans. Diabetes 2014, 63, 4089–4099. [Google Scholar] [CrossRef]
  5. Chondronikola, M.; Volpi, E.; Borsheim, E.; Porter, C.; Saraf, M.K.; Annamalai, P.; Yfanti, C.; Chao, T.; Wong, D.; Shinoda, K.; et al. Brown Adipose Tissue Activation Is Linked to Distinct Systemic Effects on Lipid Metabolism in Humans. Cell Metab. 2016, 23, 1200–1206. [Google Scholar] [CrossRef]
  6. Yoneshiro, T.; Aita, S.; Matsushita, M.; Kayahara, T.; Kameya, T.; Kawai, Y.; Iwanaga, T.; Saito, M. Recruited brown adipose tissue as an antiobesity agent in humans. J. Clin. Investig. 2013, 123, 3404–3408. [Google Scholar] [CrossRef]
  7. Bartelt, A.; Bruns, O.T.; Reimer, R.; Hohenberg, H.; Ittrich, H.; Peldschus, K.; Kaul, M.G.; Tromsdorf, U.I.; Weller, H.; Waurisch, C.; et al. Brown adipose tissue activity controls triglyceride clearance. Nat. Med. 2011, 17, 200–205. [Google Scholar] [CrossRef]
  8. Heine, M.; Fischer, A.W.; Schlein, C.; Jung, C.; Straub, L.G.; Gottschling, K.; Mangels, N.; Yuan, Y.; Nilsson, S.K.; Liebscher, G.; et al. Lipolysis Triggers a Systemic Insulin Response Essential for Efficient Energy Replenishment of Activated Brown Adipose Tissue in Mice. Cell Metab. 2018, 28, 644-655.e4. [Google Scholar] [CrossRef]
  9. Khedoe, P.P.; Hoeke, G.; Kooijman, S.; Dijk, W.; Buijs, J.T.; Kersten, S.; Havekes, L.M.; Hiemstra, P.S.; Berbee, J.F.; Boon, M.R.; et al. Brown adipose tissue takes up plasma triglycerides mostly after lipolysis. J. Lipid Res. 2015, 56, 51–59. [Google Scholar] [CrossRef]
  10. Gavalda-Navarro, A.; Villarroya, J.; Cereijo, R.; Giralt, M.; Villarroya, F. The endocrine role of brown adipose tissue: An update on actors and actions. Rev. Endocr. Metab. Disord. 2022, 23, 31–41. [Google Scholar] [CrossRef]
  11. Scheele, C.; Wolfrum, C. Brown Adipose Crosstalk in Tissue Plasticity and Human Metabolism. Endocr. Rev. 2020, 41, 53–65. [Google Scholar] [CrossRef]
  12. Villarroya, J.; Cereijo, R.; Gavalda-Navarro, A.; Peyrou, M.; Giralt, M.; Villarroya, F. New insights into the secretory functions of brown adipose tissue. J. Endocrinol. 2019, 243, R19–R27. [Google Scholar] [CrossRef]
  13. Scheja, L.; Heeren, J. The endocrine function of adipose tissues in health and cardiometabolic disease. Nat. Rev. Endocrinol. 2019, 15, 507–524. [Google Scholar] [CrossRef]
  14. Cheng, L.; Wang, J.; Dai, H.; Duan, Y.; An, Y.; Shi, L.; Lv, Y.; Li, H.; Wang, C.; Ma, Q.; et al. Brown and beige adipose tissue: A novel therapeutic strategy for obesity and type 2 diabetes mellitus. Adipocyte 2021, 10, 48–65. [Google Scholar] [CrossRef]
  15. Ghesmati, Z.; Rashid, M.; Fayezi, S.; Gieseler, F.; Alizadeh, E.; Darabi, M. An update on the secretory functions of brown, white, and beige adipose tissue: Towards therapeutic applications. Rev. Endocr. Metab. Disord. 2024, 25, 279–308. [Google Scholar] [CrossRef]
  16. Sharma, A.K.; Khandelwal, R.; Wolfrum, C. Futile cycles: Emerging utility from apparent futility. Cell Metab. 2024, 36, 1184–1203. [Google Scholar] [CrossRef]
  17. Razzoli, M.; Frontini, A.; Gurney, A.; Mondini, E.; Cubuk, C.; Katz, L.S.; Cero, C.; Bolan, P.J.; Dopazo, J.; Vidal-Puig, A.; et al. Stress-induced activation of brown adipose tissue prevents obesity in conditions of low adaptive thermogenesis. Mol. Metab. 2016, 5, 19–33. [Google Scholar] [CrossRef]
  18. Gnad, T.; Scheibler, S.; von Kugelgen, I.; Scheele, C.; Kilic, A.; Glode, A.; Hoffmann, L.S.; Reverte-Salisa, L.; Horn, P.; Mutlu, S.; et al. Adenosine activates brown adipose tissue and recruits beige adipocytes via A2A receptors. Nature 2014, 516, 395–399. [Google Scholar] [CrossRef]
  19. Sneddon, P.; Westfall, D.P. Pharmacological evidence that adenosine triphosphate and noradrenaline are co-transmitters in the guinea-pig vas deferens. J. Physiol. 1984, 347, 561–580. [Google Scholar] [CrossRef]
  20. Vizi, E.S.; Burnstock, G. Origin of ATP release in the rat vas deferens: Concomitant measurement of [3H]noradrenaline and [14C]ATP. Eur. J. Pharmacol. 1988, 158, 69–77. [Google Scholar] [CrossRef]
  21. Fliegert, R.; Heeren, J.; Koch-Nolte, F.; Nikolaev, V.O.; Lohr, C.; Meier, C.; Guse, A.H. Adenine nucleotides as paracrine mediators and intracellular second messengers in immunity and inflammation. Biochem. Soc. Trans. 2019, 47, 329–337. [Google Scholar] [CrossRef]
  22. Linden, J.; Koch-Nolte, F.; Dahl, G. Purine Release, Metabolism, and Signaling in the Inflammatory Response. Annu. Rev. Immunol. 2019, 37, 325–347. [Google Scholar] [CrossRef]
  23. Burnstock, G. P2X ion channel receptors and inflammation. Purinergic Signal 2016, 12, 59–67. [Google Scholar] [CrossRef]
  24. North, R.A. Molecular physiology of P2X receptors. Physiol. Rev. 2002, 82, 1013–1067. [Google Scholar] [CrossRef]
  25. North, R.A. P2X receptors. Philos. Trans. R. Soc. Lond. B Biol. Sci. 2016, 371, 20150427. [Google Scholar] [CrossRef]
  26. Tian, T.; Heine, M.; Evangelakos, I.; Jaeckstein, M.Y.; Schaltenberg, N.; Stahler, T.; Koch-Nolte, F.; Kumari, M.; Heeren, J. The P2X7 ion channel is dispensable for energy and metabolic homeostasis of white and brown adipose tissues. Purinergic Signal 2020, 16, 529–542. [Google Scholar] [CrossRef]
  27. Ussar, S.; Lee, K.Y.; Dankel, S.N.; Boucher, J.; Haering, M.F.; Kleinridders, A.; Thomou, T.; Xue, R.; Macotela, Y.; Cypess, A.M.; et al. ASC-1, PAT2, and P2RX5 are cell surface markers for white, beige, and brown adipocytes. Sci. Transl. Med. 2014, 6, 247ra103. [Google Scholar] [CrossRef]
  28. Le, K.T.; Boue-Grabot, E.; Archambault, V.; Seguela, P. Functional and biochemical evidence for heteromeric ATP-gated channels composed of P2X1 and P2X5 subunits. J. Biol. Chem. 1999, 274, 15415–15419. [Google Scholar] [CrossRef]
  29. Torres, G.E.; Egan, T.M.; Voigt, M.M. Hetero-oligomeric assembly of P2X receptor subunits. Specificities exist with regard to possible partners. J. Biol. Chem. 1999, 274, 6653–6659. [Google Scholar] [CrossRef]
  30. Adamson, S.E.; Meher, A.K.; Chiu, Y.H.; Sandilos, J.K.; Oberholtzer, N.P.; Walker, N.N.; Hargett, S.R.; Seaman, S.A.; Peirce-Cottler, S.M.; Isakson, B.E.; et al. Pannexin 1 is required for full activation of insulin-stimulated glucose uptake in adipocytes. Mol. Metab. 2015, 4, 610–618. [Google Scholar] [CrossRef]
  31. Svensson, K.J.; Long, J.Z.; Jedrychowski, M.P.; Cohen, P.; Lo, J.C.; Serag, S.; Kir, S.; Shinoda, K.; Tartaglia, J.A.; Rao, R.R.; et al. A Secreted Slit2 Fragment Regulates Adipose Tissue Thermogenesis and Metabolic Function. Cell Metab. 2016, 23, 454–466. [Google Scholar] [CrossRef]
  32. Lynes, M.D.; Leiria, L.O.; Lundh, M.; Bartelt, A.; Shamsi, F.; Huang, T.L.; Takahashi, H.; Hirshman, M.F.; Schlein, C.; Lee, A.; et al. The cold-induced lipokine 12,13-diHOME promotes fatty acid transport into brown adipose tissue. Nat. Med. 2017, 23, 631–637. [Google Scholar] [CrossRef]
  33. Tozzi, M.; Novak, I. Purinergic Receptors in Adipose Tissue As Potential Targets in Metabolic Disorders. Front. Pharmacol. 2017, 8, 878. [Google Scholar] [CrossRef]
  34. Gnad, T.; Navarro, G.; Lahesmaa, M.; Reverte-Salisa, L.; Copperi, F.; Cordomi, A.; Naumann, J.; Hochhauser, A.; Haufs-Brusberg, S.; Wenzel, D.; et al. Adenosine/A2B Receptor Signaling Ameliorates the Effects of Aging and Counteracts Obesity. Cell Metab. 2020, 32, 56-70.e7. [Google Scholar] [CrossRef]
  35. Niemann, B.; Haufs-Brusberg, S.; Puetz, L.; Feickert, M.; Jaeckstein, M.Y.; Hoffmann, A.; Zurkovic, J.; Heine, M.; Trautmann, E.M.; Muller, C.E.; et al. Apoptotic brown adipocytes enhance energy expenditure via extracellular inosine. Nature 2022, 609, 361–368. [Google Scholar] [CrossRef]
  36. Jaeckstein, M.Y.; Schulze, I.; Zajac, M.W.; Heine, M.; Mann, O.; Pfeifer, A.; Heeren, J. CD73-dependent generation of extracellular adenosine by vascular endothelial cells modulates de novo lipogenesis in adipose tissue. Front. Immunol. 2023, 14, 1308456. [Google Scholar] [CrossRef]
  37. Razzoli, M.; McGonigle, S.; Sahu, B.S.; Rodriguez, P.; Svedberg, D.; Rao, L.; Ruocco, C.; Nisoli, E.; Vezzani, B.; Frontini, A.; et al. A key role for P2RX5 in brown adipocyte differentiation and energy homeostasis. Adipocyte 2024, 13, 2421745. [Google Scholar] [CrossRef]
  38. Bo, X.; Jiang, L.H.; Wilson, H.L.; Kim, M.; Burnstock, G.; Surprenant, A.; North, R.A. Pharmacological and biophysical properties of the human P2X5 receptor. Mol. Pharmacol. 2003, 63, 1407–1416. [Google Scholar] [CrossRef]
  39. Chen, Y.; Zeng, X.; Huang, X.; Serag, S.; Woolf, C.J.; Spiegelman, B.M. Crosstalk between KCNK3-Mediated Ion Current and Adrenergic Signaling Regulates Adipose Thermogenesis and Obesity. Cell 2017, 171, 836-848.e13. [Google Scholar] [CrossRef]
  40. Sun, W.; Luo, Y.; Zhang, F.; Tang, S.; Zhu, T. Involvement of TRP Channels in Adipocyte Thermogenesis: An Update. Front. Cell Dev. Biol. 2021, 9, 686173. [Google Scholar] [CrossRef]
  41. Sun, W.; Uchida, K.; Suzuki, Y.; Zhou, Y.; Kim, M.; Takayama, Y.; Takahashi, N.; Goto, T.; Wakabayashi, S.; Kawada, T.; et al. Lack of TRPV2 impairs thermogenesis in mouse brown adipose tissue. EMBO Rep. 2016, 17, 383–399. [Google Scholar] [CrossRef]
  42. Benzi, A.; Heine, M.; Spinelli, S.; Salis, A.; Worthmann, A.; Diercks, B.; Astigiano, C.; Perez Mato, R.; Memushaj, A.; Sturla, L.; et al. The TRPM2 ion channel regulates metabolic and thermogenic adaptations in adipose tissue of cold-exposed mice. Front. Endocrinol. 2024, 14, 1251351. [Google Scholar] [CrossRef]
  43. King, B.F. Rehabilitation of the P2X5 receptor: A re-evaluation of structure and function. Purinergic Signal 2023, 19, 421–439. [Google Scholar] [CrossRef]
  44. Duckwitz, W.; Hausmann, R.; Aschrafi, A.; Schmalzing, G. P2X5 subunit assembly requires scaffolding by the second transmembrane domain and a conserved aspartate. J. Biol. Chem. 2006, 281, 39561–39572. [Google Scholar] [CrossRef]
  45. Sellayah, D. The Impact of Early Human Migration on Brown Adipose Tissue Evolution and Its Relevance to the Modern Obesity Pandemic. J. Endocr. Soc. 2019, 3, 372–386. [Google Scholar] [CrossRef]
  46. Klein, J.; Fasshauer, M.; Ito, M.; Lowell, B.B.; Benito, M.; Kahn, C.R. Beta(3)-Adrenergic stimulation differentially inhibits insulin signaling and decreases insulin-induced glucose uptake in brown adipocytes. J. Biol. Chem. 1999, 274, 34795–34802. [Google Scholar] [CrossRef]
Figure 1. P2rx5 is highly expressed by mature brown adipocytes. (a) Cell type-specific gene expression of the purinergic P2X receptors (P2rx1, P2rx2, P2rx3, P2rx4, P2rx5, P2rx6, P2rx7) in mature brown adipocytes (mA), CD11b+ myeloid cells, and CD31+ endothelial cells isolated from murine brown adipose tissue (BAT) using magnetic-activated cell sorting (MACS) (n = 4); (b) gene expression of P2rx1, P2rx2, P2rx3, P2rx4, P2rx5, P2rx6, and P2rx7 during the differentiation of stromal-vascular cell (SVC)-derived brown adipocytes (n = 4); (c) P2X5 staining in primary brown adipocytes. Red, P2X5; blue, DAPI. Scale bar: 50 µm. Data are presented as mean values ± SEM. (a) A one-way ANOVA followed by Tukey’s multiple comparisons test comparing cell fractions with each other was performed. Different letters denote significant differences between cell fractions. (b) A one-way ANOVA followed by Dunnett’s multiple comparisons test comparing the different days of differentiation to day 0. In the table, significant differences are indicated by asterisks (* p < 0.05, ** p < 0.01, *** p < 0.001).
Ijms 26 06474 g001
Figure 2. P2rx5 deficiency resulted in lower expression of thermogenic markers in BAT. (ag) P2rx5 knockout mice (P2rx5−/−), heterozygous (P2rx5+/−), and controls (P2rx5+/+) were housed at 22 °C. (a) Gene expression of P2rx5 in BAT and inguinal white adipose tissue (iWAT) (n = 3). (b) Whole-mount staining of P2X5 in BAT of P2rx5−/− and P2rx5+/+ mice. Green, P2X5; blue, DAPI. Scale bar: 50 µm. (c) Adipose tissue weights, (d) plasma triglycerides, (e) plasma non-esterified fatty acids (NEFAs), and (f) plasma cholesterol levels of P2rx5 knockout mice (P2rx5−/−), heterozygous (P2rx5+/−), and controls (P2rx5+/+) (n = 7). (g) Gene expression of thermogenic marker genes in BAT of P2rx5−/−, P2rx5+/−, and P2rx5+/+ mice housed at 22 °C (n = 7). Data are presented as mean values ± SEM. A one-way ANOVA followed by Tukey’s multiple comparisons test comparing wild type, heterozygous, and homozygous P2rx5 knockout mice was performed. Different letters denote significant differences.
Ijms 26 06474 g002
Figure 3. P2rx5 deficiency improves glucose disposal by BAT. (ab,dg) P2rx5 knockout mice (P2rx5−/−), and controls (P2rx5+/+) were housed at 22 °C. (a) Western blot analysis of UCP1, respiratory chain (OXPHOS) complexes, and g-Tubulin in BAT as well as (b) quantification of proteins shown in (a) (n = 7). (c) Energy expenditure in P2rx5+/+ and P2rx5−/− mice housed at indicated environmental temperatures (30 °C, 24 °C, 18 °C, 12 °C, and 6 °C with a stepwise decrease in temperature every 24 h) in metabolic chambers (n = 6). (d) Plasma insulin levels of P2rx5+/+ and P2rx5−/− mice (n = 7). (e) Blood glucose levels during insulin tolerance test (n = 12) and (f) blood glucose levels during oral glucose tolerance test (n = 12–13) of P2rx5+/+ and P2rx5−/− mice. (g) Uptake of 3H-deoxyglucose (DOG) into interscapular BAT (iBAT), inguinal WAT (iWAT), gonadal WAT (gWAT), heart, muscle, kidney, spleen, and liver (n = 12–13). Data are presented as mean values ± SEM. * p < 0.05, ** p < 0.01, and *** p < 0.001 by Student’s t test.
Ijms 26 06474 g003
Figure 4. Brown adipocyte-specific P2rx5 deletion resulted in lower Ucp1 expression. (ag) Brown adipocyte-specific P2rx5-deficient mice (P2rx5fl/fl-Ucp1Cre+) and P2rx5fl/fl-Ucp1Cre− mice were housed at 22 °C. (a) Gene expression of P2rx5 in BAT, inguinal WAT (iWAT), gonadal WAT (gWAT), heart, muscle, kidney, spleen, pancreas, and liver of the P2rx5fl/fl-Ucp1Cre model (n = 4–5). (b) Whole-mount staining of P2X5 in BAT of P2rx5fl/fl-Ucp1Cre+ and P2rx5fl/fl-Ucp1Cre− mice. Green, P2X5; blue, DAPI. Scale bar: 50 µm. (c) Adipose tissue weights, (d) plasma triglycerides, (e) plasma non-esterified fatty acids (NEFAs), and (f) plasma cholesterol levels of P2rx5fl/fl-Ucp1Cre+ and P2rx5fl/fl-Ucp1Cre− mice (n = 4–7). (g) BAT gene expression of thermogenic marker genes in P2rx5fl/fl-Ucp1Cre+ and P2rx5fl/fl-Ucp1Cre− mice housed at 22 °C (n = 4–7). (h,i) siRNA-mediated knockdown of P2rx5 was induced in primary stromal-vascular cell (SVC)-derived brown adipocytes and in immortalized brown adipocytes for 48 h. (h) Gene expression of P2rx5 and Ucp1 in primary SVC-derived (n = 9, knockdown 74%) or (i) immortalized pre-adipocytes (n = 6, knockdown 60%) differentiated to mature brown adipocytes. Data are presented as mean values ± SEM. * p < 0.05, ** p < 0.01, and *** p < 0.001 by Student’s t test.
Ijms 26 06474 g004
Figure 5. Brown adipocyte-specific P2rx5 deletion impaired glucose tolerance. (a,b,d,e) Brown adipocyte specific P2rx5-deficient mice (P2rx5fl/fl-Ucp1Cre+) and P2rx5fl/fl-Ucp1Cre− mice were housed at 22 °C. (a) Western blot analysis of BAT and (b) quantification of proteins shown in (a) (n = 4–5). (c) Energy expenditure in P2rx5fl/fl-Ucp1Cre+ and P2rx5fl/fl-Ucp1Cre− mice housed at indicated environmental temperatures in metabolic chambers. Here, ambient temperature was decreased every other day starting at thermoneutrality (30 °C) to mild cold exposure (22 °C) and cold exposure (6 °C) (n = 3). (d) Plasma insulin levels in P2rx5fl/fl-Ucp1Cre+ and P2rx5fl/fl-Ucp1Cre− mice. (e) Blood glucose levels during oral glucose tolerance tests in P2rx5fl/fl-Ucp1Cre+ and P2rx5fl/fl-Ucp1Cre− mice (n = 6). Data are presented as mean values ± SEM. * p < 0.05, and *** p < 0.001 by Student’s t test.
Ijms 26 06474 g005
Figure 6. Brown adipocyte-specific P2rx5 deficiency impaired glucose tolerance and uptake into the BAT of diet-induced obese mice. (ai) Brown adipocyte-specific P2rx5 deficient mice (P2rx5fl/fl-Ucp1Cre+) and P2rx5fl/fl-Ucp1Cre− mice were fed a high-fat diet (HFD) for 16 weeks. (a) Body weights of P2rx5fl/fl-Ucp1Cre+ and P2rx5fl/fl-Ucp1Cre− mice during the HFD feeding period (n = 9–10). (b) Adipose tissue weights, (c) plasma triglycerides, (d) plasma non-esterified fatty acids (NEFAs), and (e) plasma cholesterol levels of P2rx5fl/fl-Ucp1Cre+ and P2rx5fl/fl-Ucp1Cre− mice (n = 8–9). (f) BAT gene expression (n = 8–9). (g) Blood glucose levels during the oral glucose tolerance test (OGTT) (n = 8–9). (h) Plasma insulin levels of P2rx5fl/fl-Ucp1Cre+ and P2rx5fl/fl-Ucp1Cre− mice (n = 8–9). (i) Uptake of 3H-deoxyglucose (DOG) per total organ into interscapular BAT (iBAT), inguinal WAT (iWAT), gonadal WAT (gWAT), heart, muscle, kidney, spleen, and liver (n = 6–9). Data are presented as mean values ± SEM. * p < 0.05 by Student’s t test.
Ijms 26 06474 g006
Disclaimer/Publisher’s Note: The statements, opinions and data contained in all publications are solely those of the individual author(s) and contributor(s) and not of MDPI and/or the editor(s). MDPI and/or the editor(s) disclaim responsibility for any injury to people or property resulting from any ideas, methods, instructions or products referred to in the content.

